A High-Resolution Terahertz Electric Field Sensor Using a Corrugated Liquid Crystal Waveguide


1
Key Lab of In-Fiber Integrated Optics, Ministry Education of China, Harbin Engineering University, Harbin 150001, China
2
Academy of Marine Information Technology, Guilin University of Electronic Technology, Beihai 536000, China
*
Authors to whom correspondence should be addressed.
Crystals 2019, 9(6), 302; https://0-doi-org.brum.beds.ac.uk/10.3390/cryst9060302
Submission received: 28 May 2019
/
Revised: 8 June 2019
/
Accepted: 10 June 2019
/
Published: 12 June 2019
(This article belongs to the Special Issue Liquid Crystal Optics and Physics: Recent Advances and Prospects)
Abstract
:Liquid crystals (LCs) can always reflect variable optical properties in a broad terahertz (THz) band under external electric or magnetic fields. Based on the measurements of these varying properties, we can realize electric and magnetic field sensing with very high sensitivity. Here, we theoretically and numerically demonstrate a type of electric field sensor in the THz frequency range based on the defect mode arising in a periodically corrugated waveguide with liquid crystals. The Bragg defect structure consisting of periodically corrugated metallic walls and a defect in the middle can provide a narrow transmitted peak with controllable bandwidth, which can be used for external field sensing when it is filled with LCs. The molecular orientation of nematic LCs (E7) is not only very sensitive to the applied DC electric field but also very crucial to the effective refractive index of E7. Changing the effective index can efficiently shift the frequency of the transmitted peak in the THz spectrum. The simulated results show that the sensitivity can reach as high as 9.164 MHz/(V/m) and the smallest resolution is 0.1115 V/m. The proposed sensor and its significant performance could benefit electric field sensing and extend the applications of THz technology.
1. Introduction
Terahertz (THz) waves belong to a frequency band of electromagnetic waves and generally refer to electromagnetic radiation in the frequency range of 0.1–10 THz [1,2,3,4,5]. In the early years, due to the lack of effective THz sources and sensitive detectors, the research results and data related to THz bands were very limited, resulting in the so-called “THz gap”. With the emergence of a series of new technologies over nearly thirty years, the unique THz properties of non-destructive and non-ionizing imaging and spectroscopy were discovered, which accelerated the development of THz technology [6,7,8,9,10]. Vast potential for future development was obtained in many areas such as military, medical, security checks, astronomy, and more [11,12,13,14,15,16]. Many types of THz functional devices have been disclosed, such as phase shifters [17,18], optical switches [19,20], sensors [21,22], modulators [23,24], and detectors [25].
On the other hand, there have been many reports in recent years on nematic liquid crystals (LCs) [26,27], which are very sensitive to aspects of the external environment such as lights [28], electric fields [29], magnetic fields [30], and temperature [31,32,33]. Wang et al. proposed an optical temperature sensor based on a silicon nitride micro-ring resonator incorporating LC cladding [34]. Ding et al. reported an LC optical sensor that was developed to detect vaporous butylamine in air [35]. They realized chemical sensing based on the changes in LC molecular orientation caused by lauric aldehyde and butylamine. Bi et al. designed an LC-based pH sensor that could perform real-time monitoring of changes in localized pH values near a solid surface [36]. Furthermore, researchers have also proposed metamaterials, gratings, photonic crystals, and other structures based on LCs to realize electric field sensing [37]. For example, Zhao et al. demonstrated an LC-infiltrated photonic crystal cavity combining the excellent resonant properties of a photonic crystal cavity with the demodulation properties of a Mach–Zehnder interferometer [38]. Czapla et al. improved the capabilities of electric field sensing with a long-period fiber grating coated with an LC layer [39]. However, THz sensors for electromagnetic field monitoring can hardly be found in the former reports.
In this paper, we propose a THz electric field sensor created by filling a hollow metal waveguide with nematic LCs. The waveguide consists of periodically corrugated walls and a defect in the middle, which leads to an arising Bragg defect mode in the transmitted spectrum. By optimizing the geometric structure of the metal waveguide, a very narrow transmitted peak could be generated at 1 THz without the external electric field. Increasing the external electric field results in a frequency shift of the peak, which can be used to realize THz sensing. In the following section, we explain the Bragg defect structure with nematic LCs and its spectrum characteristics in detail. In Section 3, we discuss the physical properties of nematic LCs under an external electric field according to a recent experiment [40], whereas the sensing performance of the electric field intensity sensor based on the Bragg defect structure with nematic LCs is investigated in Section 4. Finally, our major findings are summarized in Section 5.
2. Bragg Defect Mode
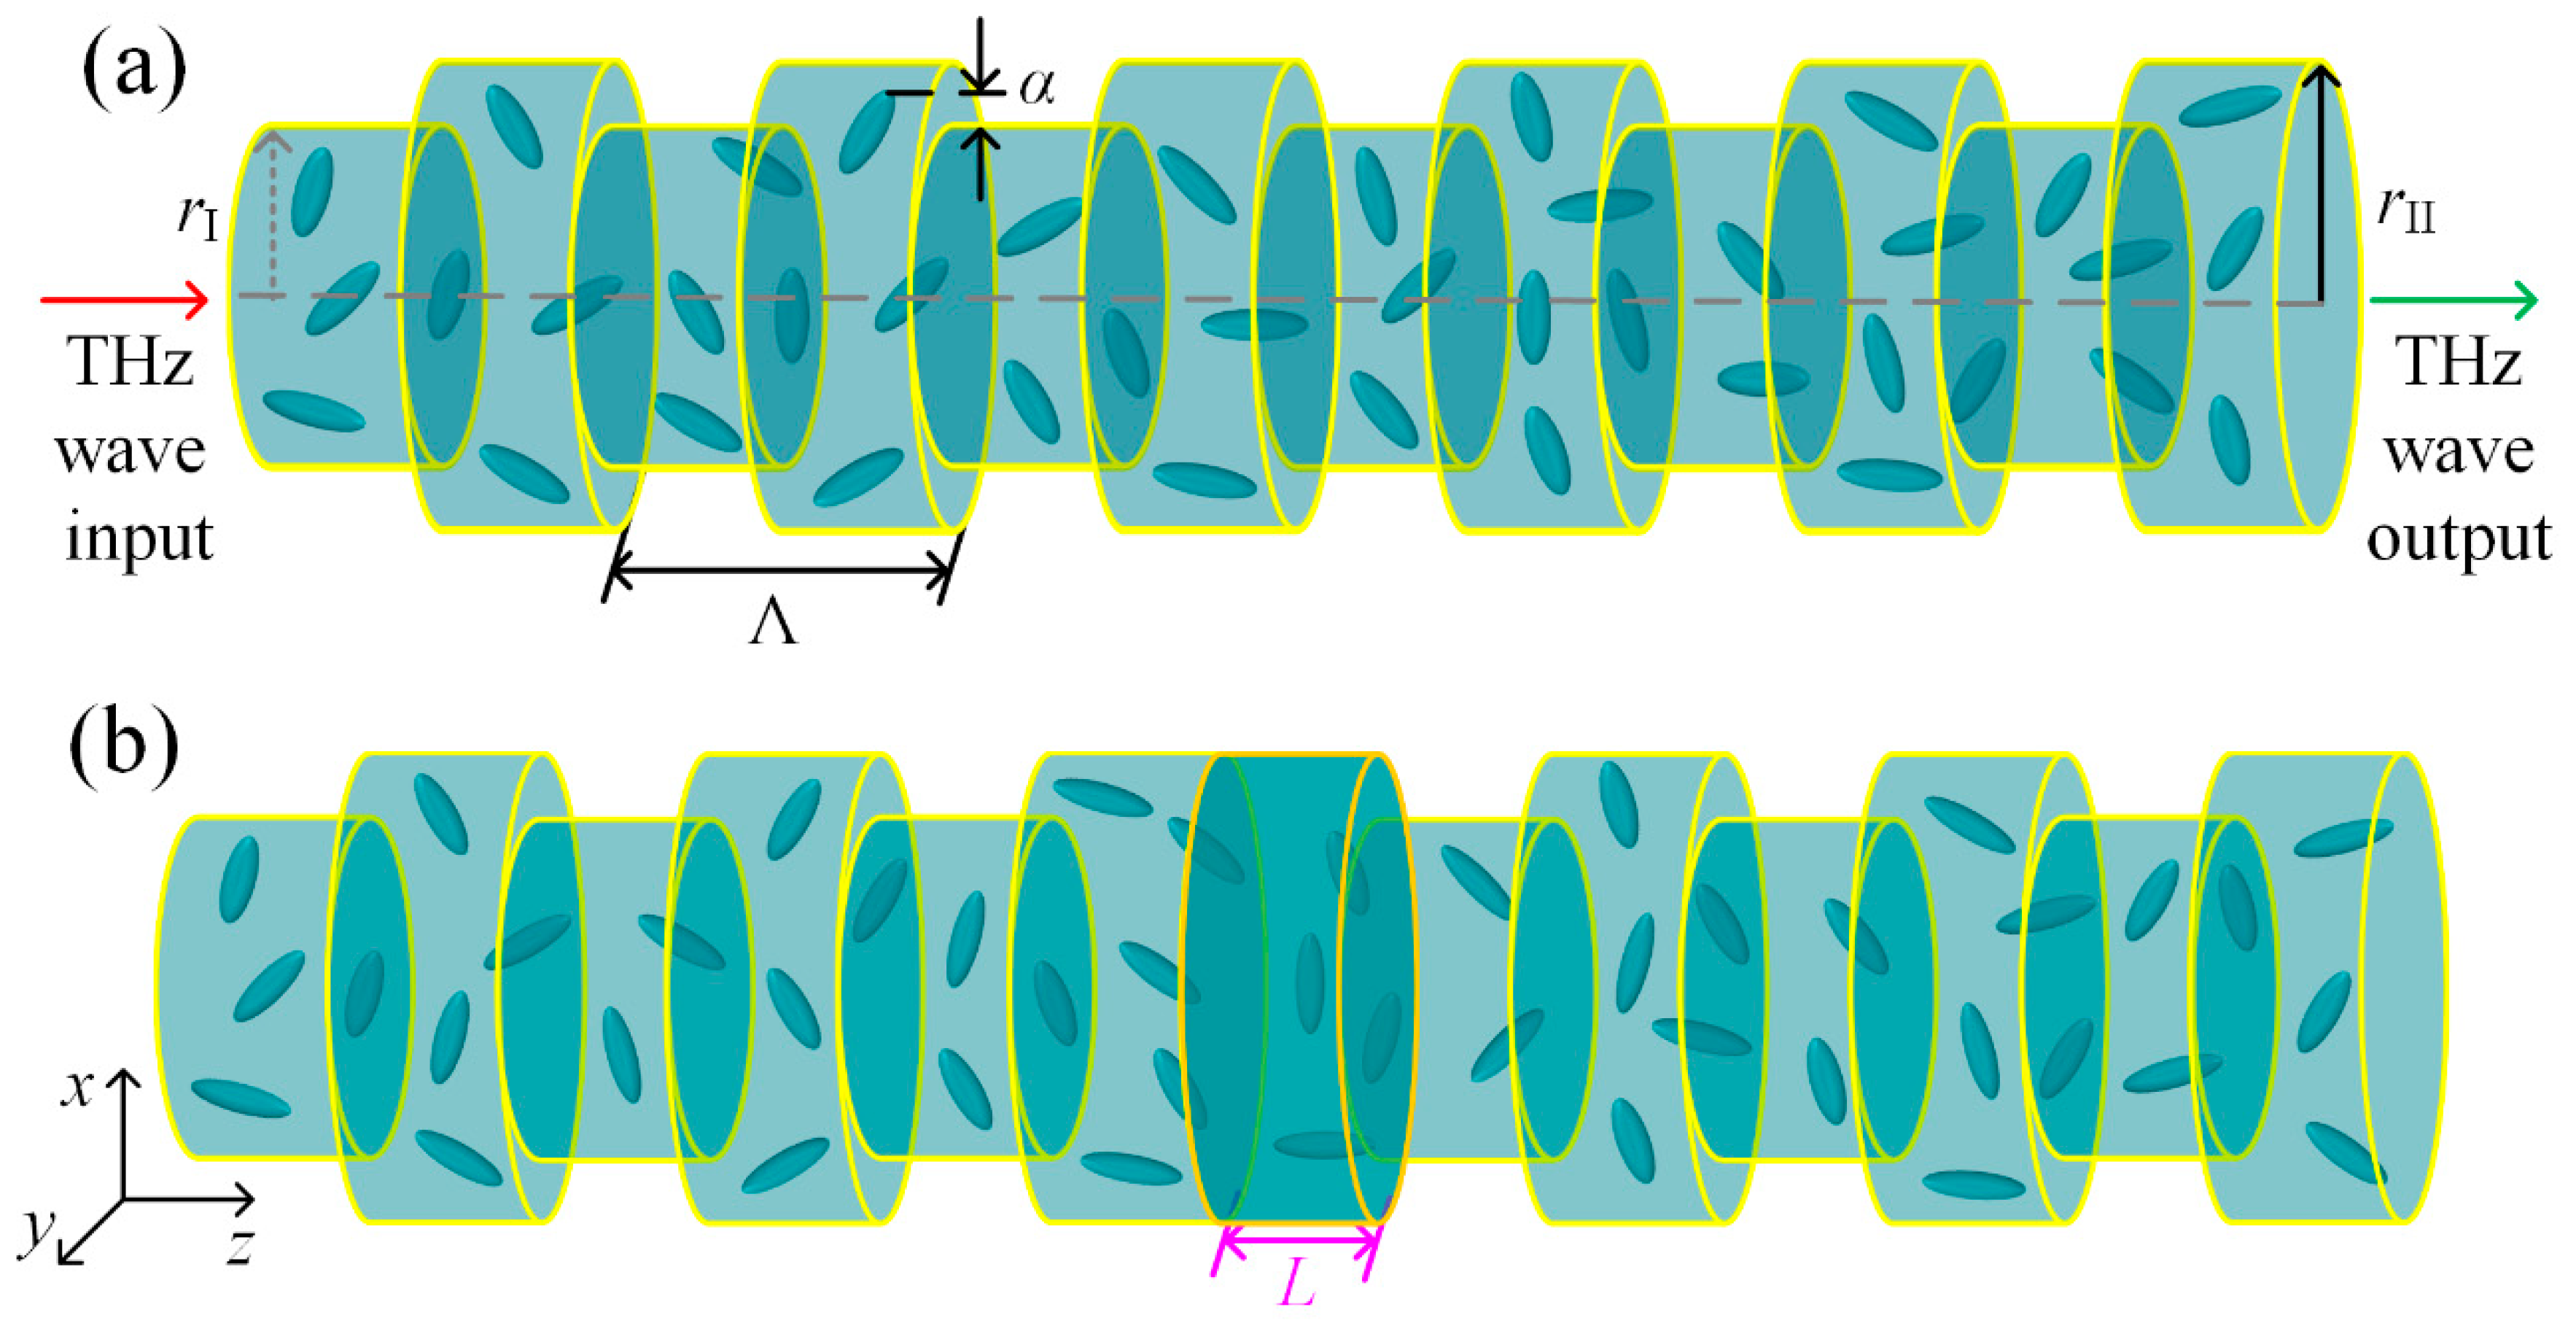
THz waves can pass through cylindrical metal tubes with very low loss. To manipulate THz propagation, we introduced periodic corrugations on the wall, which can effectively change the transmitted spectrum without significantly increasing the attenuation. As shown in Figure 1a, the Bragg structure consists of a cylindrical metal tube with corrugated walls and nematic LCs inside, sealed by 1 μm thick high-density polyethylene (HDPE). HDPE was selected here due to its high transmittance and low loss properties in THz ranges. and are the radii of the narrow and wide tubes, respectively. defined as the corrugation amplitude denotes the undulation intensity, and Λ is the length of a period. In practice, THz antennas can generate a small-diameter parallel beam which can be further focused through the lens and coupled into the proposed structure. The THz signals enter from the left end and exit the waveguide from the right end. Due to the undulating structure, THz waves can be reflected by each section. The multiple reflections and interactions will lead to Bragg resonance when the incident wavenumber and the wall corrugations are matching. Around Bragg resonances, there will appear a forbidden frequency band in which THz waves cannot propagate through the structure. To achieve electric field sensing, we propose a Bragg defect structure by introducing an additional wide tube in the middle of the periodic structure. As shown in Figure 1b, a defect with length L was inserted.
The dispersion relation of Bragg structures can be formulated as follows [20]:
where represents the resonant frequency, is the speed of light in the LC waveguide, is the first zero of the zeroth-order Bessel function, (, ) is the average radius, () is the propagation constant, and n represents the nth space harmonic. When we select the resonant frequency at 1 THz, n is equal to 0 and 1, and , the two reference lines intersect each other at the edges of the first Brillouin zone, and first-order Bragg resonance occurs. Considering that the nematic LCs fill the core of the waveguide, the obtained structural parameters are μm and Λ = 109 μm. The undulating parameter was selected as μm, which results in μm and μm. The lengths of the wide and narrow tubes were both selected as a half-period, i.e., 54.5 μm. The dispersion and its reference are shown in Figure 2a by the blue dots and red solid lines, respectively. It is obvious that a forbidden band (the pink shadow) appears around 1 THz and the red solid lines as the references also intersect at 1 THz.
To evaluate the proposed structure, the finite element method (FEM) with COMSOL Multiphysics was employed. In the simulations, a two-dimensional axisymmetric model was established due to the symmetry of the proposed cylindrical waveguide structure, and the TM mode was selected to excite the electromagnetic waves in the waveguide. The transmission T of the waveguide with 10 periods is shown in Figure 2b. The blue dotted and red solid lines are the transmitted spectra of the Bragg and Bragg defect structures, respectively. It was verified that the Bragg forbidden band is in the frequency range of 0.859–1.129 THz and a defect mode arose in the forbidden band as a narrow peak due to the inserted tube. The defect is located in the center of the waveguide, that is, the numbers of periods at both ends of the defect are the same, as shown by the dark green part in Figure 1b. The left end of the defect was connected to a wide tube while the right end was connected to a narrow one. The length of the defect could directly affect the frequency of the Bragg defect mode. Selecting the defect mode at 1 THz without an external electric field yields the defect length L = 57 μm. The distributions of the electric fields at 1 THz for the Bragg and Bragg defect structures are shown in Figure 2c,d, respectively. It can be seen from Figure 2c that the THz waves are quickly attenuated along the periodic structure because the frequency falls in the forbidden band, while Figure 2d tells us that there exists a strong localized resonance in the defect and that the electromagnetic energy is effectively accumulated around the defect. Furthermore, the accumulated energy finally results in a transmitted peak in the former forbidden band. The inserted defect in the Bragg structure definitely changes the transmission characteristic of the waveguide and the transmitted narrow peak of the Bragg defect mode seems to be a good candidate for THz sensing.
3. LC Materials
LC materials are the intermediate phases between crystalline solids and isotropic liquids. Different types of LCs form such intermediate phases in different temperature ranges and have special physical properties. The special properties of LC materials can be attributed to the phenomenon of birefringence of electromagnetic waves, which is caused by the anisotropy of the constituent molecules. Considering LC E7 in its Lagrange coordinates (x′, y′, z′) yields the permittivity tensor
when z′ is selected as the principle axis. and are the ordinary and the extraordinary refractive indices, respectively. Then, the magnetic wave propagation can be formulated as
where is the electromagnetic wavenumber in vacuum, and , , and , are the components of the wavenumber and the electric field, respectively. In the proposed waveguide, the longitudinal wavenumber of THz waves is when we define the effective refractive index of LC as . Thus, and when denotes the angle between the LC molecular orientation and the direction perpendicular to the electric field. Then, we can obtain the effective refractive index as
when the determinant of the coefficients in Equation (3) vanishes.
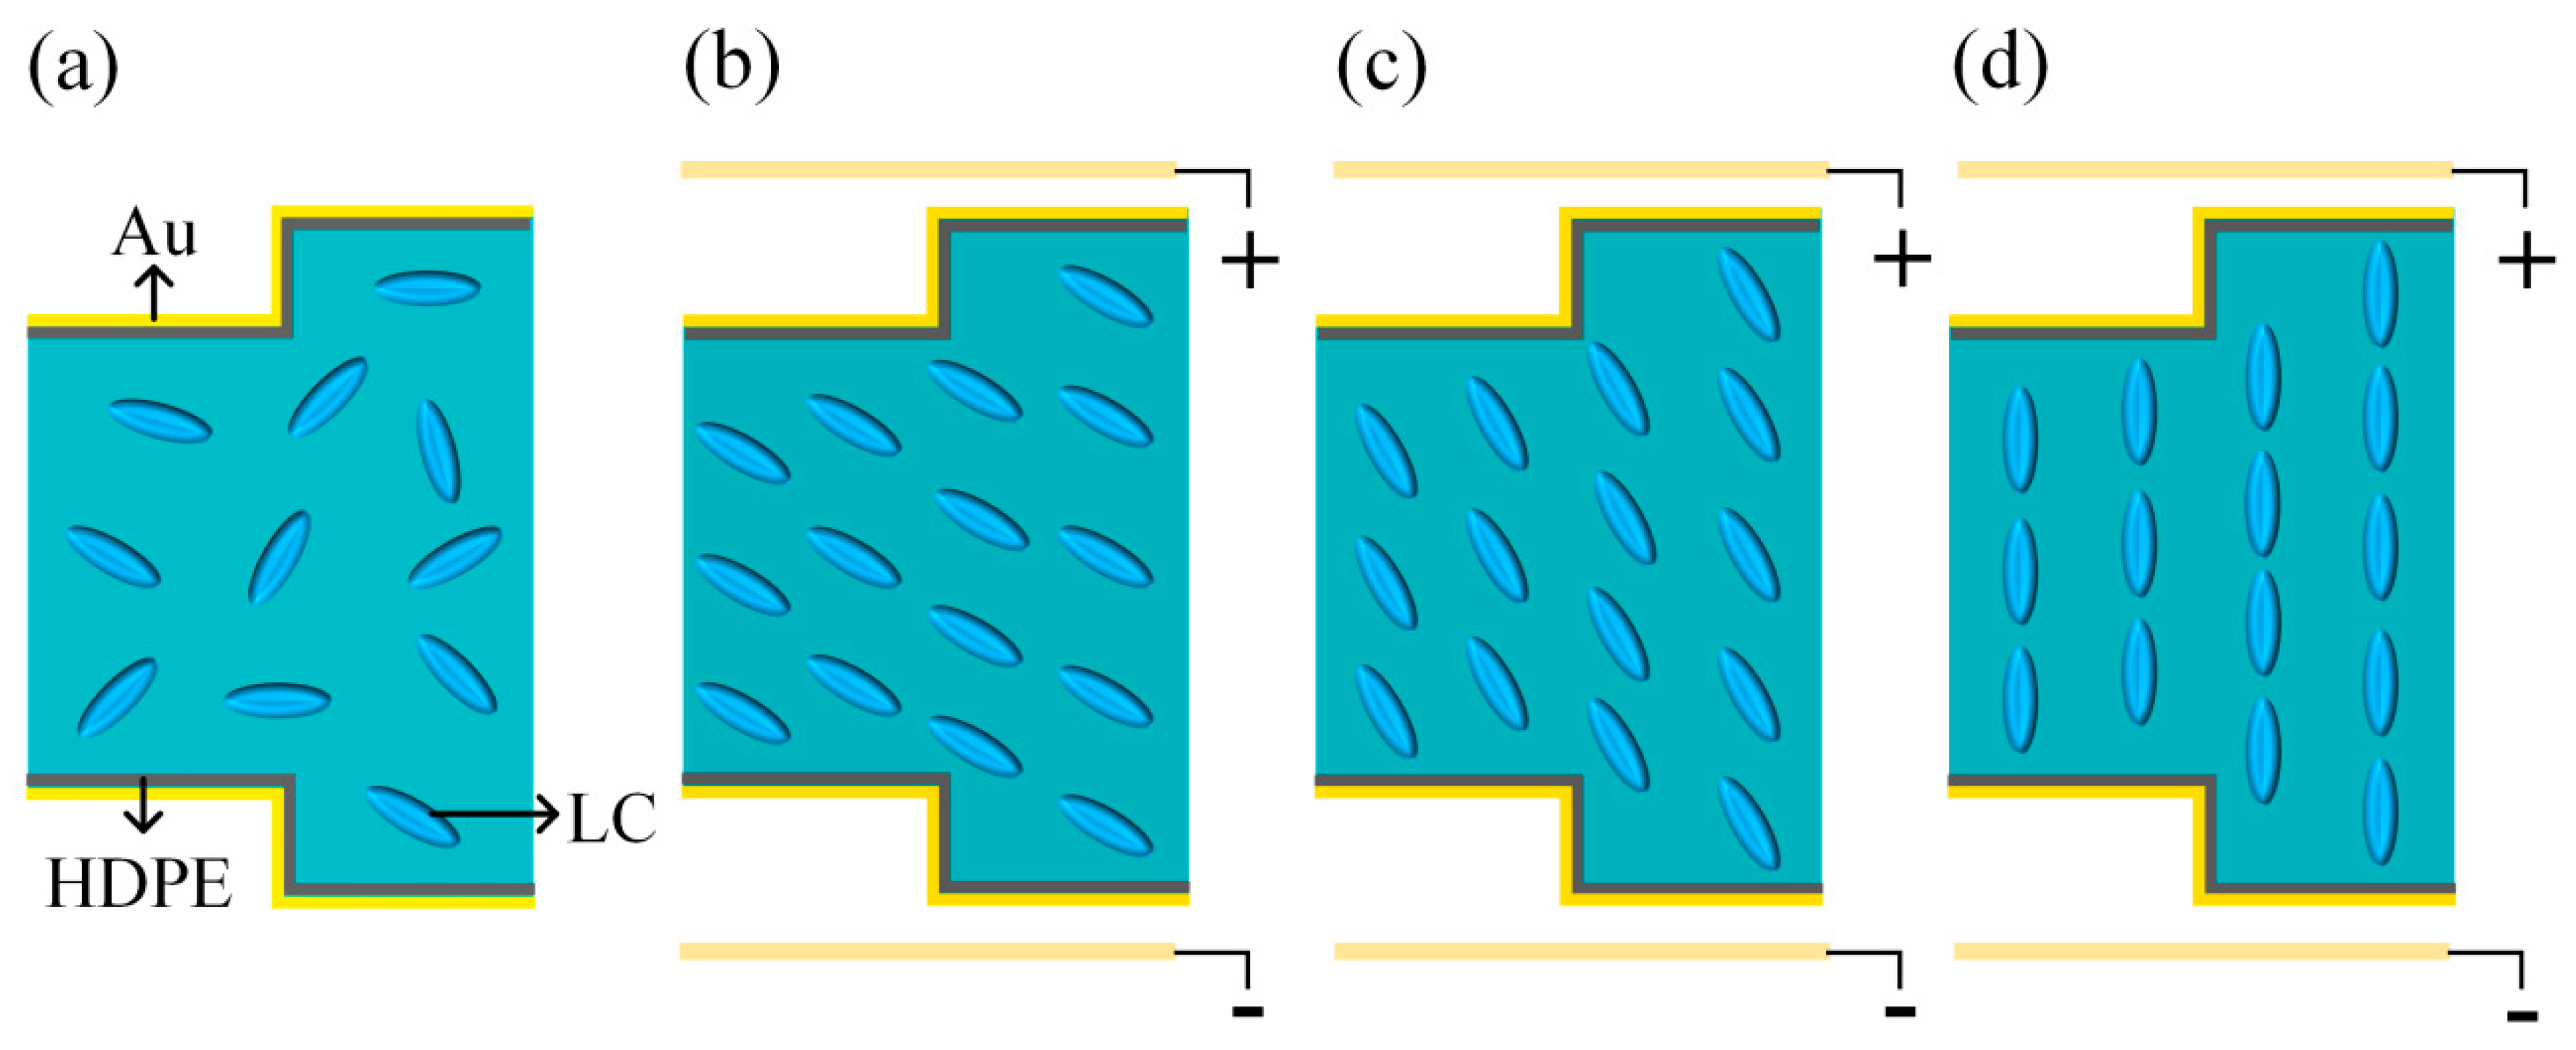
The molecular orientation of LCs can be controlled by the external environment; this has been widely used in research of visible light and far-infrared devices in recent years. According to the Frederiks transition, when LC molecules are controlled by an electric field, the LC transition mode depends on the dielectric anisotropy . If the dielectric anisotropy is positive, i.e., > 0, the LC molecule regions are arranged in a direction parallel to the external electric field. Otherwise, they tend to be aligned in the vertical direction of the electric field [41,42]. The mixture type of the LCs (E7) used in the Bragg defect structure has low absorption and small dispersion in the THz frequency range, which is very promising in applications of controllable THz systems. The molecular orientation of the LCs determines the effective refractive index of THz waves in the direction of propagation. Since the dielectric anisotropy of E7 is positive ( > 0), the molecules will tend to be aligned parallel to the direction of the electric field when the external electric field increases. Figure 3 shows a schematic diagram of the E7 molecule’s enhanced transition with an external electric field. In Figure 3a, the molecules are randomly distributed in the absence of an external electric field, and Figure 3b–d exhibits that the LC molecules gradually change to a direction parallel to the external electric field as the intensity becomes stronger. Here, it is assumed that the external DC electric field is parallel to the polarization direction and perpendicular to the propagating direction of THz waves. In this case, the can be directly determined from the DC electric field strength (), and a larger adjustment range can be achieved.
Yang et al. reported experimental results of the of E7 under an external DC electric field [40] where increases from 1.61 to 1.70 at 1 THz when the electric field changes from 0 kV/m to 7 kV/m. The can reach the maximum value when ≥ 7 kV/m, but it cannot reach its minimum value , because when = 0 kV/m, the E7 molecules are randomly aligned instead of perpendicular to the electric field direction. Although the proposed structure is different from the experimental one, the physical properties of the effective index of LCs are similar due to the only dependence being on the molecular orientations. We read the refractive index from the experimental data and employed a cubic polynomial fit to represent the relationship between the and the frequency in the range of 0.4–1.4 THz as follows:
4. Sensitivity and Resolution
To investigate the sensing effect on electric field strength of the proposed Bragg defect structure, we simulated THz transmission under different applied electric field intensities. By changing the intensity of the applied electric field, the peak position of the Bragg defect mode can be easily changed because the varying electric field changes the orientation of LC modules and, thus, the effective refractive index. Therefore, an accurately measured peak frequency can reflect tiny changes in the electric field. In our study, the defect was inserted in the middle of a waveguide with 10 periods, that is, the number of periods at both ends of the defect was 5. By numerical simulations of the FEM for THz wave propagation in the Bragg defect structure, the transmission spectra for the electric field from 3 kV/m to 7 kV/m were obtained and the results are presented in Figure 5a. The frequency of the Bragg defect mode shifts to a lower frequency range when the electric field increases. It can be seen from Figure 5a that the center frequency of the defect mode is 0.9832 THz when the electric field is 3 kV/m, and it moves to 0.9473 THz when the electric field increases to 7 kV/m. The average bandwidth of the defect mode is 0.7740 GHz. The simulated data indicate that the minimum electric field intensity that can be identified from 3 kV/m to 7 kV/m is 84.39 V/m, which means that the Bragg defect structure can provide a satisfying resolution of the DC electric field. In order to study the sensitivity of the defect mode in the proposed structure to the external DC electric field, the center frequency of the peak under various electric fields was read out and fitted by a linear model, as shown by the circles and the purple line in Figure 5b, respectively. The best fitting curve for the frequency shift from 0.9642 THz is
The fitting results show that the defect mode linearly shifted to a low frequency as the external was enhanced. The frequency shift is 9.164 GHz when the electric field is increased by 1 kV/m, indicating that the sensitivity of the Bragg defect structure sensor can reach as high as 9.164 MHz/(V/m).
Moreover, Bragg defect structures with different numbers of periods at both ends of the defect were also simulated to further improve the resolution, which is the essential factor in electric intensity sensing. The transmitted peaks for N = 5, 6, 7, 8, 9, and 10 periods are shown in Figure 5c by different lines with = 5 kV/m. It was surprisingly found that the bandwidth of the transmitted peak sharply narrowed as the number of periods at both ends increased, but the center frequency was almost constant. In order to clearly show these peaks, a center frequency of 0.9642 THz at 10 periods was uniformly subtracted from the frequency. The bandwidth of the defect mode was also reduced from 0.7740 GHz at 5 periods to 1.002 MHz at 10 periods. The average bandwidths in the cases of different numbers of periods were obtained, and this parameter can directly reflect the resolution of the proposed sensor. When the peak frequency of the defect mode moves a half-bandwidth, the related electric field change is known as the device resolution. In Figure 5d, the resolution and its best fit are shown by the circles and the solid line, respectively, and the fitting function is
The fitting results show that the resolution of the proposed Bragg defect structure is exponentially decreasing as the number N increases. When the number of periods is selected to be 10, the electric field sensor attains its smallest resolution, where the minimum identifiable can reach 0.1115 V/m.
5. Conclusions
A THz electric field sensor based on the Bragg defect structure filled with LC E7 material was proposed, and its sensing performance was investigated. The sensor consists of a circular defect with undulating waveguides connected at both ends, and the numbers of periods are the same either side. The wall material of the waveguide is 1 μm thick gold coated on a layer of 1 μm thick HDPE, the LCs fill the waveguide, and the two ends of the waveguide are also sealed by 1 μm thick HDPE. The numerical results show that the Bragg defect structure produces a narrow transmitted peak around 1 THz when no external electric field is applied. By analyzing the electric field component at the peak frequency, we verified that the transmitted peak can be attributed to the local resonance in the defect. The effect of an external electric field on this structure leads to the variation of the effective refractive index of the LCs (E7), thereby causing a frequency shift of the peak. Thus, the Bragg defect structure performs the function of electric field sensing. The simulated results show that the sensitivity of the sensor can reach 9.164 MHz/(V/m), and the resolution highly relies on the number of periods at both ends of the defect. The minimum value of the resolvable electric field at 5 periods is 84.39 V/m, and at 10 periods, the smallest is 0.1115 V/m. The LC Bragg defect structure with its high sensing performance could be widely used in various applications of THz technology, such as switches and tunable filters.
Author Contributions
Conceptualization, L.-L.X. and Z.-Y.T.; validation, L.-L.X., Y.G. and Y.-X.F.; formal analysis, L.-L.X., Y.G. and Z.-Y.T.; writing—original draft preparation, L.-L.X.; writing—review and editing, Z.-Y.T.; visualization, L.-L.X.; supervision, Y.-X.F. and Z.-Y.T.
Funding
This research was funded by National Natural Science Foundation of China (11374071); Fundamental Research Funds for the Central Universities of China; and Natural Science Foundation of Heilongjiang Province, China (A2018004).
Conflicts of Interest
The authors declare no conflict of interest.
References
- Tonouchi, M. Cutting-edge terahertz technology. Nat. Photonics 2007, 1, 97–105. [Google Scholar] [CrossRef]
- Chattopadhyay, G. Technology, capabilities, and performance of low power terahertz sources. IEEE Trans. Terahertz Sci. Technol. 2011, 1, 33–53. [Google Scholar] [CrossRef]
- Hartmann, R.R.; Kono, J.; Portnoi, M.E. Terahertz science and technology of carbon nanomaterials. Nanotechnology 2014, 25, 322001. [Google Scholar] [CrossRef] [PubMed]
- Dhillon, S.S.; Vitiello, M.S.; Linfield, E.H.; Davies, A.G.; Hoffmann, M.C.; Booske, J.; Paoloni, C.; Gensch, M.; Weightman, P.; Williams, G.P.; et al. The 2017 terahertz science and technology roadmap. J. Phys. D Appl. Phys. 2017, 50, 043001. [Google Scholar] [CrossRef]
- Takano, K.; Morimoto, I.; Yokoyama, H.; Hangyo, M. Wire-grid polarizer in the terahertz region fabricated by nanoimprint technology. Opt. Lett. 2011, 36, 2665–2667. [Google Scholar] [CrossRef] [PubMed]
- Amenabar, I.; Lopez, F.; Mendikute, A. In introductory review to THz non-destructive testing of composite mater. J. Infrared Mill. Terahz. Waves 2013, 34, 152–169. [Google Scholar] [CrossRef]
- You, C.W.; Lu, C.; Wang, T.Y.; Qian, S.R.; Yang, Z.G.; Wang, K.J.; Liu, J.S.; Wang, S.L. Method for defect contour extraction in terahertz non-destructive testing conducted with a raster-scan THz imaging system. Appl. Opt. 2018, 57, 4884–4889. [Google Scholar] [CrossRef]
- Kawase, K.; Ogawa, Y.; Watanabe, Y. Non-destructive terahertz imaging of illicit drugsusing spectral fingerprints. Opt. Express 2003, 11, 2549–2554. [Google Scholar] [CrossRef]
- Kleine-ostmann, T.; Jastrow, C.; Baaske, K.; Heinen, B.; Schwerdtfeger, M.; Kärst, U.; Hintzsche, H.; Stopper, H.; Koch, M.; Schrader, T. Field Exposure and Dosimetry in the THz Frequency Range. IEEE Trans. Terahertz Sci. Technol. 2014, 4, 12–25. [Google Scholar] [CrossRef]
- Sunaguchi, N.; Sasaki, Y.; Maikusa, N.; Kawai, M.; Yuasa, T.; Otani, C. Depth-resolving THz imaging with tomosynthesis. Opt. Express 2009, 17, 9558–9570. [Google Scholar] [CrossRef]
- Li, J.; Takeda, M.; Wang, Z.; Shi, S.C.; Yang, J. Low-noise 0.5 THz all-NbN superconductor-insulator-superconductor mixer for submillimeter wave astronomy. Appl. Phys. Lett. 2008, 92, 222504. [Google Scholar] [CrossRef]
- Kawano, Y. Terahertz waves: A tool for condensed matter, the life sciences and astronomy. Contemp. Phys. 2013, 54, 143–165. [Google Scholar] [CrossRef]
- Parrott, E.P.J.; Sun, Y.; Pickwell-Macpherson, E. Terahertz spectroscopy: Its future role in medical diagnoses. J. Mol. Struct. 2011, 1006, 66–76. [Google Scholar] [CrossRef]
- Turchinovich, D.; Dijkhuis, J.I. Performance of combined ⟨1 0 0⟩–⟨1 1 0⟩ ZnTe crystals in an amplified THz time-domain spectrometer. Opt. Commun. 2007, 270, 96–99. [Google Scholar] [CrossRef]
- Qiao, W.; Stephan, D.; Hasselbeck, M.; Liang, Q.; Dekorsy, T. Low-temperature THz time domain waveguide spectrometer with butt-coupled emitter and detector crystal. Opt. Express 2012, 20, 19769–19777. [Google Scholar] [CrossRef] [PubMed]
- Zhou, S.F.; Reekie, L.; Chan, H.P.; Luk, K.M.; Chow, Y.T. Characterization of a fiber bragg grating for use in a THz spectrometer. IEEE Photonics Technol. Lett. 2013, 25, 734–736. [Google Scholar] [CrossRef]
- Hsieh, C.-F.; Pan, R.-P.; Tang, T.-T.; Chen, H.-L.; Pan, C.-L. Voltage-controlled liquid-crystal terahertz phase shifter and quarter-wave plate. Opt. Lett. 2006, 31, 1112–1114. [Google Scholar] [CrossRef] [PubMed] [Green Version]
- Han, Z.; Ohno, S.; Tokizane, Y.; Nawata, K.; Notake, T.; Takida, Y.; Minamide, H. Thin terahertz-wave phase shifter by flexible film metamaterial with high transmission. Opt. Express 2017, 25, 31186–31195. [Google Scholar] [CrossRef] [PubMed]
- Zhang, K.; Zhang, L.; Duan, D.; Fan, Y.X.; Tao, Z.Y. Wide band terahertz switch of undulated waveguide with VO2 film coated inner wall. J. Light. Technol. 2018, 36, 4401–4407. [Google Scholar] [CrossRef]
- Zhang, L.; Fan, Y.X.; Liu, H.; Xu, L.L.; Xue, J.L.; Tao, Z.Y. Hypersensitive and Tunable Terahertz Wave Switch Based on Non-Bragg Structures Filled with Liquid Crystals. J. Light. Technol. 2017, 35, 3092–3098. [Google Scholar] [CrossRef]
- Islam, M.; Rao, S.J.M.; Kumar, G.; Pal, B.P.; Roy Chowdhury, D. Role of Resonance Modes on Terahertz Metamaterials based Thin Film Sensors. Sci. Rep. 2017, 7, 7355. [Google Scholar] [CrossRef] [PubMed]
- Chen, Z.; Hefferman, G.; Wei, T. A Sweep Velocity-Controlled VCSEL Pulse Laser to Interrogate Sub-THz-Range Fiber Sensors. IEEE Photonics Technol. Lett. 2017, 29, 1471–1474. [Google Scholar] [CrossRef]
- He, T.; Zhang, B.; Shen, J.; Zang, M.; Chen, T.; Hu, Y.; Hou, Y. High-efficiency THz modulator based on phthalocyanine-compound organic films. Appl. Phys. Lett. 2015, 106, 053303. [Google Scholar] [CrossRef]
- Nouman, M.T.; Kim, H.; Woo, J.M.; Hwang, J.H.; Kim, D.; Jang, J. Terahertz Modulator based on Metamaterials integrated with Varactors. Sci. Rep. 2016, 6, 26452. [Google Scholar] [CrossRef] [PubMed]
- Spirito, D.; Coquillat, D.; De Bonis, S.L.; Lombardo, A.; Bruna, M.; Ferrari, A.C.; Pellegrini, V.; Tredicucci, A.; Knap, W.; Vitiello, M.S. High performance bilayer-graphene Terahertz detectors. Appl. Phys. Lett. 2014, 104, 061111. [Google Scholar] [CrossRef]
- Koizumi, R.; Li, B.-X.; Lavrentovich, O. Effect of Crowding Agent Polyethylene Glycol on Lyotropic Chromonic Liquid Crystal Phases of Disodium Cromoglycate. Crystals 2019, 9, 160. [Google Scholar] [CrossRef]
- Črešnar, D.; Kyrou, C.; Lelidis, I.; Drozd-Rzoska, A.; Starzonek, S.; Rzoska, S.; Kutnjak, Z.; Kralj, S. Impact of Weak Nanoparticle Induced Disorder on Nematic Ordering. Crystals 2019, 9, 171. [Google Scholar] [CrossRef]
- Wang, Y.; Kanazawa, A.; Shiono, T.; Ikeda, T.; Matsuki, Y.; Takeuchi, Y. Homogeneous alignment of nematic liquid crystal induced by polyimide exposed to linearly polarized light. Appl. Phys. Lett. 1998, 72, 545–547. [Google Scholar] [CrossRef]
- Sinclair, E.J.; Carr, E.F. Flow Patterns in Bulk Samples of a Nematic Liquid Crystal Due To Electric Fields. Mol. Cryst. Liq. Cryst. 1976, 35, 143–153. [Google Scholar] [CrossRef]
- Mur, M.; Sofi, J.A.; Kvasić, I.; Mertelj, A.; Lisjak, D.; Niranjan, V.; Muševič, I.; Dhara, S. Magnetic-field tuning of whispering gallery mode lasing from ferromagnetic nematic liquid crystal microdroplets. Opt. Express 2017, 25, 1073–1083. [Google Scholar] [CrossRef] [Green Version]
- Madsen, L.A.; Dingemans, T.J.; Nakata, M.; Samulski, E.T. Thermotropic biaxial nematic liquid crystal. Phys. Rev. Lett. 2004, 92, 145505. [Google Scholar] [CrossRef] [PubMed]
- Li, J.; Wu, S.-T.; Brugioni, S.; Meucci, R.; Faetti, S. Infrared refractive indices of liquid crystals. J. Appl. Phys. 2005, 97, 073501. [Google Scholar] [CrossRef]
- Ma, M.; Li, S.; Jing, X.; Chen, H. Refractive indices of liquid crystal E7 depending on temperature and wavelengths. Opt. Eng. 2017, 56, 117109. [Google Scholar] [CrossRef]
- Wang, C.T.; Wang, C.Y.; Yu, J.H.; Kuo, I.T.; Tseng, C.W.; Jau, H.C.; Chen, Y.J.; Lin, T.H. Highly sensitive optical temperature sensor based on a SiN micro-ring resonator with liquid crystal cladding. Opt. Express 2016, 24, 1002–1007. [Google Scholar] [CrossRef] [PubMed]
- Ding, X.K.; Yang, K.L. Liquid crystal based optical sensor for detection of vaporous butylamine in air. Sensors Actuators, B Chem. 2012, 173, 607–613. [Google Scholar] [CrossRef]
- Bi, X.; Hartono, D.; Yang, K.L. Real-time liquid crystal pH sensor for monitoring enzymatic activities of penicillinase. Adv. Funct. Mater. 2009, 19, 3760–3765. [Google Scholar] [CrossRef]
- Tichit, P.H.; Burokur, S.N.; Qiu, C.W.; De Lustrac, A. Experimental verification of isotropic radiation from a coherent dipole source via electric-field-driven LC resonator metamaterials. Phys. Rev. Lett. 2013, 111, 133901. [Google Scholar] [CrossRef] [PubMed]
- Zhao, Y.; Zhang, Y.N.; Lv, R.Q.; Li, J. Electric Field Sensor Based on Photonic Crystal Cavity with Liquid Crystal Infiltration. J. Light. Technol. 2017, 35, 3440–3446. [Google Scholar] [CrossRef]
- Czapla, A.; Bock, W.J.; Woliński, T.R.; Mikulic, P.; Nowinowski-Kruszelnicki, E.; Dąbrowski, R. Improving the electric field sensing capabilities of the long-period fiber grating coated with a liquid crystal layer. Opt. Express 2016, 24, 5662–5673. [Google Scholar] [CrossRef]
- Yang, L.; Fan, F.; Chen, M.; Zhang, X.; Chang, S.J. Active terahertz metamaterials based on liquid-crystal induced transparency and absorption. Opt. Commun. 2017, 382, 42–48. [Google Scholar] [CrossRef]
- De Gennes, P.G.; Prost, J. The Physics of Liquid Crystals, 2nd ed.; Oxford University Press: New York, NY, USA, 1993; pp. 123–133. [Google Scholar]
- Yang, D.K.; Wu, S.T. Fundamentals of Liquid Crystal Devices, 2nd ed.; Wiley: Wiltshire, UK, 2015; pp. 153–165. [Google Scholar]
Figure 1.
A schematic diagram of the Bragg (a) and Bragg defect (b) structures. The yellow curves represent the pipe wall of gold while the gray-green indicates the LCs (E7) filling the metal waveguide. The darker, orange-outlined section illustrates the inserted defect in the Bragg structure with length L.

Figure 2.
Transmission characteristics of periodic cylindrical waveguides with and without a defect. (a) Dispersion characteristics of the Bragg structure: the blue dots depict the dispersion curves, the red solid lines are their references, and the pink shadow denotes the forbidden band created by the first-order Bragg resonance. (b) Transmitted spectra of the Bragg and Bragg defect structures: the blue dashed line illustrates the forbidden band of the waveguide without the defect, and the red solid line is the transmission of the Bragg defect structure. (c,d) are the electric field Ez component of the waveguides with and without the defect at 1 THz, respectively.

Figure 3.
A schematic diagram of the LC (E7) molecule transition under an external electric field. The blue ellipses represent the LC molecules. (a) The molecules distribute randomly when there is no external electric field. (b–d) The orientations of LC molecules change with increasing electric field intensity.

Figure 4.
Effective refractive index of E7 in the frequency range of 0.4–1.4 THz. The different lines depict the fitting results of the experimental data [40].
Figure 4.
Effective refractive index of E7 in the frequency range of 0.4–1.4 THz. The different lines depict the fitting results of the experimental data [40].

Figure 5.
Frequency shift of the defect mode and its sensing characteristics. (a) The defect mode moves to a lower frequency as the electric field intensity increases. (b) The best fitting curve for the shifted frequency (the circles) of the transmitted peak under different electric field intensities exhibits high sensitivity for electric fields. (c) The transmitted peak gets narrower when the number of periods increases with kV/m. (d) The resolution (the squares) and its best fitting curve indicate that the resolution can be improved by increasing the number of periods.


Table 1.
Optimal coefficients and the root-mean-square error of the cubic polynomial fit for the effective refractive index.
Table 1.
Optimal coefficients and the root-mean-square error of the cubic polynomial fit for the effective refractive index.
| a | b | c | d | σ (10−4) | |
|---|---|---|---|---|---|
| 0 | 0.05068 | −0.11660 | 0.04956 | 1.621 | 3.201 |
| 3 | 0.01520 | −0.04189 | 0.01373 | 1.645 | 5.324 |
| 4 | 0.01307 | −0.02724 | 0.00269 | 1.658 | 3.600 |
| 5 | 0.01110 | −0.03321 | 0.02184 | 1.665 | 5.317 |
| 6 | 0.00819 | −0.03082 | 0.02365 | 1.680 | 3.502 |
| 7 | 0.01717 | −0.06046 | 0.05830 | 1.680 | 6.392 |
© 2019 by the authors. Licensee MDPI, Basel, Switzerland. This article is an open access article distributed under the terms and conditions of the Creative Commons Attribution (CC BY) license (http://creativecommons.org/licenses/by/4.0/).
Share and Cite
MDPI and ACS Style
Xu, L.-L.; Gong, Y.; Fan, Y.-X.; Tao, Z.-Y. A High-Resolution Terahertz Electric Field Sensor Using a Corrugated Liquid Crystal Waveguide. Crystals 2019, 9, 302. https://0-doi-org.brum.beds.ac.uk/10.3390/cryst9060302
AMA Style
Xu L-L, Gong Y, Fan Y-X, Tao Z-Y. A High-Resolution Terahertz Electric Field Sensor Using a Corrugated Liquid Crystal Waveguide. Crystals. 2019; 9(6):302. https://0-doi-org.brum.beds.ac.uk/10.3390/cryst9060302
Chicago/Turabian StyleXu, Lan-Lan, Yi Gong, Ya-Xian Fan, and Zhi-Yong Tao. 2019. "A High-Resolution Terahertz Electric Field Sensor Using a Corrugated Liquid Crystal Waveguide" Crystals 9, no. 6: 302. https://0-doi-org.brum.beds.ac.uk/10.3390/cryst9060302
Note that from the first issue of 2016, this journal uses article numbers instead of page numbers. See further details here.