Article

Local-Scale Bat Guild Activity Differs with Rice Growth Stage at Ground Level in the Philippines

by
Jodi L. Sedlock
1,*,
Alexander M. Stuart
2,
Finbarr G. Horgan
3,
Buyung Hadi
2,
Angela Como Jacobson
1,
Phillip A. Alviola
4 and
James D. V. Alvarez
5
1
Biology Department, Lawrence University, 711 E. North St., Appleton, WI 54911, USA
2
International Rice Research Institute, DAPO Box 7777, Metro Manila 1301, Philippines
3
EcoLaVerna Integral Restoration Ecology, Bridestown, Kildinan, T56 CD39 Co. Cork, Ireland
4
Department of Biological Sciences, University of the Philippines at Los Baños, College, Laguna 4031, Philippines
5
Museum of Natural History, University of the Philippines at Los Baños, College, Laguna 4031, Philippines
*
Author to whom correspondence should be addressed.
Submission received: 15 July 2019 / Revised: 23 August 2019 / Accepted: 25 August 2019 / Published: 27 August 2019
(This article belongs to the Section Animal Diversity)

Abstract

:
High-flying insectivorous bats, as wide-ranging generalist insectivores, are valuable consumers of high-altitude migrating pests of rice in Southeast Asia. Here, we documented the behavior of relatively low-flying bats over irrigated rice to elucidate their potential role as predators of rice-associated pest insects in the Philippines. Specifically, we tested the local-scale effects of rice stage, particularly seedling and late vegetative stages, and time of night on acoustic activity of bats foraging near ground level within three functional guilds (based on foraging distance from background clutter). We also monitored bat activity from two 50 m-high towers to assess the vertical extent of relatively low-flying guilds, as well as document high-flying bat guild presence and temporal behavior. At ground level, the most active guild biased their activity and feeding over early growth stage fields, but also foraged at tower level. Activity of the bat guild adept at foraging closest to vegetation did not vary with time of night or rice stage and was absent from tower recordings. High-flying bats were predictably rare at rice level, but exhibited high foraging intensity at 50 m. Given the well-documented, sequential arrival of insect guilds with growth stage, these data suggest that at ground level edge-space bats may be important consumers of detritivores (e.g., mosquitoes). Moreover, our data suggest that just as habitat heterogeneity enhances the services of arthropod predators, these management practices also enhance bat activity and, presumably, their contribution to pest suppression.

1. Introduction

Unlike many staple crops, irrigated rice represents a species-rich and complex ecosystem that provides habitat for a diversity of vertebrates [1,2,3,4] and invertebrates [5]. Integrated pest management (IPM) [6] and ecological engineering [7,8] capitalize on the food web complexity of this agroecosystem—especially a rich arthropod community—to control insect pests. These pests include herbivores and disease vectors that reduce crop yields [9,10,11], and mosquito disease vectors responsible for the spread of Japanese encephalitis, dengue and malaria [12,13]. In pesticide-free paddies, natural enemies such as spiders, beetles, and dragonflies, among others, suppress these pests, and can benefit from ecological intensification practices, such as habitat-enhancing bund crops [8,14,15]. Bats, as highly mobile insectivores, may also contribute to the suppression of rice-associated insect pests.
Across a range of agricultural systems, there is evidence that bats consume crop pests [16,17,18,19,20], decrease crop damage [21,22,23], contribute to higher crop yields [24], and have potential as an ‘early warning system’ of pest outbreaks [25]. Moreover, insectivorous bat assemblages are rich in the tropical rice-growing regions of Southeast Asia [26,27], and comprise bats from different functional guilds that may consume different insect pests [28,29]. For example, C. plicatus and T. melanopogan belong to the open-space guild. The high-altitude-flying wrinkle-lipped bat (Chaerophon plicatus) consumes planthoppers [30], which are economically important rice pests [31]. Also, overlapping isotopic signatures of the black-bearded tomb bat (Taphozous melanopogan) with C. plicatus [32] and its ability to fly at high altitudes [33], provides strong evidence that it, too, may consume migrating rice pests. Rice-associated edge-space bats, such as the Asian house bat (Scotophilus kuhlii) [34], hawk aerial prey in the open at smaller spatial scales closer to vegetation. Finally, narrow-space bats, such as Myotis spp. are common over rice [33] and are able to echolocate aerial prey and/or glean sessile prey off vegetation or the water surface [35]. Therefore, bats in different guilds may make unique contributions to the suppression of rice-associated insect pests.
Rice-associated insects are temporally and spatially dynamic [36,37] and strongly associated with rice growth stage (Figure 1A–K). Generally, overall species richness and abundance increases with rice growth [10,13,38] (Figure 1A); however, insect guilds peak sequentially with rice growth stages [10,39]. Specifically, at post-transplanting and flooding, detritivore larvae and aerial adults (e.g., midges: Chironomidae and mosquitoes: Culicidae) emerge (Figure 1A,C–E), followed by herbivores in the reproductive crop stage (Figure 1A,I–K). An abundance of detritivores at early crop stages maintains generalist predator populations in the rice crop that suppress the later build-up of pest herbivores. Arthropod predators are often the dominant guild during ripening and grain filling stages of the crop (Figure 1A,F–H). Given that bats are largely opportunistic foragers consuming prey types in direct proportion to their availability [40], understanding bat foraging behavior over different rice growth stages may reveal which insect guilds bats are likely consuming more locally. Thus far, however, previous work on bats as natural enemies in agricultural areas has emphasized bats’ response to large-scale landscape elements [41,42,43]. Attention to the dynamics of bats and rice insects at large scales is important since both can move impressive distances (several thousands of kilometers) at extremely high altitudes [16,44]. However, farmers are increasingly encouraged to adopt practices that increase local-scale habitat complexity (e.g., bund crops) and thereby enhance the natural regulation of crop pests by providing alternative food sources and refuges for predators [7,15,45,46]. Therefore, it would be valuable to know how bats—especially those in edge- and narrow-space guilds—respond to local-scale habitat changes.
Here we assess the response of bat guild activity to local-scale habitat heterogeneity in a lowland rice-based agroecosystem in Luzon, Philippines, during two wet seasons. This is the first study of bat foraging activity over rice in the Philippines, as well as the first study focused on ground-level bat activity associated with rice in Southeast Asia. We hypothesized that guild-specific bat activity would differ with rice growth stage. Specifically, we predicted that late-stage foraging activity would be higher than early-stage foraging activity, since insect composition and abundance is positively associated with rice growth. Furthermore, we predicted that this stage effect would be strongest for narrow-space bats foraging close to vegetation, and less so in edge-space foragers. We also acoustically monitored bat activity from two 50-m-tall radio towers over four nights to gain further insights into the vertical extent of narrow- and edge-space foragers and to document open-space foraging activity in the study area.

2. Materials and Methods

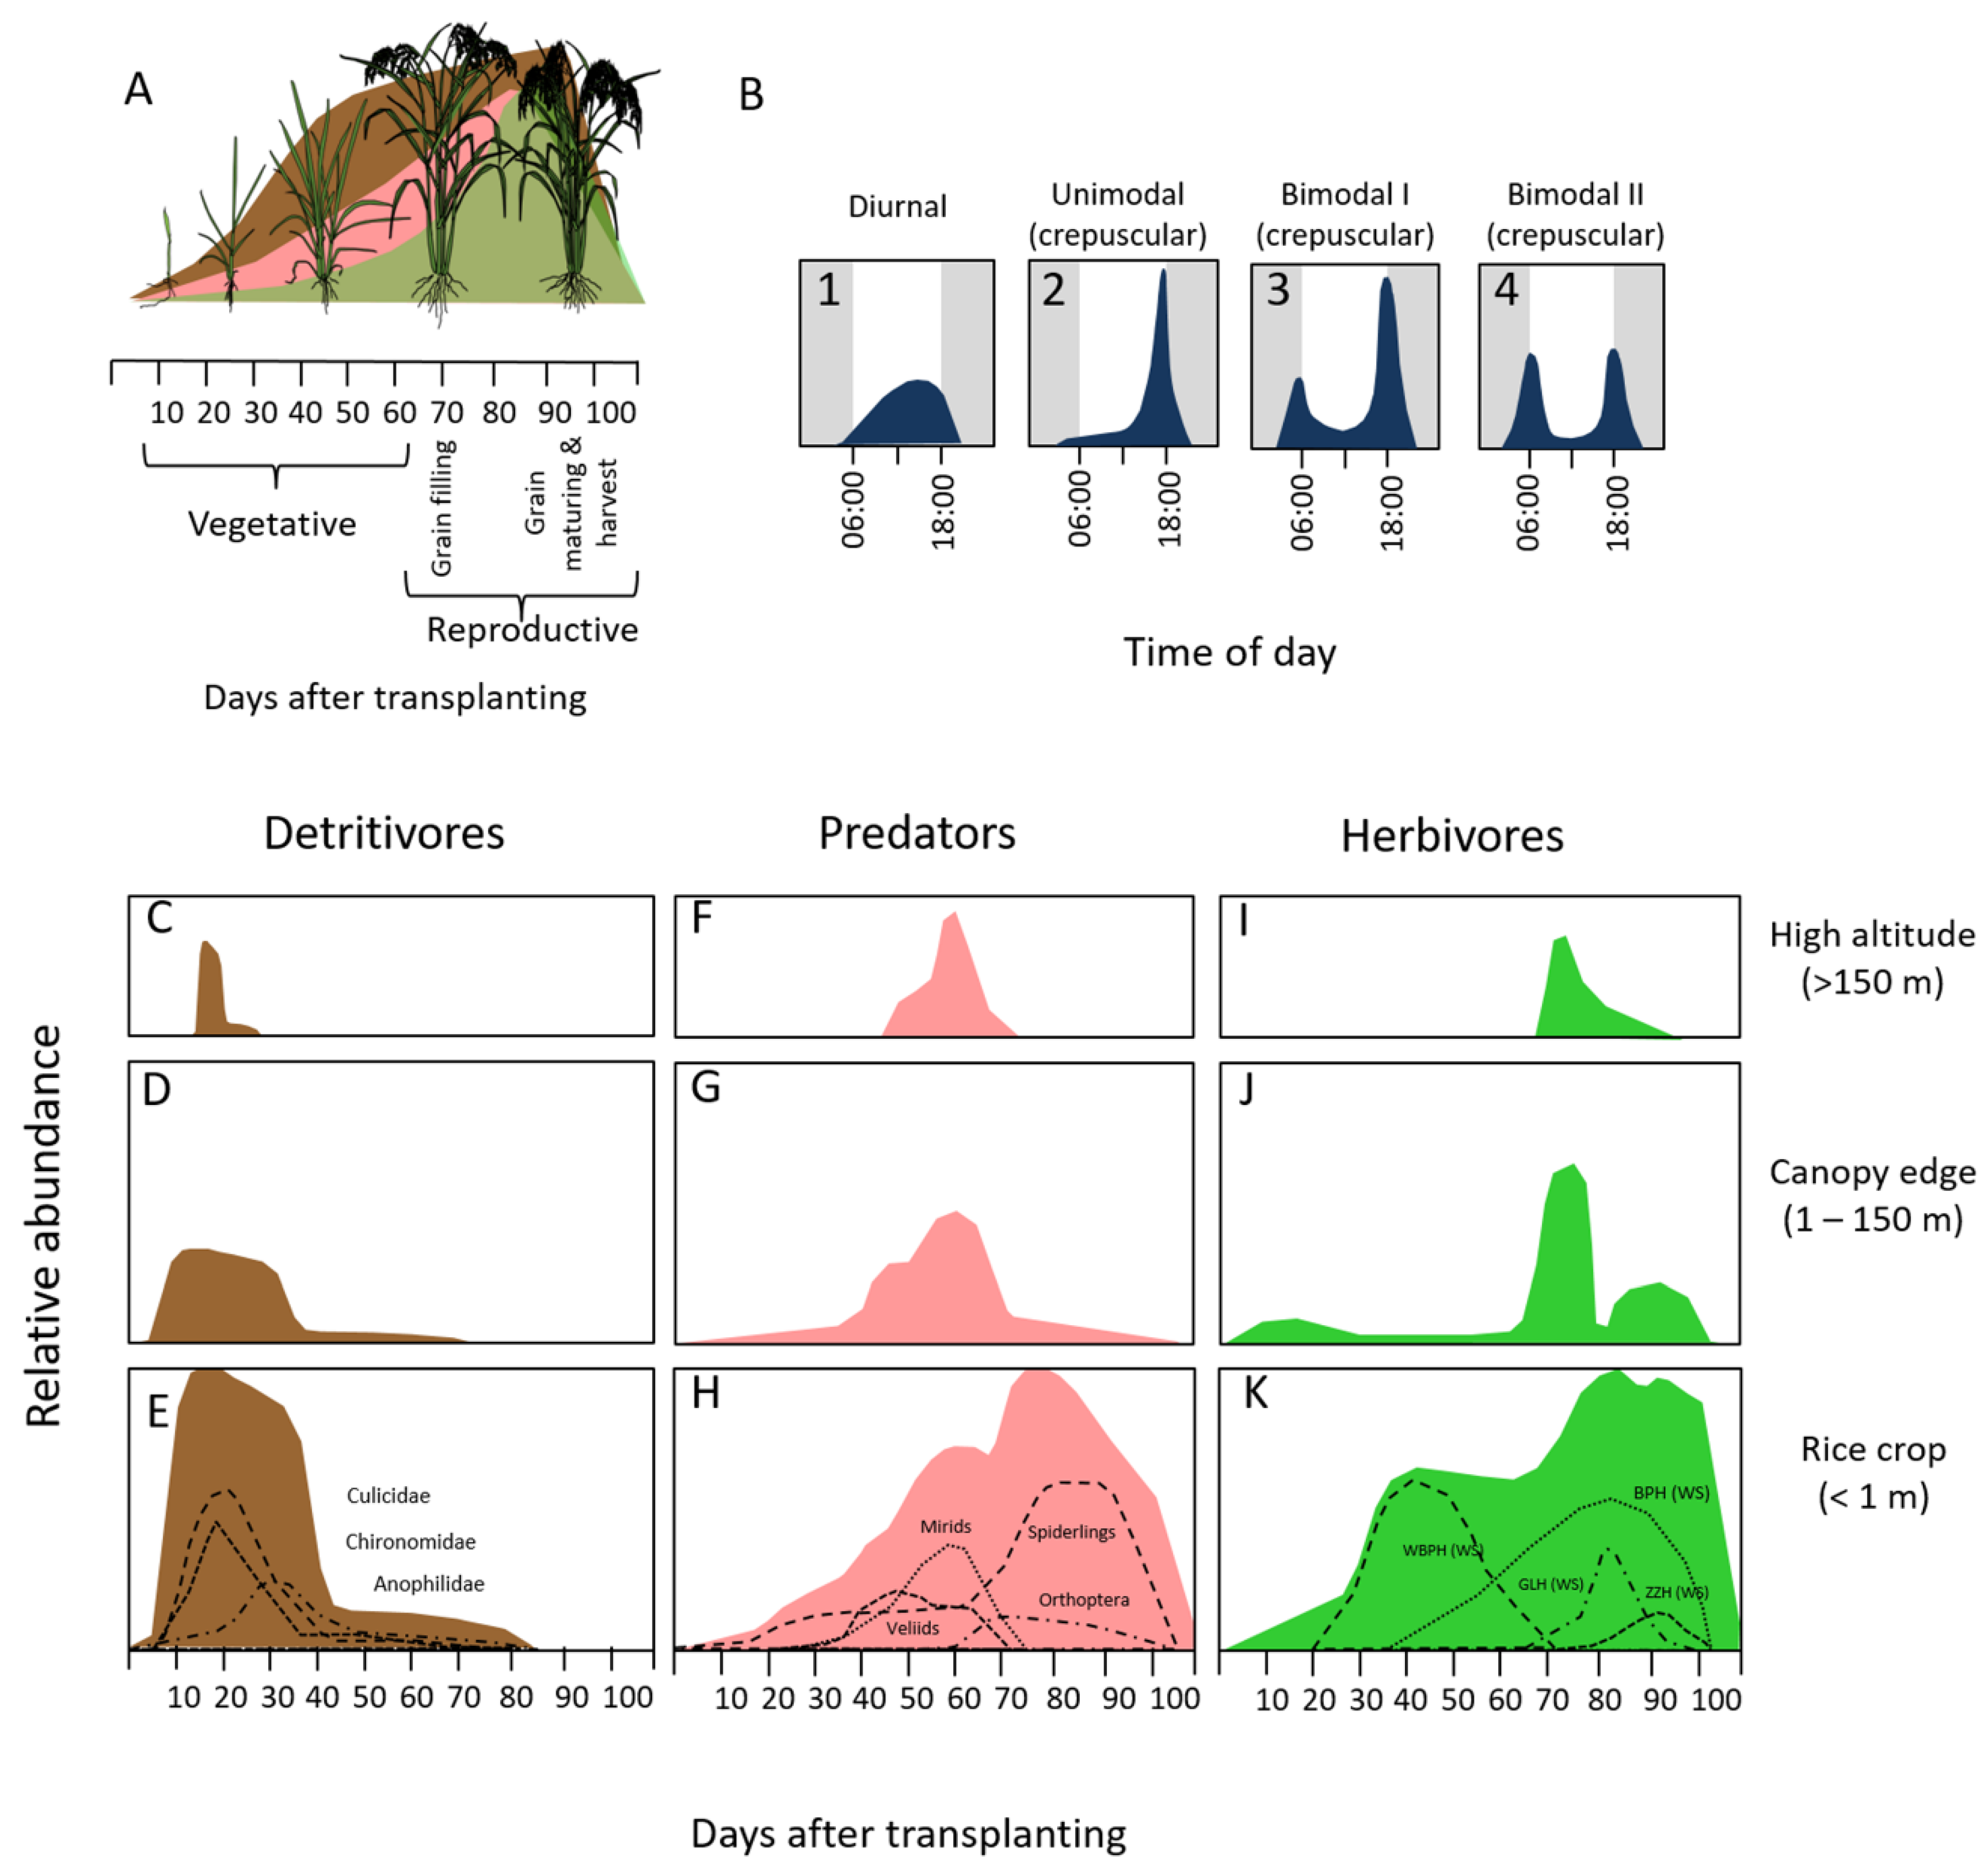
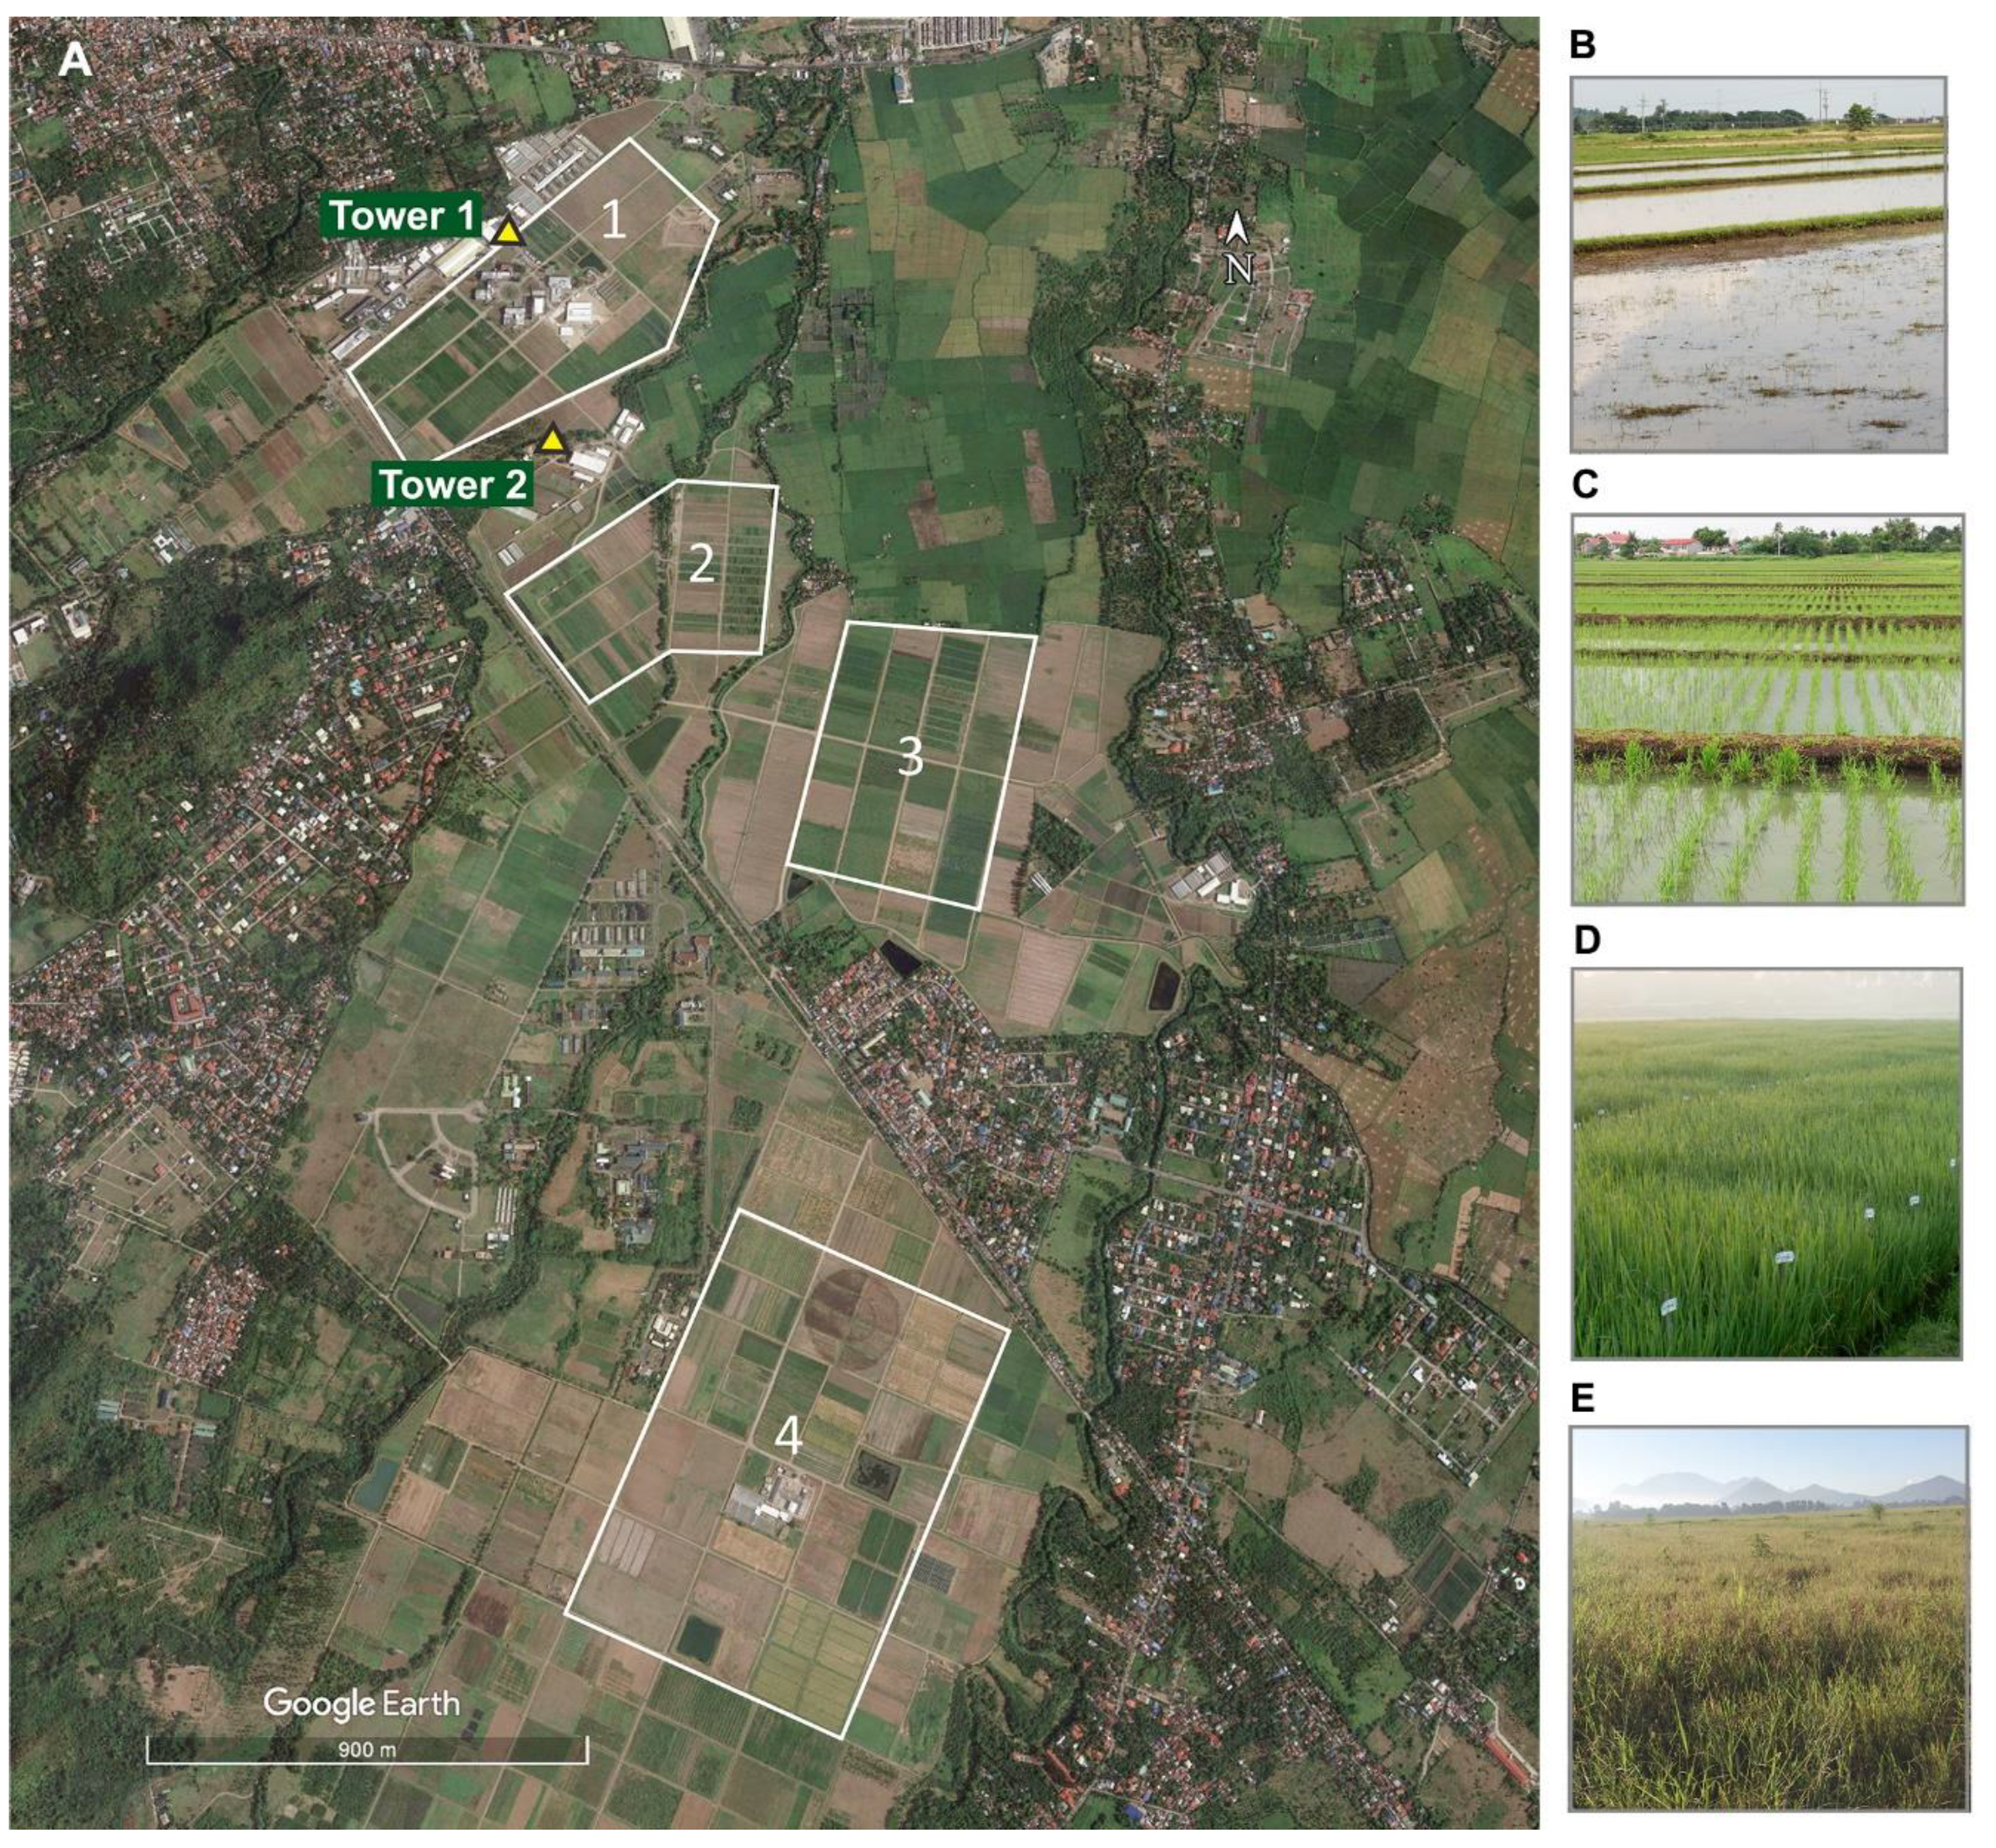
2.1. Field Site and Rice Growth Stages

We conducted this study within the International Rice Research Institute’s (IRRI) 200-hectare farm in Laguna Province, Luzon, Philippines (14.167774° E, 121.254547° N; Figure 2). The farm is in close proximity to a diversity of land use types, including residential (Los Baños city, 112,008 residents; 2015 census), lowland and montane second growth forest within the 4244-hectare Makiling Forest Reserve (ASEAN Heritage Site), coconut groves, agro-forest and privately owned irrigated rice fields to the east and northeast. This makes our study site typical of other lowland rice growing areas in the Philippines, especially on Luzon Island. Sampling occurred during the second month of the wet season (July–August) rice crop when planted rice was prominent in the landscape. The average daily weather (2015, 2016 ± standard deviation), including temperature (28.5 ± 0.5 °C, 29.3 ± 0.8 °C), rainfall (8.0 ± 15.16 mm, 3.5 ± 7.0 mm), and wind speed (1.1 ± 0.27 m/s, 1.1 ± 0.6 m/s) were similar during the 2015 and 2016 sampling periods (IRRI Climate Unit), and were similar to annual averages for the region [57]. Despite its intensive cultivation, the IRRI research farm maintains a high diversity of vertebrate and invertebrate wetland species [2,4,39].
During both years, rice seedlings were manually transplanted within roughly a six-week window in the wet season (July–August). This resulted in a patchwork of fallow and planted fields at various stages of vegetative growth (i.e., ranging from seedling stages to panicle initiation) during the study period. This offered an opportunity to sample bat activity over various stages of rice production simultaneously, from fallow rice fields dominated by grasses (Figure 2E), to rice paddies approaching the reproductive growth stage (Figure 2D). Varieties, including the size of patches vary considerably as plant breeding is a major component of the institute’s research program. However, the management of rice crops by a single dedicated support team ensures that chemical inputs are generally consistent.

2.2. Acoustic Sampling

On 11 nights in 2015 (between 27 July and 7 August) and 10 nights in 2016 (between 21 July and 7 August), two to four ultrasonic detectors were placed beside rice fields that were at various rice crop production stages. We sampled four stages, including flooded fields during land preparation (Water; Figure 2B), seedling/early vegetative stage (Early, <50% cover; Figure 2C), late vegetative stage (Late, >50% cover; Figure 2D), and fallow fields that had dense grassy vegetation (Grass; Figure 2E). Each night, we opportunistically selected rice fields within one of the four main areas of the research farm (Figure 2). We placed the ultrasonic detectors in pairs—with one of each pair placed in a flooded rice field with low vegetation and canopy cover (either Water or Early) and the other placed in a flooded field with high vegetation and high canopy cover (Grass or Late) (see Table A1 for sampling details). In total, we acoustically sampled approximately 130 hectares of the IRRI farm.
Regardless of the year, the calibrated microphones were placed at an approximate height of 1 m above the ground, pointed at 45° above horizontal, and programmed to passively monitor between 18:00 and 06:00 h. On any given night, all detectors were in the same research farm area, but were a minimum of 100 m apart (173 median distance). Detectors were moved nightly. During 2015, we deployed two to four calibrated Anabat SD2 passive monitoring detectors (Titley Scientific) in weather-proof housings (plastic ammunition box with a short PVC elbow connector) over 11 nights, including 5 detector-nights in Water fields, 14 detector-nights in Early fields, and 17 detector-nights in Late fields. During the 2016 sampling, we deployed two full-spectrum ultrasonic detectors (SM4Bat, Wildlife Acoustics) with SMM-U1 microphones (with directional horns to protect microphones from rain) for 10 nights, over 11 nights, including 1 detector-night in a Water field, 8 detector-nights in Early fields, 8 detector-nights in Late fields, and 2 detector-nights in a Grass field. In 2016, we added Grass sampling to expand the range of available habitats sampled and switched to full-spectrum detectors in order to capture echolocation pulses nested in background noise more reliably than is possible with a zero-crossing analysis system. On four additional nights, we mounted one detector each on two 50-m tall radio towers on the farm (0.62 km apart; Figure 2). The SMM-U1 microphones (with directional horns) were pointing 90° from vertical, horizontal to the ground. The directional horns result in a 20–25 dB loss in sensitivity for signals at 20 and 40 kHz, respectively, at 90° off axis (https://www.wildlifeacoustics.com/images/pdfs/UltrasonicMicrophones.pdf), which minimized the potential overlap in the vertical space sampled with microphones placed near the ground. On all nights, the SM4Bat detectors were programed with the following settings: gain = 12 dB, sampling rate = 256 kHz, minimum duration = 1.5 ms, minimum trigger frequency = 16 kHz, trigger level = 12 dB, trigger window = 3 s, maximum length = 5 s. This resulted in 744 detector-hours—408 in 2015 and 240 at ground level and 96 at 50 m in 2016. While the detection distance from the microphones will vary depending on bat source levels and their orientation to the microphone [58], microphone sensitivity, and environmental conditions (temperature and relative humidity) [59], we can safely assume that we were only detecting bats < 50 m above the rice. For example, the SMM-U1 microphone theoretically can detect a 40 kHz-calling bat with a 94 dB SPL source level at around 20 m when it is flying on-axis with the microphone [60].

2.3. Assignment of Bats to Functional Guilds

The functional role of bats as consumers of insect pests depends on adaptations for prey localization and capture in different habitat types [28,29,61]. Twenty-eight insectivorous bat species have been documented in Laguna Province [27,62]. We classified those potentially active over IRRI rice fields (i.e., excluding those with strong forest associations that have not been documented over rice) into three previously described functional guilds according to their habitat use and corresponding echolocation call characteristics: open-space, edge-space, and narrow-space foragers [28]; Table 1. However, unlike Schnitzler and Kalko [28], we grouped potentially trawling species (i.e., those capturing insects either on or very near the water surface) in the genus Myotis as narrow-space foragers rather than edge-space trawling bats. This scheme aligns each guild clearly with relative vertical air space above the ground.

2.4. Analysis of Echolocation Calls

Given the uncertainty of species-level auto-identification algorithms, especially in a region where robust call libraries are lacking [64], poor signal to noise ratios due to ultrasonic insect chorusing in the rice paddies (Tettigonidae), and our desire to document feeding buzzes (i.e., rapid series of acoustic pulses typically preceding an insect capture) that are generally low intensity, we manually inspected every recording. We defined a bat pass as a sequence of greater than two calls within one saved file (maximum length = 15 s (2015) and 5 s (2016). However, for the 2015 Anabat-generated zero-crossing recordings we expedited this process by first scanning the files in Analook W software (Chris Corben, version 4.2n 2017) with custom-made filters. Filters separated the files with bat calls (i.e., >2 calls minimum, at least 1 ms in duration) into groups based on characteristic frequency (i.e., portion of the call with the least frequency modulation). Subsequently, all files were inspected to confirm classification, document taxon-specific feeding buzzes, and low-intensity, broadband calls characteristic of Myotis spp. that often are excluded by the filter. Full spectrum call files were manually inspected within Avisoft-SASLab Pro (version 5.2.12, Avisoft Bioacoustics; settings: FFT = 512, frame = 75%, window = Flat top, frequency resolution = 0.5 ms) for phonic types and the presence of feeding buzzes.
In order to sample a smaller volume of air space around the tower-mounted microphones and avoid counting passes from bats flying closer to the ground, we amplitude filtered the bat passes using Avisoft SASLab Pro batch processing by setting the element detection at −30 dB from full scale (i.e., the maximum sine wave without overloading). This resulted in a subset of the hand-vetted files with bat passes present for sorting into phonic type classes. Given differences in peak frequencies, the “detection volume” will vary among phonic types due to frequency-dependent atmospheric attenuation. Nevertheless, these data should more accurately represent the bat activity at tower-level than the hand-vetted files.
Bat passes were classified as belonging to the open-space guild if they were long duration (>5 ms) and low frequency (<29 kHz). Passes were classified as edge-space guild if they were frequency modulated (i.e., each call sweeps through a range of frequencies), had a distinct quasi-constant frequency terminal end to the call, and had a peak frequency (frequency with most energy) or characteristic frequency > 30 kHz (see Table 1). Narrow-space guild calls included all broadband, short duration (≤3 ms) calls characteristic of gleaning/trawling FM bats (e.g., Myotis horsefieldii) [65] and constant frequency (i.e., pure tone) calls with either or both initial and/or terminal downward sweeps (i.e., Hipposideridae, Rhinolophidae). Some bats have highly flexible call structures, which they modify according to environmental clutter and prey density [66]; nevertheless, our categorization of guilds based on call structure is intentionally conservative to encompass this variability. Species within the families Rhinolophidae and Hipposideridae, as well as Myotis spp. (M. horsfieldii and M. rufopictus), and Miniopterus australis [62,63] are acoustically distinct; therefore, we reported these phonic types separately in addition to their inclusion in the pooled-species guilds.
For each phonic type—either functional guild or acoustically distinct species—we generated three response variables. These included the total bat activity, calculated as the total number of passes per hour, and bat occurrence, calculated as the proportion of one-minute intervals containing a bat pass within each hour (i.e., number of bat-present minutes/60 min). Acoustic activity is not equivalent to bat density; however, the latter index minimizes the bias introduced by circling bats [67]. Therefore, total bat activity provides information on intensity of use (i.e., time spent flying over each growth stage), and bat occurrence provides a better estimate of bat density. We also calculated the total number of feeding buzzes per hour for each phonic type, and transformed this into a foraging intensity index by relating the number of buzzes per hour to the total number of passes per hour (i.e., number buzzes/total number passes).

2.5. Bat Capture and Recording Reference Calls

To confirm species identification of acoustically recorded bats and to record voucher calls when possible, we opportunistically captured bats on and adjacent to the IRRI farm using mist nets and roost searches, especially in buildings. We used 6-, 12- and 20-m-long (2.6 m high) mist nets set in various locations, including parallel to the rice field along the bund, across the rice field from bund to bund, over a water reservoir, and across a small stream that ran through the farm. Netting occurred during peak bat activity between 18:00 and 22:00 h. Our total netting effort over three years (2014–2016; we began documenting species present prior to the acoustic sampling) equaled 117 net-hours (net-hours = one 6 m net open for one hour). Roost searches consisted of visual observations and inquiries with building security personnel. We took standard measurements of captured bats and used Ingle and Heaney [68] for species identification. Bats were released at the site of capture. Reference recordings of four Scotophilus kuhlii were taken by releasing them over a stationary SM4Bat detector with SMM-U1 microphone at dawn, just after we saw the last bat in the sky and before the sun came up. One individual of Myotis rufopictus was recorded in a room (approximate width = 4 m, length = 8 m, height = 3 m). Taphozous melanopogan calls were measured from free flying bats outside their roost. M. rufopictus and T. melanopogan calls were recorded using an UltraSoundgate ultrasonic recorder (Avisoft Bioacoustics). We quantified call parameters from spectrograms generated in Avisoft SASLab Pro (FFT = 256, Window = Flat Top, Temporal resolution = 0.51 ms, 50% overlap). We used the automatic parameter measurement tool to measure the peak frequency at the start, end and peak amplitude of each call. Duration was measured at −20 dB below the maximum amplitude. Bandwidth was calculated by subtracting the end from the start peak frequency.

2.6. Arthropod Sampling

In order to assess the composition of available insect prey over rice fields during acoustic monitoring and to test for crop stage differences in aerial insect abundance, we used aerial sweep netting over Early and Late vegetative stages. On three evenings (between 19:00 and 20:00 h) and one predawn (between 04:30 and 05:00 h) in 2015, and on five evenings (between 19:00 and 20:00 h) and one predawn (05:00 h) in 2016, we walked along a bund while sweeping a net (diameter = 42 cm) 40 times at a height of approximately 1 m over the rice. Samples from Early and Late stages were collected either simultaneously by two people in each field (2016) or sequentially by one person (2015), and each pairing was selected within the same area of the research farm. Eight different fields across the farm (2015: Sites 1–3, 2016: Sites 1–4) were sampled in both years. We transferred captured insects to vials containing 80% ethanol. Insects were identified to the highest taxonomic level possible by professional technicians using an extensive reference collection that has resulted from years of entomological research at IRRI.

2.7. Statistical Analysis

In order to provide a summary of overall activity in all crop production stages sampled, we standardized for differences in sampling effort by calculating the relative total activity (total number of passes/sampling hours) for each phonic type (by guild and species). Given limited sampling nights in Water and Grass growth stages, we only included Early and Late growth stage sampling in our statistical models. We analyzed the data for each year separately, because we deployed different acoustic detectors each year. When there were two detectors in the same rice stage within a site (2015), we averaged the values. We tested the distribution fit of response variables, including total bat activity, proportion bat occurrence, and proportion foraging intensity, and regression residuals for each guild using histograms and qqplots in R [69]. Edge-space proportion occurrence was the only response variable that approximated a normal distribution, and bat activity and foraging activity recorded from towers approximated a Poisson distribution after a square root transformation. All other variables were transformed into binary response variables for statistical models (i.e., presence or absence of a pass or buzz per sampling hour) for analysis.
The responses of bat guild activity to rice stage (Early vs. Late) and time of night (12 h intervals between 18:00 and 06:00 h) were analyzed using generalized linear mixed effect models using the lme4 package in R (lme4 version 1.1-18-1). We used lmer to test the response of edge-space occurrence to stage and time. We used glmer to model the Poisson response of edge-space total activity using a log-link function, and the binomial responses of edge-space foraging, narrow-space occurrence, and open-space occurrence using a logit-link function. There were too few narrow-space and open-space feeding buzzes for analysis. For all models, site was set as a random effect given that each area of the experimental farm had unique attributes that may influence bat activity, such as the size and configuration of fields, number of adjacent buildings, and distance from forest. We also set night as a random effect in all models. All glmer models were fit with maximum likelihood using the Laplace approximation. We tested for over-dispersion using the overdisperse_fun function. For tower recordings, we tested the response of bat activity and foraging activity separately for each guild (edge- and open-space) on the fixed effects of hour and tower using a generalized linear negative binomial model. The contributions from different insect feeding guilds (i.e., detritivores, herbivores, predators) to the aerial arthropod communities over rice fields were examined using three dimensional contingency tables with insect guild, crop stage and time of day as dimensions. Tests of mutual and partial independence as well as comparative frequencies were conducted using chi-squared analyses. Samples from the 2015 and 2016 wet seasons were combined because of low numbers of insects captured.

3. Results

3.1. Bat Assemblage

Our netting effort over and adjacent to rice fields yielded 28 captures of three species, including the Philippine orange-fingered myotis (Myotis rufopictus, 1 individual), the lesser Asian house bat (Scotophilus kuhlii, 24 individuals), and the Javan pipistrelle (Pipistrellus javanicus, 2 individuals) (Table 1). We also captured one arcuate horseshoe bat (Rhinolophus arcuatus) in a net across a small stream. We located two large Scotophilus kuhlii colonies in buildings near the research farm, and captured 77 individuals (adult females = 26, adult males = 28, juveniles = 23) exiting or returning to the roost. Additionally, we located a small colony of Pipistrellus javanicus in another building, from which we captured 10 adult females.

3.2. Bat Activity by Rice Stage and Time

During both sampling years, we acoustically detected representatives from each bat guild in all sampled growth stages at ground level (Table 2). Edge-space bat calls comprised 89% of all calls recorded, followed by open-space (10%), and narrow-space (1%) bat calls (Table 2). Myotis spp. calls made up the largest proportion of detected narrow-space activity, followed by Hipposideros diadema and Rhinolophus macrotis. The relative total and foraging activity of edge-space bats during both years was highest over early stage rice, followed by water and late stage rice. Narrow-space and open-space bats exhibited substantially lower relative activity levels across all habitats than edge-space bats.
Total activity, occurrence and foraging intensity of edge-space bats was significantly higher in early compared to late stage paddies in both sampling years (Table 3, Figure 3 and Figure 4). This difference across all response variables was associated with hour of the night in 2015, but not in 2016. Specifically, bats had an early-stage bias only during the first half of the night. In contrast, narrow-space bat presence was not associated with stage or hour. There was a significant stage, not hour, effect for open-space foragers; bats were more likely present over early stage compared to late stage paddies.

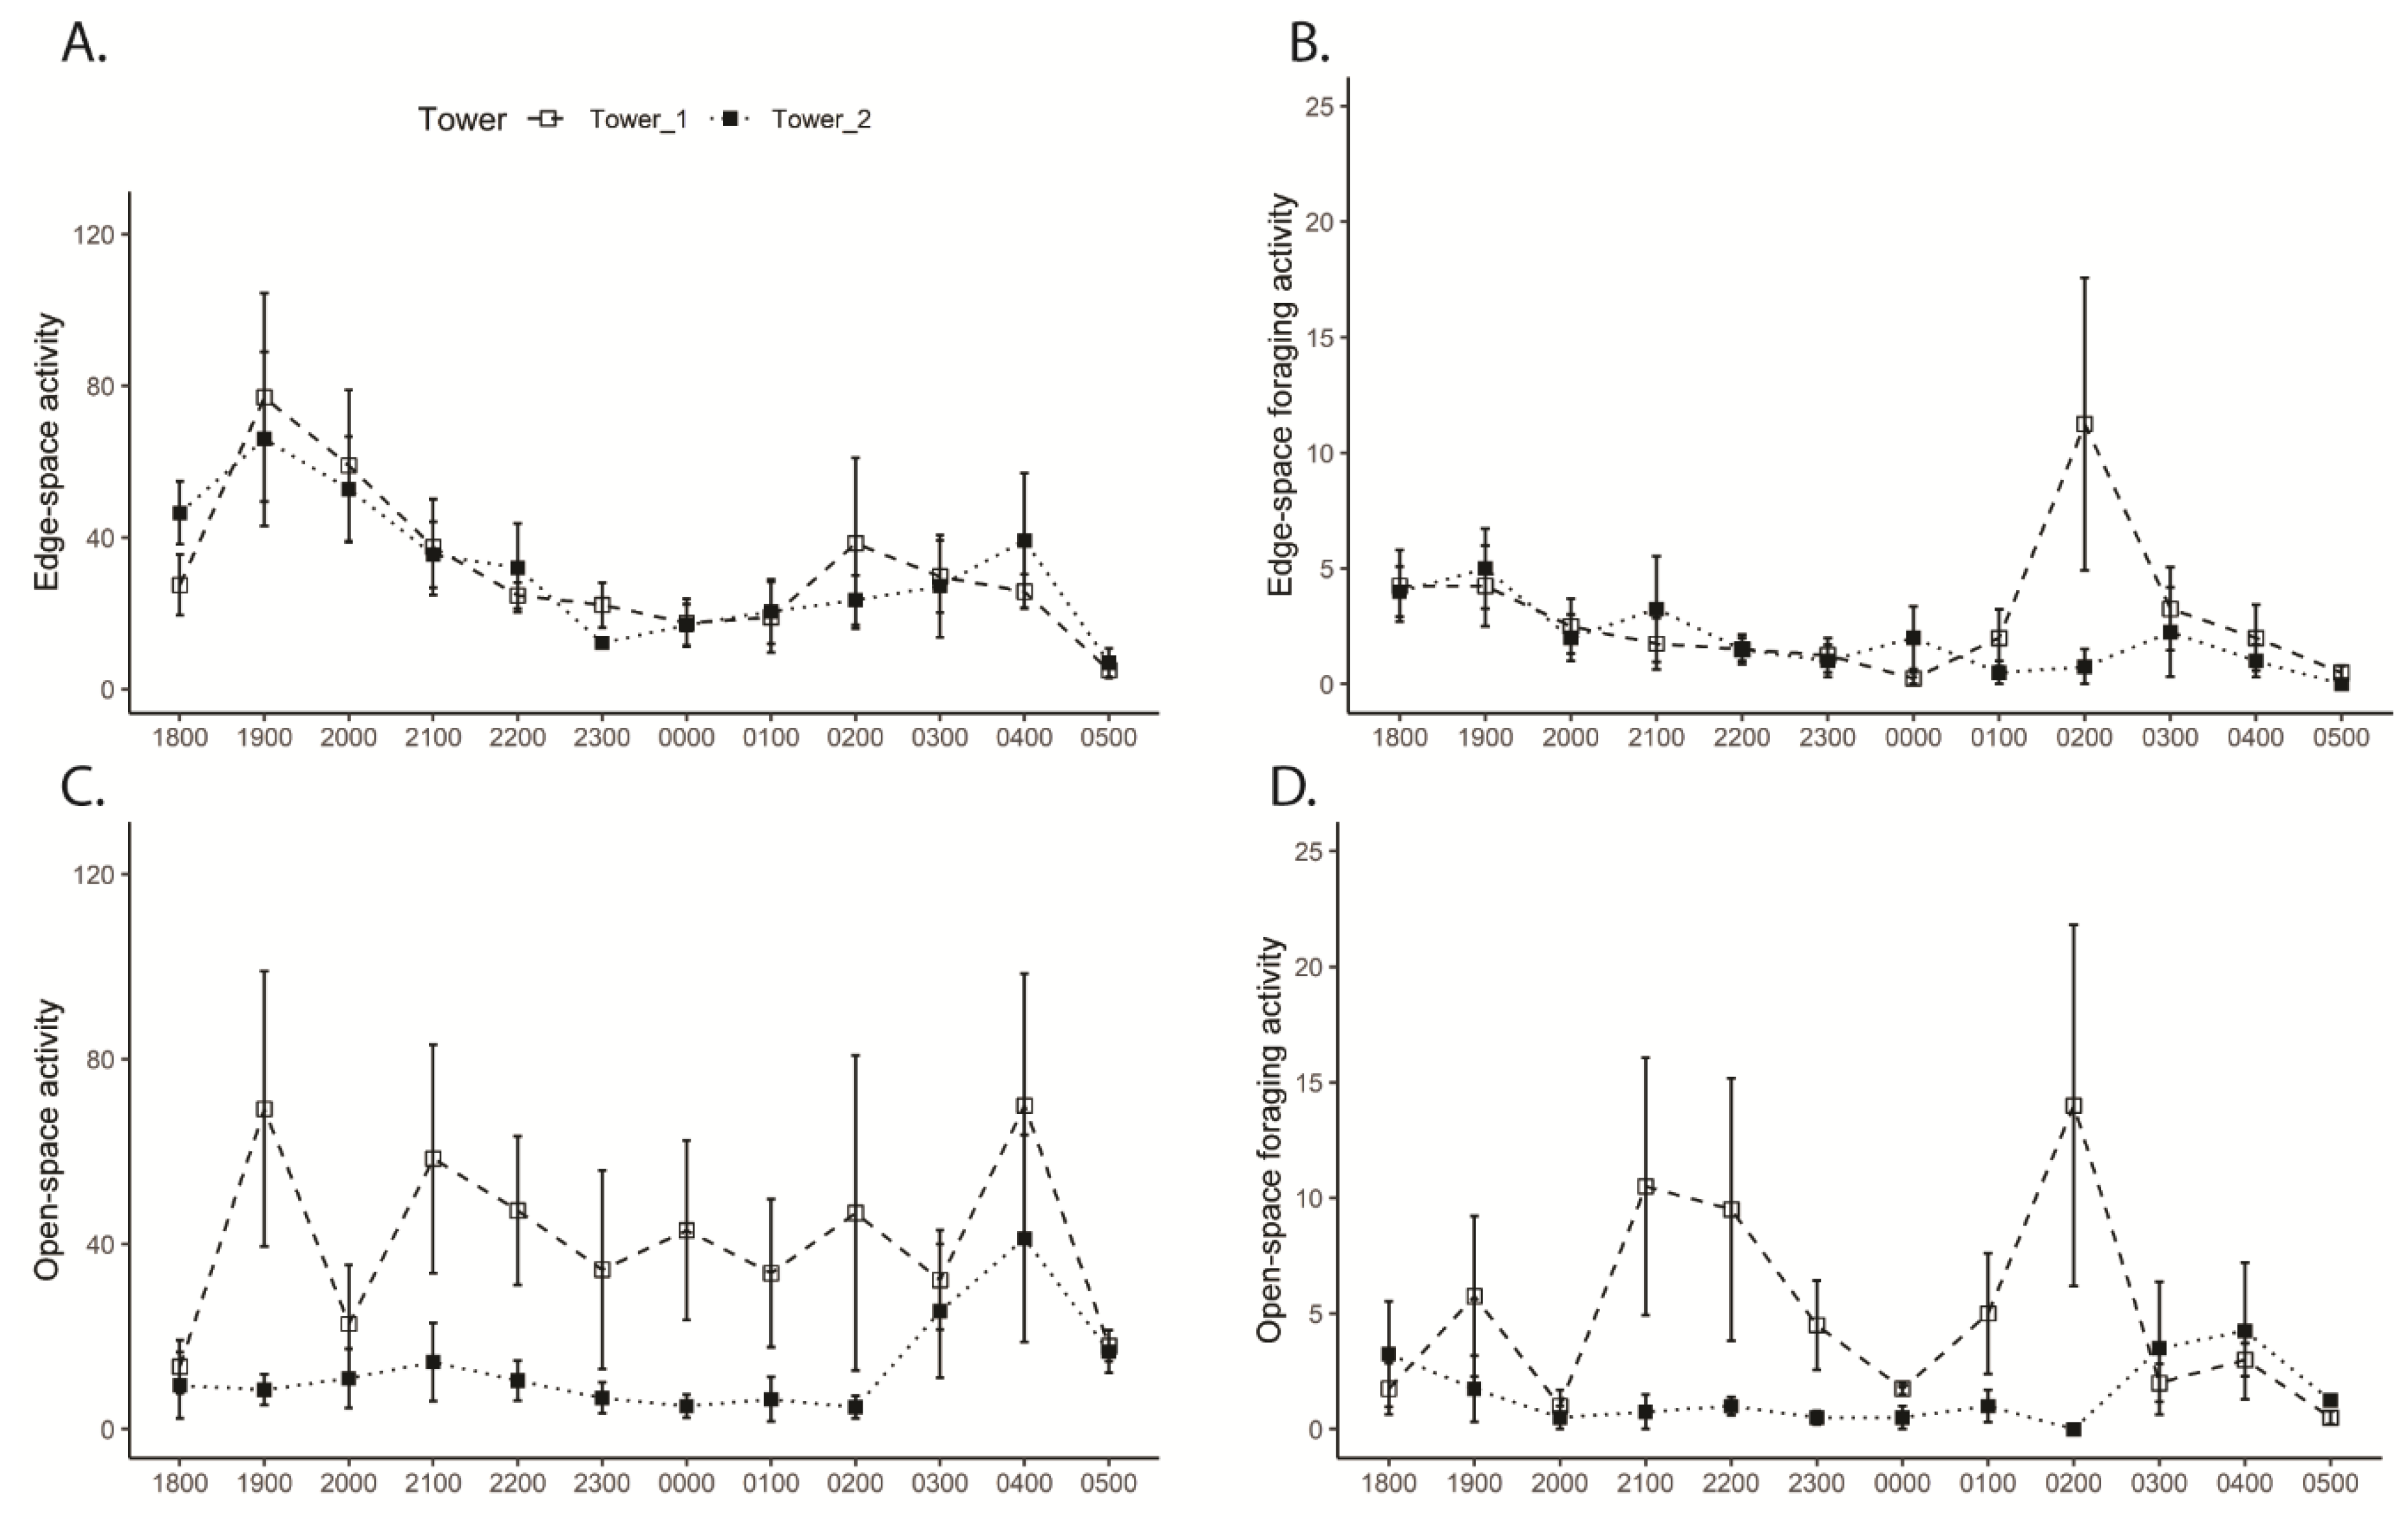
3.3. Tower Bat Activity

Only edge-space (excluding Miau) and open-space bats were recorded from the 50 m-tall towers (Figure 5). Edge-space total activity and foraging activity decreased over the night (estimate = −0.101, P < 0.001; estimate = −0.087, P = 0.043, respectively), but did not differ between towers (estimate = −0.007, P = 0.966; estimate = −0.535, P = 0.073, respectively; Figure 5A,B). Open-space total activity and foraging activity did not differ with hour (estimate = 0.052, P = 0.102; estimate = 0.006, P = 0.880, respectively), but was higher at tower 1 than tower 2 (estimate = −1.170, P < 0.001; estimate = −1.1780, P < 0.001; Figure 5C,D).

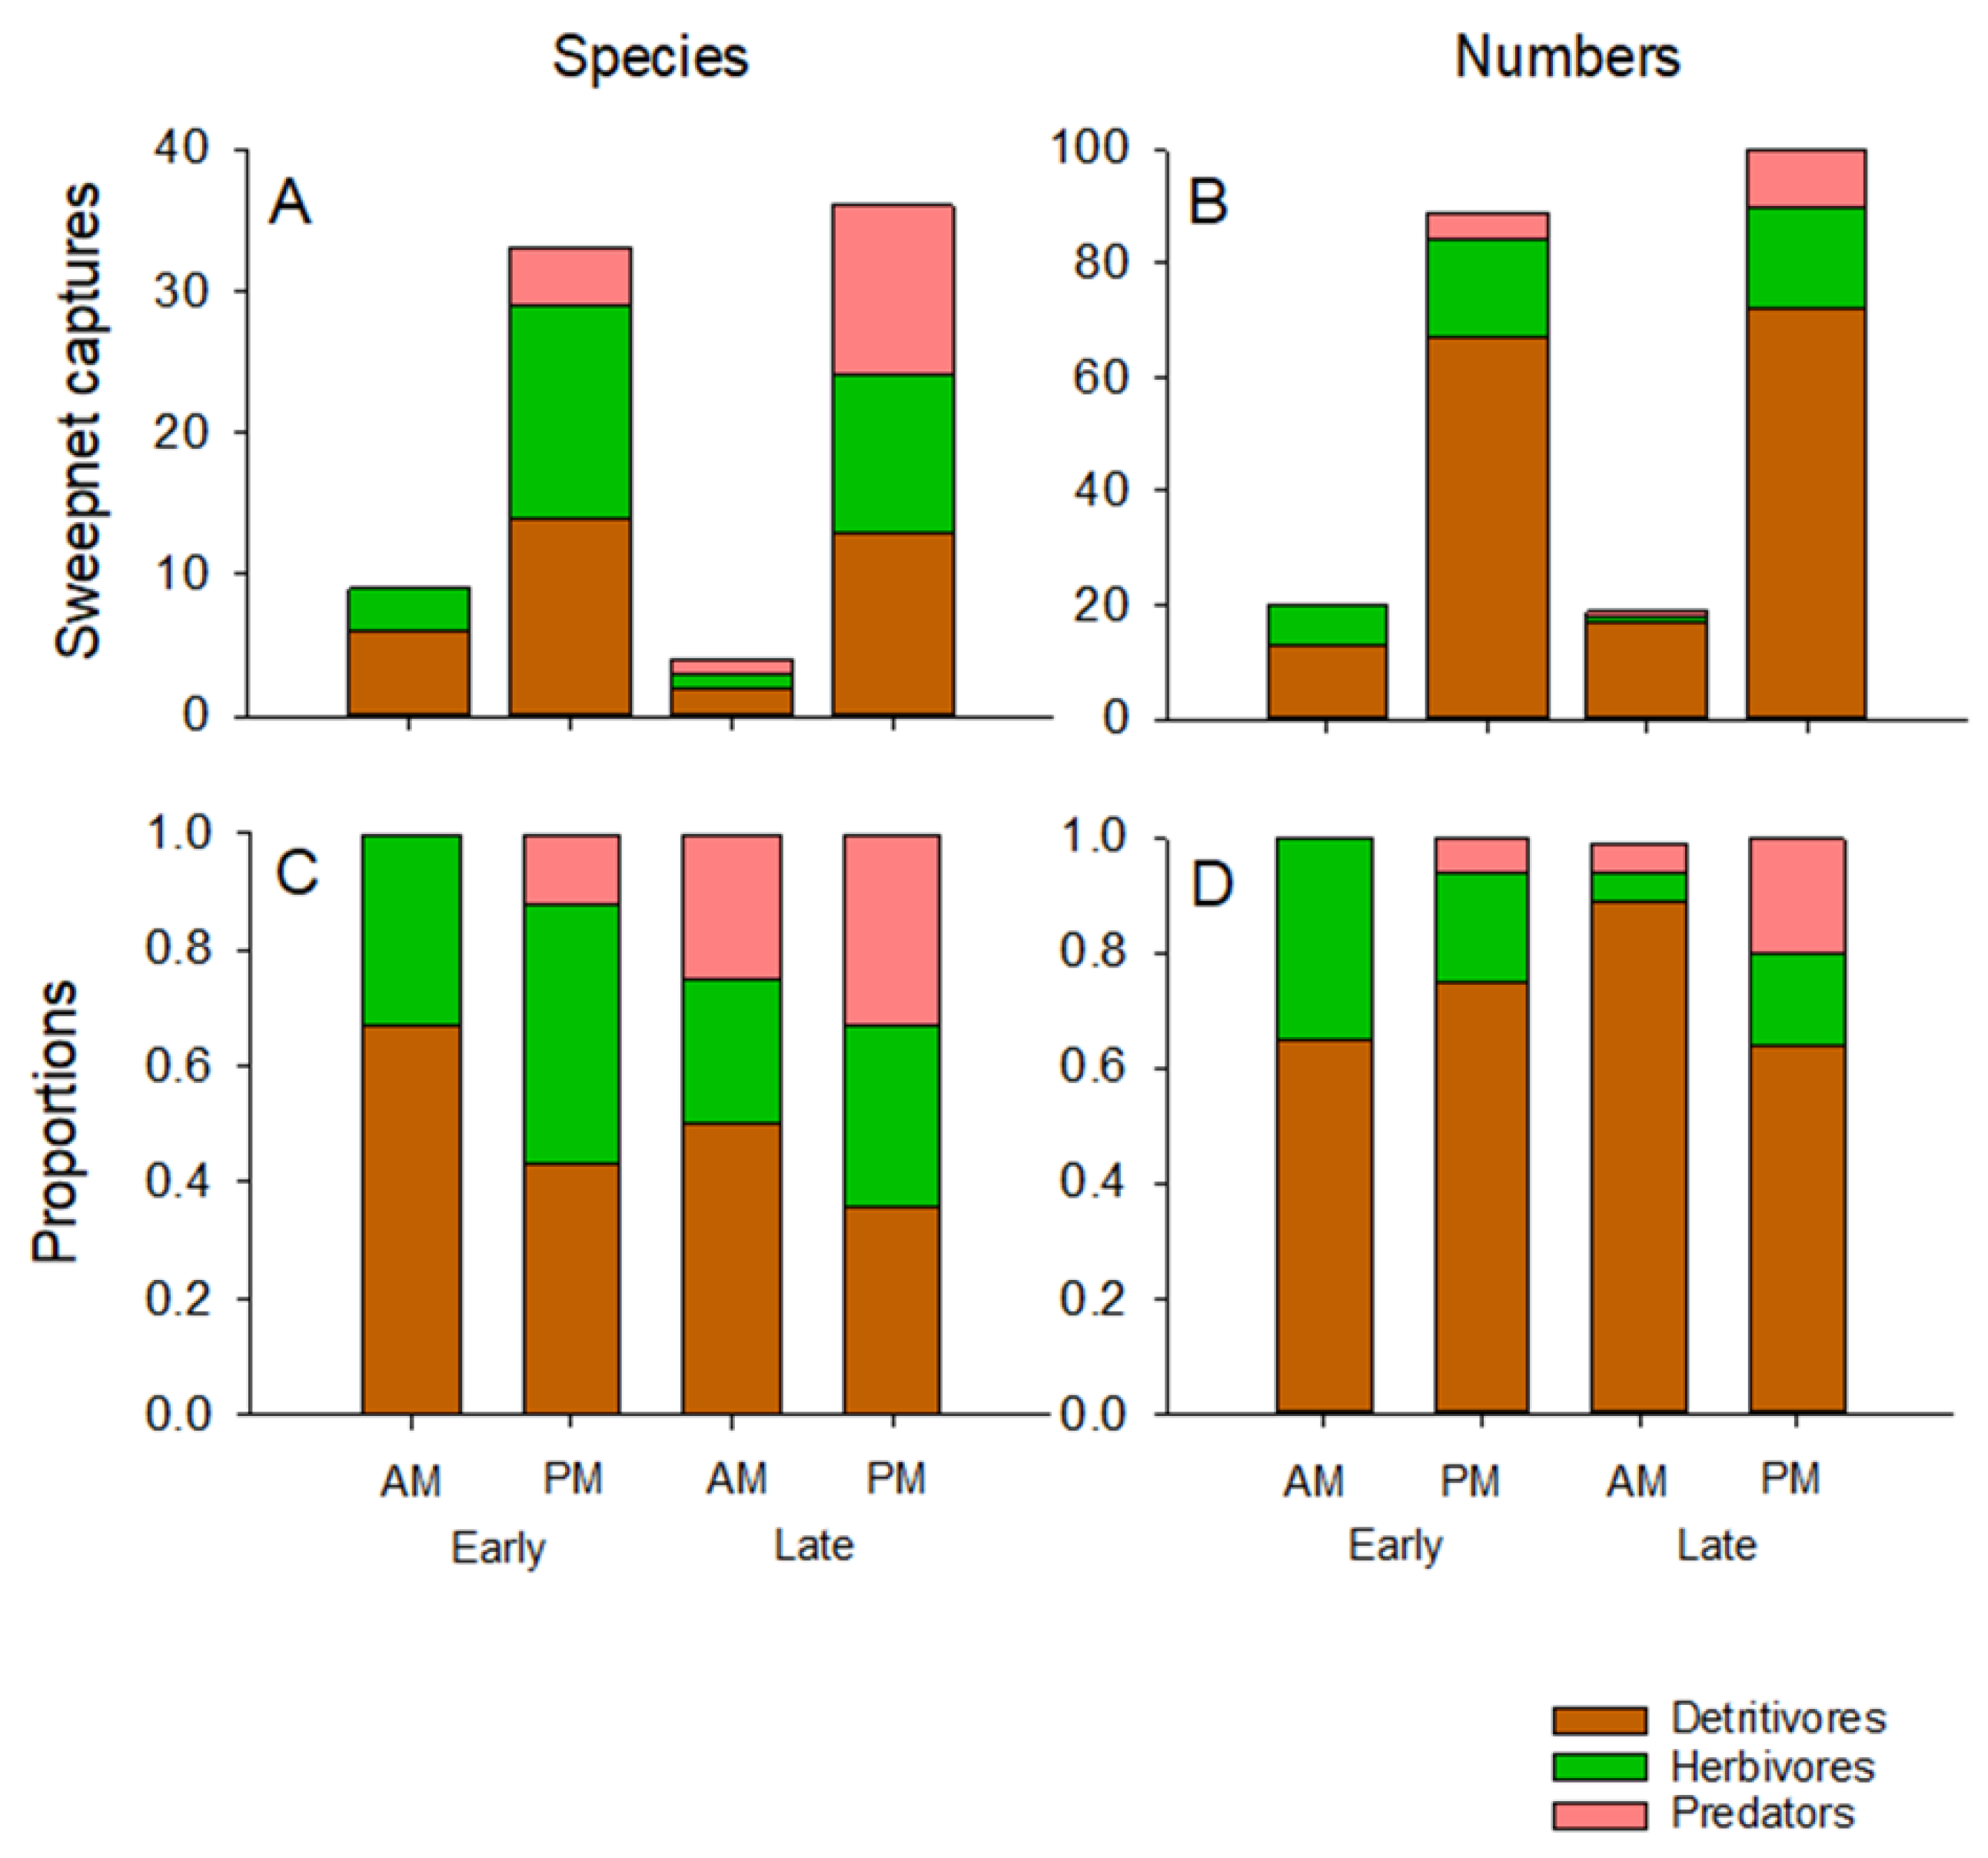
3.4. Aerial Arthropod Abundance and Composition by Stage

Only 240 arthropods were captured during the sweepnet sampling. Midges (Culicidae) were among the most commonly captured species (Table A2). The frequencies of species representing each guild were not independent of time of day or crop stage (species: χ2 = 8.707, P = 0.121; Figure 6A), but the numbers captures across guilds did differ according to time of day and crop stage (numbers of individuals: χ2 = 19.098, P = 0.002; Figure 6B). This was due to a higher abundance of detritivores (making up 64–89% of captures), particularly midges in all samples despite relatively lower detritivore species richness in the samples (36–67%) and declining relative richness of the detritivore group during the late crop stages (Figure 6C,D).

4. Discussion

Overall, this study revealed a rice growing area with high bat activity and—based on phonic diversity—a rich assemblage of insect consumers comprised of bats in all three functional groups. However, edge-space bats were by far the most frequently recorded guild at ground level, and caught in mist nets. While most recorded species were expected, one represented a new record for Laguna Province (Myotis rufopictus), recorded previously from adjacent Quezon Province [70]; and others were surprising given that they are forest-associated species (Rhinolophus macrotis and Hipposideros diadema) [27]. We could not identify one Rhinolophus-like echolocation call (i.e., constant frequency with initial and terminal frequency-modulated sweeps) to species; however, it had a peak frequency similar to another forest species, R. rufus, recorded on Bohol Island (peak = 44 kHz; [63]). These data highlight both the importance of rice-dominated landscapes for bats, and the potential importance of bats as mobile consumers of rice-associated insect pests in the Philippines.
We predicted that edge- and narrow-space bats would be most active over late vegetative stage rice fields given that insect abundance accumulates with rice growth [10,38]; however, we found the opposite pattern in edge-space foragers that preferred early vegetative growth stages. Specifically, edge-space bats were more active, foraged more intensely, and were possibly more abundant (i.e., occurrence) over early stage fields. These bats also foraged at both dawn and dusk, when insects were also active over the rice fields, albeit at relatively lower levels at dawn compared to dusk. Edge-space bats respond to insect availability at landscape [71] and local-scales, e.g., [72,73]; therefore, it may be that insects available to bats are more abundant over early growth stages. However, our insect data show that aerial insects, especially adult detritivores (midges), are present over early and late vegetative stages equally, although this may be a consequence of our modest sampling effort. The early stage preference could also be a result of utilizing irrigated paddies for drinking, as bat activity is often associated with water [74]. However, this is unlikely given that edge-space bats exhibited a foraging preference (i.e., feeding buzzes) over early stage fields. Bats do emit a “drinking buzz” that lacks a terminal reduced frequency component (i.e., buzz II) [75], but our buzz counts included clear feeding buzzes indicating the bats were pursuing insects. Alternatively, bats may simply be avoiding the relatively complex background clutter of closed-canopy late stage fields. Complex background echoes can mask prey echoes, whereas smooth surfaces, such as water, can enhance prey echoes at close range [76]. This hypothesis is further supported by the low relative activity of edge-space bats over fallow grass-filled paddies. Or, it is possible that a combination of early stage prey availability, drinking, and late stage background echo avoidance all contribute to this behavior.
Regardless of the mechanism(s) driving the early-stage preference of edge-space foragers at ground level, this habitat preference has several implications for bats’ potential role as consumers of rice-associated insect pests. First, this early stage foraging preference, combined with insect guild-rice stage associations (Figure 1) and our own insect sampling, suggests that edge-space foragers are consuming more detritivores (and possibly arthropod predators) than herbivorous insects immediately over rice. Specifically, mosquitoes and midges begin emerging soon after transplanting and after the fields are flooded [47,53]. A landscape-scale study in Vietnam found that mosquito larvae and adults in houses adjacent to paddies were negatively associated with rice height and water depth [12], suggesting that mosquitoes may be at densities attractive to foraging bats during the seedling stage (although see [77]). Therefore, edge-space bat’s early-stage preference concentrates bat feeding in locations that may enhance their service as natural enemies of mosquitoes. Diet studies of common edge space species (i.e., Scotophilus kuhlii and Pipistrellus javanicus) are needed to test this prediction. Secondly, it has been suggested that ultrasound-hearing insect pests in the families Pyralidae and Noctuidae (e.g., stemborers and armyworms) may alter their behavior in response to a soundscape rich in bat echolocation pulses [78]. For example, the Indian meal moth’s (Plodia interpunctella, Pyrallidae) reproductive success declined when exposed to ultrasound pulses in the lab [79]. Our data show that the magnitude of the “soundscape of fear” effect on hearing insects is rice stage-specific, and may decline as rice matures. Third, just as local habitat complexity can influence rice-associated insects [80,81] and birds [8], our data highlight the influence of local-level habitat complexity in determining the composition and abundance of insectivorous bats foraging at ground level.
Unlike edge-space bats, narrow-space activity at ground level was relatively low and, in 2015, appeared to peak in the middle of the night. The absence of a distinct early evening foraging activity peak (prominent in edge-space activity), may indicate that they are not tracking overall aerial insect abundance that tends to peak at dawn and dusk over rice [71]. Narrow-space bats may be feeding on insects that are active in the middle of the night, such as many rice-associated moths [82,83,84]. Moreover, narrow-space bat echolocation is more clutter-tolerant [28], which would afford them access to prey on or immediately above rice—a zone that is functionally unavailable to the other two guilds. In fact, in Thailand, Myotis spp. were the most common bats recorded at ground level over rice [33], not the widespread edge-space foragers reported here. Rhinolophus macrotis, a horseshoe bat with large ears and a pure-tone echolocation call, made up a large proportion of total narrow-space bat calls. As a forest-associated bat [27,85], its regular activity over rice paddies was unexpected. However, this species is known to consume eared moths [86], which are associated with rice. In fact, virtually all of the economically important moth pests belong to families that have evolved effective anti-bat defenses—either ears (Pyrallidae and Noctuiidae) or defensive (or warning) clicks (Arctiidae)—to avoid bat predation [87,88]. Also surprising, was the regular occurrence of Hipposideros diadema, a large perch-hunting bat associated with forest, agroforest areas, and residential areas with vegetation for perching [27]. Myotis species were the most commonly encountered species within the narrow-space guild, and were detected foraging in all rice stages sampled. Lastly, while we provide clear acoustic evidence of narrow-space foraging over rice, we acknowledge that these data may be an under-estimate of total activity given that high frequency calls result in short-range detection, especially of low-intensity feeding buzzes. Moreover, we know little about these species’ foraging strategies, and whether they employ alternative sensory modes (e.g., passive listening) to detect and localize prey (e.g., [89]).
Acoustic monitoring from 50-m tall radio towers revealed edge-space and open-space bats actively foraging throughout the night. While we did not simultaneously monitor at ground- and tower-levels, these data suggest that the foraging zone of some edge-space bats at our site extends to at least 50 m above ground level (AGL). The possible exception may be Miniopterus australis, whose acoustically distinct calls were not recorded from either tower; however, we do acknowledge that this could be due to low sampling effort. Other than M. australis, the recorded calls assigned to the edge-space guild recorded from the tower were similar to those recorded at ground level with respect to peak frequency (mean ± s.d = 42.19 ± 2.57, n = 467; 41.63 ± 1.86, n = 529, respectively), duration (mean ± s.d = 6.46 ± 2.86, 9.45 ± 5.26, respectively) and bandwidth (mean ± s.d = 5.74 ± 6.37, 5.92 ± 5.86, respectively). Given these call characteristics and our capture records, we suspect that most of these calls at ground- and tower-level belong to Scotophilus kuhlii. In a high altitude bat survey in Thailand, S. kuhlii was not detected at 200 m AGL and was detected only once at 100 m AGL [33] suggesting that it may have an altitude limit around 100 m AGL. We also documented feeding activity of the open-space bat, Taphozous melanopogan, at tower level, which aligns with altitudinal records as high as 200 m AGL in Thailand [33]. The higher activity at Tower 1 may have resulted from artificial lighting around adjacent buildings, although edge-space foragers did not exhibit a Tower preference. Open-space bats were also detected at ground level, and unexpectedly, responded to rice growth stage. Given how few feeding buzzes were detected from ground-level recordings, this may indicate they were drinking from water-filled, open-canopy rice paddies. However, if this were the case, we might expect to have recorded drinking buzzes over paddies with exposed water. Video-based studies that visually capture behavior at ground level would confirm whether irrigated rice provides a water source for open-space bats.
Seemingly absent from the open-space forager guild were calls of free-tailed bats (Molossidae), specifically Chaerophon plicatus, which is an important natural enemy of planthoppers in Thailand [17,30,31]. Chaerophon plicatus calls recorded in Thailand overlap spectrally with T. melanopogan, especially at ground level where C. plicatus calls have a higher peak frequency [33]; therefore, we acknowledge the possibility for misidentification (which is why our analysis is at the guild level). Nevertheless, the call structure of T. melanopogan is distinct in having a downward sloping terminal component and often multiple harmonics lacking in molossid calls [90]. We noted several instances of single harmonic calls terminating in a feeding buzz with clear, multi-harmonic, downward sloping series of pulses distinctive of T. melanopogan. Clearly, a detailed study of these species’ call structure in sympatry is needed. Nevertheless, the Philippines has very few known C. plicatus colonies remaining, largely due to disturbance of caves through mining, guano collection, tourism, and bush hunting [27]. In contrast, T. melanopogan is a common species throughout the Philippines with broad roosting tolerances—from pristine sea caves to church bell towers [e.g., 63]. We found a large colony (>1000 individuals) roosting in an old gymnasium on the University of the Philippines campus adjacent to the IRRI research farm. An analysis of T. melanopogan diets throughout the rice growing cycle would reveal the extent to which they are contributing to migratory rice pest consumption at our study site.

5. Conclusions

Our study provides the first glimpse of the guild-specific behavior of insectivorous bats foraging over irrigated rice in the Philippines, and highlights the potential importance of edge-space bats, such as Scotophilus kuhlii and Pipistrellus javanicus, in consuming insects associated with early stage rice (e.g., mosquitoes). Moreover, bats’ clear response to small-scale heterogeneity in vegetation structure suggests that local-scale cropping practices, including diversified cropping and ecological engineering that increase habitat complexity, may enhance bat foraging activity at ground level as well. However, just as some birds avoid bunds with tall vegetation [8], the form of vegetation on bunds may promote or inhibit pest-regulating services of bats depending on how they respond to introduced structural complexity. Given this, more information on the foraging strategies of bats near vegetation is warranted. Finally, the guild-specific behavior documented here can inform diet studies necessary to confirm bats’ role in suppressing rice-associated insect pests.

Author Contributions

Conceptualization, J.L.S., A.M.S., and B.H.; methodology, J.L.S., and A.M.S.; formal analysis, J.L.S. and F.G.H.; investigation, J.L.S., A.C.J., P.A.A. and J.D.V.A.; resources, A.M.S., and B.H.; writing—original draft preparation, J.L.S.; writing—review and editing, F.G.H. and A.M.S.; visualization, J.L.S. and F.G.H.

Funding

This research was supported by the Southeast Asian Bat Research Conservation Unit (USA National Science Foundation, Grant No. 1051363), Lawrence University (Excellence in Science Fund) and the International Rice Research Institute. Contributions by A.M.S and B.H. were financially supported by funding provided by the Swiss Agency for Development and Cooperation for the CORIGAP project (Grant no. 81016734).

Acknowledgments

We are grateful for the field assistance of M. Dixon, A. Rice, and R. Lorica, acoustic data collection of A. Dahl, A. Taylor, Z. Wang, and C. Zimmerman, and the logistical assistance of R. Lorica, J. Quilty, T. Correa, and the IRRI security team. Josie Lynn Catindig and Maria Liberty P. Almazan provided valuable assistance with the identification of arthropods. The Philippine Department of Natural Resources granted us permission to conduct wildlife research.

Conflicts of Interest

The authors declare no conflict of interest. The funders had no role in the design of the study; in the collection, analyses, or interpretation of data; in the writing of the manuscript, or in the decision to publish the results.

Appendix A

Table A1. Acoustic monitoring sampling details. Night = 18:00–06:00 h, Date = date of the start of the sampling night, Site = area of farm (see Figure 1), Stage = rice growth stage (see Methods), No. of detectors = number of ultrasonic detectors in each site and stage; the data from two detectors in one site and stage per night were averaged for analysis, Detector type = the model of ultrasonic detector and microphone deployed.
YearNightDateSiteStageNo. of DetectorsDetector Type
2015127-July1Early1Anabat SD2
2015127-July1Late1Anabat SD2
2015127-July1Water1Anabat SD2
2015228-July2Water1Anabat SD2
2015228-July2Early1Anabat SD2
2015228-July2Late1Anabat SD2
2015329-July2Water1Anabat SD2
2015329-July2Early1Anabat SD2
2015329-July2Late1Anabat SD2
2015430-July3Early2Anabat SD2
2015430-July3Late2Anabat SD2
2015531-July4Early1Anabat SD2
2015531-July4Late2Anabat SD2
201563-August1Early2Anabat SD2
201563-August1Late2Anabat SD2
201574-August2Early2Anabat SD2
201574-August2Late2Anabat SD2
201585-August3Early2Anabat SD2
201585-August3Late2Anabat SD2
201597-August4Early2Anabat SD2
201597-August4Late2Anabat SD2
2016121-July1Early1SM4Bat_U1 mic
2016121-July1Late1SM4Bat_U1 mic
2016222-July1Early1SM4Bat_U1 mic
2016222-July1Late1SM4Bat_U1 mic
2016326-July4Early1SM4Bat_U1 mic
2016326-July4Late1SM4Bat_U1 mic
2016427-July3Early1SM4Bat_U1 mic
2016427-July3Late1SM4Bat_U1 mic
2016528-July2Early1SM4Bat_U1 mic
2016528-July2Late1SM4Bat_U1 mic
2016629-July1Early1SM4Bat_U1 mic
2016629-July1Late1SM4Bat_U1 mic
2016731-July4Early1SM4Bat_U1 mic
2016731-July4Late1SM4Bat_U1 mic
201681-August3Early1SM4Bat_U1 mic
201681-August3Late1SM4Bat_U1 mic
201693-August2Early1SM4Bat_U1 mic
201693-August2Grass1SM4Bat_U1 mic
2016102-August3Water1SM4Bat_U1 mic
2016102-August3Grass1SM4Bat_U1 mic
2016114-AugustTower 2SM4Bat_U1 mic
2016125-AugustTower 2SM4Bat_U1 mic
2016136-AugustTower 2SM4Bat_U1 mic
2016147-AugustTower 2SM4Bat_U1 mic

Appendix B

Table A2. Arthropod taxa captured by aerial sweep netting over early and late vegetative growth stage rice fields during the early evening (PM; 6 samples per stage) and just before sunrise (AM; 2 samples per stage). Numbers are given by family. Genera and species are given for important herbivores and predators.
Guild/TaxonEarlyLate
PMAMPMAM
Detritivores
 Culicidae51 5217
 Chironomidae461
 Formicidae 1
 Hydrophilidae17 4
 Limnichidae 1
 Sphaeroceridae1
 Tipulidae 13
Herbivores
 Chrysomelidae 1
 Cicadellidae 563
  Recilia distincta
  Reilia dorsalis
 Crambidae1
  Cnaphalocrocis medinalis
 Delphacidae3 2
  Nilaparvata lugens
  Sogatella furafera
 Gryllidae 1
 Nitidulidae 2
 Noctuidae 11
 Pentatonidae1
 Phalacridae3 8
 Pyralidae 3 11
Predators
 Araneidae 1
 Carabidae 1
  Chlaenius
 Ceratopogonidae 3 5
  Nilobezzia acanthipus
  Stilobezzia
  Phanobezzia
 Dytiscidae 3
 Empididae 2
 Lygaeidae 2
 Miridae 2
  Cyrtorhinus lividipennis
 Staphylinidae 1
 Veliidae 1
  Microvelia donglasi
Total931310719

References

  1. Bambaradeniya, C.N.B.; Edirisinghe, J.P.; Silva, D.N.D.E.; Ranawana, K.B.; Wijekoon, S. Biodiversity associated with an irrigated rice agro-ecosystem in Sri Lanka. Biodivers. Conserv. 2004, 13, 1715–1753. [Google Scholar] [CrossRef]
  2. Shuman-Goodier, M.E.; Singleton, G.R.; Propper, C.R. Competition and pesticide exposure affect development of invasive (Rhinella marina) and native (Fejervarya vittigera) rice paddy amphibian larvae. Ecotoxicology 2017, 26, 1293–1304. [Google Scholar] [CrossRef] [PubMed]
  3. Holzer, K.A.; Bayers, R.P.; Nguyen, T.T.; Lawler, S.P. Habitat value of cities and rice paddies for amphibians in rapidly urbanizing Vietnam. J. Urban Ecol. 2017, 3, 1–12. [Google Scholar] [CrossRef]
  4. Bourdin, P.; Paris, T.; Serrano, F.; Smedley, R.; Hettel, G. Guide to the Birds of Philippine Rice Fields; International Rice Research Institute: Los Banos, Philippines, 2015; p. 116. [Google Scholar]
  5. Schoenly, K.G.; Justo, H.D.; Barrion, A.T.; Harris, M.K.; Bottrell, D.G. Analysis of invertebrate biodiversity in a Philippine farmer’s irrigated rice field. Environ. Entomol. 1998, 27, 1125–1136. [Google Scholar] [CrossRef]
  6. Way, M.J. The role of biodiversity in the dynamics and management of insect pests of tropical irrigated rice–A review The role of biodiversity in the dynamics and management of insect pests of tropical irrigated rice–A review. Bull. Entomol. Res. 2015, 567–587. [Google Scholar] [CrossRef]
  7. Horgan, F.G.; Ramal, A.F.; Bernal, C.C.; Villegas, J.M.; Stuart, A.M.; Almazan, M.L.P. Applying Ecological Engineering for Sustainable and Resilient Rice Production Systems. Procedia Food Sci. 2016, 6, 7–15. [Google Scholar] [CrossRef] [Green Version]
  8. Horgan, F.G.; Ramal, A.F.; Villegas, J.M.; Almazan, M.L.P.; Bernal, C.C.; Jamoralin, A.; Pasang, J.M.; Orboc, G.; Agreda, V.; Arroyo, C. Ecological engineering with high diversity vegetation patches enhances bird activity and ecosystem services in Philippine rice fields. Reg. Environ. Chang. 2017, 17, 1355–1367. [Google Scholar] [CrossRef]
  9. Pathak, M.D.; Khan, Z.R. Insect Pests of Rice; International Rice Research Institute: Manila, Philippines, 1994. [Google Scholar]
  10. Settle, W.H.; Ariawan, H.; Astuti, E.T.; Cahyana, W.; Hakim, A.L.; Hindayana, D.; Lestari, A.S. Managing tropical rice pests through conservation of generalist natural enemies and alternative prey. Ecology 1996, 77, 1975–1988. [Google Scholar] [CrossRef]
  11. Savary, S.; Horgan, F.; Willocquet, L.; Heong, K.L. A review of principles for sustainable pest management in rice. Crop Prot. 2012, 32, 54–63. [Google Scholar] [CrossRef]
  12. Ohba, S.Y.; Huynh, T.T.T.; Le, L.L.; Ngoc, H.T.; Hoang, S.L.; Takagi, M. Mosquitoes and their potential predators in rice agroecosystems of the Mekong Delta, southern Vietnam. J. Am. Mosq. Control Assoc. 2011, 27, 384–392. [Google Scholar] [CrossRef]
  13. Roger, P.A.; Heong, K.L.; Teng, P.S. Biodiversity and sustainability of wetland rice production: Role and potential of microorganisms and invertebrates. In The Biodiversity of Microorganisms and Invertebrates: Its Role in Sustainable Agriculture; Hawksworth, D.L., Ed.; CAB International: Marseille, France, 1991; pp. 117–136. [Google Scholar]
  14. Normile, D. Vietnam turns back a “tsunami of pesticides. ” Science 2013, 341, 737–738. [Google Scholar] [CrossRef] [PubMed]
  15. Gurr, G.M.; Lu, Z.; Zheng, X.; Xu, H.; Zhu, P.; Chen, G.; Yao, X.; Cheng, J.; Zhu, Z.; Catindig, J.L.; et al. Multi-country evidence that crop diversification promotes ecological intensification of agriculture. Nat. Plants 2016, 2, 22–25. [Google Scholar] [CrossRef] [PubMed]
  16. McCracken, G.F.; Westbrook, J.K.; Brown, V.A.; Eldridge, M.; Federico, P.; Kunz, T.H. Bats Track and Exploit Changes in Insect Pest Populations. PLoS ONE 2012, 7, e43839. [Google Scholar] [CrossRef] [PubMed]
  17. Leelapaibul, W.; Bumrungrsi, S.; Pattanawiboon, A. Diet of wrinkle-lipped free-tailed bat (Tadarida plicata Buchannan, 1800) in central Thailand: Insectivorous bats potentially act as biological pest control agents. Acta Chiropterologica 2005, 7, 111–119. [Google Scholar] [CrossRef]
  18. Cleveland, C.J.; Betke, M.; Federico, P.; Frank, J.D.; Hallam, T.G.; Horn, J.; Lopez, J.D.; McCraken, G.F.; Medellin, R.A.; Moreno-Valdez, A.; et al. Economic value of the pest control service provided by Brazilian free-tailed bats in south-central Texas. Front. Ecol. Environ. 2006, 20, 207–219. [Google Scholar] [CrossRef]
  19. Federico, P.; Hallam, T.G.; McCracken, G.F.; Purucker, S.T.; Grant, W.E.; Correa-Sandoval, A.N.; Westbrook, J.K.; Medellín, R.A.; Cleveland, C.J.; Sansone, C.G.; et al. Brazilian free-tailed bats as insect pest regulaors in trangenic and conventional cotton crops. Ecol. Appl. 2008, 18, 826–837. [Google Scholar] [CrossRef] [PubMed]
  20. Kemp, J.; López-Baucells, A.; Rocha, R.; Wangensteen, O.S.; Andriatafika, Z.; Nair, A.; Cabeza, M. Bats as potential suppressors of multiple agricultural pests: A case study from Madagascar. Agric. Ecosyst. Environ. 2019, 269, 88–96. [Google Scholar] [CrossRef]
  21. Puig-Montserrat, X.; Torre, I.; López-Baucells, A.; Guerrieri, E.; Monti, M.M.; Ràfols-García, R.; Ferrer, X.; Gisbert, D.; Flaquer, C. Pest control service provided by bats in Mediterranean rice paddies: Linking agroecosystems structure to ecological functions. Mamm. Biol. 2015, 80, 237–245. [Google Scholar] [CrossRef]
  22. Williams-Guillén, K.; Perfecto, I.; Vandermeer, J. Bats limit insects in a Neotropical agroforestry system. Science 2008, 320, 4–6. [Google Scholar] [CrossRef]
  23. Maine, J.J.; Boyles, J.G. Bats initiate vital agroecological interactions in corn. Proc. Natl. Acad. Sci. USA 2015, 112, 12438–12443. [Google Scholar] [CrossRef] [Green Version]
  24. Maas, B.; Clough, Y.; Tscharntke, T. Bats and birds increase crop yield in tropical agroforestry landscapes. Ecol. Lett. 2013, 16, 1480–1487. [Google Scholar] [CrossRef]
  25. Maslo, B.; Valentin, R.; Leu, K.; Kerwin, K.; Hamilton, G.C.; Bevan, A.; Fefferman, N.H.; Fonseca, D.M. Chirosurveillance: The use of native bats to detect invasive agricultural pests. PLoS ONE 2017, 12, e0173321. [Google Scholar] [CrossRef]
  26. Kingston, T. Research priorities for bat conservation in Southeast Asia: A consensus approach. Biodivers. Conserv. 2010, 19, 471–484. [Google Scholar] [CrossRef]
  27. Heaney, L.R.; Balete, D.S.; Rickart, E.A. The Mammals of Luzon Island: Biogeography and Natural History of a Philippine Fauna; Johns Hopkins University Press: Baltimore, MD, USA, 2016; ISBN 978-1-4214-1837-7. [Google Scholar]
  28. Schnitzler, H.-U.; Kalko, E.K.V. Echolocation by insect-eating bats. Bioscience 2001, 51, 557–569. [Google Scholar] [CrossRef]
  29. Denzinger, A.; Schnitzler, H. Bat guilds, a concept to classify the highly diverse foraging and echolocation behaviors of microchiropteran bats. Front. Physiol. 2013, 4, 1–15. [Google Scholar] [CrossRef]
  30. Srilopan, S.; Bumrungsri, S.; Jantarit, S. The wrinkle-lipped free-tailed bat (Chaerephon plicatus Buchannan, 1800) feeds mainly on brown planthoppers in rice fields of central Thailand. Acta chiropt. 2018, 20, 207–219. [Google Scholar] [CrossRef]
  31. Wanger, T.C.; Darras, K.; Bumrungsri, S.; Tscharntke, T.; Klein, A.M. Bat pest control contributes to food security in Thailand. Biol. Conserv. 2014, 171, 220–223. [Google Scholar] [CrossRef]
  32. Ruadreo, N.; Voigt, C.C.; Bumrungsri, S. Large dietary niche overlap of sympatric open-space foraging bats revealed by carbon and nitrogen stable isotopes. Acta Chiropterologica 2019, 20, 329. [Google Scholar] [CrossRef]
  33. Nguyen, T.N.; Ruangwiset, A.; Bumrungsri, S. Vertical stratification in foraging activity of Chaerephon plicatus (Molossidae, Chiroptera) in Central Thailand. Mamm. Biol. 2019, 96, 1–6. [Google Scholar] [CrossRef]
  34. Chhay, S. Cambodian bats: A review of farming practices and economic value of lesser Asiatic yellow house bat Scotophilus kuhlii (Leach, 1821), in Kandal and Takeo provinces, Cambodia. Cambodian J. Nat. Hist. 2012, 2, 164. [Google Scholar]
  35. Biscardi, S.; Russo, D.; Casciani, V.; Cesarini, D.; Mei, M.; Boitani, L. Foraging requirements of the endangered long-fingered bat: The influence of micro-habitat structure, water quality and prey type. J. Zool. 2007, 273, 372–381. [Google Scholar] [CrossRef]
  36. Perfect, T.J.; Cook, A.G. Diurnal periodicity of flight in some Delphacidae and Cicadellidae associated with rice. Ecol. Entomol. 1982, 7, 317–326. [Google Scholar] [CrossRef]
  37. Riley, J.R.; Reynolds, D.R.; Smith, A.D.; Edwards, A.S.; Zhang, X.X.; Cheng, X.N.; Wang, H.K.; Cheng, J.Y.; Zhai, B.P. Observations of the autumn migration of the rice leaf roller Cnaphalocrocis medinalis (Lepidoptera: Pyralidae) and other moths in eastern China. Bull. Entomol. Res. 1995, 85, 397–414. [Google Scholar] [CrossRef]
  38. Wilby, A.; Lan, L.P.; Heong, K.L.; Huyen, N.P.D.; Quang, N.H.; Minh, N.V.; Thomas, M.B. Arthropod diversity and community structure in relation to land use in the Mekong Delta, Vietnam. Ecosystems 2006, 9, 538–549. [Google Scholar] [CrossRef]
  39. Schoenly, K.; Cohen, J.E.; Heong, K.L.; Litsinger, J.A.; Aquino, G.B.; Barrion, A.T.; Arida, G. Food web dynamics of irrigated rice fields at five elevations in Luzon, Philippines. Bull. Entomol. Res. 1996, 86, 451–466. [Google Scholar] [CrossRef]
  40. Aizpurua, O.; Budinski, I.; Georgiakakis, P.; Gopalakrishnan, S.; Ibañez, C.; Mata, V.; Rebelo, H.; Russo, D.; Szodoray-Parádi, F.; Zhelyazkova, V.; et al. Agriculture shapes the trophic niche of a bat preying on multiple pest arthropods across Europe: Evidence from DNA metabarcoding. Mol. Ecol. 2018, 27, 815–825. [Google Scholar] [CrossRef]
  41. Gonthier, D.J.; Ennis, K.K.; Farinas, S.; Hsieh, H.-Y.; Iverson, A.L.; Batary, P.; Rudolphi, J.; Tscharntke, T.; Cardinale, B.J.; Perfecto, I. Biodiversity conservation in agriculture requires a multi-scale approach. Proc. R. Soc. B Biol. Sci. 2014, 281, 20141358. [Google Scholar] [CrossRef] [Green Version]
  42. Toffoli, R.; Rughetti, M. Bat activity in rice paddies: Organic and conventional farms compared to unmanaged habitat. Agric. Ecosyst. Environ. 2017, 249, 123–129. [Google Scholar] [CrossRef]
  43. Fuentes-Montemayor, E.; Goulson, D.; Cavin, L.; Wallace, J.M.; Park, K.J. Fragmented woodlands in agricultural landscapes: The influence of woodland character and landscape context on bats and their insect prey. Agric. Ecosyst. Environ. 2013, 172, 6–15. [Google Scholar] [CrossRef]
  44. Hu, G.; Lu, M.H.; Tuan, H.A.; Liu, W.C.; Xie, M.C.; McInerney, C.E.; Zhai, B.P. Population dynamics of rice planthoppers, Nilaparvata lugens and Sogatella furcifera (Hemiptera, Delphacidae) in Central Vietnam and its effects on their spring migration to China. Bull. Entomol. Res. 2017, 107, 369–381. [Google Scholar] [CrossRef]
  45. Vu, Q.; Ramal, A.F.; Villegas, J.M.; Jamoralin, A.; Bernal, C.C.; Pasang, J.M.; Almazan, M.L.P.; Ramp, D.; Settele, J.; Horgan, F.G. Enhancing the parasitism of insect herbivores through diversification of habitat in Philippine rice fields. Paddy Water Environ. 2018, 16, 379–390. [Google Scholar] [CrossRef]
  46. Lu, Z.; Zhu, P.; Gurr, G.M.; Zheng, X.; Chen, G.; Heong, K.L. Rice Pest Management by Ecological Engineering : A Pioneering Attempt in China. In Rice Planthoppers: Ecology, Management, Socio Economics and Policy; Heong, K., Cheng, J., Escalada, M., Eds.; Springer Science+Business Media Dordrecht: Berlin, Germany, 2015; pp. 163–180. ISBN 9789401795357. [Google Scholar]
  47. Mogi, M.; Miyagi, I. Colonization of rice fields by mosquitoes (Diptera: Culicidae) and larvivorous predators in asynchronous rice cultivation areas in the Philippines. J. Med. Entomol. 1990, 27, 530–536. [Google Scholar] [CrossRef]
  48. Kenmore, P.E.; Carino, F.O.; Perez, C.A.; Dyck, V.A.; Gutierrez, A.P. Population regulation of the rice brown planthopper (Nilaparvata lugens Stål) within rice fields in the Philippines. J. Plant Prot. Trop. 1984, 1, 19–37. [Google Scholar]
  49. Cook, A.G.; Perfect, T.J. The influence of immigration on population development of Nilaparvata lugens and Sogatella furcifera and its interaction with immigration by predators. Crop Prot. 1985, 4, 423–433. [Google Scholar] [CrossRef]
  50. Heong, K.L.; Aquino, G.B.; Barrion, A.T. Population dynamics of plant-and leafhoppers and their natural enemies in rice ecosystems in the Philippines. Crop Prot. 1992, 11, 371–379. [Google Scholar] [CrossRef]
  51. Rubia, E.G.; Ferrer, E.R.; Shepard, B.M. Biology and predatory behavior of Conocephalus longipennis (de Haan) (Orthoptera: Tettigoniidae). J. Plant Prot. Trop. 1990, 7, 47–54. [Google Scholar]
  52. Simpson, I.C.; Roger, P.A.; Oficial, R.; Grant, I.F. Effects of nitrogen fertilizer and pesticide management on floodwater ecology in a wetland ricefield I. Experimental design and dynamics of the photosynthetic aquatic biomass. Biol. Fertil. Soils 1994, 17, 129–137. [Google Scholar] [CrossRef]
  53. Victor, T.J.; Reuben, R. Effects of organic and inorganic fertilisers on mosquito populations in rice fields of southern India. Med. Vet. Entomol. 2000, 14, 361–368. [Google Scholar] [CrossRef]
  54. Mogi, M. Water management in rice cultivation and its relation to mosquito production in Japan. In Vector-Borne Disease Control in Humans through Rice Agroecosystem Management; WHO/FAO/UNEP, Ed.; International Rice Research Institute: Los Banos, Philippines, 1988; pp. 101–110. [Google Scholar]
  55. Mogi, M.; Miyagi, I.; Cabrera, B.D. Development and survival of immature mosquitoes (Dipera: Culicidae) in Philippine rice fields. J. Med. Entomol. 1984, 21, 283–291. [Google Scholar] [CrossRef]
  56. Riley, J.R.; Xia-Nian, C.; Xiao-Xi, Z.; Reynolds, D.R.; Guo-Min, X.; Smith, A.D.; Ji-Yi, C.; Ai-Dong, B.; Bao-Ping, Z. The long-distance migration of Nilaparvata lugens (Stål) (Delphacidae) in China: Radar observations of mass return flight in the autumn. Ecol. Entomol. 1991, 16, 471–489. [Google Scholar] [CrossRef]
  57. Combalicer, E.A.; Im, S. Change anomalies of hydrologic responses to climate variability and land-use changes in the Mt. Makiling forest reserve. J. Environ. Sci. Manag. 2012, 15, 1–13. [Google Scholar]
  58. Surlykke, A.; Kalko, E.K. V Echolocating bats cry out loud to detect their prey. PLoS ONE 2008, 3, e2036. [Google Scholar] [CrossRef]
  59. Goerlitz, H.R. Weather conditions determine attenuation and speed of sound: Environmental limitations for monitoring and analyzing bat echolocation. Ecol. Evol. 2018, 8, 5090–5100. [Google Scholar] [CrossRef] [Green Version]
  60. Agranat, I. Detecting Bats with Ultrasonic Microphones: Understanding the Effects of Microphone Variance and Placement on Detection Rates. 2014. Available online: https://www.wildlifeacoustics.com/images/pdfs/UltrasonicMicrophones.pdf (accessed on 30 May 2019).
  61. Norberg, U.M.; Rayner, J.M.V. Ecological morphology and flight in bats (Mammalia; Chiroptera): Wing adaptations, flight performance, foraging strategy and echolocation. Philos. Trans. R. Soc. London Ser. B Biol. Sci. 1987, 316, 335–427. [Google Scholar] [CrossRef]
  62. Sedlock, J.L. Inventory of insectivorous bats on Mount Makiling, Philippines using echolocation call signatures and a new tunnel trap. Acta Chiropterologica 2001, 3, 163–178. [Google Scholar]
  63. Sedlock, J.L.; Jose, R.P.; Vogt, J.M.; Paguntalan, L.M.J.; Cariño, A.B. A survey of bats in a karst landscape in the central Philippines. Acta Chiropterologica 2014, 16, 197–211. [Google Scholar] [CrossRef]
  64. Russo, D.; Voigt, C.C. The use of automated identification of bat echolocation calls in acoustic monitoring: A cautionary note for a sound analysis. Ecol. Indic. 2016, 66, 598–602. [Google Scholar] [CrossRef]
  65. Siemers, B.M.; Stilz, P.; Scchnitzler, H.-U. The acoustic advantage of hunting at low heights above water: Behavioural experiments on the European ‘trawling’ bats Myotis capaccinii, M. dasycneme and M. daubentonii. J. Exp. Biol. 2001, 204, 3843–3854. [Google Scholar] [CrossRef]
  66. Krauel, J.J.; Ratcliffe, J.M.; Westbrook, J.K.; McCracken, G.F. Brazilian free-tailed bats (Tadarida brasiliensis) adjust foraging behaviour in response to migratory moths. Can. J. Zool. 2018, 96, 513–520. [Google Scholar] [CrossRef]
  67. Miller, B.W. A method for determining relative activity of free flying bats using a new activity index for acoustic monitoring. Acta Chiropterologica 2001, 3, 93–105. [Google Scholar] [CrossRef]
  68. Ingle, N.R.; Heaney, L.R. A key to the bats of the Philippine Islands. Fieldiana Zool. New Ser. 1992, 69, 1–44. [Google Scholar]
  69. R Developer Core Team. R: A Language and Environment for Statistical Computing; R Foundation for Statistical Computing: Vienna, Austria, 2018. [Google Scholar]
  70. Sedlock, J.L.; Ingle, N.R.; Balete, D.S. Enhanced sampling of bat assemblages: A field test on Mount Banahaw, Luzon. Fieldiana Life Earth Sci. 2011, 2, 96–102. [Google Scholar] [CrossRef]
  71. Malmqvist, E.; Jansson, S.; Zhu, S.; Li, W.; Svanberg, K.; Svanberg, S.; Rydell, J.; Song, Z.; Bood, J.; Brydegaard, M.; et al. The bat-bird-bug battle: Daily flight activity of insects and their predators over a rice field revealed by high-resolution Scheimpflug Lidar. R. Soc. Open Sci. 2018, 5, 172303:1–172303:12. [Google Scholar] [CrossRef]
  72. Ancillotto, L.; Ariano, A.; Nardone, V.; Budinski, I.; Rydell, J.; Russo, D. Effects of free-ranging cattle and landscape complexity on bat foraging: Implications for bat conservation and livestock management. Agric. Ecosyst. Environ. 2017, 241, 54–61. [Google Scholar] [CrossRef]
  73. Fukui, D.; Murakami, M.; Nakano, S.; Aoi, T. Effect of emergent aquatic insects on bat foraging in a riparian forest. J. Anim. Ecol. 2006, 75, 1252–1258. [Google Scholar] [CrossRef]
  74. Adams, R.A.; Hayes, M.A. Water availability and successful lactation by bats as related to climate change in arid regions of western North America. J. Anim. Ecol. 2008, 77, 1115–1121. [Google Scholar] [CrossRef]
  75. Russo, D.; Ancillotto, L.; Cistrone, L.; Korine, C. The Buzz of Drinking on the Wing in Echolocating Bats. Ethology 2016, 122, 226–235. [Google Scholar] [CrossRef]
  76. Greif, S.; Siemers, B.M. Innate recognition of water bodies in echolocating bats. Nat. Commun. 2010, 1, 1–5. [Google Scholar] [CrossRef]
  77. Raju, K.H.K.; Sabesan, S.; Rajavel, A.R.; Subramanian, S.; Natarajan, R.; Thenmozhi, V.; Tyagi, B.K.; Jambulingam, P. A preliminary study to forecast Japanese encephalitis vector abundance in paddy growing area, with the aid of radar satellite images. Vector-Borne Zoonotic. Dis. 2016, 16, 117–123. [Google Scholar] [CrossRef]
  78. Russo, D.; Bosso, L.; Ancillotto, L. Novel perspectives on bat insectivory highlight the value of this ecosystem service in farmland: Research frontiers and management implications. Agric. Ecosyst. Environ. 2018, 266, 31–38. [Google Scholar] [CrossRef]
  79. Huang, F.; Subramanyam, B. Effects of delayed mating on reproductive performance of Plodia interpunctella (Hübner) (Lepidoptera: Pyralidae). J. Stored Prod. Res. 2003, 39, 53–63. [Google Scholar] [CrossRef]
  80. Dominik, C.; Seppelt, R.; Horgan, F.G.; Marquez, L.; Settele, J.; Václavík, T. Regional-scale effects override the influence of fine-scale landscape heterogeneity on rice arthropod communities. Agric. Ecosyst. Environ. 2017, 246, 269–278. [Google Scholar] [CrossRef]
  81. Settele, J.; Settle, W.H. Conservation biological control: Improving the science base. Proc. Natl. Acad. Sci. 2018, 115, 8241–8243. [Google Scholar] [CrossRef] [Green Version]
  82. Rothschild, G.H.L. The biology and ecology of rice stem borers in Sarawak (Malaysian Borneo). J. Appl. Ecol. 1971, 8, 287–322. [Google Scholar] [CrossRef]
  83. Shepard, B.M.; Barrion, A.T.; Litsinger, J.A. Rice-Feeding Insects of Tropical Asia; International Rice Research Institute: Manila, Los Baños, Philippines, 1995. [Google Scholar]
  84. Fullard, J.H.; Napoleone, N. Diel flight periodicity and the evolution of auditory defences in the macrolepidoptera. Anim. Behav. 2001, 62, 349–368. [Google Scholar] [CrossRef]
  85. Sedlock, J.L. Autecology and the conservation of insectivorous bats on Mt. Makiling. Silliman J. 2002, 42, 163–201. [Google Scholar]
  86. Shi, L.; Feng, J.; Liu, Y.; Ye, G.; Zhu, X. Is food resource partitioning responsible for deviation of echolocation call frequencies from allometry in Rhinolophus macrotis? Acta Theriol. Warsz. 2009, 54, 371–382. [Google Scholar] [CrossRef]
  87. ter Hofstede, H.M.; Ratcliffe, J.M. Evolutionary escalation: The bat-moth arms race. J. Exp. Biol. 2016, 219, 1589–1602. [Google Scholar] [CrossRef]
  88. Barber, J.R.; Conner, W.E. Acoustic mimicry in a predator-prey interaction. Proc. Natl. Acad. Sci. USA 2007, 104, 9331–9334. [Google Scholar] [CrossRef]
  89. Corcoran, A.J.; Conner, W.E. Predator counteradaptations: Stealth echolocation overcomes insect sonar-jamming and evasive-manoeuvring defences. Anim. Behav. 2017, 132, 291–301. [Google Scholar] [CrossRef]
  90. Wei, L.; Han, N.; Zhang, L.; Helgen, K.M.; Parsons, S.; Zhou, S.; Zhang, S. Wing morphology, echolocation calls, diet and emergence time of black-bearded tomb bats (Taphozous melanopogon, Emballonuridae) from southwest China. Acta Chiropterologica 2008, 10, 51–59. [Google Scholar] [CrossRef]
Figure 1. Arthropod activity in and above rice paddies. (A) Rice crop stages with indication of accumulated abundance of detritivores (brown), predators (red), and herbivores (green) are redrawn using data from Settle et al. [10] based on field data from Java (Indonesia). (B) Patterns of flight activity using data from Perfect and Cook [36] (gray shading = night). Patterns include (1) diurnal flight (e.g., Coccinellidae, Araenae (spiderlings), Hymenoptera and Aphidae [see [37]]); (2) unimodal crepuscular (e.g., Xestocephalus sp.; [36]; (3) bimodal I crepuscular (e.g., S. furcifera, N. lugens, C. bipunctella, N. virescens, R. dorsalis [36]); (4) bimodal II crepuscular (e.g., E. mana [36], Culicidae [47]). Seasonal abundance of detritivores (brown shading: C–E), predators (red: F–H) and herbivores (green: I–J) are indicated for the Luzon, wet-season crop (Philippines). Abundances of key species/groups in the crop are indicated based on published data for [48] [spiderlings], [49] [BPH = brown plant hopper, WBPH = white-backed plant hopper], [50] [Veliids and mirids], [51] [predatory Orthoptera], [52] [Chironomidae), [10] [plankton feeders and detritivores], and [53] [Culicidae] with combined abundances as the crop matures (E,H,K). Activity over the crop is indicated using data from Mogi [54] (D) and Perfect and Cook [36] (G,J), and at higher altitudes from Mogi et al. [55] (C) and Riley et al. [56] (F,I). Relative abundances of major groups are estimated based on sweep net samples from the International Rice Research Institute (IRRI) (Horgan, unpublished data).
Diversity 11 00148 g001
Figure 2. Map of IRRI’s research farm with the four sampling areas indicated (A). Yellow triangles indicate the location of two 50 m-tall radio towers on which ultrasonic detectors were mounted. Representative photos of the Water (B), Early (C), Late (D), and Grass (E) stages of rice cultivation sampled.
Diversity 11 00148 g002
Figure 3. Bat activity by rice growth stage recorded at rice level during the 2015 wet season. Average (± standard deviation) edge-space occurrence (A) and foraging intensity (B), narrow-space occurrence (C), and open-space occurrence (D) by hour and rice growth stage (Early = dashed line, Late = solid line). Note differences in scales.
Diversity 11 00148 g003
Figure 4. Bat activity by rice growth stage recorded at rice level during the 2016 wet season. Average (± standard deviation) edge-space occurrence (A) and foraging intensity (B), narrow-space occurrence (C), and open-space occurrence (D) by hour and rice growth stage (Early = dashed line, Late = solid line). Note differences in scales.
Diversity 11 00148 g004
Figure 5. Bat activity and foraging intensity by guild and tower recorded from 50 m radio towers over four nights. Average (± standard error) bat activity (A,C) and foraging activity (B,D) recorded from Tower 1 (dashed line) and Tower 2 (dotted line).
Diversity 11 00148 g005
Figure 6. (A) Species richness and (B) number of individuals representing detritivore (brown), herbivore (green) and predator (red) guilds from sweep net sampling conducted over early stage and late stage rice crops during the early morning and late evening. The proportional species (C) and abundance (D) representations by each guild are also indicated. Because of low captures, samples are combined from several trapping days during the 2015 and 2016 wet seasons. Dimensions were independent based on tests of mutual and partial dependence (133.528 ≤ χ2 ≤ 376.101; P < 0.001). See Table A2 for further details.
Diversity 11 00148 g006
Table 1. Ranges of physical and acoustic measurements characterizing bat species documented within or near the study site and their functional group classification. Sample sizes are all > 10, and represent individuals for the physical traits and call pulses for acoustic traits.
Guild/SpeciesSpecies CodeForearm Length (mm)Mass (g)Peak Frequency (kHz)Duration (ms)Bandwidth (kHz)
Open space
Taphozous melanopoganTame61.0–65.0 123.0–28.0 126.0–30.0 23.7–20.2 22.0–6.0 2
Edge space
Miniopterus australisMiau34.5–39.6 34.8–6.3 362.0–73.0 22.5–13.0 27.0–29.0 2
Miniopterus schreibersiMisc40.1–45.7 34.7–12.6 345.6 ± 0.7 4
Miniopterus tristisMitr51.0–54.0 116.0–21.0 134.6 ± 0.8 4
Pipistrellus javanicusPija31.7–35.0 55.3–8.0 542.9–50.7 61.4–6.4 69.8–23.4 6
Scotophilus kuhliiScku47.1–51.5 517.5–26.0 538.0–46.0 73.5–12.0 77.0–34.0 7
Narrow space
Hipposideros diademaHidi77.0–88.0 133.0–54.0 168.0–70.0 88.0–14.3 80.0–10.7 8
Myotis horsfieldiiMiho35.0–38.0 15.5–7.0 147.8–59.5 92.3–6.4 912.7–37.1 9
Myotis rufopictusMyru50.3 514.0 546.8–53.7 50.7–3.8 513.7–35.2 5
Rhinolophus arcuatusRhar40.0–49.0 16.0–9.0 146.8–50.0 823.0–97.5 80.0–3.9 8
Rhinolophus macrotisRhma44.0–50.0 16.0–8.0 146.8–50.0 823.0–97.5 80.0–3.9 8
1 Heaney et al. [27]; 2 from free-flying bats in this study; 3 Sedlock et al. [63]; 4 minimum frequency from zero-crossing recordings, Sedlock [62]; 5 from bats captured in this study; 6 recorded from free-flying bats in a large (10 × 5 × 5 m tunnel traps on Mt. Banahaw, unpublished data; 7 hand released free flying bats in this study; 8 recorded from hand-held bats on Mt. Makiling, unpublished data; 9 recorded from free-flying bats over a river on Mt. Makiling, unpublished data.
Table 2. Total bat passes recorded from ground level, relative bat activity (total no. bat passes/no. hours) and relative feeding activity (total no. buzzes/no. hours) by rice growth stage for each guild and acoustically distinct taxa within each guild. Water = tilled and water-filled paddy pre-planting, Early = seedling and early vegetative (i.e., canopy < 50%), Late = late vegetative (i.e., canopy > 50%), Grass = grass-filled fallow paddy. Species abbreviations as in Table 1.
Guild/TaxonTotal PassesRelative Bat Activity (Relative Feeding Activity)
20152016
WaterEarlyLateWaterEarlyLateGrass
Edge-space34,30172.88 (2.13)74.40 (4.39)37.86 (0.62)82.17 (2.33)94.93 (4.37)33.44 (0.98)10.00 (0.08)
Miau4001.52 (0.02)0.82 (0.03)0.521.25 (0.08)0.78 (0.02)0.710.25
Narrow-space6063.23 (0.23)0.84 (0.03)1.35 (0.04)0.250.84 (0.10)0.58 (0.01)0.63
Myru/Myho4262.19 (0.31)0.66 (0.03)1.10 (0.04)0.170.66 (0.10)0.290.33
Hidi840.600.100.180.080.100.090.04
Rhar11--0.030.02--0.030.03--
Rhma810.020.180.23--0.080.200.25
Rhsp4--0.040.010.08------
Open-space 28401.545.06 (0.01)1.480.924.11 (0.13)2.790.25 (0.04)
Table 3. Results of statistical analyses showing the effects of hour and stage on edge-space bat occurrence, edge-space bat total activity, edge-space bat foraging, narrow-space bat presence, and open-space bat presence. Degrees of freedom (df) = 1 for all models. P = p-value with: n.s. = non-significant, * = < 0.05, ** = < 0.01, *** = < 0.001. SE = standard error.
Response VariableIndependent Variable20152016
Estimate (± SE)Test statistic §PEstimate (± SE)Test statistic §P
Edge−space occurrence
Stage−0.36 ± 0.0465.70***−0.37 ± 0.0677.29***
Hour−0.03 ± 0.0158.11***−0.03 ± 0.0119.55***
Stage*Hour0.03 ±0.0115.99***0.01 ± 0.013.67n.s.
Edge−space activity
Stage−0.70 ± 0.1144.97***−0.86 ± 0.1298.20***
Hour−0.08 ± 0.0149.96***−0.02 ± 0.011.31n.s.
Stage*Hour0.05 ± 0.0211.20***0.04 ± 0.026.78**
Edge−space foraging
Stage−2.90 ± 0.70−4.12***−3.37 ± 0.78−4.33***
Hour−0.20 ± 0.06−3.11**−0.19 ± 0.07−2.72**
Stage*Hour0.21 ± 0.092.30*0.19 ± 0.101.92n.s.
Narrow−space presence
Stage0.29 ± 0.590.48n.s.−0.04 ± 0.68−0.07n.s.
Hour0.02 ± 0.050.49n.s.−0.04 ± 0.06−0.61n.s.
Stage*Hour−0.09 ± 0.08−1.14n.s.−0.07 ± 0.09−0.72n.s.
Open−space presence
Stage−1.98 ± 0.72−2.77**−1.79 ± 0.85−2.10*
Hour0.09 ± 0.071.28n.s.0.06 ± 0.070.93n.s.
Stage*Hour0.10 ± 0.101.01n.s.0.04 ± 0.110.45n.s.
§ test statistic represents Chi-square for Edge-space occurrence and activity, and z-value for all other tests.

