Aquatic Macrophytes are Seasonally Important Dietary Resources for Moose


1
School of Forest Resources and Environmental Science, Michigan Technological University, 1400 Townsend Drive, Houghton, MI 49931, USA
2
Department of Fisheries, Wildlife, and Conservation Biology, University of Minnesota, 2003 Upper Buford Circle, Suite 135, Saint Paul, MN 55108, USA
*
Author to whom correspondence should be addressed.
Diversity 2019, 11(11), 209; https://0-doi-org.brum.beds.ac.uk/10.3390/d11110209
Submission received: 14 August 2019
/
Revised: 24 October 2019
/
Accepted: 31 October 2019
/
Published: 1 November 2019
(This article belongs to the Special Issue Stable Isotopes in Ecological Research)
Abstract
:Moose (Alces alces) are generalist herbivores, but are important aquatic-terrestrial ecotone specialists. Aquatic macrophytes are a high-quality food source for moose during summer, but the importance of aquatic food sources to the moose diet is difficult to study. We used stable isotope analysis of carbon and nitrogen from moose hooves and forage (terrestrial plants, aquatic macrophytes, and arboreal lichen) to assess the diet of moose at Isle Royale National Park, Michigan, USA, using Bayesian mixing models. We also evaluated the isotopic variability along chronologies of serially sampled hooves. Overall, our mixing models indicate that 13%–27% of the summer moose diet was aquatic in origin. Among moose that died during winter, body condition was impaired and hoof δ15N was higher where aquatic habitats were sparse. Although isotope chronologies preserved in hooves could significantly enhance our understanding of ungulate foraging ecology, interpretation of such chronologies is presently limited by our lack of knowledge pertaining to hoof growth rate and seasonal growth variability related to age and health. Distinct isotopic values among terrestrial plants, aquatic macrophytes, and arboreal lichens indicate that continued methodological advances in stable isotope ecology will lead to more precise estimates of the contribution of aquatic feeding to moose population dynamics and other ungulates.
1. Introduction
Forage quality is a significant factor determining herbivore fecundity [1,2,3], juvenile growth rate and survival [2,4,5,6], and breeding phenology [7,8]. The relative degree to which forage quality affects life-history traits and population dynamics depends, in part, upon landscape-level heterogeneity in resource quality [9,10,11]. Terrestrial systems are frequently nitrogen (N)-limited, which has stimulated behavioral (e.g., aggregation) and morphological (e.g., rumination) adaptations to resource acquisition by herbivores [12].
Moose (Alces alces) are large-bodied ruminant herbivores that are morphologically adapted to occupy circumpolar terrestrial landscapes. These landscapes are characterized by short growing seasons and high seasonal variability in forage quality [13]. Additionally, moose are uniquely adapted to take advantage of aquatic resources during the short growing season [14]. Despite their ability to forage aquatically during summer, in winter moose energy balance may become negative because winter forage N content decreases below what is required for maintenance [15]. At Isle Royale National Park, Michigan, USA, winter starvation is the second leading cause of mortality (wolves (Canis lupus) are the primary mortality factor for moose [16]). For moose in this island system, studies have emphasized energetic limitations imposed by winter forage (e.g., balsam fir (Abies balsamea) availability [16,17,18]). Yet, fat reserves generated during the summer might be associated with winter survival [12,19,20].
The lakes and wetlands of Isle Royale contain aquatic macrophytes that are low in carbon [C]:N, are highly digestible, and have rich mineral content, especially sodium and calcium. As a consequence, summer aquatic forage constitutes a high-quality alternative to terrestrial plants for moose [21,22,23,24,25]. Aquatic habitats are abundant on Isle Royale, with greater occurrence at the eastern half of the island where the retreat of glacial ice is thought to have been rapid, leaving behind deeply gouged lowlands [26]. Moose spend significant amounts of time foraging in aquatic habitats each summer in June through September [27,28]. However, how much moose use aquatic resources is difficult to assess, because macrophyte consumption is not easily observable. Furthermore, fecal analysis to determine diet underestimate the contribution of aquatic macrophytes because this forage is very digestible [29]. Based on biomass removal comparisons between exclosure plots, aquatic plants may constitute up to ~18% of the summer diet of moose on Isle Royale [30].
An alternative approach to estimate diet is to use stable isotope analyses of forage components and moose tissue [29]. Carbon stable isotopes (13C/12C) separate food sources with different photosynthetic pathways [31,32,33,34,35], and variation in temperature, moisture, or light intensity [36,37,38]. Nitrogen isotopes (15N/14N) distinguish food source N [39], nutrients [40], trophic position [41,42], and consumer body condition or nutritional status [43]. C and N isotopes in combination can be used in mixing models to estimate the contribution of isotopically distinct food sources to the diet of consumers [44,45,46,47]. Stable isotope analysis of metabolically inert consumer tissue (e.g., hair, nail) can provide a dietary and nutritional record or chronology that is integrated for the tissue growth period. This approach allows examination of seasonal changes in consumer diet [48,49,50,51,52,53,54,55,56]. The isotope composition of Alaskan moose hooves, for example, oscillated with distance from the hairline and was interpreted as a pattern that indicated seasonal diet shifts. Kielland [52] therefore concluded that the hooves represent 2 years of growth [52].
Here we explore the use of stable isotope analysis of δ15N and δ13C from hooves to assess moose diets across seasons. To do so, we assumed that isotopic signatures retained in hoof growth just prior to death (i.e., at the hoof hairline) were associated with the approximate location and season the individual died. We then characterized the spatial (east, west) isotopic variability among summer (aquatic macrophytes, terrestrial plant leaves) and winter (arboreal lichens, terrestrial plant twigs) forage items that encompassed the primary seasonal diets of Isle Royale moose. We used a Bayesian mixing model method to estimate the contribution of forage types in the diet of moose [44,45,47,57,58]. We also assessed C and N isotopic variability in chronologies of serially sampled hooves to establish if hairline isotope signatures from known seasons or apparent growth arrest lines (GALs hereafter) can be used to infer annual growth cycles in moose.
2. Materials and Methods
2.1. Study Area
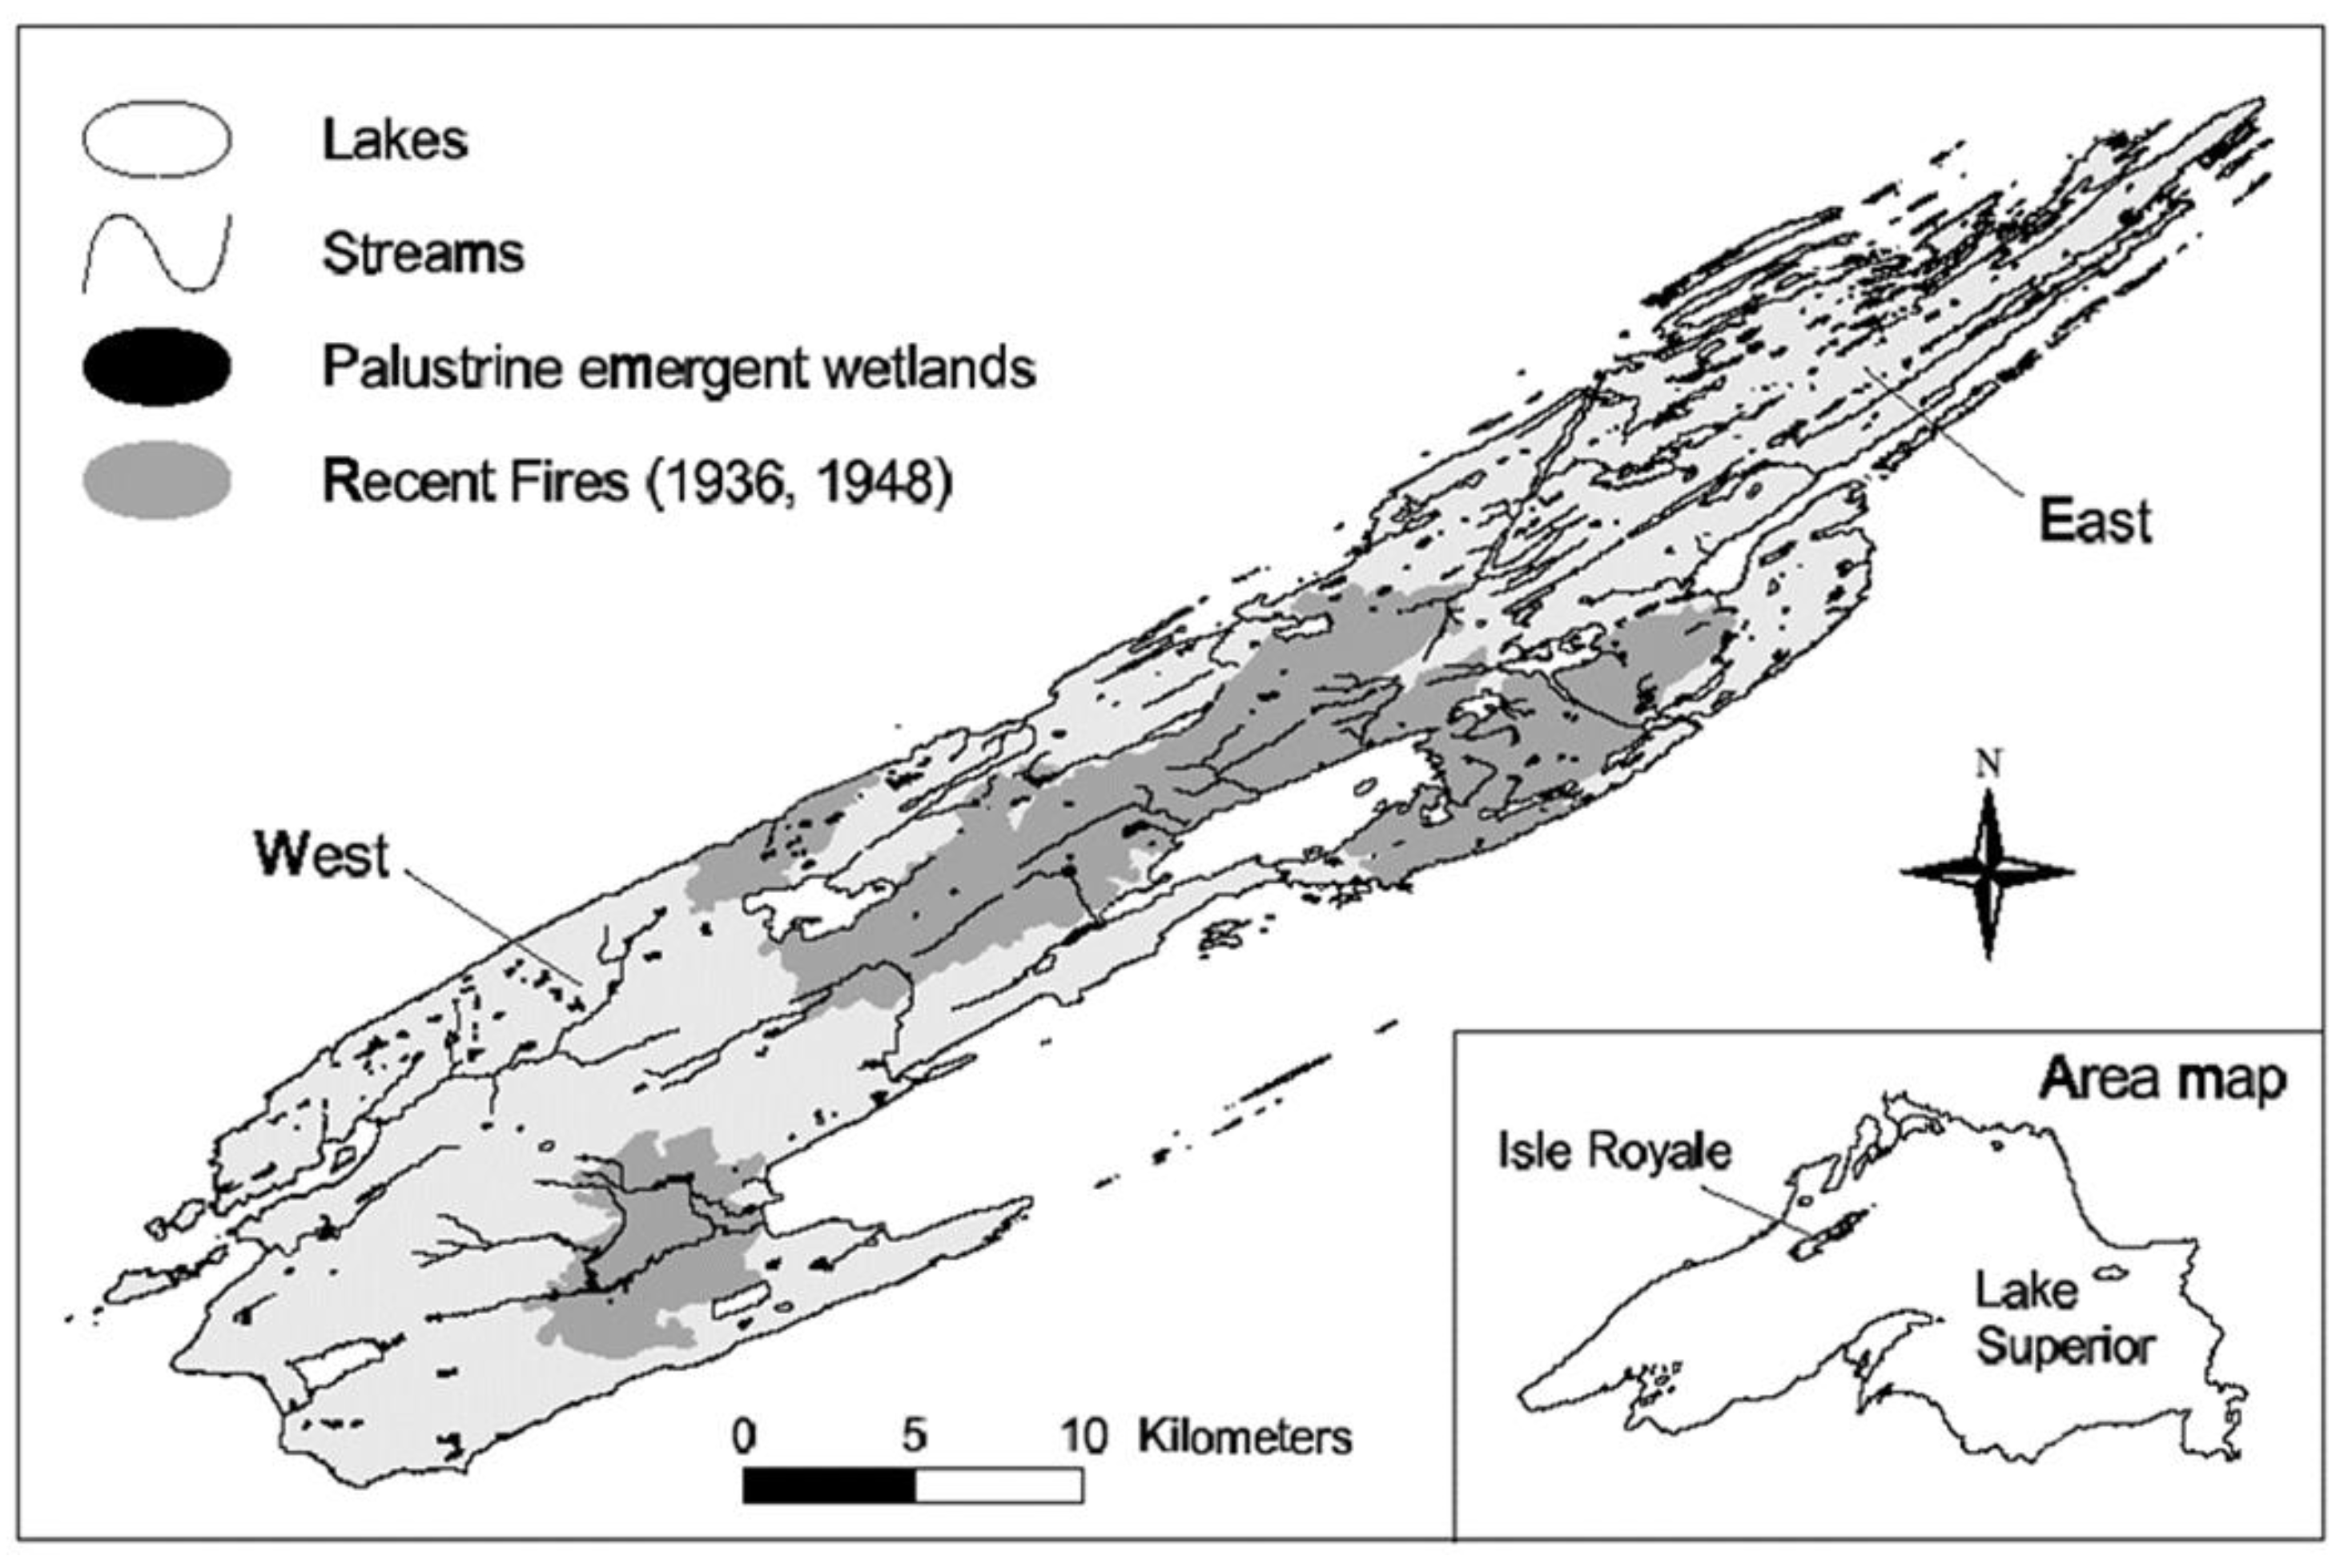
Isle Royale is a 544 km2 island archipelago located in the boreal forest region of northwest Lake Superior, USA, 24 km from the nearest shoreline (48° N, 89° W; Figure 1). The island consists of Precambrian-aged basalt and conglomerate bedrock laid down in a series of parallel ridges and valleys [26]. Mean temperatures are 14 °C in July and −11 °C in January, with persistent snow and ice cover from November through April. Lakes and ponds (n = 84 ≥ 1 ha) comprise 36 km2 of the island’s surface area and are concentrated at the eastern end of the island. Additional lakeshore is found in numerous bays of Lake Superior, particularly on the eastern end of the island. Thin, bedrock-derived soils at the eastern end support a forest predominated by conifers, while till-derived soils at the western end are more developed and the forest is characterized by a larger component of deciduous species [26,59].
The winter density of moose on Isle Royale ranged from 1 to 4 moose/km2 [16] during our study, with concentrations along shoreline areas. Moose effectively do not emigrate from Isle Royale; it is a closed system in the context of this analysis. It is possible if an ice bridge forms between Isle Royale and the continental mainland, however this is increasingly rare. Even when an ice bridge has formed, moose departure from the mainland is undocumented [60]. The island was likely colonized by moose that swam from the mainland [61], but genetic analyses have reported no evidence of recent immigration [60].
Balsam fir is an important component of winter diet; twigs from other woody vascular plants and arboreal lichens compose the remainder [62]. The spring diet of moose includes newly emergent leaves and the summer diet is largely composed of current annual leaf growth of deciduous plants as well as aquatic macrophytes [63,64]. Forests on the western end are in a late successional stage and dominated by deciduous species, while forests on the eastern end are younger and conifer-dominated [65].
2.2. Sample Collection
2.2.1. Moose Forage
The forage types comprising the summer (terrestrial plant leaves and aquatic macrophytes) and winter (terrestrial plant twigs and arboreal lichens) diets of moose on Isle Royale were sampled at eastern and western ends of the island (hereafter E and W, respectively). Summer and winter sample collection sites differed, but covered the same regions of the island. The terrestrial forage species we sampled emulated those most preferred by direct observation of radio-collared moose (n = 22) on the western end of the island in the late 1980s [62,64]. East and west sampling sites were delineated by the boundary of the 1936 and 1948 forest fires (Figure 1), leaving the central portion of the island unsampled. Summer forage samples were collected during a two-week interval (13 July to 3 August) in 2002 to minimize the influence of plant phenology on isotope values and to ensure all samples were mature (as opposed to emergent or senescent). Samples from six terrestrial species composing the principle summer diet of moose on Isle Royale: mountain maple (Acer spicatum), sugar maple (A. saccharum), mountain ash (Sorbus decora), paper birch (Betula papyrifera), yellow birch (B. alleghaniensis), and beaked hazelnut (Corylus cornuta) [64] were collected from 5–13 E and 5–12 W sites, with each site separated by >200 m. At each site, five green leaves of each species (including the petiole and excluding twigs) were collected at browse level from separate but neighboring stems of the same individual plant and pooled for analysis.
Since aquatic species preferences of moose at Isle Royale are unknown [64], dominant submergent and floating-leaved aquatic macrophyte species were opportunistically collected along shoreline locations known to be used by moose at 3 E and 3 W sites (lakes). We collected aquatic macrophytes from the genera Brasenia, Callitriche, Carex, Chara, Dulichium, Eliocharis, Elodea, Equisetum, Eupatorium, Isoetes, Juncus, Lemna, Lysimachia, Megalodonta, Menyanthes, Myriophyllum, Najas, Nuphar, Potamogeton, Ranunculus, Sagittaria, Scrirpus, Sclerolepis, Sparganium, Utricularia, Vallisneria, and families Asteraceae, Characeae, and Poaceae. At each site, five subsamples of each species present were collected (where available) and pooled for analysis. Since moose are not known to discriminate among aquatic macrophyte parts (e.g., rhizome, stem, flower), attempts were made to collect the entire plant, excluding only large and well-rooted rhizomes. To minimize the collection of benthic sediment, samples were rinsed in lake water to remove loose debris prior to placing in plastic sample bags. Due to the paucity of inland lakes on the western end of the island, all 3 W sample sites were bays of Lake Superior, whereas only 1 E site was on Lake Superior. To reduce the potential effect of sampling in Lake Superior, aquatic macrophyte sampling was expanded in 2003 (6–18 July) to 5 E and 5 W inland aquatic sites, where W sites included lakes, small ponds, or wetland habitats containing open water.
Winter forage samples were collected at each of 7 E and 7 W sites between 12 January and 10 February 2003. All sampling sites were ≥ 200 m apart. At each site, five twigs (current annual growth) were collected from adjacent stems of individual plants from balsam fir, white cedar (Thuja occidentalis), mountain ash, red-osier dogwood (Cornus stolonifera), paper birch, and quaking aspen (Populus tremuloides). Twigs were clipped at the average diameter for each species eaten by moose in winter [62]. At each site, arboreal lichens of the genera Usnea and Parmelia were collected from the branches/bark of standing or newly fallen white spruce (Picea glauca) and paper birch. To minimize sample degradation, all forage samples were kept cool until frozen (≤12 h of collection) and remained frozen until sample analysis.
2.2.2. Moose Hooves and Bone Marrow
Moose hooves (n = 38) were collected from adult moose carcasses at the E and W ends of Isle Royale during 2002 and 2003. Date, location, age, sex, and cause of death were all noted, and samples were stored frozen until analysis. Age was obtained by counting annual cementum layers in teeth [66]. Femurs from moose that died in winter were collected between January and February 2003 and kept frozen. We determined bone marrow fat content (percent dry weight) in a 1–2 g sample of femur bone marrow [67].
2.3. Physical and Chemical Sample Pretreatment and Measurement
Plant and lichen tissues were dried at 60 °C for 48 h and ground to a fine powder in a ball mill grinder (SPEC Certiprep 8000M). Hooves were vigorously cleaned with deionized water followed by ethyl alcohol, and 5–10 mg of powder was shaved from the desired sampling location using a high-speed Dremel™ rotary tool following the methods of Kielland [52]. Hooves from known summer and winter moose mortalities from E and W locations were sampled 0.5 cm from the hairline (hereafter referred to as “hairline” sample) to test inferences regarding spatial (E/W) and seasonal (summer/winter) differences in moose isotope signatures. A subset of 13 of the 38 hooves from adult female moose collected at the eastern end of the island were additionally subsampled in 0.5-cm intervals from the hairline to the hoof tip to investigate seasonal changes in diet among individuals (Figure 2). We chose to focus on only adult females from the eastern end of the island for two reasons: (1) adult females are the most important part of the population study for demographic reasons, and (2) we wanted to minimize the introduction of potential variability in results associated with age, sex, and location differences. For a single animal, adjacent hoof digits were incrementally sampled to examine intra-animal isotope variability. All samples were stored in a desiccator until analysis. Subsamples of ground plants and lichens (C: 1.5 ± 0.1 mg, N: 3.0 ± 0.1 mg), and hooves (0.8 ± 0.1 mg) were weighed into tin cups and combusted using a Costech Elemental Combustion System 4010 connected to a ThermoFinnigan ConfloIII Interface and a Deltaplus Continuous Flow-Stable Isotope Ratio Mass Spectrometer in the Ecosystem Science Center at Michigan Technological University. Four IAEA (IAEA-CH-6, IAEA-N1, IAEA-N2), USGS (USGS24, USGS25, USGS26), and NIST certified (limestone) standards for each isotope were analyzed at the beginning of each sample run and one at the end of each sample run to check for stability of the calibration. An in-house standard of fisher liver (δ13C = −23.60‰ ± 0.10‰ [SD]; n = 5, δ15N = 8.86‰ ± 0.23‰ [SD]; n = 50) was analyzed every 10–20 samples. The stable isotope ratios (R) of carbon (13C/12C) and nitrogen (15N/14N) are expressed in delta (δ) notation and reported in parts per thousand (‰) relative to the international standards for C (VPDB; Vienna Pee Dee Belemnite limestone) and N (N2 atmospheric air):
δ (‰) = (Rsample / Rstandard – 1) × 1000,
Analytical precision, based on the repeated analyses of 50 standard samples (fisher liver), was ±0.25‰ for δ13C and ±0.5‰ for δ15N. Every fifth sample was analyzed in duplicate and results were accepted if the variance between duplicates was less than that of the standards. Subsamples from hoof chronologies were analyzed randomly such that patterns observed could not be attributed to instrument drift.
2.4. Moose Hooves
Hoof growth rate has not been measured in moose, but the average annual hoof growth rate of captive Alaskan caribou (Rangifer tarandus) was 7.8 cm/year with seasonal fluctuations between 0.3 cm/month (December–March) and 1.4 cm/month (September) [68]. Another method of ascertaining growth rate in animals is through analysis of growth arrest lines (GALs), or multiple grooved bands that are laid down in mineralized tissue during incremental growth periods. Annual GALs form as a result of endogenous (e.g., hormones) and exogenous (e.g., diet, photoperiod) influences and are usually laid down during winter in temperate climates [69]. Slowed or arrested growth rate in hooves may result from extreme malnutrition [70]. We have observed (unpublished data) that GALs are generally not found in young moose that are likely to be in good body condition, but they are common in old moose that were killed by wolves or died of malnutrition.
We determined the position of summer and winter growth along hoof chronologies according to the mean summer and winter isotope signatures in hairline samples. Hairline samples did not differ between moose that died during the summer vs. the winter (see Results), so we employed two approaches to infer annual growth cycles from hoof isotope chronologies. First, we approximated the time interval represented in hooves from moose whose date of death was known (±14 d), assuming hoof growth rate in moose can be modeled by that of captive caribou. Monthly growth rates in caribou, adjusted for mean differences in hoof length between caribou (6.0 cm [68]) and moose (10.6 cm; this study), were summed from the date of death over the length of each hoof to arrive at estimated annual hoof growth rate in moose. Second, we evaluated if seasonal growth could be inferred relative to the location of GALs, assuming that GALs were laid down only during the winter. We predicted that if GALs were a good indicator of seasonal changes in diet and seasonal growth could be obtained using caribou hoof growth rates, then GALs would occur within the caribou-derived zone of winter (~November–April) growth, and not in the zone of summer (~May–October) growth.
2.5. Data Analysis
2.5.1. Moose Forage
Since stable isotope data frequently violate the assumptions of parametric statistical tests and sample size among factor levels is often small and unbalanced, multivariate statistical tests based on permutation have been recommended for the analysis of bivariate isotope responses [71]. Our forage data produced no exceptions to these norms. Thus, we chose to use both parametric multivariate analysis of variance (MANOVA) and nonparametric distance-based multivariate analysis for a linear model (DISTLM [72]) to analyze moose forage data. DISTLM is an appropriate comparative nonparametric test, as it accommodates both multi-factorial and unbalanced designs [72,73] and is based on the permutation of a distance matrix, in this case using Euclidean distance. Both MANOVA (using Pillai’s trace statistic) and DISTLM were employed to test the main effects of forage type (summer terrestrial, summer aquatic, winter terrestrial, winter lichen) and location (E, W) on δ15N and δ13C in a two-factor orthogonal design including an interaction term. Since the species collected among forage types were based upon seasonal moose preference (summer and winter terrestrial) or availability (summer aquatic, lichen), species were not comparable across forage types. For this reason, the effects of species and location were examined using separate models for summer and winter samples. Where MANOVA and DISTLM produced significant (α = 0.05) results, between-group differences were tested with multiple pairwise comparisons using MANOVA, and P values were adjusted for Type I family-wise error rate using the Bonferroni inequality method—a conservative adjustment [74]. We additionally tested single-isotope between-group differences using the Kruskal–Wallis test to report where significance may have occurred in only one isotope.
2.5.2. Moose Hooves and Bone Marrow
Because we were interested in the univariate effects of location and season on moose isotope values measured at the hoof hairline, and these data did not violate the assumptions of parametric statistical tests, we used separate single-factor ANOVA models to test the main effect of location (E, W) on hairline hoof δ13C and δ15N from adult moose that died during the summer and the winter. We used a one-tailed t-test to test the hypothesis that winter moose mortalities from the eastern end would have a higher content of bone marrow fat than moose from the western end.
All statistical analyses were conducted using SPSS (SPSS, Inc. 2003, Chicago, IL, USA).
2.6. Diet Estimation
We used Bayesian mixing models (MixSIAR) [47,58,75] to estimate the proportional contribution of forage types to the diet of moose, with the Markov chain Monte Carlo (MCMC) chain length set to 1,000,000 with a burn-in of 50,000, a thinning interval of 50, and 3 chains. We used uninformative (generalist) priors and used Gelman–Rubin and Geweke diagnostics to check model convergence. Since trophic discrimination factors have not been determined for captively reared moose, we used the mean published diet-keratin (e.g., horn, hair) trophic discrimination factors for other large mammalian herbivores (cattle, African ungulates, bighorn sheep (Ovis canadensis), alpaca (Lama guanicoe), llama (L. glama), goat, horse; Δ13C = 3.0‰, Δ15N = 2.7‰) [56,76,77,78,79]. However, several of the published estimates for Δ13C are based on a high-protein diet (19% crude protein; [76]). On a low-protein diet (as in moose), Δ13C is considerably reduced (Sponheimer, personal communication), but the degree to which this occurs has not been published. For this reason, we additionally report estimates of moose diet using the lowest reported large-mammal Δ13C (1.8‰) [77], where the diet was a lower-protein C3 grass (~13% crude protein).
If we observed sufficient isotopic distinction among forage types, moose diets were estimated by season and location for corresponding mean summer and winter hairline isotope values for each isotope using two-source mixing models [47]. We used mean and standard deviations of source clusters in mixing models.
3. Results
3.1. Moose Forage
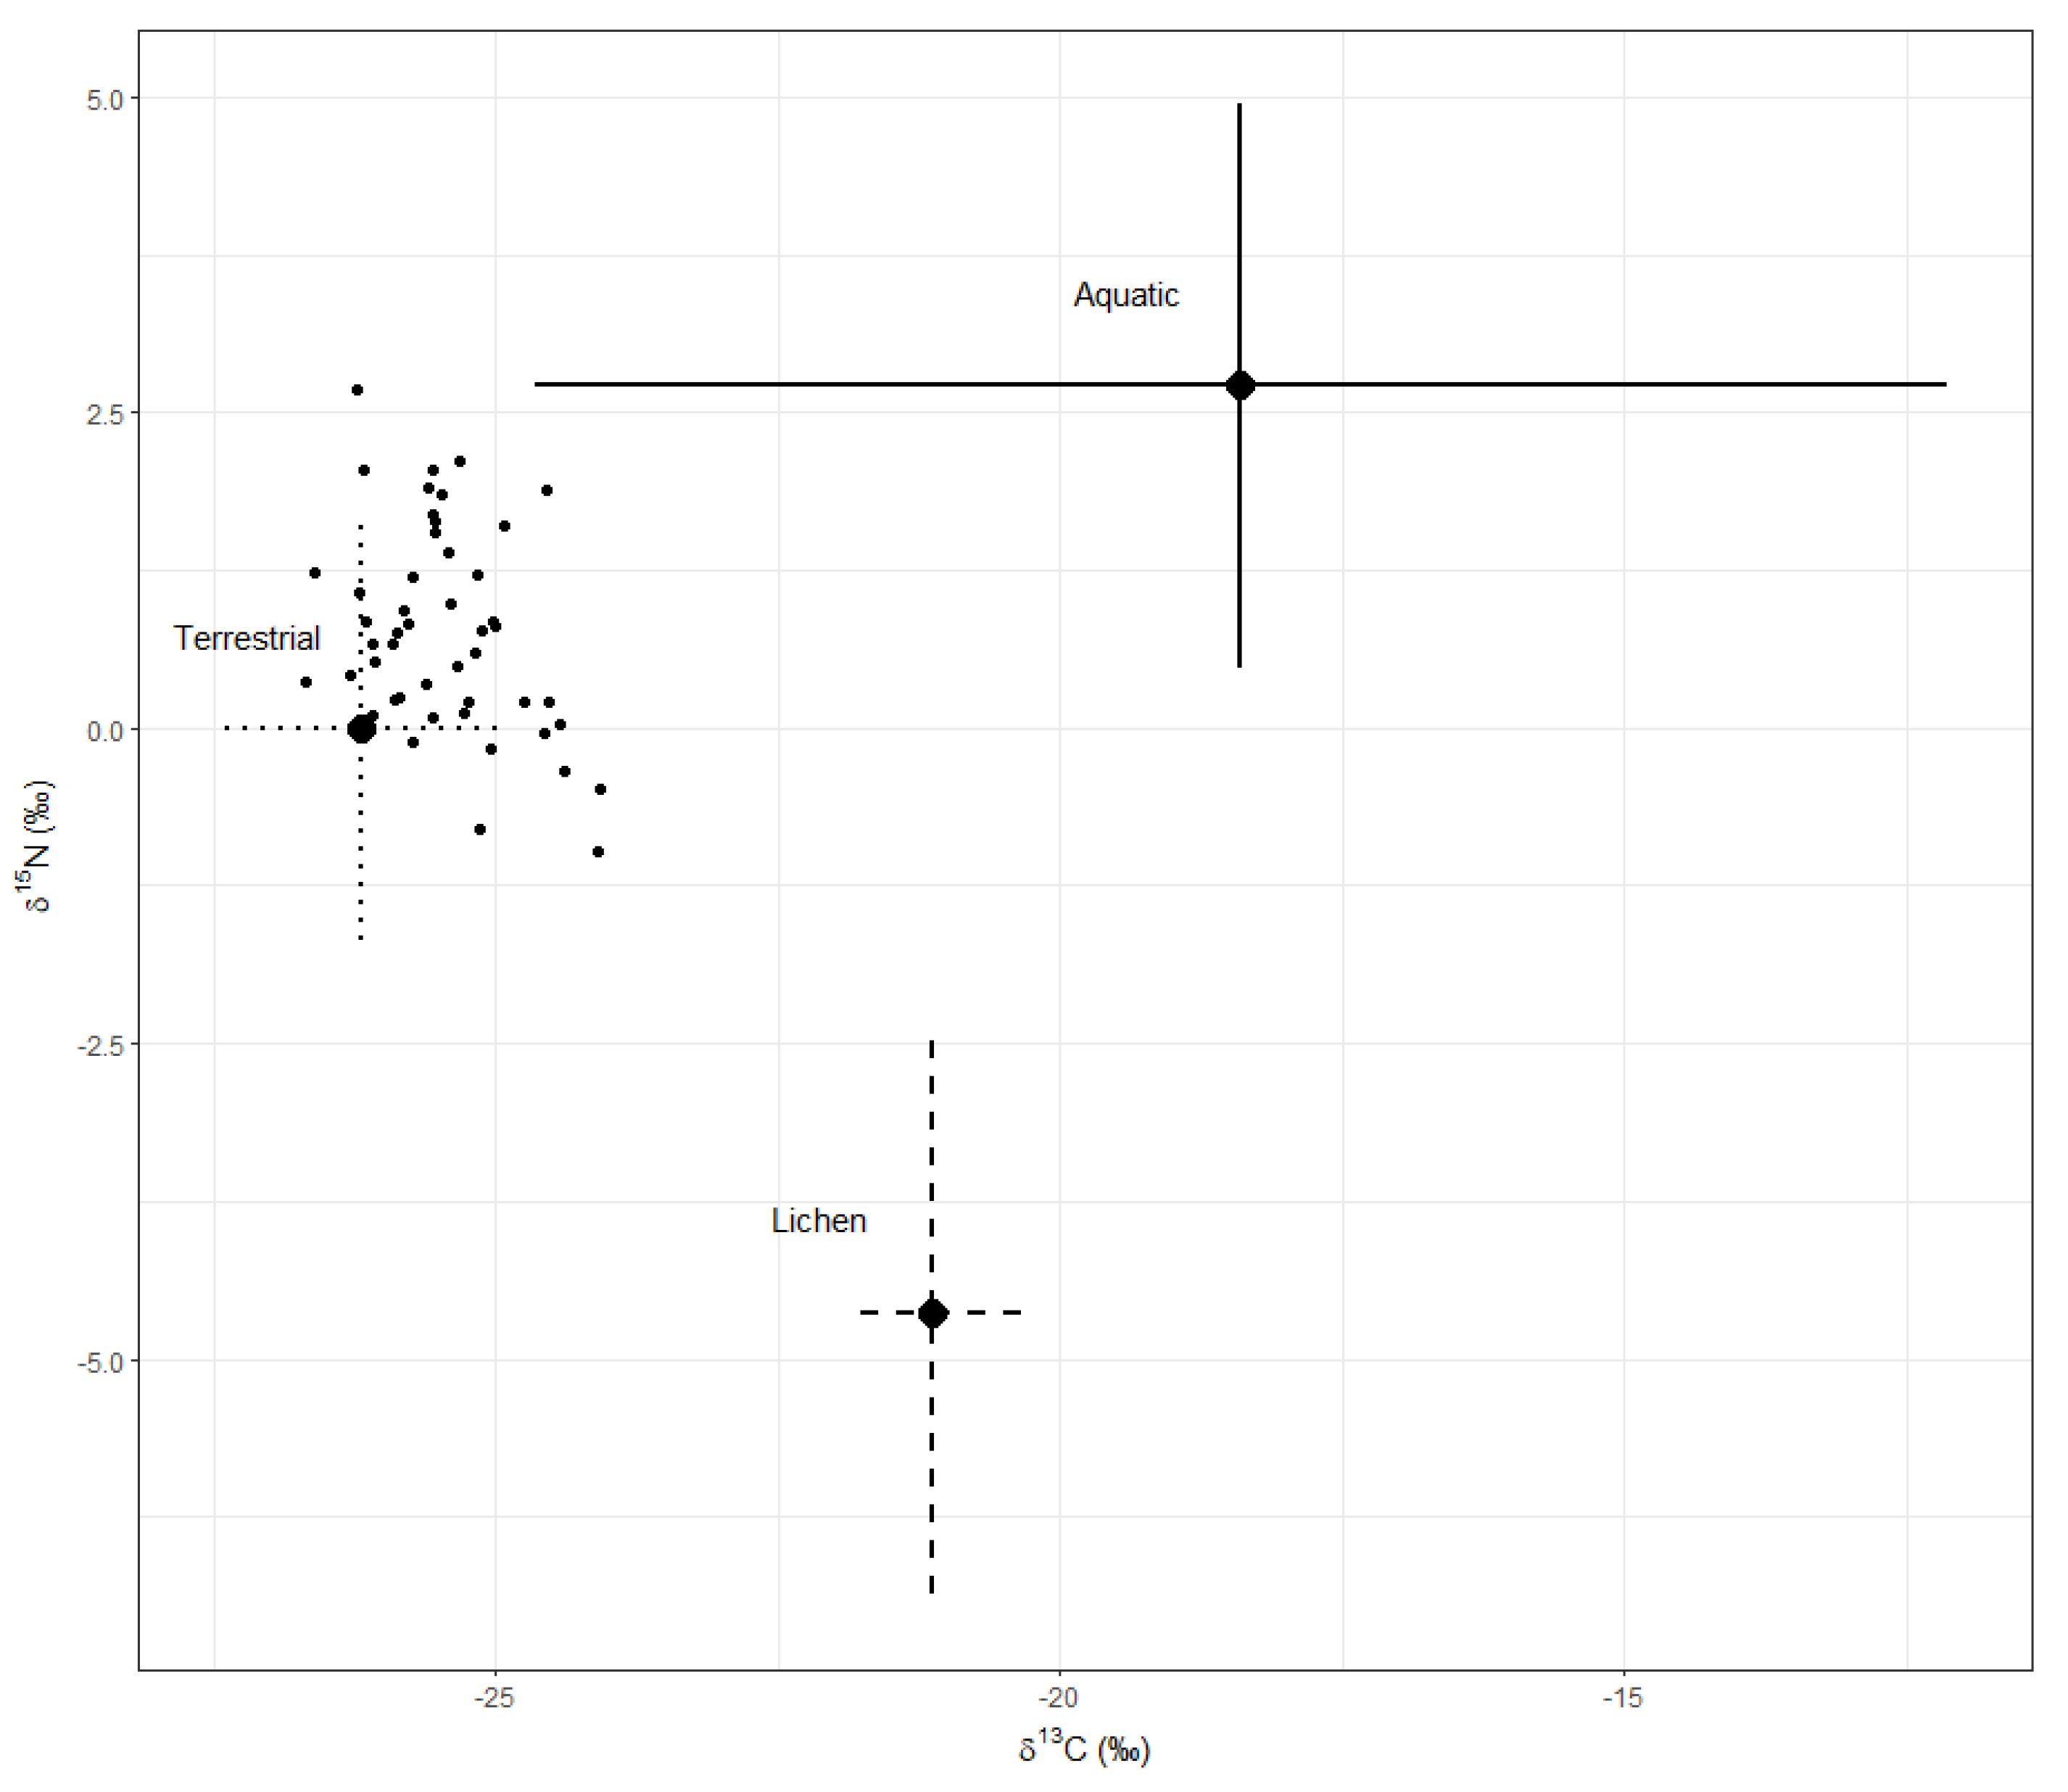
All forage types except summer and winter terrestrial plants had significantly different mean stable isotope values, with agreement between MANOVA (F6, 490 = 88.59, P < 0.0001) and DISTLM (F3, 245 = 92.51, P = 0.0001). Summer and winter terrestrial samples were subsequently pooled as “terrestrial plants” in mixing models which incorporated both summer and winter food sources (i.e., 3-source models; Figure 3). Aquatic macrophytes were significantly higher and lichens were significantly lower in δ15N relative to terrestrial plants (Kruskal–Wallis: χ2 = 133.90, df = 7, P < 0.0001), and both aquatic macrophytes and lichens were higher in δ13C than terrestrial plants (Kruskal–Wallis: χ2 = 151.68, df = 7, P < 0.0001). The variance among aquatic macrophyte δ13C was up to 50-fold greater than that of other forage types—a severe violation of both parametric and nonparametric assumptions; however, visual inspection of these data suggests that differences found between forage groups were real. Location was not a significant factor using either MANOVA (F2, 244 = 0.04, P = 0.961) or DISTML (F1, 245 = 2.15, P = 0.122). However, when within-group effects of location were tested, both summer (Kruskal–Wallis: χ2 = 10.74, df = 1, P = 0.001) and winter (Kruskal–Wallis: χ2 = 14.81, df = 1, P < 0.0001) terrestrial plants were significantly lower in δ13C and winter terrestrial plants were significantly higher in δ15N on the western end of the island (Kruskal–Wallis: χ2 = 16.04, df = 1, P < 0.0001), while location did not explain a significant portion of isotope variation for either aquatic macrophytes or lichens. A significant interaction between location and forage type (MANOVA, F6, 490 = 5.90, P < 0.0001; DISTLM, F3, 245 = 4.29, P = 0.002) can be explained by a pattern of western end exhibiting lower δ13C values in one or both isotopes for terrestrial plants and lichens while aquatic macrophytes showed the opposite pattern.
Both species (MANOVA: F10, 106 = 4.26, P < 0.0001) and location (MANOVA: F2, 52 = 5.22, P = 0.009) were significant factors explaining δ13C and δ15N variation in summer terrestrial plants—a result also obtained using DISTLM (species: F5, 48 = 7.06, P = 0.0001; location: F1, 48 = 5.87, P = 0.009). However, no within-group pairwise differences were found among species, so species were pooled as “summer terrestrial plants” for summer diet estimation (2-source). Samples from the western end were significantly lower in δ13C than eastern end samples (Kruskal–Wallis: χ2 = 10.74, df = 1, P = 0.001), but location did not have a significant effect on δ15N (Kruskal–Wallis: χ2 = 1.13, df = 1, P = 0.228).
The isotope composition of winter terrestrial plants differed both by species (MANOVA: F12, 74 = 7.80, P < 0.0001; DISTLM: F6, 81 = 7.32, P = 0.0001) and location (MANOVA: F2, 86 = 24.32, P < 0.0001; DISTLM: F6, 81 = 26.83, P = 0.0001). Among species, the isotope signature of white cedar was significantly different than all other species except quaking aspen, and balsam fir was significantly different from red-osier dogwood on the western end of the island. Despite these differences, no terrestrial species were partitioned into distinct isotopic groups and were subsequently pooled as “winter terrestrial plants” for winter diet estimation (2-source). With respect to location, samples from the western end were lower in δ13C and higher in δ15N in comparison to the eastern end of the island, but spatial differences were only significant for balsam fir.
3.2. Moose Hooves and Bone Marrow
3.2.1. Hairline
Neither δ13C (F1, 36 = 0.12, P = 0.731) nor δ15N (F1, 36 = 0.11, P = 0.746) from hairline samples differed between summer (n = 8, = −25.4 ± 0.1 (SE), 0.8‰ ± 0.2‰) and winter (n = 30, = −25.4 ± 0.8, 0.7‰ ± 0.9‰) mortalities. Among winter mortalities, hairline samples were higher in δ15N on the western end ( = 1.1‰ ± 0.9‰) in comparison to the eastern end ( = 0.5‰ ± 0.9‰) of the island, however differences were not significant (F1, 28 = 3.41, P = 0.075). Hoof δ15N for winter moose mortalities did not differ between moose with low (<70%) and high (>70%) bone marrow fat contents at the time of death (F1,7 = 2.42, P = 0.164). Since some moose δ15N variability could be attributable to sex (e.g., higher levels due to lactation by females or sex-specific fasting periods), and our sample of moose hooves was imbalanced with respect to sex, a term for sex was added to the model a posteriori. The model including both location (E/W) and sex was borderline significant (F2,26 = 3.25, P = 0.055), even though sex itself was not a significant factor in the model (P = 0.092), and inclusion of an interaction term improved the significance of the test for both location (F1,25 = 3.067, P = 0.026) and sex (F1,25 = 2.226, P = 0.054). The interaction term in this model was not significant (F1,25 = 1.726, P = 0.201). Neither location nor sex were significant factors explaining δ13C variability in hairline samples of winter moose mortalities (F2, 27 = 0.73, P = 0.541). Moose that died on the western end had lower bone marrow fat content ( = 51.8%) than moose on the eastern end ( = 73.0%), but the difference was not significant and the sample size was small (t0.05, 8 = 1.86, P = 0.094).
3.2.2. Chronology
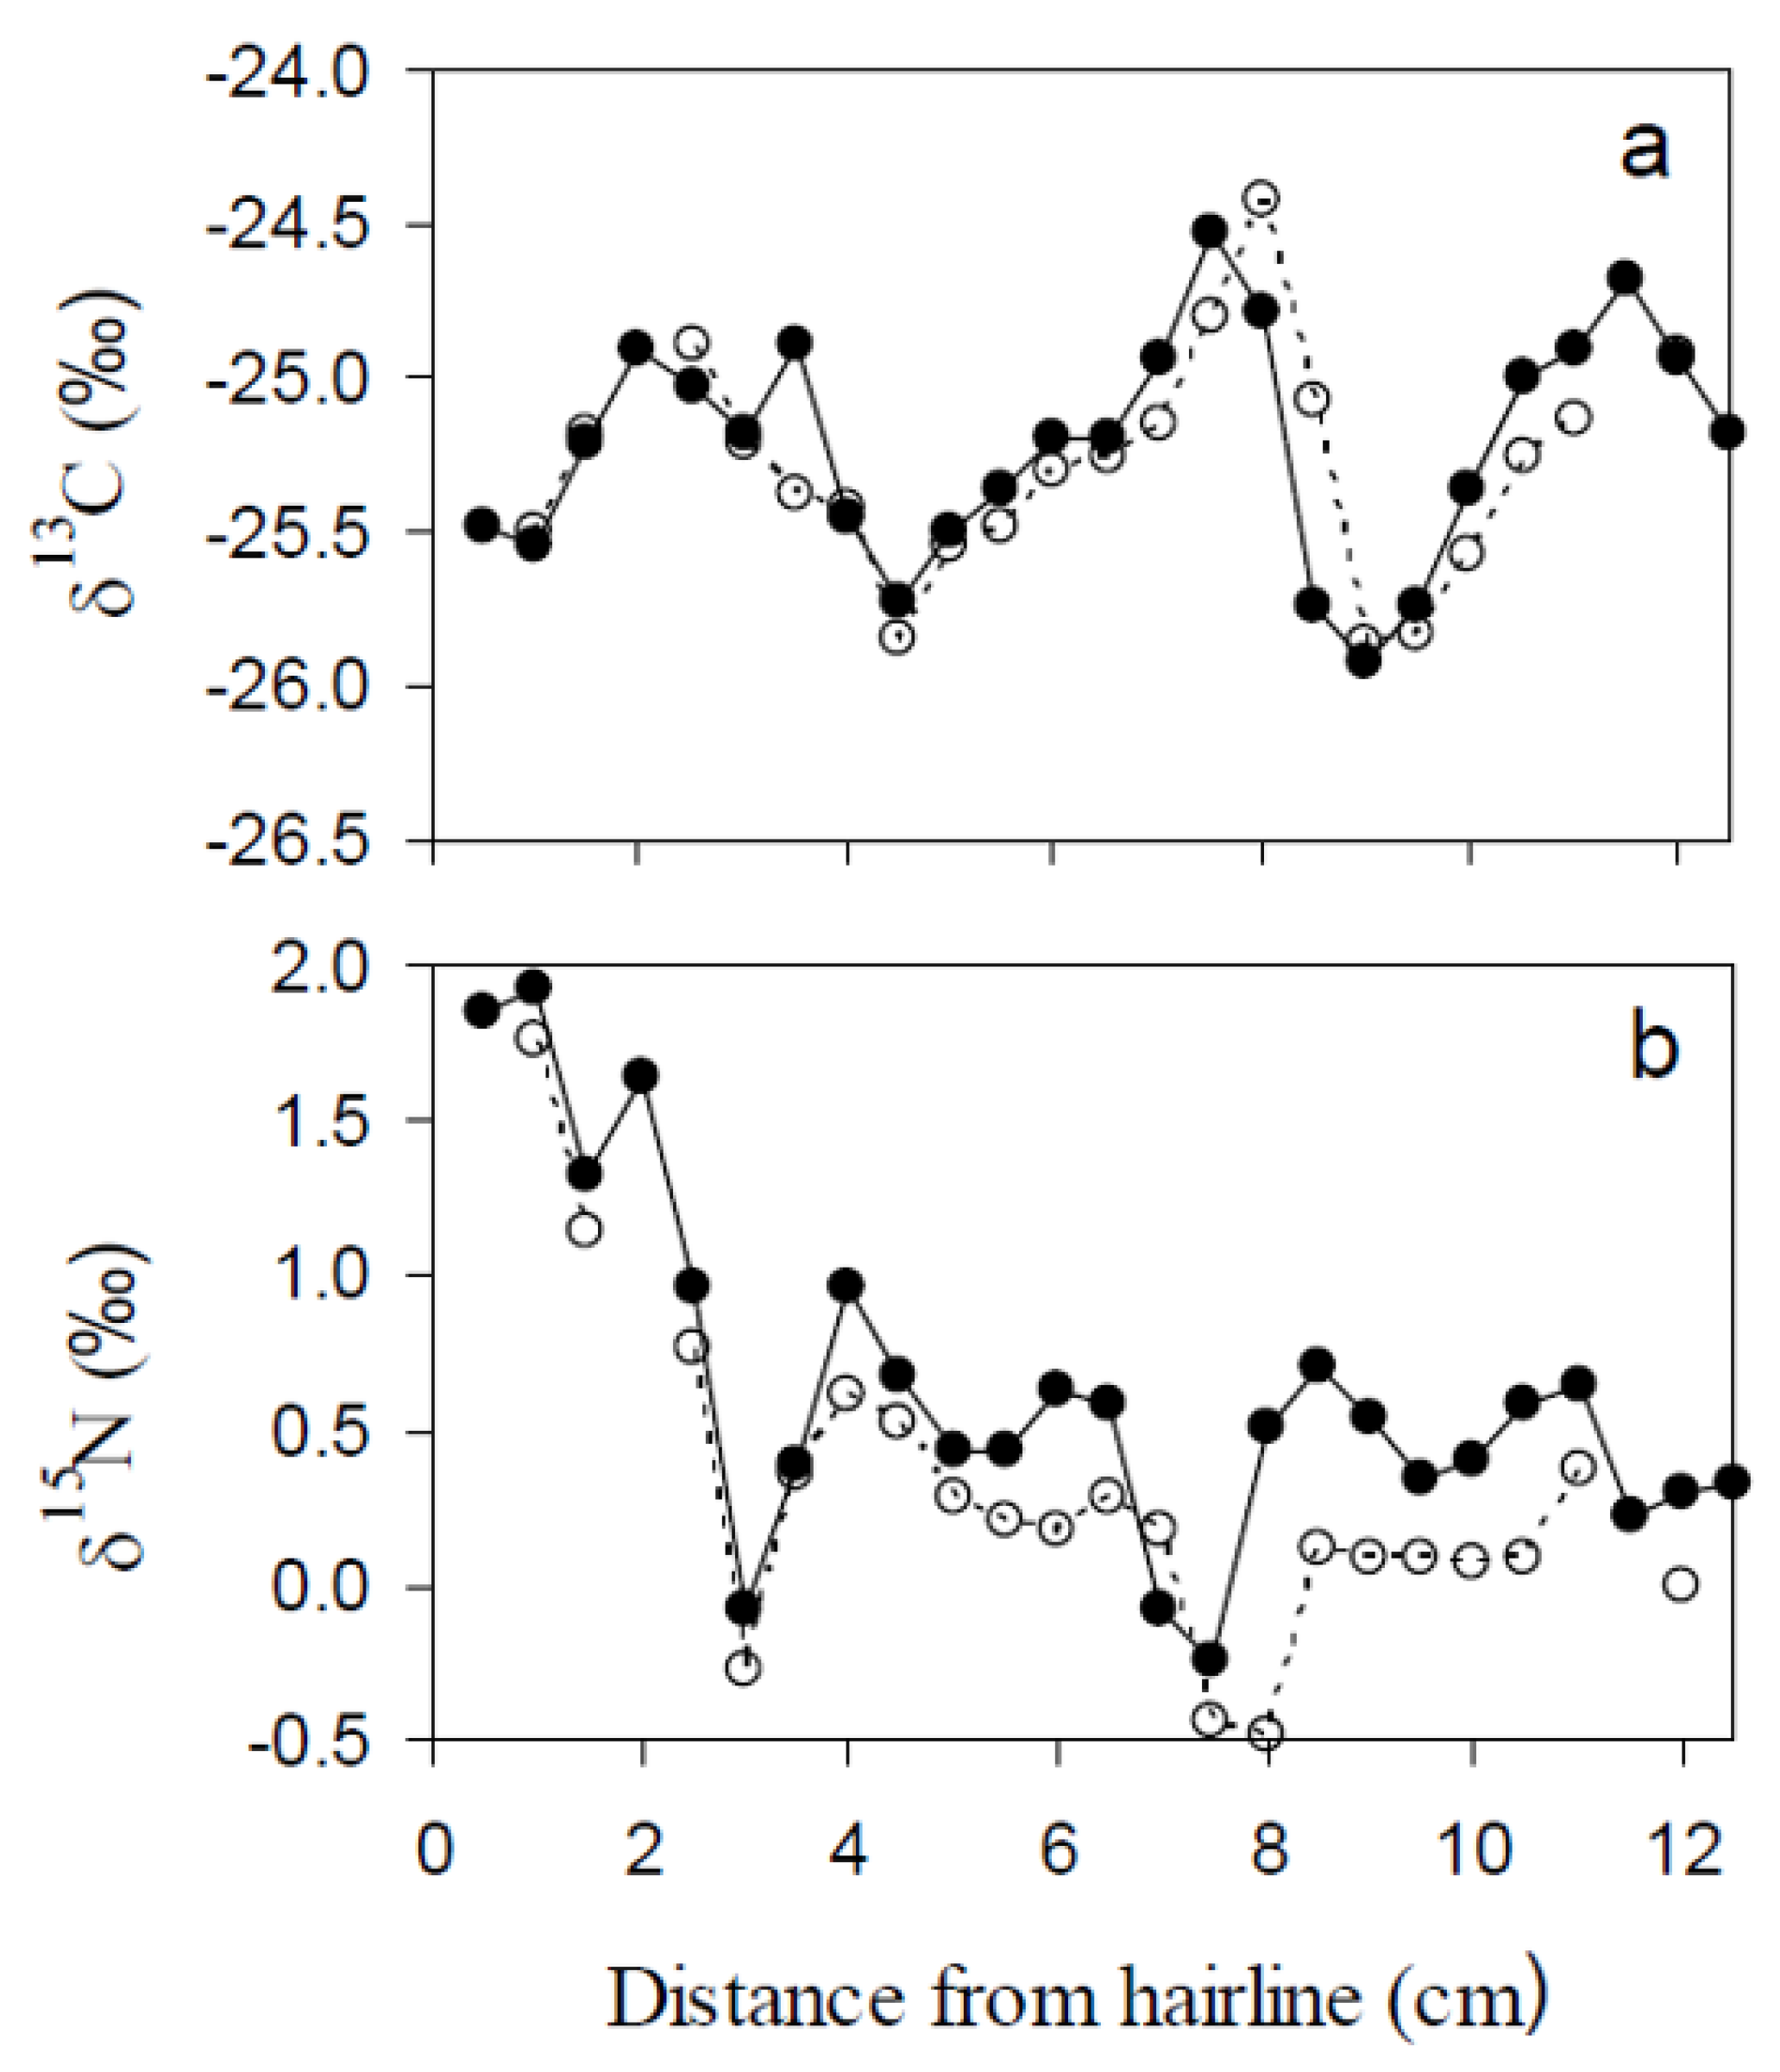
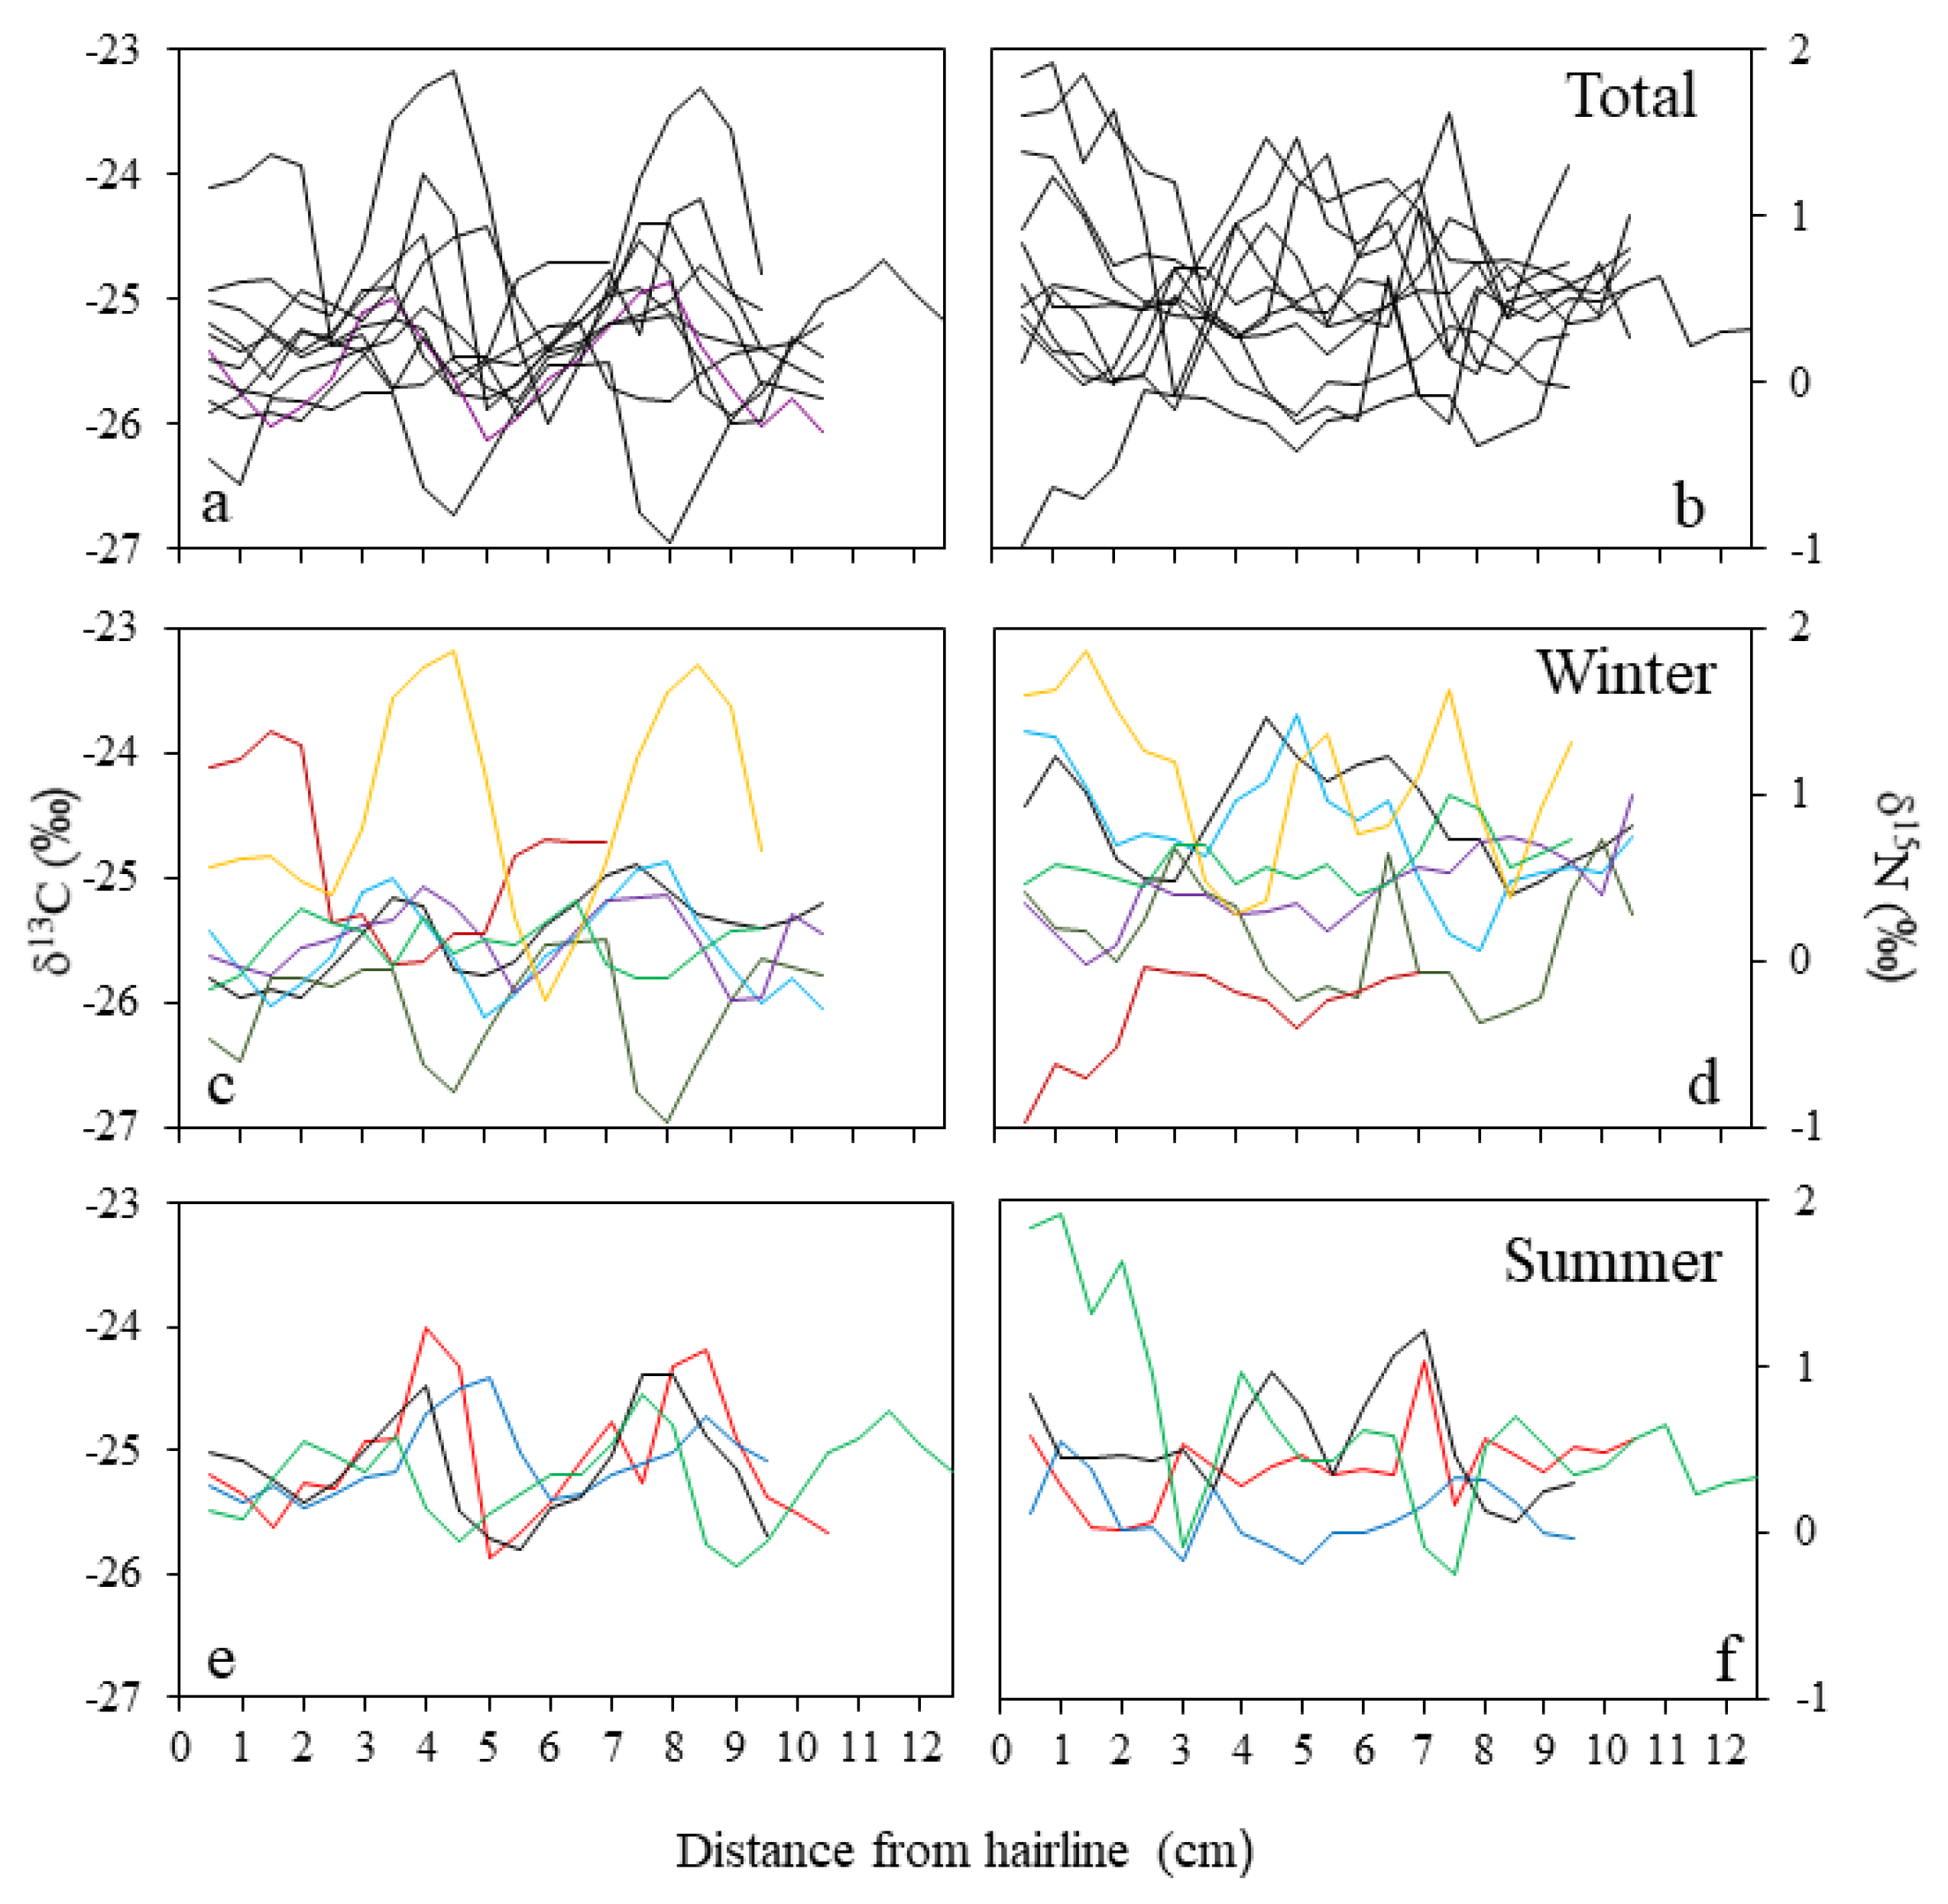
Each hoof chronology (n = 13) consisted of 14 to 21 subsamples, depending upon hoof length (range: 9.1–12.7 cm) and condition (Table 1). The mean isotope difference between sample replicates from adjacent hooves from a single adult female was 0.04‰ for δ13C and 0.29‰ for δ15N, both within measurement precision (Figure 4). A qualitative inspection of isotopic variability along hooves suggested that δ13C variability was cyclic, oscillating between −26.3‰ and −23.2‰ with an average amplitude of 1.4‰ (range: 0.7‰–2.8‰) and a period of approximately 4.0 cm (Figure 5a,c,e). δ15N ranged 0.6‰–2.2‰ ( = 1.2‰) along hooves, but no visual pattern of variability was evident (Figure 5b,d,f). There were no apparent differences in cycle state between hooves collected during summer and winter (Figure 5c–f). If this pattern were indicative of seasonal cycles, each hoof would then represent 2 to 3 years of growth.
Since isotope values measured at the hoof hairline did not differ between summer and winter mortalities, we could not reliably determine the position of summer and winter growth along the length of individual hooves in this way. However, when extrapolated from the growth rate of caribou hooves [68], the estimated annual growth rate of moose hooves was 13.7 cm/year, suggesting that individual hooves represent only a 7-to-9-month record of diet (Figure 6). Using this growth rate, a time series was reconstructed for only the 6 (of 13) hoof chronologies for which a precise date of death (±14 d) was known. There was no consistent relationship between δ13C and δ15N along time-scaled hoof chronologies (Figure 6). Nine of the thirteen hooves, including all six that were scaled to the growth rate of caribou, showed GALs (n < 3), and the average distance between lines on a single hoof was 3.5 cm. GALs on hooves that were scaled to an annual cycle were positioned between August and October (Figure 6).
3.3. Diet Estimation
Overall, hairline samples indicated moose diets were 88.5% ± 2.1% (mean ± SD) terrestrial vegetation, 10.7% ± 2.1% aquatic macrophytes, and 0.8% ± 0.8% arboreal lichens. Due to the small sample size of hooves obtained from summer mortalities at each end of the island (neast = 5, nwest = 2), we could not evaluate our hypothesis that the estimated contribution of aquatic macrophytes to the summer diet of moose would differ spatially. When summer hairline isotope data were pooled with respect to location, the estimated contribution of aquatic macrophytes to the summer diet of moose was 13.2% ± 3.3% (mean ± SD; Table 2). Lichens contributed more to the winter moose diet on the western end (3.7% ± 0.5%) than the eastern end (0.01% ± 0.005%) of the island (Table 2). Reducing Δ13C from 3.0‰ to 1.8‰ to account for a low-protein diet increased the proportional contribution of aquatic macrophytes and lichens to the summer and winter diets of moose by up to 14% and 25%, respectively (Table 2).
The position of GALs often preceded a peak in δ13C values (Figure 6). If GALs are indeed laid down in winter, we may assume the peak represents summer growth following arrested winter growth. If we then assume that apparent cycles in δ13C values represent seasonal variation and peaks and troughs represent summer and winter diets, respectively (see Discussion), then dietary estimations from our models were 74%–79% terrestrial plants, 17%–18% aquatic macrophytes, and 5%–8% lichens for winter diets and 92%–96% terrestrial plants, 3–6% aquatic macrophytes, and 1%–2% lichens for summer diets. The range of values represents winter and summer mortalities. Five of seven winter mortalities were wolf-kills, the other two were unknown cause and probable starvation. The summer mortalities were a combination of wolf-kills, disease, and starvation.
4. Discussion
Spatial differences in δ15N observed in the hooves from winter moose mortalities followed a pattern that has been previously observed at the western end on the island. Namely, δ15N enrichment was observed in teeth [80] and urine (Bada et al., unpublished data) from moose at Isle Royale. This may be due to spatial distinctions in edaphic and geological features [26], disturbance legacies (e.g., fire, herbivory [17,81]), vegetation [59,65], and moose nutritional status [82]. Moose diets also differ by region of the island [83]. It is also possible that differences in balsam fir abundance on the eastern end of the island contribute to spatial δ15N differences in moose [84]. No significant difference in δ15N was detected among winter forage species. Both winter and summer terrestrial plants were lower in δ13C on the western end, but the effect of location on δ15N was only significant during the winter for balsam fir. When examined by location, winter forage isotope mixture values suggest that moose δ15N differences may be a result of spatial δ15N differences among forage species rather than increased physiological enrichment. However, δ13C was also lower on the western end, which was a pattern not revealed in moose hairline data. In areas with dramatic spatial variation in underlaying isotopic signatures, food webs and dietary studies can be influenced [85,86].
Mixing model results indicate that between 13% and 27% of summer moose diet may be from aquatic sources (depending on the trophic shift or fractionation used). This aquatic diet fraction is comparable to a previous estimate of 18% aquatic plants in moose diet [30]. It is important to highlight that aquatic macrophytes contribute disproportionately to N assimilated by moose because of the high protein content of aquatic macrophytes [22]. To test whether increased aquatic feeding habitat on the eastern end of the island results in moose in better winter body condition requires an increase in sample size in order to be tested robustly. Furthermore, cover of watershield (Brasenia schreberi), a previously abundant aquatic macrophyte, has recently been reduced in many of Isle Royale’s wetlands during periods of high beaver (Castor canadensis) and moose density that coincided with low wolf abundance [87]. Indeed, beaver diets include high amounts of aquatic vegetation [54,55,88], potentially leading to competition between moose and beaver.
Lichens in moose diet were considered negligible in all models except the low-protein trophic discrimination factor model, which estimated that 28% of moose winter diet on the western end of the island is composed of lichens. Given our observations in the field, it is unlikely that an important food source was omitted from this analysis, but lichen may not be an important food source [83]. Fractionation of δ15N in addition to trophic shift can occur as a result of diet quality [89,90] and starvation [43,91,92], contributing to variation in isotopic values among individual moose. Diet estimates based on stable isotopes are also improved when food source isotope values exhibit low variability [44]. Aquatic macrophyte δ13C among our samples was quite variable, which has also been observed elsewhere both among and within species groups [88,93]. This is partly attributable to various sources of inorganic C used by freshwater autotrophs [94].
Overall, our data indicate that aquatic macrophytes constitute an ecologically meaningful portion of moose diet during summer. Continued advances in the field of stable isotope ecology can capitalize on the isotopic differences detected for aquatic macrophytes and lichens and thereby improve our understanding of moose foraging ecology at finer scales [95]. We also recommend future studies focusing on the spatial pattern variability of stable isotopes for Isle Royale moose, ideally sampling a tissue whose rate of growth has been well-studied (e.g., hair, antlers).
It would be promising to examine the relative influence of aquatic plant abundance as a seasonal pulse in forage quality and how it may affect spatial differences in population parameters. This line of inquiry may contribute to our understanding of moose population dynamics on Isle Royale. In this system, balsam fir abundance and climate explained more interannual variability in the moose population than did predation [84]. Still, more than half the overall variability in moose population numbers remains unexplained [84]. Exploration of methods and techniques to estimate aquatic forage available to moose would be a significant contribution to population models.
If hoof isotope chronologies reflect aquatic feeding as expected, then hoof analysis should reveal cyclic patterns of higher levels in both δ13C and δ15N over the baseline signature for terrestrial plants during summer [52]. The amplitude of higher levels should also increase as the contribution of aquatics to the overall diet increases. Departures in the range of variation in consumer isotope chronologies from baseline variation have been shown to be suitable gauges of seasonal shifts in diet [49]. The isotope variation we measured along moose hooves was within that found among baseline terrestrial plant isotope values, which suggests that seasonal fluctuations in moose diet at Isle Royale are possibly small enough to avert clear detection in the hoof chronology. To be clear, this does not indicate that aquatic macrophytes in moose diet are less important or insignificant, but rather that the terrestrial fraction of moose diet exhibits low isotopic variability between seasons.
It is clear that tissue isotope chronologies can be valuable in reconstructing seasonal changes in animal diet, and this approach has enhanced our understanding of foraging ecology. However, the interpretation of isotope chronologies derived from moose hooves is presently limited by a limited understanding of hoof growth rates and how they may vary with season, age, and health. Locating the seasonal growth along hooves was unreliable and resulted in ecologically implausible dietary estimates (e.g., more aquatic macrophytes in winter diets when unavailable). The location of GALs did not match the position of winter growth for moose hooves as scaled to caribou hoof growth rates. Hence, the growth rate of caribou hooves may not be an appropriate model for moose, or GALs may have been formed in response to physiological events not in winter. We considered caribou because of their similarity in residing in extremely fluctuating seasonal environments. We were still cautious regarding the use of captive animals, but presumed caribou would be as close a proxy as available. Even if moose hoof growth dynamics were determined, then application to wild populations may still be limited where seasonal changes in diet are accompanied by significant changes in forage quality [22] and associated body condition. In such a scenario, tissue growth can slow significantly or completely stop due to nutritional stress (i.e., during winter [70]). Additionally, our sampling of hooves at 0.5-cm increments could have missed obtaining samples from GALs and winter diets if growth is extremely arrested during winter.
Lastly, the value of traditional techniques for studying the foraging ecology of moose through direct observation of known individuals should not be underestimated. Though it is challenging to quantify aquatic macrophyte intake with direct observation, this approach enables the study of spatial variability in foraging habitat and seasonal movements to be linked to fecundity, body condition, and cause-specific mortality for individuals.
Author Contributions
Conceptualization, K.B.T. and R.O.P.; methodology, K.B.T., R.O.P. and W.J.S.; formal analysis, K.B.T, R.O.P. and W.J.S.; investigation, K.B.T. and R.O.P.; resources, R.O.P.; data curation, K.B.T. and R.O.P.; writing—original draft preparation, K.B.T.; writing—review and editing, K.B.T., W.J.S., R.O.P. and J.K.B.; visualization, K.B.T., W.J.S., R.O.P. and J.K.B.; supervision, R.O.P.; project administration, R.O.P.; funding acquisition, R.O.P.
Funding
This research was funded by the Ecosystem Science Center at Michigan Tech and the National Science Foundation (DEB-9903871, and support to RP from the Robbins Chair in Sustainable Management of the Environment at Michigan Technological University. Support was provided by the National Park Service. This work was also supported by grants to J.K.B. (NSF ID#1545611, NSF ID#1556676).
Acknowledgments
We thank Leah Vucetich, Joe Kaplan, Damon McCormick, Mark Romanski, Chris Lawler, Jason Deutsch, and Nathan Hambel for field assistance, and Kris Raisanen-Schourek, Brian Allshouse, Bethany Baibak, and Devin Donaldson for assistance with sample preparation. Janet Marr provided expertise in aquatic macrophyte identification. Forage plant carbon and nitrogen content was determined by Jennifer Eikenberry at the School of Forest Resources and Environmental Science, Michigan Technological University. Jack Oelfke and Mark Romanski of the National Park Service provided logistical support in the field. Kurt Pregitzer, Christian Giardina, Peter Hurley, and Laura Kruger provided valuable comments on earlier versions of this manuscript. Tom Drummer and Jim Pickens provided useful advice on data analysis. Thank you to two anonymous reviewers and members of the SPATIAL group at the University of Utah for constructive feedback that improved the manuscript.
Conflicts of Interest
The authors declare no conflict of interest. The funders had no role in the design of the study; in the collection, analyses, or interpretation of data; in the writing of the manuscript; or in the decision to publish the results.
References
- Taber, R.D.; Dasmann, R.F. The dynamics of three natural populations of the deer Odocoileus hemionus columbianus. Ecology 1957, 38, 233–246. [Google Scholar] [CrossRef]
- Klein, D.R. Food selection by North American deer and their response to over-utilization of preferred plant species. In Animal Populations in Relation to Their Food Resources; Watson, A., Ed.; British Ecological Society: Oxford, UK, 1970; pp. 25–46. [Google Scholar]
- Eadie, J. Sheep production and pastoral resources. In Animal Populations in Relation to Their Food Resources; Watson, A., Ed.; Blackwell Scientific Publications: Oxford, UK, 1970. [Google Scholar]
- Gibson, R.M.; Guinness, F.E. Differential reproduction among red deer (Cervus elaphus) stags on Rhum. J. Anim. Ecol. 1980, 49, 199–208. [Google Scholar] [CrossRef]
- Elser, J.J.; Fagan, W.F.; Denno, R.F.; Dobberfuhl, D.R.; Folarin, A.; Huberty, A.; Interlandi, S.; Kilham, S.S.; McCauley, E.; Schulz, K.L.; et al. Nutritional constraints in terrestrial and freshwater food webs. Nature 2000, 408, 578–580. [Google Scholar] [CrossRef]
- Guinness, F.E.; Clutton-Brock, T.H.; Albon, S.D. Factors affecting calf mortality in red deer (Cervus elaphus). J. Anim. Ecol. 1978, 47, 817–832. [Google Scholar] [CrossRef]
- Stodart, E.; Myers, K. The effects of different foods on confined populations of wild rabbits, Oryctolagus cuniculus (L.). Csiro Wildl. Res. 1966, 11, 111–124. [Google Scholar] [CrossRef]
- Newton, I.; Kerbes, R.H. Breeding of greylag geese (Anser anser) on the Outer Hebrides, Scotland. J. Anim. Ecol. 1974, 43, 771–783. [Google Scholar] [CrossRef]
- Hunter, M.D.; Ohgushi, T.; Price, P.W. Effects of Resource Distribution on Animal Plant Interactions; Elsevier: San Diego, CA, USA, 2012; ISBN 978-0-12-361955-6. [Google Scholar]
- Jefferies, R.L.; Klein, D.R.; Shaver, G.R. Vertebrate herbivores and northern plant communities: Reciprocal influences and responses. Oikos 1994, 71, 193–206. [Google Scholar] [CrossRef]
- Moen, R.; Pastor, J.; Cohen, Y. A spatially explicit model of moose foraging and energetics. Ecology 1997, 78, 505. [Google Scholar] [CrossRef]
- Mattson, W.J., Jr. Herbivory in relation to plant nitrogen content. Annu. Rev. Ecol. Syst. 1980, 11, 119–161. [Google Scholar] [CrossRef]
- Karns, P.D. Population distribution, density and trends. In Ecology and Management of the North American Moose; Franzmann, A.W., Schwartz, C.C., Eds.; University Press of Colorado: Boulder, CO, USA, 2007; pp. 125–139. [Google Scholar]
- Clifford, A.B.; Witmer, L.M. Case studies in novel narial anatomy: 2. The enigmatic nose of moose (Artiodactyla: Cervidae: Alces alces). J. Zool. 2004, 262, 339–360. [Google Scholar] [CrossRef]
- Schwartz, C.C.; Hubbert, M.E.; Franzmann, A.W. Energy requirements of adult moose for winter maintenance. J. Wildl. Manag. 1988, 52, 26. [Google Scholar] [CrossRef]
- Vucetich, J.A.; Peterson, R.O. The influence of top–down, bottom–up and abiotic factors on the moose (Alces alces) population of Isle Royale. Proc. R. Soc. Lond. B Biol. Sci. 2004, 271, 183–189. [Google Scholar] [CrossRef] [PubMed]
- Peterson, R.O. Wolf Ecology and Prey Relationships on Isle Royale; US Government Printing Office: Washington, DC, USA, 1977.
- McLaren, B.E.; Peterson, R.O. Wolves, moose, and tree rings on Isle Royale. Science 1994, 266, 1555–1558. [Google Scholar] [CrossRef] [PubMed]
- Geist, V. Deer of the World: Their Evolution, Behaviour, and Ecology; Stackpole Books: Mechanicsburg, PA, USA, 1998; ISBN 1-84037-094-7. [Google Scholar]
- Schwartz, C.C.; Renecker, L.A. Nutrition and energetics. In Ecology and Management of the North American Moose; Franzmann, A.W., Schwartz, C.C., Eds.; University Press of Colorado: Boulder, CO, USA, 2007; pp. 141–171. [Google Scholar]
- MacCracken, J.G.; Van Ballenberghe, V.; Peek, J.M. Use of aquatic plants by moose: Sodium hunger or foraging efficiency? Can. J. Zool. 1993, 71, 2345–2351. [Google Scholar] [CrossRef]
- Tischler, K.B. Aquatic Plant Nutritional Quality and Contribution to Moose Diet at Isle Royale National Park. Master’s Thesis, Michigan Technological University, Houghton, MI, USA, 2004. [Google Scholar]
- Fraser, D.; Chavez, E.R.; Palohelmo, J.E. Aquatic feeding by moose: Selection of plant species and feeding areas in relation to plant chemical composition and characteristics of lakes. Can. J. Zool. 1984, 62, 80–87. [Google Scholar] [CrossRef]
- Fryxell, J.M.; Doucet, C.M. Diet choice and the funcional response of beavers. Ecology 1993, 74, 1297–1306. [Google Scholar] [CrossRef]
- Ceacero, F.; Landete-Castillejos, T.; Miranda, M.; García, A.J.; Martínez, A.; Gallego, L. Why do cervids feed on aquatic vegetation? Behav. Process. 2014, 103, 28–34. [Google Scholar] [CrossRef]
- Huber, N.K. Glacial and Postglacial Geologic History of Isle Royale National Park, Michigan; U.S. Geological Survey Professional Paper 754-A; U.S. Government Printing Office: Washington, DC, USA, 1973.
- Peek, J.M. Habitat relationships. In Ecology and Management of the North American Moose; Franzmann, A.W., Schwartz, C.C., Eds.; University Press of Colorado: Boulder, CO, USA, 2007; pp. 351–375. ISBN 1-56098-775-8. [Google Scholar]
- Morris, D.M. Aquatic Habitat Use by North American Moose (Alces alces) and Associated Richness and Biomass of Submersed and Floating-Leaved Aquatic Vegetation in North-Central Minnesota. Master’s Thesis, Lakehead University, Thunder Bay, ON, Canada, 2014. [Google Scholar]
- Kelly, J.F. Stable isotopes of carbon and nitrogen in the study of avian and mammalian trophic ecology. Can. J. Zool. 2000, 78, 1–27. [Google Scholar] [CrossRef]
- Belovsky, G.E.; Jordan, P.A. The time-energy budget of a moose. Theor. Popul. Biol. 1978, 14, 76–104. [Google Scholar] [CrossRef]
- Park, R.; Epstein, S. Carbon isotope fractionation during photosynthesis. Geochim. Cosmochim. Acta 1960, 21, 110–126. [Google Scholar] [CrossRef]
- Bender, M.M. Mass spectrometric studies of carbon 13 variations in corn and other grasses. Radiocarbon 1968, 10, 468–472. [Google Scholar] [CrossRef]
- Bender, M.M. Variations in the 13C/12C ratios of plants in relation to the pathway of photosynthetic carbon dioxide fixation. Phytochemistry 1971, 10, 1239–1244. [Google Scholar] [CrossRef]
- Boutton, T.W.; Arshad, M.A.; Tieszen, L.L. Stable isotope analysis of termite food habits in East African grasslands. Oecologia 1983, 59, 1–6. [Google Scholar] [CrossRef] [PubMed]
- Boutton, T.W.; Smith, B.N.; Harrison, A.T. Carbon isotope ratios and crop analyses of Arphia (Orthoptera: Acrididae) species in southeastern Wyoming grassland. Oecologia 1980, 45, 299–306. [Google Scholar] [CrossRef] [PubMed]
- Fry, B.; Sherr, E.B. δ13C measurements as indicators of carbon flow in marine and freshwater ecosystems. In Stable Isotopes in Ecological Research; Rundel, P.W., Ehleringer, J.R., Nagy, K.A., Eds.; Springer: New York, NY, USA, 1989; pp. 196–229. [Google Scholar]
- Hobson, K.A. Use of stable-carbon isotope analysis to estimate marine and terrestrial protein content in gull diets. Can. J. Zool. 1987, 65, 1210–1213. [Google Scholar] [CrossRef]
- Tieszen, L.L.; Boutton, T.W. Stable carbon isotopes in terrestrial ecosystem research. In Stable Isotopes in Ecological Research; Rundel, P.W., Ehleringer, J.R., Nagy, K.A., Eds.; Springer: New York, NY, USA, 1989; pp. 167–195. [Google Scholar]
- Högberg, P. Tansley review No. 95 15N natural abundance in soil-plant systems. New Phytol. 1997, 137, 179–203. [Google Scholar]
- Ben-David, M.; Bowyer, R.T.; Duffy, L.K.; Roby, D.D.; Schell, D.M. Social behavior and ecosystem processes: River otter latrines and nutrient dynamics of terrestrial vegetation. Ecology 1998, 79, 2567–2571. [Google Scholar] [CrossRef]
- Miyake, Y.; Wada, E. The abundance ratio of 15N/14N in marine environments. Rec. Oceanogr. Work. Jpn. 1967, 9, 37–53. [Google Scholar]
- Minagawa, M.; Wada, E. Stepwise enrichment of 15N along food chains: Further evidence and the relation between δ15N and animal age. Geochim. Cosmochim. Acta 1984, 48, 1135–1140. [Google Scholar] [CrossRef]
- Hobson, K.A.; Alisauskas, R.T.; Clark, R.G. Stable-nitrogen isotope enrichment in avian tissues due to fasting and nutritional stress: Implications for isotopic analyses of diet. Condor 1993, 95, 388–394. [Google Scholar] [CrossRef]
- Phillips, D.L. Mixing models in analyses of diet using multiple stable isotopes: A critique. Oecologia 2001, 127, 166–170. [Google Scholar] [CrossRef] [PubMed]
- Phillips, D.L.; Koch, P.L. Incorporating concentration dependence in stable isotope mixing models. Oecologia 2002, 130, 114–125. [Google Scholar] [CrossRef] [PubMed]
- Schwarcz, H.P. Some theoretical aspects of isotope paleodiet studies. J. Archaeol. Sci. 1991, 18, 261–275. [Google Scholar] [CrossRef]
- Moore, J.W.; Semmens, B.X. Incorporating uncertainty and prior information into stable isotope mixing models. Ecol. Lett. 2008, 11, 470–480. [Google Scholar] [CrossRef] [PubMed]
- Darimont, C.T.; Reimchen, T.E. Intra-hair stable isotope analysis implies seasonal shift to salmon in gray wolf diet. Can. J. Zool. 2002, 80, 1638–1642. [Google Scholar] [CrossRef]
- Hobson, K.A.; Schell, D.M.; Renouf, D.; Noseworthy, E. Stable carbon and nitrogen isotopic fractionation between diet and tissues of captive seals: Implications for dietary reconstructions involving marine mammals. Can. J. Fish. Aquat. Sci. 1996, 53, 528–533. [Google Scholar] [CrossRef]
- Schoeninger, M.J.; Iwaniec, U.T.; Nash, L.T. Ecological attributes recorded in stable isotope ratios of arboreal prosimian hair. Oecologia 1998, 113, 222–230. [Google Scholar] [CrossRef]
- Hobson, K.A.; McLellan, B.N.; Woods, J.G. Using stable carbon (δ13C) and nitrogen (δ15N) isotopes to infer trophic relationships among black and grizzly bears in the upper Columbia River basin, British Columbia. Can. J. Zool. 2000, 78, 1332–1339. [Google Scholar] [CrossRef]
- Kielland, K. Stable isotope signatures of moose in relation to seasonal forage composition: A hypothesis. Alces 2001, 37, 329–337. [Google Scholar]
- Schoeninger, M.J.; Bada, J.L. Carbon and nitrogen stable isotope variation in primate hair reflects ecological and dietary variation. In Abstracts of Papers of the American Chemical Society; American Chemical Society: Washington, DC, USA, 2001; Volume 221, p. U534. [Google Scholar]
- Severud, W.J.; Belant, J.L.; Windels, S.K.; Bruggink, J.G. Seasonal variation in assimilated diets of American beavers. Am. Midl. Nat. 2013, 169, 30–42. [Google Scholar] [CrossRef]
- Milligan, H.E.; Humphries, M.M. The importance of aquatic vegetation in beaver diets and the seasonal and habitat specificity of aquatic-terrestrial ecosystem linkages in a subarctic environment. Oikos 2010, 119, 1877–1886. [Google Scholar] [CrossRef]
- Zazzo, A.; Harrison, S.M.; Bahar, B.; Moloney, A.P.; Monahan, F.J.; Scrimgeour, C.M.; Schmidt, O. Experimental determination of dietary carbon turnover in bovine hair and hoof. Can. J. Zool. 2007, 85, 1239–1248. [Google Scholar] [CrossRef]
- Phillips, D.L.; Gregg, J.W. Uncertainty in source partitioning using stable isotopes. Oecologia 2001, 127, 171–179. [Google Scholar] [CrossRef] [PubMed]
- Semmens, B.X.; Ward, E.J.; Moore, J.W.; Darimont, C.T. Quantifying inter- and intra-population niche variability using hierarchical Bayesian stable isotope mixing models. PLoS ONE 2009, 4, e6187. [Google Scholar] [CrossRef] [PubMed]
- Linn, R.M. The Spruce-Fir, Maple-Birch Transition in Isle Royale National Park. Ph.D. Thesis, Duke University, Durham, NC, USA, 1957. [Google Scholar]
- Sattler, R.L.; Willoughby, J.R.; Swanson, B.J. Decline of heterozygosity in a large but isolated population: A 45-year examination of moose genetic diversity on Isle Royale. PeerJ 2017, 5, e3584. [Google Scholar] [CrossRef]
- Mech, L.D. The wolves of Isle Royale; U.S. National Park Service Fauna Series, no. 7. U.S. Government Printing Office: Washington, DC, USA, 1966.
- Risenhoover, K.A. Winter Foraging Strategies of Moose in Subarctic and Boreal Forest Habitats. Ph.D. Thesis, Michigan Technological University, Houghton, MI, USA, 1987. [Google Scholar]
- Peek, J.M.; Urich, D.L.; Mackie, R.J. Moose habitat selection and relationships to forest management in northeastern Minnesota. Wildl. Monogr. 1976, 48, 3–65. [Google Scholar]
- Ackerman, T.N. Moose Response to Summer Heat on Isle Royale. Master’s Thesis, Michigan Technological University, Houghton, MI, USA, 1987. [Google Scholar]
- Slavick, A.D.; Janke, R.A. The vascular flora of Isle Royale national park. Mich. Bot. 1987, 26, 91–134. [Google Scholar]
- Wolfe, M.L. Age determination in moose from cemental layers of molar teeth. J. Wildl. Manag. 1969, 33, 428–431. [Google Scholar] [CrossRef]
- Neiland, K.A. Weight of dried marrow as indicator of fat in caribou femurs. J. Wildl. Manag. 1970, 34, 904–907. [Google Scholar] [CrossRef]
- Barnett, B.A. Carbon and Nitrogen Ratios of Caribou Tissues, Vascular Plants, and Lichens from Northern Alaska. Master’s Thesis, University of Alaska, Fairbanks, AK, USA, 1994. [Google Scholar]
- Grue, H.; Jensen, B. Review of the formation of incremental lines in tooth cementum of terrestrial mammals. Dan. Rev. Game Biol. 1979, 11, 3–48. [Google Scholar]
- Guthrie, R.D.; Stoker, S. Paleoecological significance of mummified remains of Pleistocene horses from the North Slope of the Brooks Range, Alaska. Arctic 1990, 43, 267–274. [Google Scholar] [CrossRef]
- Rosing, M.N.; Ben-David, M.; Barry, R.P. Analysis of stable isotope data: AK nearest-neighbors randomization test. J. Wildl. Manag. 1998, 62, 380–388. [Google Scholar] [CrossRef]
- Anderson, M.J. A new method for non-parametric multivariate analysis of variance. Austral Ecol. 2001, 26, 32–46. [Google Scholar]
- McArdle, B.H.; Anderson, M.J. Fitting multivariate models to community data: A comment on distance-based redundancy analysis. Ecology 2001, 82, 290–297. [Google Scholar] [CrossRef]
- Quinn, G.P.; Keough, M.J. Experimental Design and Data Analysis for Biologists; Cambridge University Press: Cambridge, UK, 2002; ISBN 0-521-00976-6. [Google Scholar]
- Parnell, A.C.; Inger, R.; Bearhop, S.; Jackson, A.L. Source partitioning using stable isotopes: Coping with too much variation. PLoS ONE 2010, 5, e9672. [Google Scholar] [CrossRef]
- Sponheimer, M.; Robinson, T.F.; Ayliffe, L.K.; Passey, B.H.; Roeder, B.; Shipley, L.; Lopez, E.; Cerling, T.E.; Dearing, M.D.; Ehleringer, J.R. An experimental study of carbon-isotope fractionation between diet, hair, and feces of mammalian herbivores. Can. J. Zool. 2003, 81, 871–876. [Google Scholar] [CrossRef]
- Jones, R.J.; Ludlow, M.M.; Troughton, J.H.; Blunt, C.G. Changes in the natural carbon isotope ratios of the hair from steers fed diets of C4, C3 and C4 species in sequence. J. Aust. N. Z. Assoc. Adv. Sci. 1981, 12, 85–87. [Google Scholar]
- Cerling, T.E.; Harris, J.M. Carbon isotope fractionation between diet and bioapatite in ungulate mammals and implications for ecological and paleoecological studies. Oecologia 1999, 120, 347–363. [Google Scholar] [CrossRef]
- Sponheimer, M.; Robinson, T.; Ayliffe, L.; Roeder, B.; Hammer, J.; Passey, B.; West, A.; Cerling, T.; Dearing, D.; Ehleringer, J. Nitrogen isotopes in mammalian herbivores: Hair δ15N values from a controlled feeding study. Int. J. Osteoarchaeol. 2003, 13, 80–87. [Google Scholar] [CrossRef]
- Bada, J.L.; Peterson, R.O.; Schimmelmann, A.; Hedges, R.E.M. Moose teeth as monitors of environmental isotopic parameters. Oecologia 1990, 82, 102–106. [Google Scholar] [CrossRef]
- Krefting, L.W. The Ecology of the Isle Royale Moose with Special Reference to the Habitat; Agricultural Experiment Station Technical Bulletin; Minnesota Agricultural Experiment Station: Minneapolis, MN, USA, 1974; pp. 1–75. [Google Scholar]
- DelGiudice, G.D.; Peterson, R.O.; Seal, U.S. Differences in urinary chemistry profiles of moose on Isle Royale during winter. J. Wildl. Dis. 1991, 27, 407–416. [Google Scholar] [CrossRef] [PubMed]
- Parikh, G.L.; Forbey, J.S.; Robb, B.; Peterson, R.O.; Vucetich, L.M.; Vucetich, J.A. The influence of plant defensive chemicals, diet composition, and winter severity on the nutritional condition of a free-ranging, generalist herbivore. Oikos 2017, 126, 196–203. [Google Scholar] [CrossRef]
- Peterson, R.O.; Vucetich, J.A. Ecological Studies of Wolves on Isle Royale. Annual Report 2001–2002; Michigan Technological University: Houghton, MI, USA, 2002. [Google Scholar]
- Dunton, K.H.; Schonberg, S.V.; Cooper, L.W. Food web structure of the Alaskan nearshore shelf and estuarine lagoons of the Beaufort Sea. Estuaries Coasts 2012, 35, 416–435. [Google Scholar] [CrossRef]
- Chibowski, P.; Zalewski, A.; Suska-Malawska, M.; Brzeziński, M. Study on geographical differences in American mink diets reveals variations in isotopic composition of potential mink prey. Mamm. Res. 2019, 64, 343–351. [Google Scholar] [CrossRef] [Green Version]
- Hoy, S.R.; Peterson, R.O.; Vucetich, J.A. Ecological Studies of Wolves on Isle Royale; Michigan Technological University: Houghton, MI, USA, 2019; pp. 1–16. [Google Scholar]
- Milligan, H.E.; Pretzlaw, T.D.; Humphries, M.M. Stable isotope differentiation of freshwater and terrestrial vascular plants in two subarctic regions. Ecoscience 2010, 17, 265–275. [Google Scholar] [CrossRef]
- Webb, S.C.; Hedges, R.E.; Simpson, S.J. Diet quality influences the δ13C and δ15N of locusts and their biochemical components. J. Exp. Biol. 1998, 201, 2903–2911. [Google Scholar]
- Oelbermann, K.; Scheu, S. Stable isotope enrichment (δ15N and δ13C) in a generalist predator (Pardosa lugubris, Araneae: Lycosidae): Effects of prey quality. Oecologia 2002, 130, 337–344. [Google Scholar] [CrossRef]
- Gannez, L.Z.; O’Brien, D.M.; Del Rio, C.M. Stable isotopes in animal ecology: Assumptions, caveats, and a call for more laboratory experiments. Ecology 1997, 78, 1271–1276. [Google Scholar] [CrossRef]
- Adams, T.S.; Sterner, R.W. The effect of dietary nitrogen content on trophic level 15N enrichment. Limnol. Oceanogr. 2000, 45, 601–607. [Google Scholar] [CrossRef]
- Boon, P.I.; Bunn, S.E. Variations in the stable isotope composition of aquatic plants and their implications for food web analysis. Aquat. Bot. 1994, 48, 99–108. [Google Scholar] [CrossRef]
- Finlay, J.C.; Kendall, C. Stable isotope tracing of temporal and spatial variability in organic matter sources to freshwater ecosystems. Stable Isot. Ecol. Environ. Sci. 2007, 2, 283–333. [Google Scholar]
- West, A.G.; Ayliffe, L.K.; Cerling, T.E.; Robinson, T.F.; Karren, B.; Dearing, M.D.; Ehleringer, J.R. Short-term diet changes revealed using stable carbon isotopes in horse tail-hair. Funct. Ecol. 2004, 18, 616–624. [Google Scholar] [CrossRef]
Figure 1.
Location of Isle Royale in Lake Superior, USA, showing sampling regions (East, West) and the spatial distribution of interior lakes, palustrine emergent wetlands, streams, and historic fire boundaries.
Figure 1.
Location of Isle Royale in Lake Superior, USA, showing sampling regions (East, West) and the spatial distribution of interior lakes, palustrine emergent wetlands, streams, and historic fire boundaries.

Figure 2.
Moose hoof digit sampled for stable isotope analysis in 0.5-cm increments between the hairline and tip.
Figure 2.
Moose hoof digit sampled for stable isotope analysis in 0.5-cm increments between the hairline and tip.

Figure 3.
Mean (±SD) δ13C and δ15N in moose forage groups (sources) collected on Isle Royale, Michigan, USA. Small black dots are individual moose values (mixtures). Trophic discrimination factors have been added to the sources (Δ13C = 3.0‰, Δ15N = 2.7‰).
Figure 3.
Mean (±SD) δ13C and δ15N in moose forage groups (sources) collected on Isle Royale, Michigan, USA. Small black dots are individual moose values (mixtures). Trophic discrimination factors have been added to the sources (Δ13C = 3.0‰, Δ15N = 2.7‰).

Figure 4.
Comparison of δ13C (a) and δ15N (b) isotope chronologies between adjacent hoof digits for a single adult female moose (ID # 3828).
Figure 4.
Comparison of δ13C (a) and δ15N (b) isotope chronologies between adjacent hoof digits for a single adult female moose (ID # 3828).

Figure 5.
Variation in δ13C (a,c,e) and δ15N (b,d,f) along hooves from adult female moose that died during the winter (c,d, n = 7) and the summer (e,f, n = 4) from starvation or predation at Isle Royale National Park, USA. Hooves were sampled in 0.5-cm increments from the hairline to the tip. Different colors correspond to individual moose.

Figure 6.
δ13C and δ15N isotope chronologies along hooves (from hairline to tip) of six adult female moose from the eastern end of Isle Royale National Park, USA. Chronologies are based upon growth rate of captive caribou (Barnett 1994) scaled to moose hoof length. Vertical dotted lines correspond to position of growth arrest lines (GALs) along hooves. Arrows indicate date of death for each individual.


Table 1.
Sample size and mean (±SD) stable isotope values measured along the length of adult female moose hooves on the east side of Isle Royale.
Table 1.
Sample size and mean (±SD) stable isotope values measured along the length of adult female moose hooves on the east side of Isle Royale.
| Moose ID | n† | ∆δ13C | δ15N |
|---|---|---|---|
| 3618 | 21 | −25.6 ± 0.4 | 0.8 ± 0.4 |
| 3627 | 16 | −25.8 ± 0.4 | 0.7 ± 0.3 |
| 3628 | 21 | −25.5 ± 0.3 | 0.9 ± 0.3 |
| 3723 | 21 | −26.0 ± 0.4 | 0.1 ± 0.3 |
| 3731 | 21 | −25.5 ± 0.3 | 0.4 ± 0.2 |
| 3734 | 14 | −24.8 ± 0.7 | −0.3 ± 0.3 |
| 3766 | 19 | −24.4 ± 0.8 | 1.1 ± 0.5 |
| 3767 | 21 | −25.1 ± 0.5 | 0.4 ± 0.2 |
| 3774 | 19 | −25.5 ± 0.2 | 0.6 ± 0.2 |
| 3784 | 19 | −25.1 ± 0.3 | 0.1 ± 0.2 |
| 3788 | 16 | −25.1 ± 0.4 | 0.4 ± 0.4 |
| 3808 | 19 | −25.1 ± 0.4 | 0.6 ± 0.3 |
| 3828 | 25 | −25.2 ± 0.4 | 0.6 ± 0.6 |
† Sample size refers to the number of incremental (0.5 cm) samples analyzed from the hoof hairline to tip.
Table 2.
Trophic shift (∆δ13C) influence on the proportional estimate of food sources to moose diet at Isle Royale National Park, USA.
Table 2.
Trophic shift (∆δ13C) influence on the proportional estimate of food sources to moose diet at Isle Royale National Park, USA.
| Trophic Discrimination | ∆13C1 (3.0‰) | ∆13C2 (1.8‰) | - |
|---|---|---|---|
| Sources | Percent of Diet | |∆−∆| | |
| Summer diet (2-source model) | |||
| Terrestrial leaves | 86.8 ± 3.3 | 72.8 ± 3.6 | 14.0 |
| Aquatic macrophytes | 13.2 ± 3.3 | 27.2 ± 3.6 | |
| Winter diet (2-source model) | |||
| East | |||
| Terrestrial twigs | 99.9 ± 0.01 | 89.2 ± 9.4 | 10.7 |
| Lichens | 0.01 ± 0.5 | 10.8 ± 9.4 | |
| West | |||
| Terrestrial twigs | 96.3 ± 4.9 | 71.8 ± 11.3 | 24.5 |
| Lichens | 3.7 ± 4.9 | 28.2 ± 11.3 | |
© 2019 by the authors. Licensee MDPI, Basel, Switzerland. This article is an open access article distributed under the terms and conditions of the Creative Commons Attribution (CC BY) license (http://creativecommons.org/licenses/by/4.0/).
Share and Cite
MDPI and ACS Style
Tischler, K.B.; Severud, W.J.; Peterson, R.O.; Bump, J.K. Aquatic Macrophytes are Seasonally Important Dietary Resources for Moose. Diversity 2019, 11, 209. https://0-doi-org.brum.beds.ac.uk/10.3390/d11110209
AMA Style
Tischler KB, Severud WJ, Peterson RO, Bump JK. Aquatic Macrophytes are Seasonally Important Dietary Resources for Moose. Diversity. 2019; 11(11):209. https://0-doi-org.brum.beds.ac.uk/10.3390/d11110209
Chicago/Turabian StyleTischler, Keren B., William J. Severud, Rolf O. Peterson, and Joseph K. Bump. 2019. "Aquatic Macrophytes are Seasonally Important Dietary Resources for Moose" Diversity 11, no. 11: 209. https://0-doi-org.brum.beds.ac.uk/10.3390/d11110209
Note that from the first issue of 2016, this journal uses article numbers instead of page numbers. See further details here.