Plant Functional Traits on Tropical Ultramafic Habitats Affected by Fire and Mining: Insights for Reclamation

 ,
,  ,
,
Abstract
: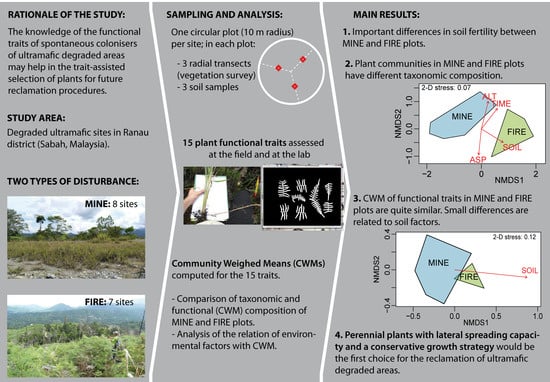
1. Introduction
2. Materials and Methods
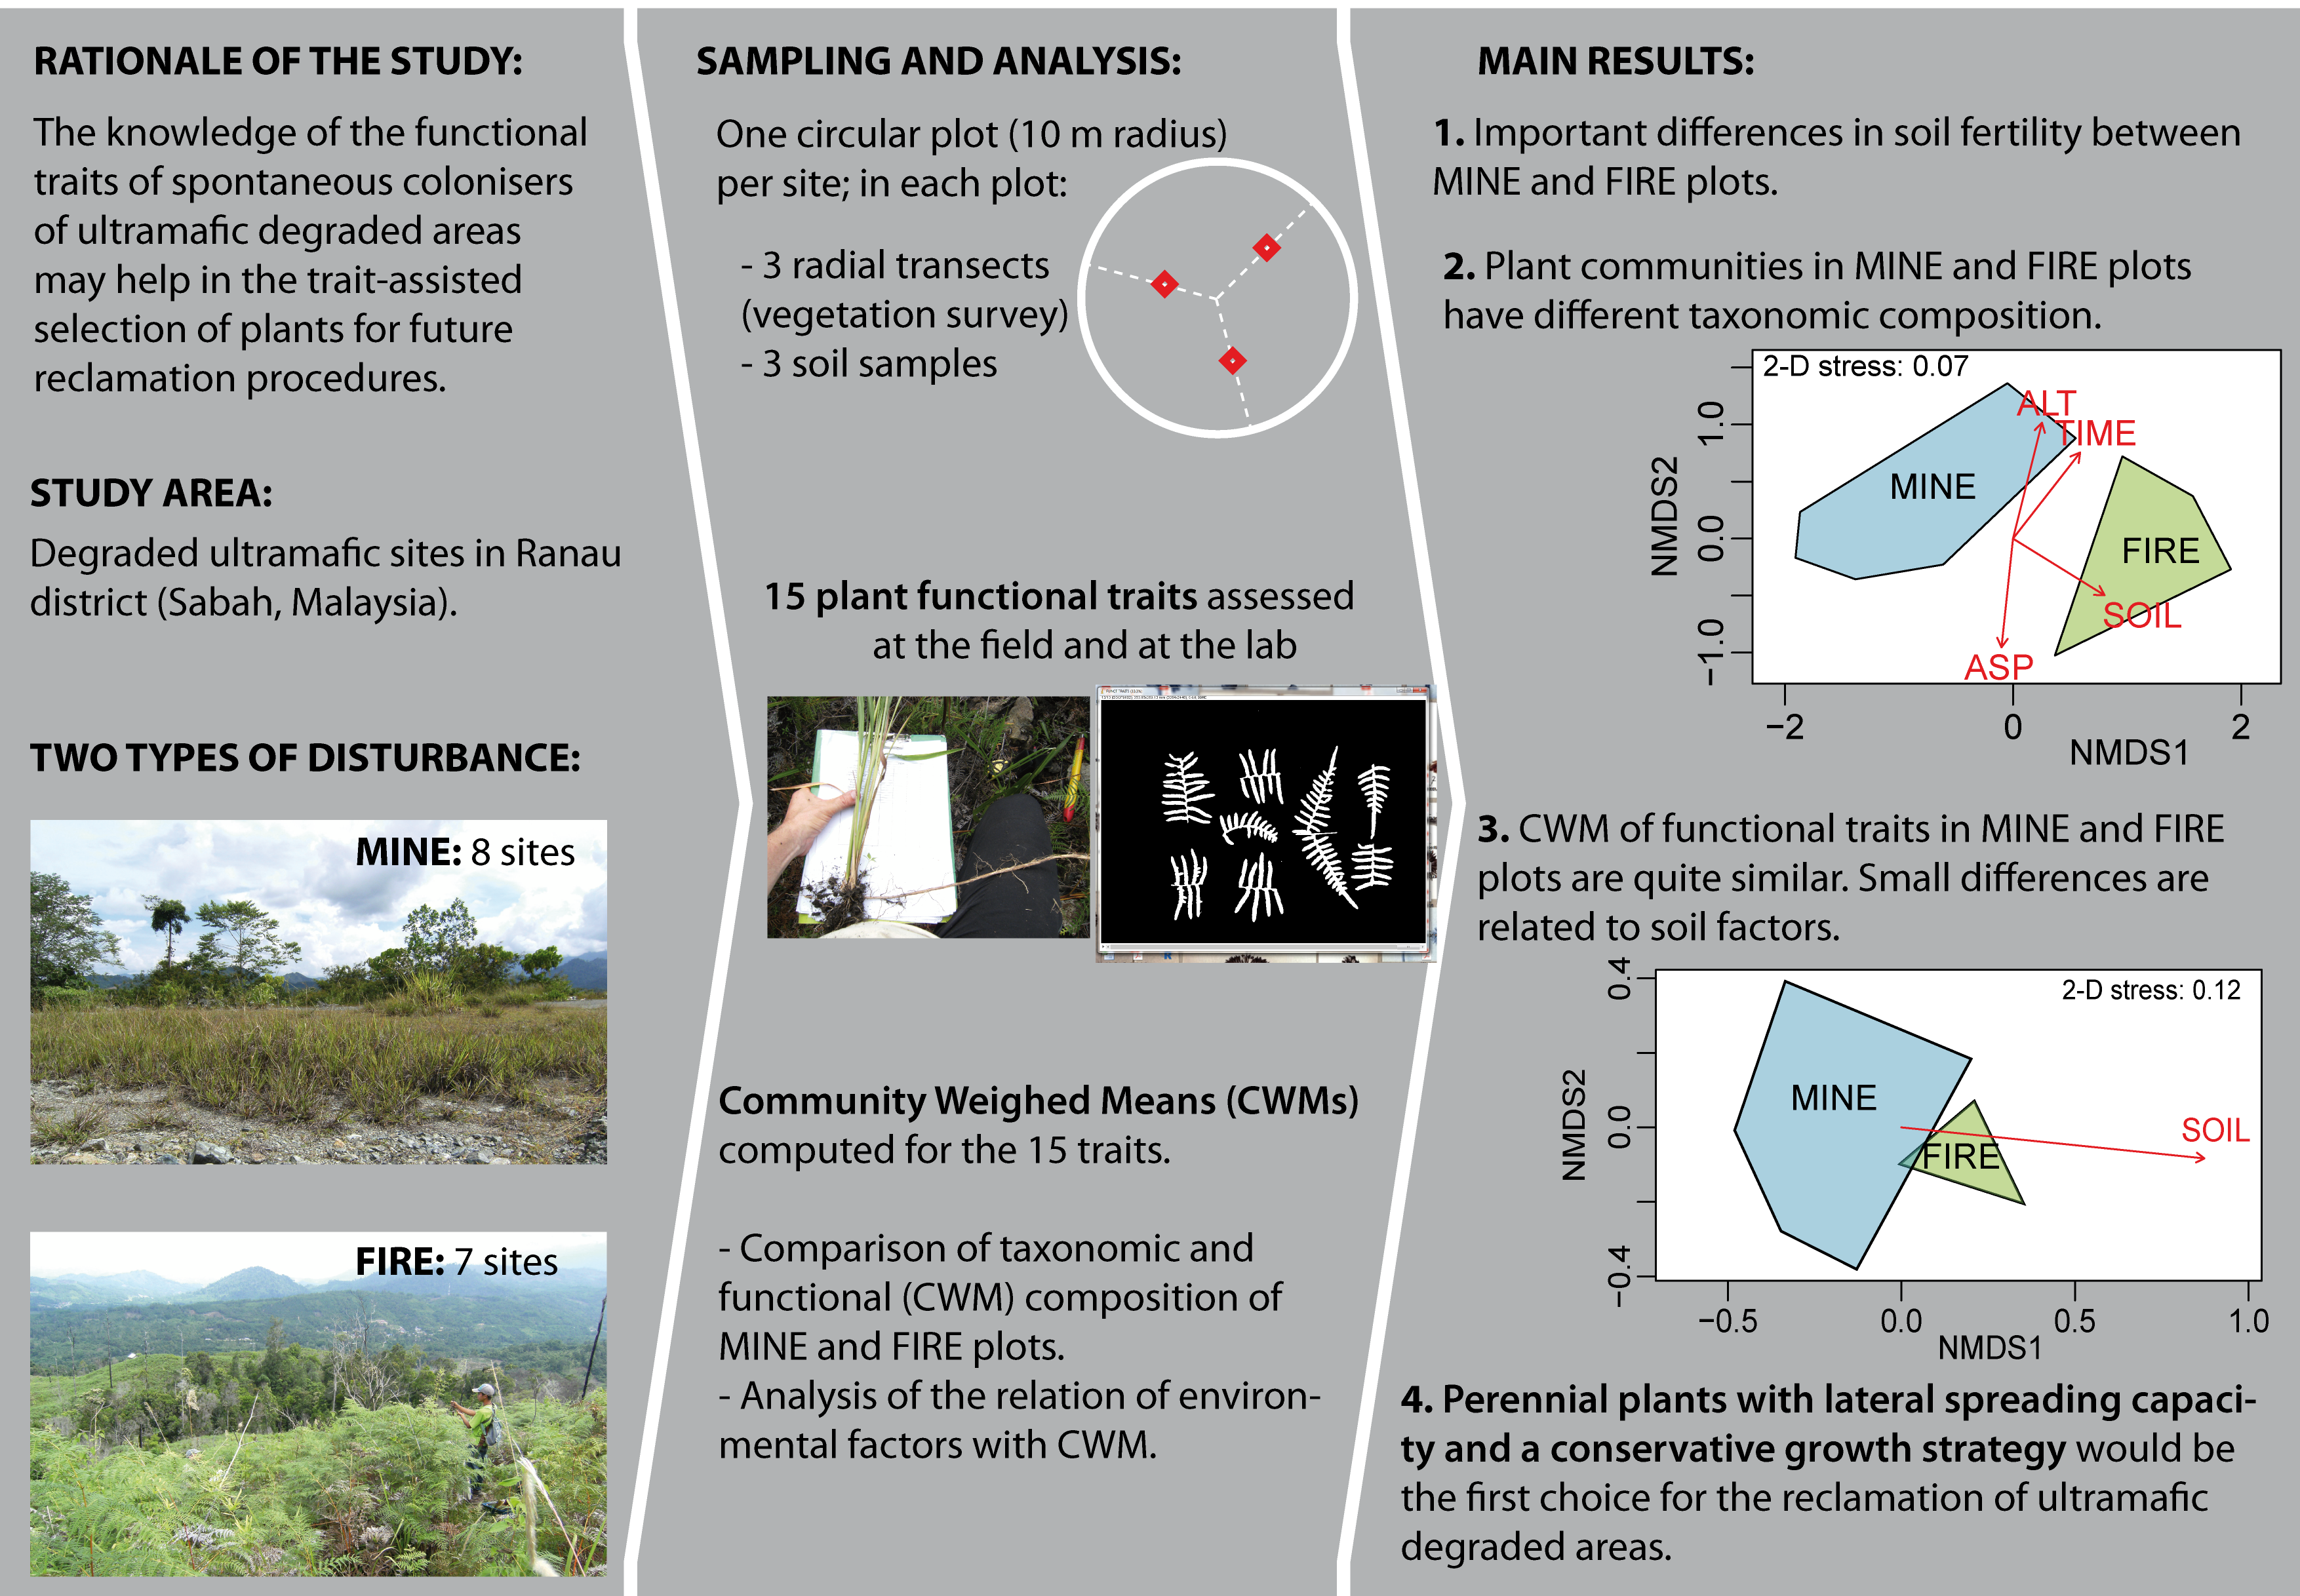
2.1. Study Area
2.2. Plant and Soil Sampling
2.3. Soil Analyses
2.4. Plant Analyses
2.5. Data Analysis
3. Results
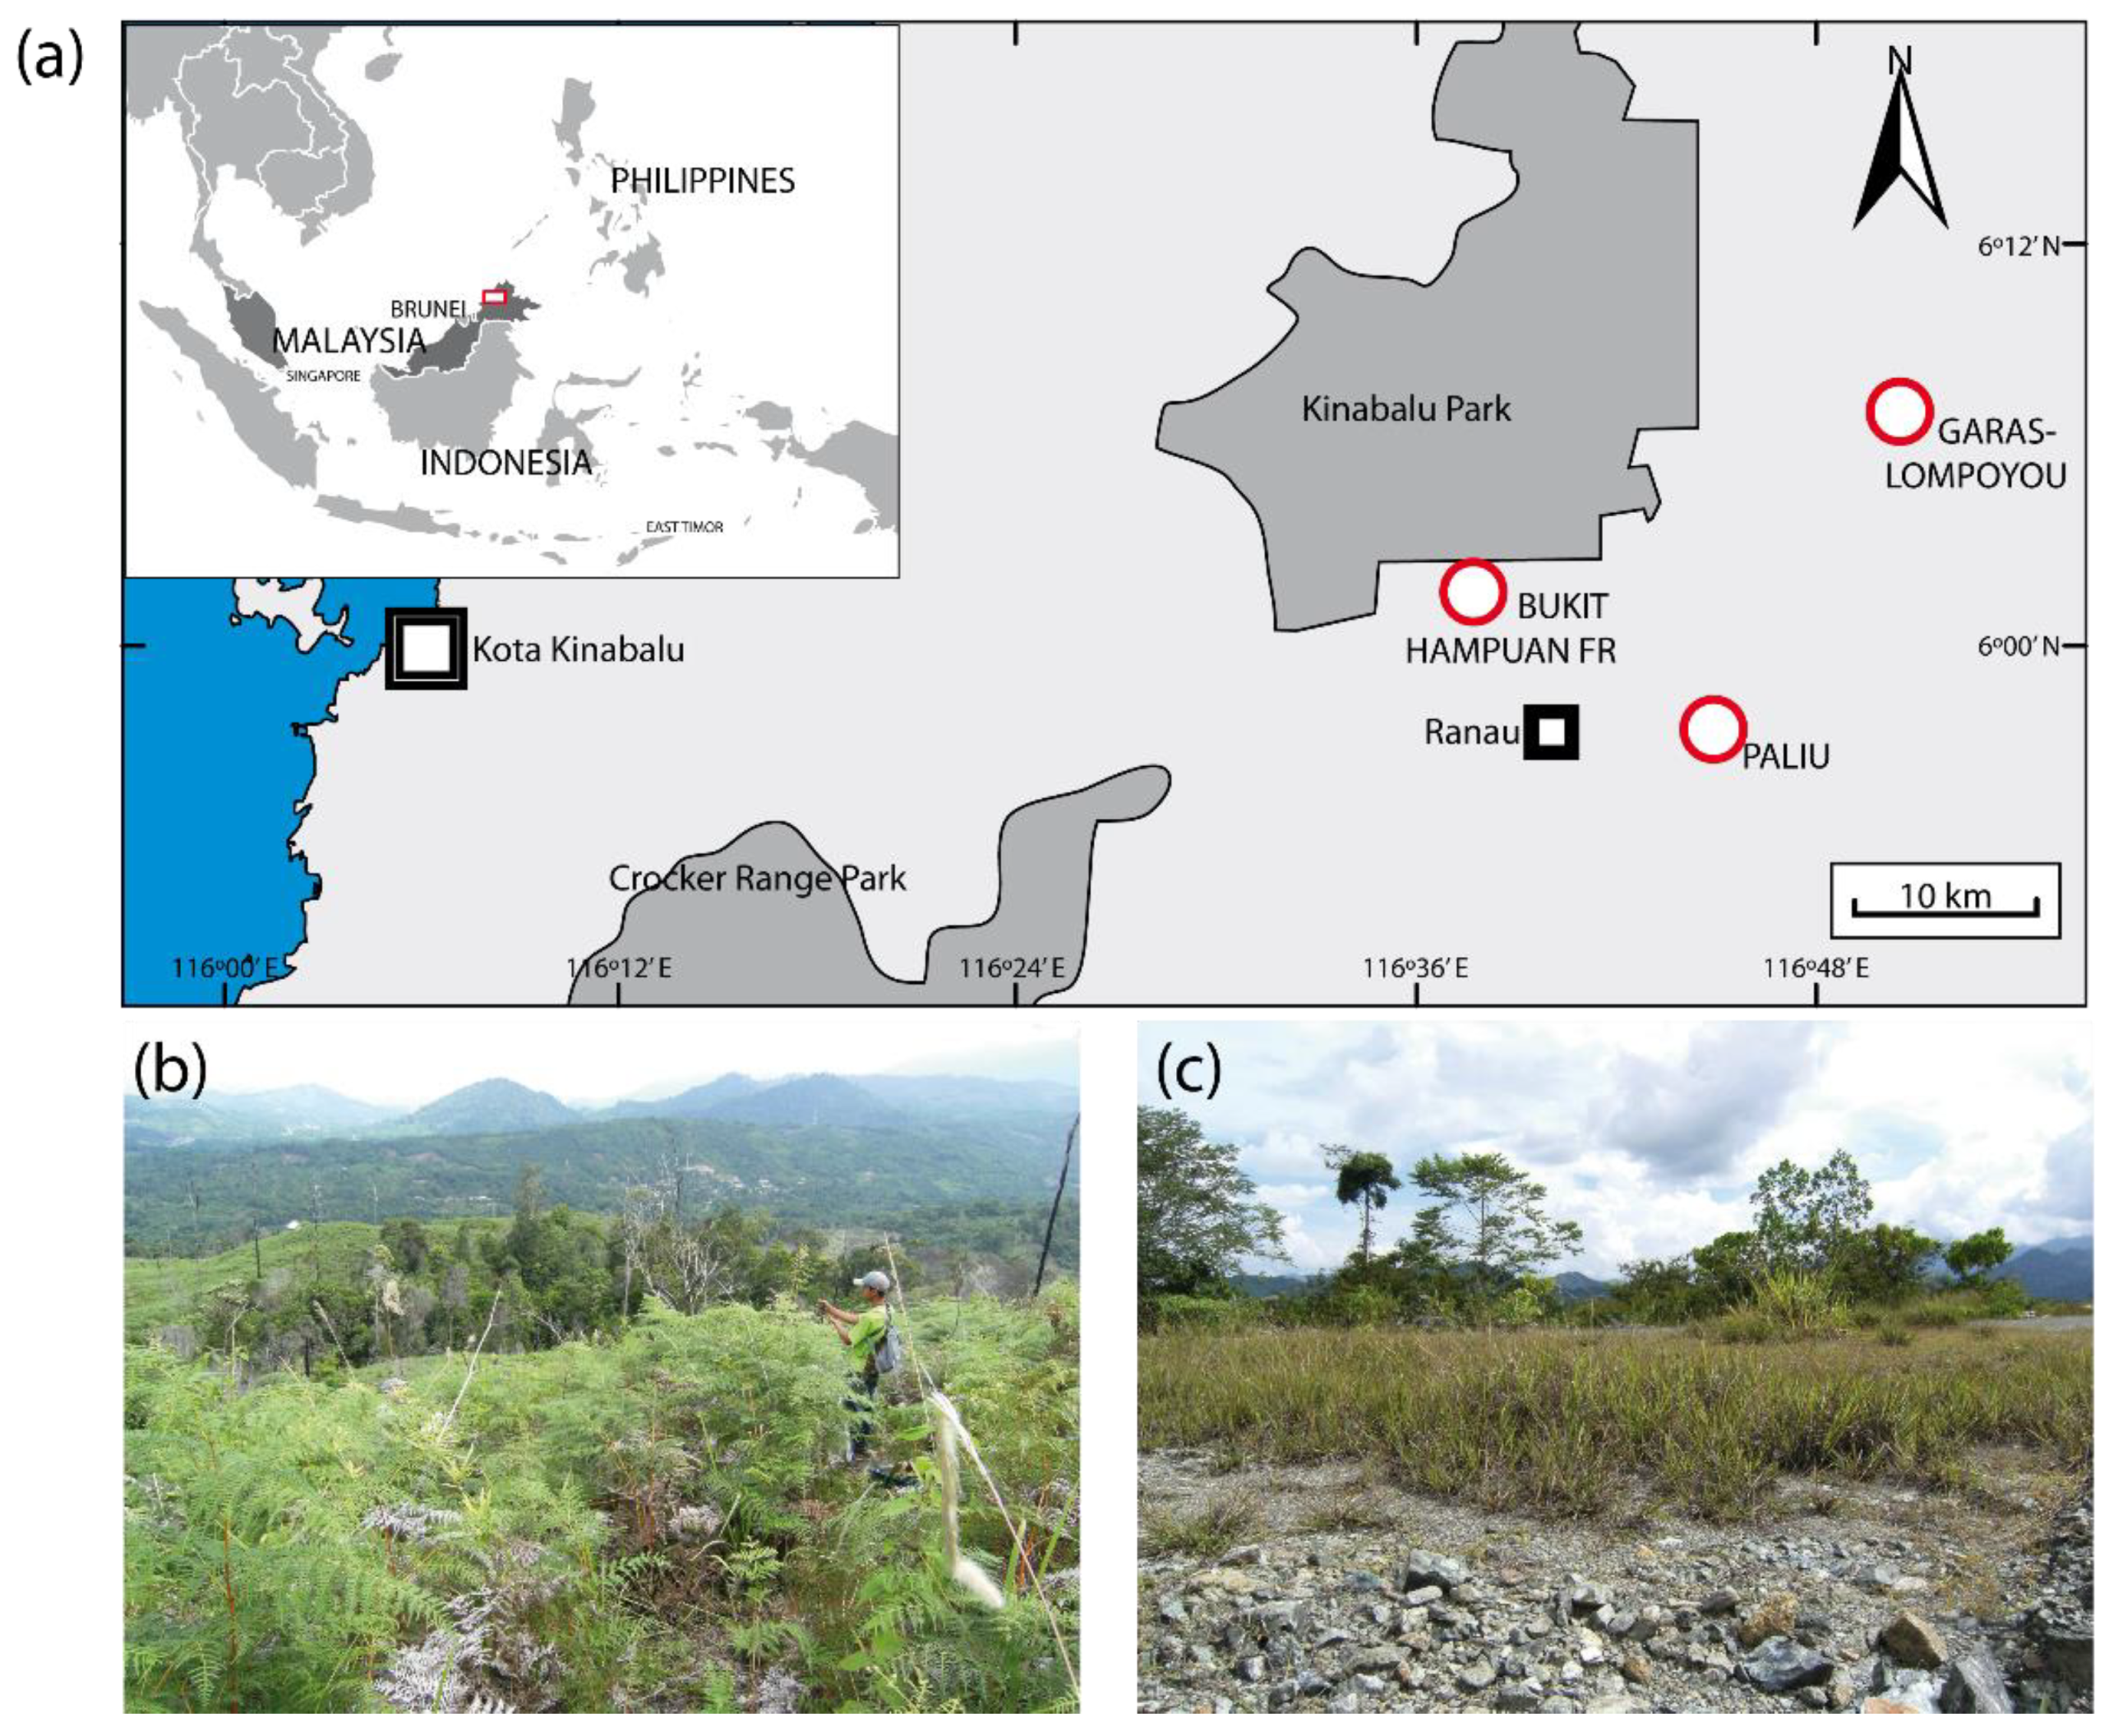
3.1. Soil Parameters
3.2. Plant Communities
4. Discussion
4.1. Soil Properties in Disturbed Ultramafic Habitats
4.2. Functional Traits in Disturbed Ultramafic Habitats
4.3. Implication in Revegetation of Ultramafic Degraded Areas
Author Contributions
Funding
Acknowledgments
Conflicts of Interest
Appendix A

| CODE | Species | Division/Family | N Occurrences/Average Cover (%) | |
|---|---|---|---|---|
| FIRE plots | MINE plots | |||
| CETE | Ceuthostoma terminale | Casuarinaceae | 0/0 | 2/4 |
| CHOD | Chromolaena odorata | Asteraceae | 4/26 | 2/3 |
| CLSP | Clausena sp. | Rutaceae | 1/10 | 0/0 |
| COSP | Colona sp. | Malvaceae | 1/7 | 0/0 |
| COMSP | Commersonia sp. | Malvaceae | 1/1 | 1/3 |
| CY#01 | Cyperus sp. | Cyperaceae | 1/4 | 0/0 |
| DEFR | Decaspermom fruticosum | Myrtaceae | 1/1 | 0/0 |
| ETCO | Etlingera coccinea | Zingiberaceae | 1/4 | 0/0 |
| F#01 | - | Dicotyledon | 0/0 | 1/3 |
| FE#01 | - | Polypodiophyta | 0/0 | 2/2 |
| FE#02 | - | Polypodiophyta | 0/0 | 1/8 |
| FISP | Fimbristylis sp. | Cyperaceae | 0/0 | 4/35 |
| G#01 | - | Poaceae | 0/0 | 1/24 |
| G#02 | - | Poaceae | 0/0 | 3/24 |
| G#03 | - | Poaceae | 0/0 | 1/1 |
| G#04 | - | Poaceae | 0/0 | 1/26 |
| G#05 | - | Poaceae | 0/0 | 1/3 |
| G#06 | - | Poaceae | 0/0 | 1/3 |
| IMCY | Imperata cylindrica | Poaceae | 4/5 | 1/8 |
| LACA | Lantana camara | Verbenaceae | 1/10 | 0/0 |
| LYSP | Lygodium sp. | Lygodiacaeae | 3/4 | 0/0 |
| MA#01 | Macaranga sp.1 | Euphorbiaceae | 1/1 | 0/0 |
| MA#02 | Macaranga sp.2 | Euphorbiaceae | 1/4 | 0/0 |
| MA#03 | Macaranga sp.3 | Euphorbiaceae | 1/2 | 0/0 |
| ME#01 | Melastoma sp. | Melastomataceae | 1/7 | 0/0 |
| ME#02 | Medinilla sp. | Melastomataceae | 0/0 | 1/1 |
| MIFL | Miscanthus floridulus | Poaceae | 3/9 | 2/5 |
| MIPU | Mimosa pudica | Fabaceae | 0/0 | 3/5 |
| NASP | Nauclea sp. | Rubiaceae | 1/11 | 0/0 |
| NEGI | Neonauclea gigantea | Rubiaceae | 1/2 | 2/2 |
| PASP1 | Paspalum sp1. | Poaceae | 0/0 | 2/4 |
| PASP2 | Paspalum sp2. | Poaceae | 0/0 | 6/3 |
| PHRU | Phyllanthus rufuschaneyi | Phyllanthaceae | 1/5 | 0/0 |
| PTES | Pteridium esculentum | Dennstaedtiaceae | 7/63 | 0/0 |
| RU#01 | Rubus sp. | Rosaceae | 0/0 | 1/1 |
| T#01 | - | Dicotyledon | 1/2 | 0/0 |
| T#02 | - | Dicotyledon | 1/1 | 0/0 |
| T#03 | - | Dicotyledon | 1/3 | 0/0 |
| TRSP | Trema sp. | Cannabaceae | 2/3 | 0/0 |
| VIPI | Vitex pinnata | Lamiaceae | 1/5 | 0/0 |
| VISP | Vitex sp. | Lamiaceae | 1/5 | 0/0 |
| ZI#01 | - | Zingiberaceae | 1/4 | 0/0 |
References
- Kruckeberg, A.R. An essay: Geoedaphics and island biogeography for vascular plants. Aliso: A J. Syst. Evolut. Bot. 1991, 13, 225–238. [Google Scholar] [CrossRef] [Green Version]
- van der Ent, A.; Erskine, P.D.; Mulligan, D.R.; Repin, R.; Karim, R. Vegetation on ultramafic edaphic “islands” in Kinabalu Park (Sabah, Malaysia) in relation to soil chemistry and elevation. Plant Soil 2016, 403, 77–101. [Google Scholar] [CrossRef]
- Brady, K.U.; Kruckeberg, A.R.; Bradshaw, H.D., Jr. Evolutionary ecology of plant adaptation to serpentine soils. Annu. Rev. Ecol. Evolut. Syst. 2005, 36, 243–266. [Google Scholar] [CrossRef]
- Kazakou, E.; Dimitrakopoulos, P.G.; Baker, A.J.M.; Reeves, R.D.; Troumbis, A.Y. Hypotheses, mechanisms and trade-offs of tolerance and adaptation to serpentine soils: From species to ecosystem level. Biol. Rev. 2008, 83, 495–508. [Google Scholar] [CrossRef]
- Reeves, R.D.; Baker, A.J.M.; Borhidi, A.; Berazain, R. Nickel Hyperaccumulation in the Serpentine Flora of Cuba. Ann. Bot. 1999, 83, 29–38. [Google Scholar] [CrossRef] [Green Version]
- Isnard, S.; L’huillier, L.; Rigault, F.; Jaffré, T. How did the ultramafic soils shape the flora of the New Caledonian hotspot? Plant soil 2016, 403, 53–76. [Google Scholar] [CrossRef]
- Galey, M.L.; Van der Ent, A.; Iqbal, M.C.M.; Rajakaruna, N. Ultramafic geoecology of South and Southeast Asia. Botanical Stud. 2017, 58, 18. [Google Scholar] [CrossRef] [Green Version]
- van der Ent, A.; Repin, R.; Sugau, J.; Wong, K.M. Plant diversity and ecology of ultramafic outcrops in Sabah (Malaysia). Aust. J. Bot. 2015, 63, 204–215. [Google Scholar] [CrossRef]
- Harrison, S.; Rajakaruna, N. Serpentine: The evolution and ecology of a model system; Univ of California Press: Berkeley, CA, USA, 2011; ISBN 0-520-26835-0. [Google Scholar]
- Whiting, S.N.; Reeves, R.D.; Richards, D.; Johnson, M.S.; Cooke, J.A.; Malaisse, F.; Paton, A.; Smith, J.A.C.; Angle, J.S.; Chaney, R.L. Research priorities for conservation of metallophyte biodiversity and their potential for restoration and site remediation. Restor. Ecol. 2004, 12, 106–116. [Google Scholar] [CrossRef] [Green Version]
- O’Dell, R.E.; Claassen, V.P. Serpentine revegetation: A review. Northeast. Nat. 2009, 16, 253–271. [Google Scholar] [CrossRef]
- Mudd, G.M. Global trends and environmental issues in nickel mining: Sulfides versus laterites. Ore Geol. Rev. 2010, 38, 9–26. [Google Scholar] [CrossRef]
- Losfeld, G.; L’Huillier, L.; Fogliani, B.; Jaffré, T.; Grison, C. Mining in New Caledonia: Environmental stakes and restoration opportunities. Environ. Sci. Pollut. Res. 2015, 22, 5592–5607. [Google Scholar] [CrossRef] [PubMed]
- van der Ent, A.; Baker, A.J.M.; Van Balgooy, M.M.J.; Tjoa, A. Ultramafic nickel laterites in Indonesia (Sulawesi, Halmahera): Mining, nickel hyperaccumulators and opportunities for phytomining. J. Geochem. Explor. 2013, 128, 72–79. [Google Scholar] [CrossRef]
- Sodhi, N.S.; Koh, L.P.; Brook, B.W.; Ng, P.K. Southeast Asian biodiversity: An impending disaster. Trends Ecol. Evol. 2004, 19, 654–660. [Google Scholar] [CrossRef] [PubMed]
- van der Ent, A. The ecology of ultramafic areas in Sabah: Threats and conservation needs. Gardens’ Bull. Singap. 2011, 63, 385–393. [Google Scholar]
- Pfeifer, M.; Kor, L.; Nilus, R.; Turner, E.; Cusack, J.; Lysenko, I.; Khoo, M.; Chey, V.K.; Chung, A.C.; Ewers, R.M. Mapping the structure of Borneo’s tropical forests across a degradation gradient. Remote Sens. Environ. 2016, 176, 84–97. [Google Scholar] [CrossRef] [Green Version]
- McCoy, S.; Jaffré, T.; Rigault, F.; Ash, J.E. Fire and succession in the ultramafic maquis of New Caledonia. J. Biogeogr. 1999, 26, 579–594. [Google Scholar] [CrossRef]
- Garnier, É.; Navas, M.-L. Diversité Fonctionnelle des Plantes: Traits des Organismes, Structure des Communautés, Propriétés des écosystèmes: Cours; De Boeck: Bruxelles, Belgium, 2013; ISBN 2-8041-7562-6. [Google Scholar]
- Fukami, T.; Bezemer, B.T.; Mortimer, S.R.; van der Putten, W.H. Species divergence and trait convergence in experimental plant community assembly. Ecol. Lett. 2005, 8, 1283–1290. [Google Scholar] [CrossRef]
- Garnier, E.; Cortez, J.; Billès, G.; Navas, M.-L.; Roumet, C.; Debussche, M.; Laurent, G.; Blanchard, A.; Aubry, D.; Bellmann, A. Plant functional markers capture ecosystem properties during secondary succession. Ecology 2004, 85, 2630–2637. [Google Scholar] [CrossRef]
- Lange, B.; Faucon, M.-P.; Delhaye, G.; Hamiti, N.; Meerts, P. Functional traits of a facultative metallophyte from tropical Africa: Population variation and plasticity in response to cobalt. Environ. al Exp. Bot. 2017, 136, 1–8. [Google Scholar] [CrossRef]
- De Deyn, G.B.; Cornelissen, J.H.; Bardgett, R.D. Plant functional traits and soil carbon sequestration in contrasting biomes. Ecol. Lett. 2008, 11, 516–531. [Google Scholar] [CrossRef] [PubMed]
- Faucon, M.-P.; Houben, D.; Lambers, H. Plant functional traits: Soil and ecosystem services. Trends Plant Sci. 2017, 22, 385–394. [Google Scholar] [CrossRef] [PubMed]
- Ilunga wa Ilunga, E.; Mahy, G.; Piqueray, J.; Seleck, M.; Shutcha, M.N.; Meerts, P.; Faucon, M.-P. Plant functional traits as a promising tool for the ecological restoration of degraded tropical metal-rich habitats and revegetation of metal-rich bare soils: A case study in copper vegetation of Katanga, DRC. Ecol. Eng. 2015, 82, 214–221. [Google Scholar] [CrossRef]
- Gilardelli, F.; Sgorbati, S.; Armiraglio, S.; Citterio, S.; Gentili, R. Ecological filtering and plant traits variation across quarry geomorphological surfaces: Implication for restoration. Environ. al Manag. 2015, 55, 1147–1159. [Google Scholar] [CrossRef]
- Horáčková, M.; Řehounková, K.; Prach, K. Are seed and dispersal characteristics of plants capable of predicting colonization of post-mining sites? Environ. al Sci. Pollut. Res. 2016, 23, 13617–13625. [Google Scholar] [CrossRef]
- Desjardins, D.; Brereton, N.J.; Marchand, L.; Brisson, J.; Pitre, F.E.; Labrecque, M. Complementarity of three distinctive phytoremediation crops for multiple-trace element contaminated soil. Sci. Total Environ. 2017, 610, 1428. [Google Scholar] [CrossRef]
- Navarro-Cano, J.A.; Goberna, M.; Verdú, M. Using plant functional distances to select species for restoration of mining sites. J. Appl. Ecol. 2019, 56, 2353–2362. [Google Scholar] [CrossRef]
- Lohbeck, M.; Poorter, L.; Lebrija-Trejos, E.; Martínez-Ramos, M.; Meave, J.A.; Paz, H.; Pérez-García, E.A.; Romero-Pérez, I.E.; Tauro, A.; Bongers, F. Successional changes in functional composition contrast for dry and wet tropical forest. Ecology 2013, 94, 1211–1216. [Google Scholar] [CrossRef]
- Kattge, J.; Diaz, S.; Lavorel, S.; Prentice, I.C.; Leadley, P.; Bönisch, G.; Garnier, E.; Westoby, M.; Reich, P.B.; Wright, I.J. TRY–a global database of plant traits. Glob. Chang. Biol. 2011, 17, 2905–2935. [Google Scholar] [CrossRef]
- van der Ent, A.; Mulligan, D.R.; Repin, R.; Erskine, P.D. Foliar elemental profiles in the ultramafic flora of Kinabalu Park (Sabah, Malaysia). Ecol. Res. 2018, 33, 659–674. [Google Scholar] [CrossRef]
- Proctor, J.; Lee, Y.F.; Langley, A.M.; Munro, W.R.C.; Nelson, T. Ecological studies on Gunung Silam, a small ultrabasic mountain in Sabah, Malaysia. I. Environment, forest structure and floristics. J. Ecol. 1988, 320–340. [Google Scholar] [CrossRef]
- Woods, P. Effects of logging, drought, and fire on structure and composition of tropical forests in Sabah, Malaysia. Biotropica 1989, 21, 290–298. [Google Scholar] [CrossRef]
- Kitayama, K.; Aiba, S.-I.; Majalap-Lee, N.; Ohsawa, M. Soil nitrogen mineralization rates of rainforests in a matrix of elevations and geological substrates on Mount Kinabalu, Borneo. Ecol. Res. 1998, 13, 301–312. [Google Scholar] [CrossRef]
- Aiba, S.; Kitayama, K. Structure, composition and species diversity in an altitude-substrate matrix of rain forest tree communities on Mount Kinabalu, Borneo. Plant Ecol. 1999, 140, 139–157. [Google Scholar] [CrossRef]
- IUSS Working Group WRB. World Reference Base for Soil Resources 2014, update 2015 International soil classification system for naming soils and creating legends for soil maps. World Soil Resources Reports No 106; World Soil Resources Reports; Food and Agriculture Organization of the United Nations: Rome, Italy, 2015. [Google Scholar]
- van der Ent, A.; Cardace, D.; Tibbett, M.; Echevarria, G. Ecological implications of pedogenesis and geochemistry of ultramafic soils in Kinabalu Park (Malaysia). Catena 2018, 160, 154–169. [Google Scholar] [CrossRef]
- Bandick, A.K.; Dick, R.P. Field management effects on soil enzyme activities. Soil Biol. Biochem. 1999, 31, 1471–1479. [Google Scholar] [CrossRef]
- Adam, G.; Duncan, H. Development of a sensitive and rapid method for the measurement of total microbial activity using fluorescein diacetate (FDA) in a range of soils. Soil Biol. Biochem. 2001, 33, 943–951. [Google Scholar] [CrossRef] [Green Version]
- Quintela-Sabarís, C.; Auber, E.; Sumail, S.; Masfaraud, J.-F.; Faucon, M.-P.; Watteau, F.; Saad, R.F.; van der Ent, A.; Repin, R.; Sugau, J.; et al. Recovery of ultramafic soil functions and plant communities along an age-gradient of the actinorhizal tree Ceuthostoma terminale (Casuarinaceae) in Sabah (Malaysia). Plant Soil 2019, 440, 201–218. [Google Scholar] [CrossRef] [Green Version]
- Bruand, A.; Duval, O.; Gaillard, H.; Darthout, R.; Jamagne, M. Variabilité des propriétés de rétention en eau des sols: Importance de la densité apparente. Etude et Gestion des sols 1996, 31, 27–40. [Google Scholar]
- Aran, D.; Maul, A.; Masfaraud, J.-F. A spectrophotometric measurement of soil cation exchange capacity based on cobaltihexamine chloride absorbance. Comptes Rendus Geosci. 2008, 340, 865–871. [Google Scholar] [CrossRef]
- Olsen, S.R.; Cole, C.V.; Watanabe, F.S.; Dean, L.A. Estimation of Available Phosphorus in Soils by Extraction with Sodium Bicarbonate; USDA Circ.; US Gov. Print. Office: Washington, DC, USA, 1954.
- Lindsay, W.L.; Norvell, W.A. Development of a DTPA soil test for zinc, iron, manganese, and copper. Soil Sci. Soc. Am. J. 1978, 42, 421–428. [Google Scholar] [CrossRef]
- Schneider, C.A.; Rasband, W.S.; Eliceiri, K.W. NIH Image to ImageJ: 25 years of image analysis. Nat. Methods 2012, 9, 671. [Google Scholar] [CrossRef] [PubMed]
- Pérez-Harguindeguy, N.; Díaz, S.; Garnier, E.; Lavorel, S.; Poorter, H.; Jaureguiberry, P.; Bret-Harte, M.S.; Cornwell, W.K.; Craine, J.M.; Gurvich, D.E. New handbook for standardised measurement of plant functional traits worldwide. Aust. J. Bot. 2013, 61, 167–234. [Google Scholar] [CrossRef]
- Oksanen, J.; Blanchet, G.; Friendly, M.; Kindt, R.; Legendre, P.; McGlinn, D.; Minchin, P.R.; O’Hara, R.; Simpson, G.L.; Solymos, P.; et al. Vegan: Community Ecology Package; R Package Version 2.4-4. 2017. Available online: http://CRAN.R-project.org/package=vegan (accessed on 1 June 2020).
- Lavorel, S.; Grigulis, K.; McIntyre, S.; Williams, N.S.; Garden, D.; Dorrough, J.; Berman, S.; Quétier, F.; Thébault, A.; Bonis, A. Assessing functional diversity in the field–methodology matters! Funct. Ecol. 2008, 22, 134–147. [Google Scholar] [CrossRef]
- Laliberté, E.; Legendre, P. A distance-based framework for measuring functional diversity from multiple traits. Ecology 2010, 91, 299–305. [Google Scholar] [CrossRef]
- Echevarria, G. Genesis and behaviour of ultramafic soils and consequences for nickel biogeochemistry. In Agromining: Extracting Unconventional Resources from Plants; Van der Ent, A., Echevarria, G., Baker, A.J.M., Morel, J.-L., Eds.; Mineral Resource Reviews Series; Springer Nature: Cham, Switzerland, 2018; pp. 135–156. [Google Scholar]
- Estrade, N.; Cloquet, C.; Echevarria, G.; Sterckeman, T.; Deng, T.; Tang, Y.; Morel, J.-L. Weathering and vegetation controls on nickel isotope fractionation in surface ultramafic environments (Albania). Earth Planet. Sci. Lett. 2015, 423, 24–35. [Google Scholar] [CrossRef]
- Reich, P.B. The world-wide ‘fast–slow’ plant economics spectrum: A traits manifesto. J. Ecol. 2014, 102, 275–301. [Google Scholar] [CrossRef]
- Hidaka, A.; Kitayama, K. Allocation of foliar phosphorus fractions and leaf traits of tropical tree species in response to decreased soil phosphorus availability on Mount Kinabalu, Borneo. J. Ecol. 2011, 99, 849–857. [Google Scholar] [CrossRef]
- Adamidis, G.C.; Kazakou, E.; Fyllas, N.M.; Dimitrakopoulos, P. Species adaptive strategies and leaf economic relationships across serpentine and non-serpentine habitats on Lesbos, eastern Mediterranean. PLoS ONE 2014, 9, e96034. [Google Scholar] [CrossRef] [Green Version]
- Weiher, E.; van der Werf, A.; Thompson, K.; Roderick, M.; Garnier, E.; Eriksson, O. Challenging Theophrastus: A common core list of plant traits for functional ecology. J. Veg. Sci. 1999, 10, 609–620. [Google Scholar] [CrossRef]
- Cornelissen, J.H.C.; Lavorel, S.; Garnier, E.; Diaz, S.; Buchmann, N.; Gurvich, D.E.; Reich, P.B.; ter Steege, H.; Morgan, H.D.; van der Heijden, M.G.A.; et al. A handbook of protocols for standardised and easy measurements of plant functional traits worldwide. Aust. J. Bot. 2003, 51, 335–380. [Google Scholar] [CrossRef] [Green Version]
- van der Ent, A.; Wood, J.J. Orchids of extreme serpentinite (ultramafic) habitats in Kinabalu Park. Males. Orchid J. 2013, 12, 39–54. [Google Scholar]
- Wang, M.; Zheng, Q.; Shen, Q.; Guo, S. The critical role of potassium in plant stress response. International J. Mol. Sci. 2013, 14, 7370–7390. [Google Scholar] [CrossRef] [PubMed] [Green Version]
- O’Dell, R.E.; James, J.J.; Richards, J.H. Congeneric serpentine and nonserpentine shrubs differ more in leaf Ca: Mg than in tolerance of low N, low P, or heavy metals. Plant Soil 2006, 280, 49–64. [Google Scholar] [CrossRef]
- Quintela-Sabarís, C.; Marchand, L.; Smith, J.A.C.; Kidd, P.S. Using AFLP genome scanning to explore serpentine adaptation and nickel hyperaccumulation in Alyssum serpyllifolium. Plant and Soil 2017, 416, 391–408. [Google Scholar] [CrossRef]
- Lambers, H.; Hayes, P.E.; Laliberté, E.; Oliveira, R.S.; Turner, B.L. Leaf manganese accumulation and phosphorus-acquisition efficiency. Trends Plant sci. 2015, 20, 83–90. [Google Scholar] [CrossRef] [PubMed] [Green Version]
- Bradshaw, A. The use of natural processes in reclamation—advantages and dificulties. Landsc. Urban Plan. 2000, 51, 89–100. [Google Scholar] [CrossRef]
- Bradshaw, A. Restoration of mined lands—using natural processes. Ecol. Eng. 1997, 8, 255–269. [Google Scholar] [CrossRef]
- Quintela-Sabarís, C.; Masfaraud, J.-F.; Séré, G.; Sumail, S.; van der Ent, A.; Repin, R.; Sugau, J.; Nilus, R.; Echevarria, G.; Leguédois, S. Effects of reclamation effort on the recovery of ecosystem functions of a tropical degraded serpentinite dump site. J. Geochem. Explor. 2019, 200, 139–151. [Google Scholar] [CrossRef] [Green Version]
- Snyder, B.A.; Hendrix, P.F. Current and potential roles of soil macroinvertebrates (earthworms, millipedes and isopods) in ecological restoration. Restor. Ecol. 2008, 16, 629–636. [Google Scholar] [CrossRef]
- Kuusipalo, J.; Ådjers, G.; Jafarsidik, Y.; Otsamo, A.; Tuomela, K.; Vuokko, R. Restoration of natural vegetation in degraded Imperata cylindrica grassland: Understorey development in forest plantations. J. Veg. Sci. 1995, 6, 205–210. [Google Scholar] [CrossRef]
- Nkrumah, P.N.; Baker, A.J.; Chaney, R.L.; Erskine, P.D.; Echevarria, G.; Morel, J.L.; van der Ent, A. Current status and challenges in developing nickel phytomining: An agronomic perspective. Plant Soil 2016, 406, 55–69. [Google Scholar] [CrossRef] [Green Version]


| Trait | Units | Categories/Domain | Associated Ecological Functions | Interest for Reclamation |
|---|---|---|---|---|
| Life cycle | Unitless | (0) annual (1) perennial | Response to disturbance and soil resources, competitive strength | Revegetation and/or limitation of erosion |
| Lateral spreading capacity | Unitless | (0) absence (1) presence | Competitive strength | |
| Depth of root system | In cm | (1) 0–10 (2) 10–30 (3) >30 | Response to disturbance and soil resources, competitive strength | |
| Plant height | In m | (1) 0–0.11 (2) 0.11–0.29 (3) 0.30–0.59 (4) 0.60–0.99 (5) 1–3 (6) >3 m | Response to disturbance and soil resources, competitive strength | |
| Density of stems | Number of stems in 1 dm2 | (1) 1–10 (2) 10–30 (3) >30) | Competitive strength | |
| Specific leaf area (SLA) | mm2 mg−1 | Positive decimal value | Response to soil resources, plant defense | |
| N2 fixation | Unitless | (0) absence (1), presence | Response to soil resources, nutrient strategy | Soil nutrient improvement |
| Leaf N concentration (LNC) | mg g−1 | Positive decimal value | Response to soil resources, influence in nutrient cycling | |
| Leaf P concentration (LPC) | mg g−1 | Positive decimal value | Response to soil resources, influence in nutrient cycling | |
| Leaf concentrations of Ca, Mg, K and Mn | mg g−1 | Positive decimal value | Nutrient strategy/response to ultramafic conditions | |
| Leaf Ca/Mg ratio | Unitless | Positive decimal value | Nutrient strategy/response to ultramafic conditions | |
| Ni hyperaccumulation | Unitless | (0) absence (1) presence | Response to ultramafic conditions | Phytomining |
| Soil Variable | Type of Disturbed Site | p-Value | |
|---|---|---|---|
| MINE | FIRE | ||
| pH H2O | 7.89 (±0.59) | 6.64 (±0.52) | <0.001 |
| Soil water retention (g H2O 100 g−1 soil) | |||
| Wfc | 26.2 (±9.4) | 46.6 (±13.4) | 0.008 |
| Wwp | 12.0 (±5.8) | 32.6 (±12.8) | 0.002 |
| AWS | 14.2 (±4.5) | 14.0 (±5.5) | 0.832 |
| C and N (mass %) | |||
| Total C | 1.13 (±1.82) | 6.62 (±3.09) | <0.001 |
| Total N | 0.05 (±0.04) | 0.36 (±0.15) | <0.001 |
| C/N ratio | 19.1 (±13.8) | 18.1 (±3.8) | 0.573 |
| Pseudo-total concentrations of major and trace elements (mg kg−1) | |||
| P | 81.1 (±65.0) | 176 (±54) | 0.005 |
| S | 283 (±479) | 263 (±145) | 0.121 |
| Co | 125 (±62.2) | 434 (±172) | <0.001 |
| Cr | 1275 (±695) | 5826 (±2202) | <0.001 |
| Mn | 1516 (±610) | 4421 (±1082) | <0.001 |
| Ni | 1893 (±679) | 2941 (±1082) | 0.036 |
| DTPA-extractable Ni (mg kg−1) | 18.9 (±17.4) | 155 (±62) | <0.001 |
| P-Olsen (mg kg−1) | 0.59 (±0.47) | 2.83 (±1.85) | <0.001 |
| CEC and exchangeable cations (cmol+ kg−1) | |||
| CEC | 15.9 (±10.1) | 30.2 (±12.8) | 0.024 |
| Ca2+ | 2.6 (±2.0) | 9.0 (±5.5) | 0.02 |
| Mg2+ | 10.3 (±6.8) | 13.0 (±5.6) | 0.319 |
| K+ | 0.1 (±0.1) | 0.3 (±0.2) | 0.004 |
| Ca:Mg | 0.4 (±0.3) | 0.9 (±0.8) | 0.052 |
| Soil microbial activities (μg product g−1h−1) | |||
| Urease | 2.2 (±2.1) | 5.4 (±2.7) | 0.002 |
| Arylsulphatase | 5.3 (±7.0) | 80.2 (±30.7) | <0.001 |
| β-glucosidase | 48.7 (±13.7) | 82.6 (±20.4) | 0.001 |
| Alkaline phosphatase | 17 (±16) | 252 (±177) | <0.001 |
| FDA hydrolysis | 2.5 (±2.7) | 40.0 (±14.5) | <0.001 |
| Variable | MINE Sites | FIRE Sites | p-Value |
|---|---|---|---|
| Plant cover (%) | 45.1 (21–84) | 99.5 (98–100) | <0.001 |
| N of Species | 5 (3–9) | 6 (2–11) | 0.322 |
| Shannon’s H | 0.92 (0.18–1.93) | 1.05 (0.11–1.63) | 0.672 |
| Trait | Type of Disturbed Site | p-Value | Mean in TRY Database 1 | Mean in Sabah Ultramafic Flora 2 | |
|---|---|---|---|---|---|
| MINE | FIRE | ||||
| Life cycle (binary) | 1.0 (±0.0) | 1.0 (±0.0) | 1.0 | - | - |
| Lateral spreading capacity (binary) | 0.6 (±0.4) | 0.7 (±0.2) | 0.355 | - | - |
| Depth root system (ordinal) | 1.4 (1–2) | 1.9 (1–2) | 0.066 | - | - |
| Plant height (ordinal) | 3.4 (1–5) | 5.0 (5–5) | 0.015 | - | - |
| Density of stems (ordinal) | 2.1 (1–3) | 1.1 (1–2) | 0.006 | - | - |
| N2 fixation (binary) | 0.1 (±0.1) | 0.0 (±0.0) | 0.016 | - | - |
| Ni_Hyperaccum (binary) | 0.0 (±0.0) | 0.01 (±0.02) | 0.285 | - | - |
| SLA (mm2 mg−1) | 11.2 (±6.0) | 8.3 (±3.0) | 0.270 | 16.6 | - |
| Leaf N (mg g−1) | 10.3 (±4.7) | 11.7 (±2.6) | 0.500 | 17.4 | - |
| Leaf P (mg g−1) | 0.78 (±0.38) | 0.88 (±0.26) | 0.592 | 1.23 | 0.41 |
| Leaf K (mg g−1) | 8.6 (±4.7) | 11.6 (±1.3) | 0.135 | 8.4 | 3.8 |
| Leaf Ca (mg g−1) | 3.23 (±1.35) | 2.63 (±1.01) | 0.354 | 9.05 | 6.36 |
| Leaf Mg (mg g−1) | 4.07 (±2.24) | 3.13 (±1.77) | 0.387 | 2.61 | 3.03 |
| Leaf Mn (µg g−1) | 68.4 (±49.4) | 30.6 (±18.9) | 0.047 | 189 | 588 |
| Leaf Ca:Mg | 0.60 (±0.30) | 0.57 (±0.20) | 0.827 | - | - |
© 2020 by the authors. Licensee MDPI, Basel, Switzerland. This article is an open access article distributed under the terms and conditions of the Creative Commons Attribution (CC BY) license (http://creativecommons.org/licenses/by/4.0/).
Share and Cite
Quintela-Sabarís, C.; Faucon, M.-P.; Repin, R.; Sugau, J.B.; Nilus, R.; Echevarria, G.; Leguédois, S. Plant Functional Traits on Tropical Ultramafic Habitats Affected by Fire and Mining: Insights for Reclamation. Diversity 2020, 12, 248. https://0-doi-org.brum.beds.ac.uk/10.3390/d12060248
Quintela-Sabarís C, Faucon M-P, Repin R, Sugau JB, Nilus R, Echevarria G, Leguédois S. Plant Functional Traits on Tropical Ultramafic Habitats Affected by Fire and Mining: Insights for Reclamation. Diversity. 2020; 12(6):248. https://0-doi-org.brum.beds.ac.uk/10.3390/d12060248
Chicago/Turabian StyleQuintela-Sabarís, Celestino, Michel-Pierre Faucon, Rimi Repin, John B. Sugau, Reuben Nilus, Guillaume Echevarria, and Sophie Leguédois. 2020. "Plant Functional Traits on Tropical Ultramafic Habitats Affected by Fire and Mining: Insights for Reclamation" Diversity 12, no. 6: 248. https://0-doi-org.brum.beds.ac.uk/10.3390/d12060248