Article

Urochloa Grasses Swap Nitrogen Source When Grown in Association with Legumes in Tropical Pastures

1
International Center for Tropical Agriculture (CIAT), Cali 763537, Colombia
2
Research group in rural development (GIADER), Universidad de la Amazonia, Porvenir campus, Florencia 180001, Colombia
3
ETH Zurich, Institute of Agricultural Sciences, 8315 Lindau, Switzerland
*
Author to whom correspondence should be addressed.
Submission received: 19 August 2020 / Revised: 31 October 2020 / Accepted: 1 November 2020 / Published: 5 November 2020
(This article belongs to the Special Issue Plant-Soil Interactions)

Abstract

:
The degradation of tropical pastures sown with introduced grasses (e.g., Urochloa spp.) has dramatic environmental and economic consequences in Latin America. Nitrogen (N) limitation to plant growth contributes to pasture degradation. The introduction of legumes in association with grasses has been proposed as a strategy to improve N supply via symbiotic N2 fixation, but the fixed N input and N benefits for associated grasses have hardly been determined in farmers’ pastures. We have carried out on-farm research in ten paired plots of grass-alone (GA) vs. grass-legume (GL) pastures. Measurements included soil properties, pasture productivity, and sources of plant N uptake using 15N isotope natural abundance methods. The integration of legumes increased pasture biomass production by about 74%, while N uptake was improved by two-fold. The legumes derived about 80% of their N via symbiotic N2 fixation. The isotopic signature of N of grasses in GA vs. GL pastures suggested that sources of grass N are affected by sward composition. Low values of δ15N found in some grasses in GA pastures indicate that they depend, to some extent, on N from non-symbiotic N2 fixation, while δ15N signatures of grasses in GL pastures pointed to N transfer to grass from the associated legume. The role of different soil–plant processes such as biological nitrification inhibition (BNI), non-symbiotic N2 fixation by GA pastures and legume–N transfer to grasses in GL pastures need to be further studied to provide a more comprehensive understanding of N sources supporting the growth of grasses in tropical pastures.

1. Introduction

Deforestation in the tropics has been estimated at about 0.74 million km2 from 2000 to 2012 [1]. Nearly half of it occurred in the South American rainforest [1]. In the Amazon basin, most of the cleared land has been converted to pastures sown with introduced grasses (mostly Urochloa spp., formerly known as Brachiaria) for livestock production [2,3]. In Colombia alone, more than 8% of the remaining forest area has been lost since 2000, yielding one of the highest deforestation rates in South America [2,4].
The majority of tropical pastures exist in some stage of degradation [5]. Pasture degradation is understood as a marked reduction in livestock production due to a significant decrease in forage yield and nutritional quality, the invasion of non-palatable plant species leading to bare soil patches (thus increasing susceptibility to erosion), soil compaction, acidification and reduced soil microbial biomass [6,7,8]. This phenomenon has tremendous economic and ecological implications, as it leaves large areas of degraded land and promotes a trend of continuing deforestation [9]. As an example of economic implications, in Brazil, every year, about 8 million hectares of degraded pastures require considerable investment for renewal and/or recovery [3], with an estimated annual cost of USD 100 to 200 ha−1, i.e., around USD 1 billion per year in total at country level [10].
The predominant soils of the deforested area in the Colombian Amazon are highly weathered Haplic Ferralsols and Haplic Acrisols [11]. These acid soils typically have low total and available phosphorus (P) contents. Overgrazing and reduced pools of available nitrogen (N) and P in soil are seen as the principal causes of pasture degradation [6,8,12,13,14]. Thus, grass-legume (GL) associations are an important alternative to grass-alone (GA) pastures because of N input from the legume through symbiotic N2 fixation [15]. Examples of legume species sown in association with Urochloa grasses are Pueraria phaseoloides, Arachis pintoi, Desmodium ovalifolium, Centrosema spp. and Stylosanthes spp. Despite the aggressive growth of Urochloa grasses [15,16], stable Urochloa/legume associations are possible where grazing is appropriately managed [17,18]. Provided sufficient P supply, tropical forage legumes obtain at least 70% of their N through symbiotic N2 fixation [19]. A legume proportion range from 20% to 45% of total pasture dry matter has been estimated to cover the N requirement of pasture growth in the tropics [20], similar to grass-clover swards in temperate climates [21]. GL associations also significantly improve animal (meat and milk) productivity [18,22]. Such improvements have been largely related to the production of more forage biomass (mainly in dry season) and of better quality. Mixed grass-legume diets provide highly digestible protein, less structural carbohydrates and therefore increase animal forage voluntary intake, efficiency of nutrient conversion and live weight gain more than diets based on N fertilized grass monocultures [23,24,25]. Whilst the agricultural and environmental benefits of integration of legumes in tropical pastures have repeatedly been shown in researcher-managed fields [18], the adoption of legumes by farmers has remained rather small.
In pastoral systems, the quantity and quality of plant litter inputs are crucial for nutrient cycling [26]. In addition to aboveground litter, belowground inputs composed by root and rhizodeposition may enhance nutrient cycling and availability [27]. The belowground N input of clover growing in GL mixtures under temperate climate was around 40% of aboveground N [28] and about 50% of grass N was legume-derived [29]. Grasses growing in association with legumes thus benefit from symbiotically fixed N, with decomposing legume roots most likely being the main transfer pathway [29,30]. Preliminary research work on the determination of δ15N values of shoot tissue as part of the study on pasture degradation [8] suggests that Urochloa spp. have different N acquisition strategies, resulting in N uptake from different sources, when growing alone than when growing with legumes. Indeed, Urochloa spp. have a variety of strategies, which could affect the δ15N signature of their biomass [31]. First, grasses of the genus Urochloa can obtain 20% to 40% of their total N in the plant from the atmosphere through the association with N fixing bacteria (i.e., non-symbiotic N2 fixation) [32,33]. Secondly, U. humidicola can suppress soil nitrification by releasing inhibitors from roots [34,35], which affects the δ15N in plants [31]. Thus, the integration of legumes could advance toward improved N supply to the associated grass, either via the provision of fixed N2, or via N sparing due to the reduced demand of mineralized soil N to support legume growth.
In temperate GL pastures, grasses and legumes mutually benefit to acquire N from diverse symbiotic and non-symbiotic sources, and transform N into biomass more efficiently than pure grass or legume fields [36]. Nevertheless, in spite of the fact that in tropical grasslands the beneficial effects of GL pastures on livestock productivity and soil fertility have been well studied, the underlying processes such as symbiotic N2 fixation and N sources exploited by mixed pasture components have rarely been determined under farmers’ pasture management conditions.
The objectives of this work carried out under conditions of farmers’ practice, at the plot scale were to: (i) estimate the productivity and N uptake of GA vs. GL pastures; (ii) determine the symbiotic N2 fixation by legumes; and (iii) evaluate the N sources of grasses growing alone vs. associated with legumes. We hypothesized that legumes would fix significant amounts of N, and that the associated grasses in GL pastures would benefit from the symbiotic N2 fixation via legume N transfer, and that this legume N transfer would result in lower δ15N value of grasses in GL than in GA pastures.

2. Materials and Methods

2.1. Study Sites

The study was carried out in farms located in the Caquetá Department of Colombia, within a range of 1°19′13.2″ N to 1°44′37.51″ N, and 75°15′40.69″ W to 75°46′10.4″ W. The area is located in the Amazonia Piedmont of the eastern Andean mountain range in a landscape mostly dominated by degraded pastures. Average annual rainfall is 3758 mm and mean temperature 25.8 °C, with 1570 h of sunshine per year (adapted from IDEAM [37]).
In the study region, the landscape predominates with rolling hills of slopes lower than 25%. The soils originated from sedimentary parent material native of the Amazonic mega-basin [38]. The mineralogical fraction is constituted by gibbsite (Al(OH)3), kaolinite (Al2Si2O5(OH)4), mica and goethite [α-Fe3+O(OH)] [39]. The soils present low natural fertility, with textures ranging from silty clay to sandy clay loam, low base saturation, extreme acidity, and exchangeable aluminum saturation at toxic levels for most field crops [38]. Some soil characteristics of studied plots are provided in Table 1.
Ten paired areas (from 0.22 to 3.5 ha) with grass-alone (GA) and grass-legume (GL) pastures in adjacent plots were identified in six farms. Informal interviews with the farmers indicated that pastures were aged between 16 and 32 years, and were sown using tillage with a disc harrow and applying between 0.2 to 1.0 Mg ha−1 of CaMg(CO3)2 in five of the farms, but no-tillage or liming was used for establishing pastures in the sixth one (E1-2, Supplementary Table S1). Five of the six farmers have repeated liming since the establishment of the pastures, with intervals of several years (e.g., the plots F1-2 received lime six years before sampling). None of the farms received maintenance fertilizers or renovated pastures by re-sowing them. The grazing management of the pastures is under rotation, usually between one to three days of grazing and between 27 to 45 days of rest to permit recovery and growth of the pasture, with a dual-purpose cattle system for milk production in five farms and beef production in one farm. The establishment and management of pastures differ between farms rather than pasture types. However, sometimes more productive animals graze on GL than on GA (e.g., non-lactating cows grazing in GA), and the grazing duration gets adjusted according to forage availability. Introduced grasses evaluated in the farms were Urochloa humidicola cv. Tully (CIAT 679), U. brizantha cv. Toledo (CIAT 26110), and U. decumbens cv. Basilisk (CIAT 606). The associated forage legumes were either Arachis pintoi cv. Mani Forrajero (CIAT 17434) or Pueraria phaseoloides cv. Kudzu (CIAT 9900). Detailed information about farms management and establishment of pastures, and species found per farm is provided in Supplementary Tables S1 and S2.

2.2. Plant and Soil Sampling

In each pasture, at the end of May 2019, a 25 m2 plot was fenced to impede animal grazing and deposition of excreta for 45 days before sampling. In mid-July 2019, one sampling circle of 5 m radius was delimited per plot. Topsoil samples (0–10 cm soil depth) were collected using an Eijkelkamp Edelman soil auger in the center of the circle and in other six points that were equally distant to each other in the periphery. Soil subsamples were then mixed and a composite sample per plot was air-dried for 48 h and passed through a 2 mm sieve. A PVC frame of 1 m2 was placed randomly inside each sampling circle. Shoot biomass in the frames was cut to ground level, and harvested after 45 days of regrowth. This relatively long regrowth period was required, because the period fell into the rainy season, with 356, 473 and 611 mm of precipitation during May, June, and July 2019, respectively [42]. Slow rates of regrowth resulted from both, high levels of precipitation and cloudiness during the day, which may have resulted in lower level of photosynthetically active radiation [43], and it may have been partially influenced by the low cutting level (<5.0 cm) used to homogenize the pasture height before harvest. The harvested biomass was split into four botanical fractions: principal grasses (Urochloa spp.), secondary grasses (native/naturalized e.g., Homolepis aturensis and/or Paspalum spp.), legumes, and forbs. A plant litter composite sample was also collected. Plant litter was defined as dead plant parts lying on the ground including dead and completely dry grass leaves still attached to the shoot and senescent legume leaves. Plant samples were oven-dried at 60 °C for 72 h and their dry matter (DM) weight was determined. A subsample of each fraction was ground using a cutting mill (RETSCH, model SM 100) and pulverized using a home-made ball mill with a SIEMENS engine.
At the beginning of the study, we identified 10 paired GA and GL pasture plots. Nevertheless, possibly due to seasonal changes, at the time of the sampling two GL plots showed legume proportions that were lower than 3% and these two plots were not included to the total number of GL plots. Thus, the final results reported were based on 10 GA and 8 GL plots with an average legume proportion of 35% (10–60%) with respect to the total green biomass DM of the plot.

2.3. Chemical and Isotopic Analysis of Plants and Soil

Plant and soil samples were analyzed for total N and C concentration, 15N/14N and 13C/12C isotopic ratios by dry combustion using an NCS elemental analyzer coupled to an Isotope Ratio Mass spectrometer (Vario PYRO cube, Elementar, Germany and IsoPrime100 IRMS, Isoprime, United Kingdom) at ETH Zurich, Eschikon, Switzerland. The natural 15N abundance values are expressed as δ15N, i.e., per mil (‰) 15N excess or depletion over the 15N/14N ratio of the air (Rair = 367.6 × 10⁻⁵) [44]:
δ 15 N   ( ) =   15 N / 14 N   ratio   sample     15 N / 14 N   ratio   air 15 N / 14 N   ratio   air   ×   1000 ,
The δ13C is accordingly expressed as 13C excess or depletion over the 13C/12C ratio of the international Vienna Pee Dee Belemnite (VPDB) standard (RVPDB = 1123.75 × 10−5). For calibration, we used two international standards, IAEA-N-1 (δ15N = +0.4‰) and IAEA-N-2 (δ15N = +20.3‰), peptone (δ15N = +6.7‰) and glycine (δ15N = +12.2‰) for nitrogen, and peptone (δ13C = −15.7‰) and glycine (δ13C = −33.25‰) for carbon. Correction for instrumental drift was done by repeated measurement of a sulfanilamide internal standard (δ13C = −28‰, δ15N = −0.8‰). Repeated measurement of the sulfanilamide standard gave an analytical precision of 0.3‰ for δ15N, and 0.2‰ for δ13C. Calibrated pea grain was repeatedly measured as an internal quality check (δ13C = −24.7‰, δ15N = +2.4‰).
The P concentration in the plant tissue was determined after digestion of 0.2 g of pulverized leaf tissue with 2 mL of distilled water and 2 mL of concentrated HNO3 using a high-pressure single reaction chamber microwave system (turboWave, MWS microwave systems) [45]. The P concentration in the extracts was determined colorimetrically at 610 nm using the malachite green method [46].
Nutrient (N and P) uptake per botanical fraction was calculated by multiplying their nutrient concentration by the biomass production per m2. Total nutrient uptake was determined by summing the nutrient uptake of each botanical fraction except plant litter in 1 m2.
The weighted δ15N of the swards (on a m2 basis) was determined by applying the formula:
Weighted   δ 15 N   ( ) = [ ( δ 15 N   Pg   ×   N   uptake   Pg ) + ( δ 15 N   Sg   ×   N   uptake   Sg ) + ( δ 15 N   Leg   ×   N   uptake   Leg ) + ( δ 15 N   Forbs   ×   N   uptake   Forbs ) ] Total   N   uptake   of   the   plot ,
where Pg: principal grass, Sg: secondary grass, Leg: legumes, N uptake: N uptake in respective botanical fraction, in g m−2. The weighed δ13C (‰) was calculated accordingly.
The weighted nutrient concentration of N and P of the total biomass per plot:
Weighted   nutrient   concentration   ( mg   g   DM 1 ) = [ ( NC Pg   ×   biomass Pg ) + ( NC Sg   ×   biomass Sg ) + ( NC Leg   ×   biomass Leg ) + ( NC Forbs   ×   biomass Forbs ) ] Total   biomass   of   the   plot
where NC is the nutrient concentrations (N or P, in mg g−1).

2.4. Legume N Derived From the Atmosphere

The proportion of N derived from the atmosphere (%Ndfa, i.e., fixed N) was determined by the 15N natural abundance method [44] and applying the following formula:
Ndfa   ( % ) = δ 15 N   ref     δ 15 N   leg δ 15 N   ref     B   ×   100 ,
where δ15Nref: δ15N signature of the non-fixing reference plant shoots, δ15Nleg: δ15N signature of the legumes shoots, B: is the δ15N of Arachis pintoi or Pueraria phaseoloides shoots relying on atmospheric N2 as a sole source of N and it accounts for any internal isotopic fractionation of legume plants [47].
For reference plant, we used the forbs growing in the sampling area, i.e., in association with the legume. The δ15N of non-N2-fixing reference plant was assumed to be identical to the δ15N of soil N taken up by the legume [48]. B values used in our study were obtained from previous reports for the legume species studied or the most closely related species of the same genus. For Pueraria phaseoloides the B value used was −1.22 [49]. For Arachis pintoi we used −0.88, the mean of three values reported for Arachis hypogea [49,50,51].
The amount of N fixed was calculated for each GL plot by multiplying the N uptake in shoot DM of legumes with the respective %Ndfa.

2.5. Data Analysis

Statistical analyses and figures were performed using R v3.4.4. Significant differences between botanical fractions were assessed through a linear mixed-effects model treating pasture type and botanical fraction as fixed factors, and farm as random effect using the packages ‘lme4′ v1.1-23 and ‘nlme’ v3.1-147 in R. Multiple comparisons between botanical fractions were evaluated with TukeyHSD tests using ‘emmeans’ v1.4.8. To evaluate total differences between pasture types, weighted nutrient concentrations and isotopic signatures were calculated per farm, and a second model was built treating pasture type as fixed factor and farm as random effect. Analysis of δ15N of grass and legume species followed the same model structure as for botanical fractions, considering species and pasture type as fixed factors, and farm as random effect. Differences in %Ndfa between legume species were not statistically tested due to very high differences in sample size (n = 6 for A. pintoi, and n = 2 for P. phaseoloides). The correlation between δ15N of grasses and forbs, and the δ15N of grasses with grass biomass and N concentration were tested with the Pearson’s correlation coefficient (r). Figures were constructed using ‘ggplot2’ v2.2.1.

3. Results

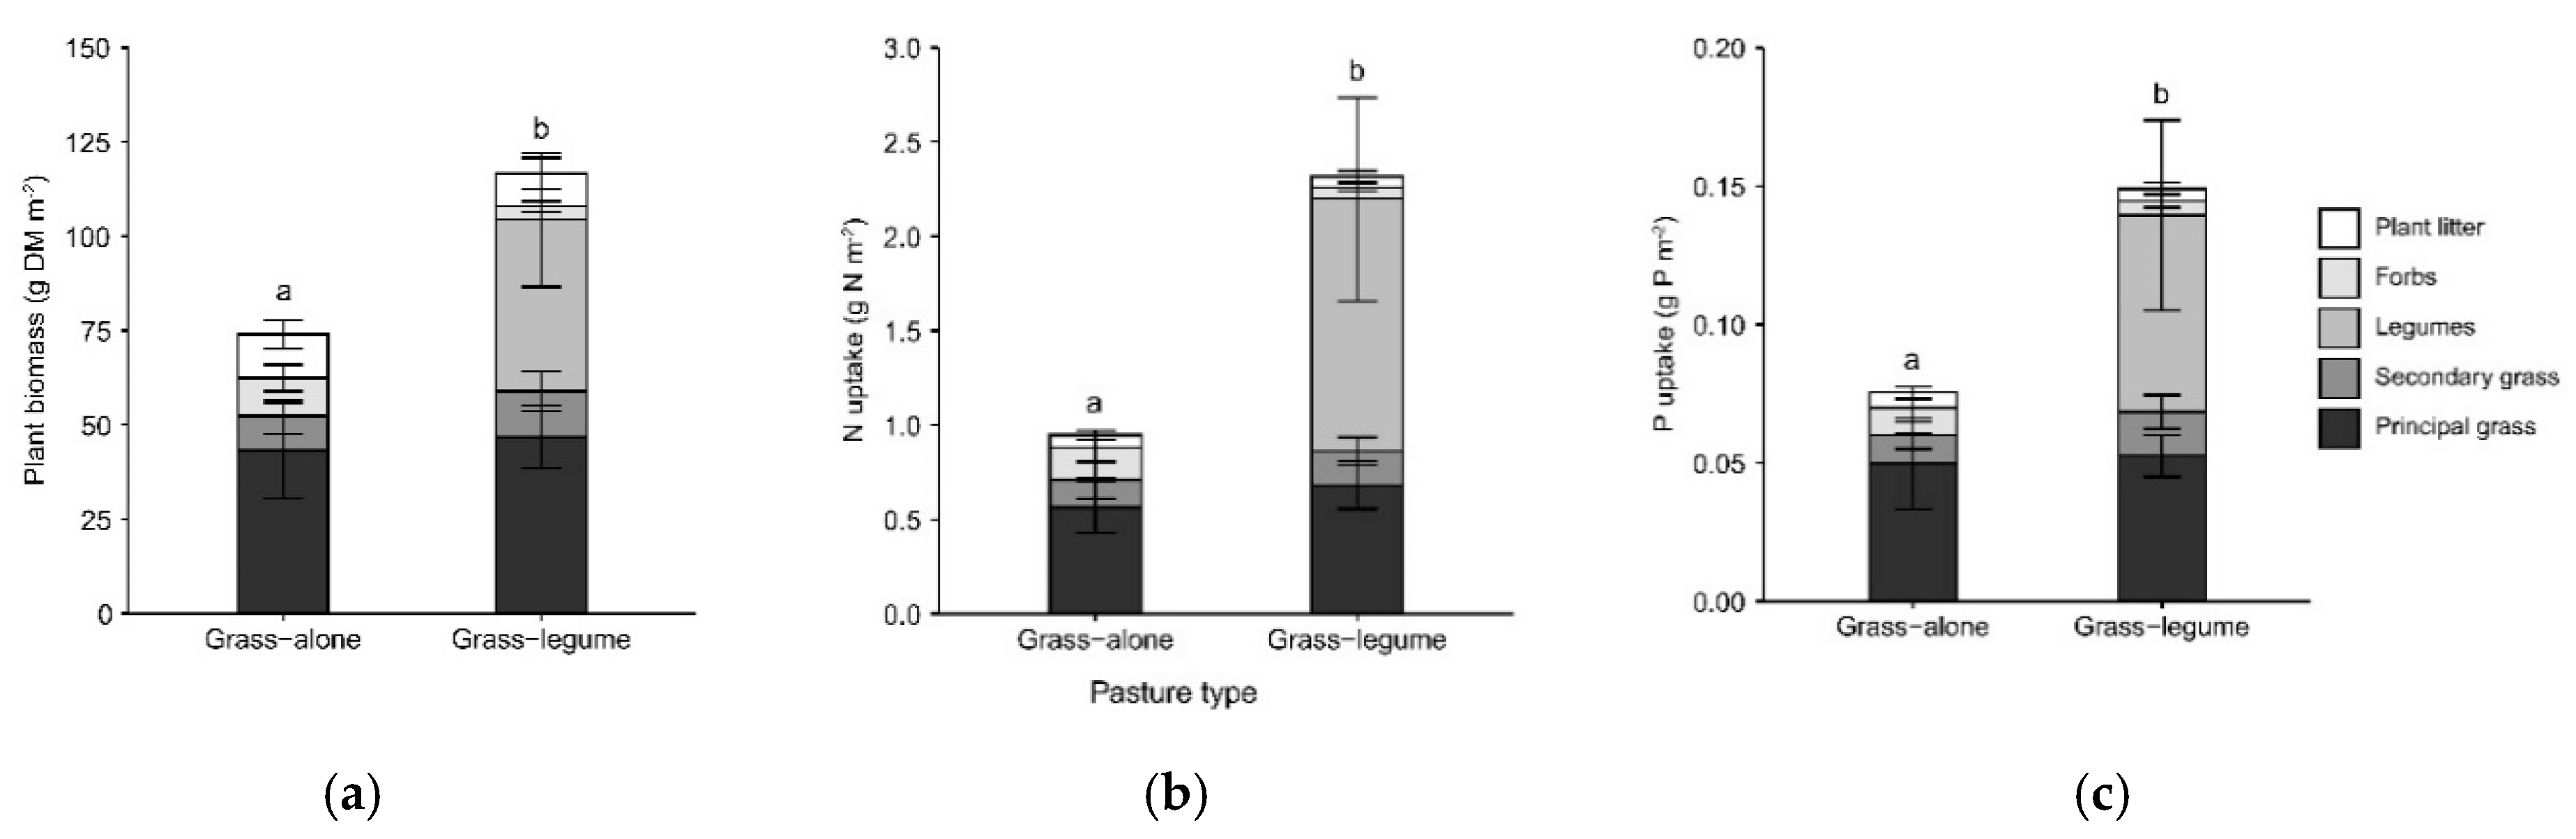
3.1. Dry Matter Productivity and Nutrient Uptake

Grass-legume pastures produced more plant biomass and had greater nutrient (N and P) uptake than GA pastures. Excluding the plant litter fraction, the extent of increase in GL compared to GA swards was up to 74% for shoot DM production (g DM m−2: 62 in GA vs 108 in GL), while it was more than two-fold higher for N uptake (g N m−2: 0.8 in GA vs 2.2 in GL) and P uptake (g P m−2: 0.07 in GA vs. 0.14 in GL) (Figure 1). The proportion of biomass of forbs in the total plant biomass of the pastures was lower in the GL (3% of total DM) than in the GA pastures (16% of total DM).
As expected, N concentrations were significantly higher in legume than grass shoots (Table 2). In contrast, P concentrations did not differ significantly between grasses and legumes. Weighted N concentration of GL plant biomass was 18% higher than that of the biomass in GA plots. No difference was observed in weighted plant biomass P concentration between the two pasture types. Therefore, the higher P uptake observed in GL than GA pastures resulted from greater DM production.

3.2. Legume-N derived from the atmosphere

The weighted δ15N signature of the combined plant biomass of GA pastures was 4.6‰, while it was 2.1‰ for GL pastures (Table 2). The δ15N signature of forbs was similar to that of soil N, whereas that of principal grasses was on average by 1.4‰ (GA) and 2.3‰ (GL) less enriched than soil N (Table 1 and Table 2, Figure 2). Therefore, forbs were considered as more appropriate reference plants to determine Ndfa than grasses.
Arachis pintoi was the legume species found in six out of eight farms, and P. phaseoloides occurred in two farms. Average Ndfa derived for GL pastures using Equation (4) ranged from 60% to 99% (average value of 80%, Table 3). A. pintoi showed on average 16% higher %Ndfa than P. phaseoloides. The amount of N fixed in the biomass of legumes ranged from 0.15 to 3.7 g N m−2.

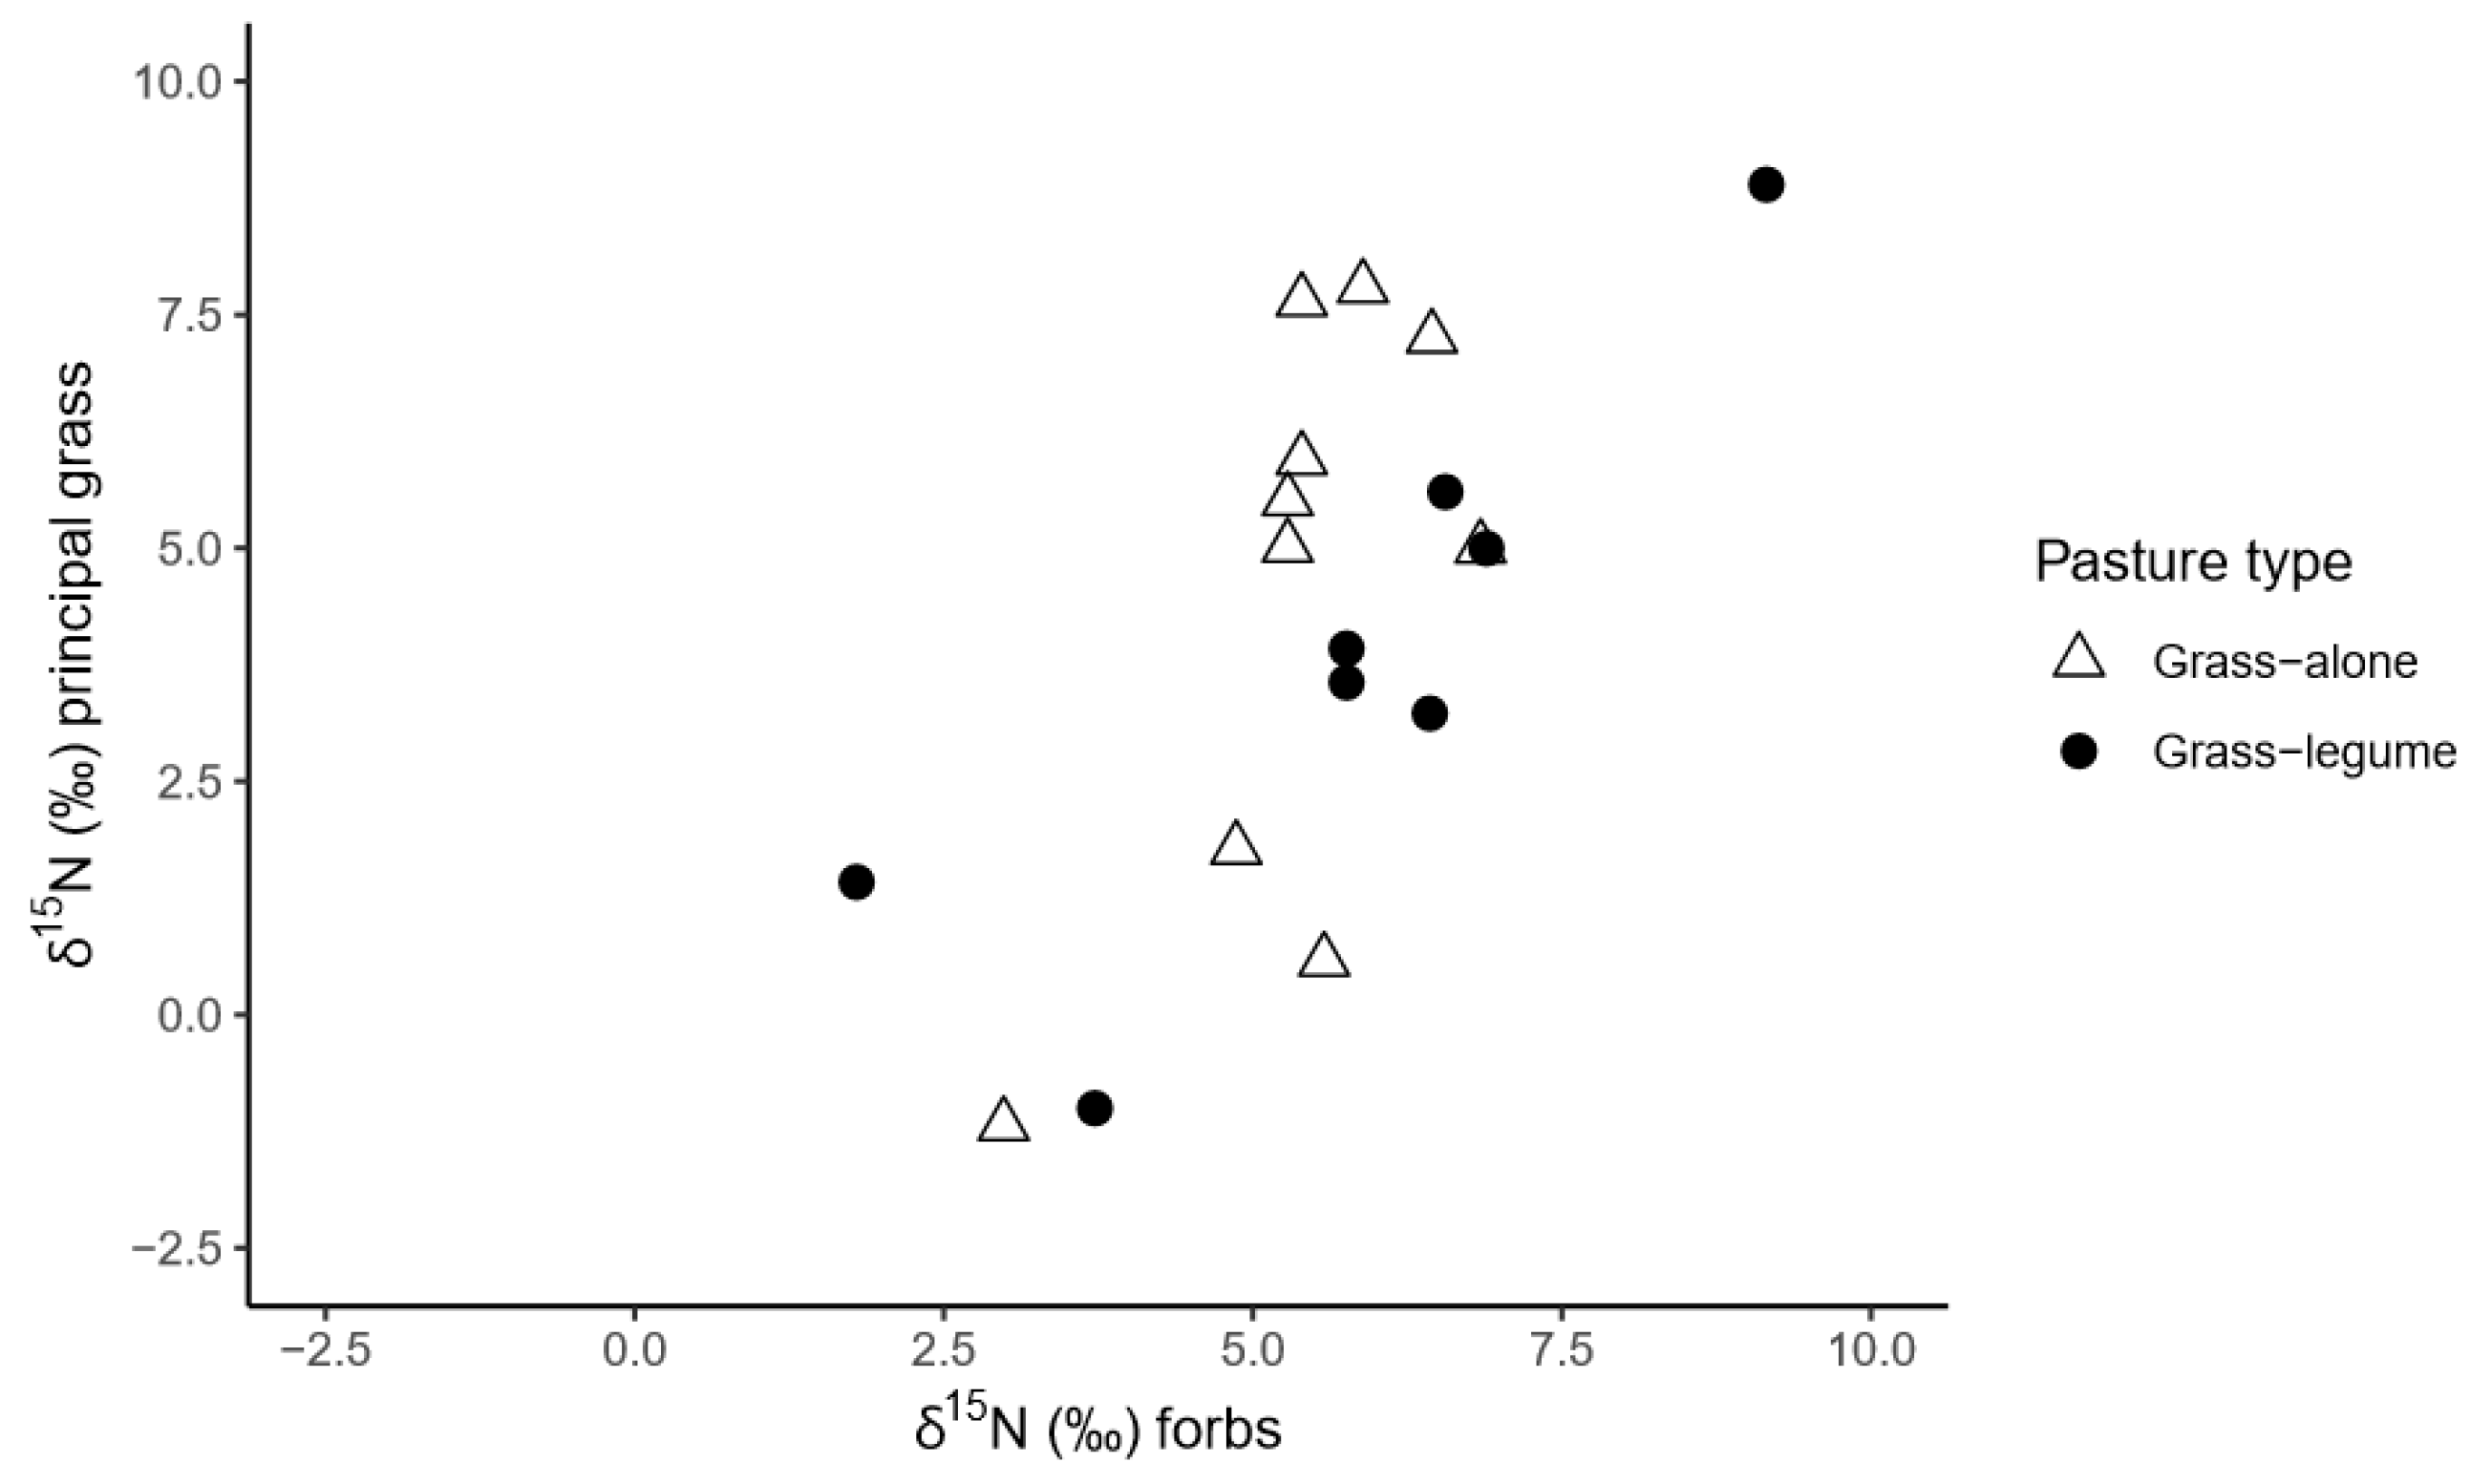
3.3. δ15N and δ13C Isotopic Signature of Pasture Components

Urochloa humidicola was the principal grass in four out of ten GA plots and three out of eight GL plots, while it was U. decumbens in four GA plots and one GL, and U. brizantha in two GA and four GL plots (Supplementary Table S2). The δ15N signature of principal grasses varied widely among plots of the same type of pasture. In three out of ten plots, the GA-principal grass showed δ15N lower than 2‰, and in two of them (A2 and F1), even lower than the corresponding GL principal grass signature (Supplementary Table S2). The average δ15N signature of shoot tissue of U. humidicola tended to be lower than that of U. decumbens and U. brizantha, however, this difference was not statistically significant (Table 3).
The δ15N of the principal grass was negatively related to the DM production of the principal grass (r = −0.5, p < 0.05. Figure 3a), and positively related to the N concentration of the principal grass shoot tissue (r = 0.5, p < 0.05. Figure 3b). However, this latter correlation was stronger in the GA pastures (r = 0.68, p < 0.05) than in GL (r = 0.26, non-significant). At N concentrations higher than 14 mg g−1 in the shoot tissue, the δ15N of grasses growing in GL pastures was lower than that of GA pastures by at least 2‰ (p < 0.01).
The δ15N values of the principal grass and the forbs were closely related (r = 0.76, p < 0.01. Figure 2). The δ15N value of the principal grass was lower than that of the forbs, on average by 0.8‰ for GA pastures, and by 1.9‰ in GL pastures (Table 2, Figure 2).
The δ13C signature of grasses was significantly higher (less negative) than that of forbs and legumes (Table 2). The type of pasture had no significant effect on δ13C of the botanical fractions and soil organic matter (Table 1 and Table 2, respectively).

4. Discussion

4.1. Legumes Improve Pasture Productivity and Nutrient Uptake

The average biomass production of 62 g m−2 in GA pastures was in the range obtained by Fonte et al. [26] on farms in the same study region (average values of 101 g m−2 for Urochloa spp. GA pastures which farmers had characterized as productive, and 47 g m−2 for degraded pastures). Moreover, during the rainy season, as in our study and Fonte et al. [26], Gomez et al. [43] harvested from fertilized Urochloa spp. GA pastures on average 250 g m−2 after 42 days of regrowth of the pasture. Pasture biomass production was reduced by a factor of two to three during the wettest months compared to drier months [43], and June 2019 had a very high amount of precipitation. Lower biomass production during the wettest months was probably due to low soil oxygen levels caused by waterlogging and/or lower rates of net photosynthesis associated with a lower level of photosynthetically active radiation, which may have been driven by higher cloudiness [52].
The pastures containing legumes (i.e., GL) had a significantly higher biomass production (Figure 1a). This is in agreement with earlier results obtained from on-station experiments. For instance, the DM production of GL pastures composed by U. decumbens and Calopogonium mucunoides was 1.25 times greater than that of GA pastures containing U. decumbens alone in an experiment near Campo Grande, Brazil [53], and DM production was doubled in experiments with U. decumbens and A. pintoi association, as compared to U. decumbens alone in Carimagua, Colombia [17].
Because Urochloa grasses obtain atmospheric N2 via non-symbiotic N2 fixation [32,33,54], we used the δ15N of the forbs as an indicator of the δ15N of available soil N. The strong depletion of δ15N in legumes compared to the forbs and grasses indicated that legumes largely relied on atmospheric N (Table 2 and Table 3) [44]. The average value of 35% legume DM in the total pasture biomass is within the range of 35–45% proposed by Thomas [20] required to maintain a balanced N cycle of tropical GL pastures with a herbage utilization of 50–70% by grazing animals. The proportion of N derived from the atmosphere (%Ndfa) observed with the legumes in this study was about 80% and this value is at the high end of the range reported for tropical legumes [19,55]. This is remarkable because available P concentrations of less than 2 mg kg soil−1 are considered as plant growth-limiting for both grasses and legumes [56,57] and could, therefore, limit N2 fixation of legumes [19].
The amount of N fixed in the shoots of legumes observed in this study was 0.15 to 3.7 g N m−2 for 45 days of regrowth. Thus, the average increase in N uptake of 1.4 g m−2 in GL pastures than GA pastures was largely due to N2 fixing ability by the legume (Figure 1b). Because on average around 80% was derived from N2 fixation, some legume N transfer to grasses might still explain the overall greater N uptake in GL than GA pastures. In temperate GL meadows, about 50% of the grass N was derived from the associated legumes [29]. Trannin et al. [30] suggested that the mineralization of root residues from Stylosanthes guianensis was the major source of legume-N transferred to the associated Urochloa decumbens. Moreover, greater N deposition through litter has been reported for GL pastures than GA pastures [58].
The P uptake was doubled in GL compared to the GA pasture (Figure 1c), at similarly low available P status of the soil (Table 1). It was reported that legumes such as A. pintoi acquire more P from less available P pools from acid soil with its smaller root system than Urochloa grass [59]. Thus, the increase of 72 mg P m−2 acquired by GL pasture can be attributed to the superior performance of legume towards improved P cycling in the system through soil P pools [60]. According to the farmers’ information, the GL pastures are grazed by more productive animals than the GA pastures, and more P may hence be exported via animal products from plots containing legumes, as suggested by Oberson et al. [61] for Urochloa-Kudzu pastures. Thus, legumes may take up more soil P and stimulate biological P cycling (through plant litter, animal excreta and microbial turnover) to keep it in available P forms. Although this could increase the risk of soil P mining [62], the strategic application of small amounts of P fertilizer (10 kg ha−1 every two years as maintenance fertilizer) may overcome the risk for soil P mining in grazed pastures [63].

4.2. What N Sources are Exploited by Grasses in Each Pasture Type

The δ15N of the principal grasses, all of which were Urochloa spp. grasses was higher than that of the legumes except in two cases (Table 3, Supplementary Table S2). At the same time, their δ15N was lower than that of the associated forbs (Table 2, Figure 2). This observation indicates that the grasses, on average, were benefiting less from atmospheric N2 than the legumes, irrespective of the underlying process.
The N concentrations of Urochloa spp. grasses observed in our study were higher than previous reports [64], although it was not sufficient to sustain higher plant growth, as indicated by the lower value of biomass production. At N concentrations higher than 14 mg g−1, the δ15N of the principal grasses of GL was lower than that of GA pastures by at least 2‰. This suggests that legume N transfer was a process involved in the provision of atmospheric N to grasses. Atmospheric N2 fixation seems to make a significant contribution resulting in low δ15N values of the Urochloa grasses in both GA and GL pastures (Table 3). Still, the contribution from non-symbiotic N2 fixation in GA may not be adequate to sustain grass growth without the supply of N from the soil through mineralization. This finding is consistent with earlier reports that suggested no more than 20–40% of N in Urochloa grasses was derived from the atmosphere via non-symbiotic N2 fixation [32,33].
C4 grasses typically have δ13C higher than −20‰, whereas C3 legumes usually have δ13C lower than −20‰ due to differences in C isotopic fractionation during CO2 assimilation [65]. In our study, the δ13C and δ15N of soil was not statistically different between pasture types, around −20‰ and 6‰, respectively (Table 1 and Table 2). While the former forest C3 vegetation still affects the isotopic composition of soil organic matter C [66], the contribution of legume residues seems to not have been enough to enrich the total soil N pool.
Although the grasses with the lowest δ15N and N concentration in shoot tissue were mostly U. humidicola (Figure 3b), no clear pattern of distribution was observed among Urochloa species, either for plant biomass production or N concentration (Figure 3a, b). We consider that the distribution of grass species observed in our study is representative of the pastures in the region. However, to draw valid conclusions on N uptake and utilization at the species level, a more balanced design with an equal number of observations per species will be needed in future research.
Low 15N natural abundance in the shoot tissue of U. humidicola has been interpreted as an indicator of high capacity of biological nitrification inhibition (BNI) in that grass [31]. Indeed, in our study, U. humidicola showed the lowest δ15N values, both in GA and GL pastures, but this grass was found to obtain a relatively significant proportion of N through non-symbiotic N2 fixation [33]. Our results rather suggest that low δ15N of the grasses is an indicator of low N availability in soil [67], and grasses adapted to N depleted soils can cope with either through BNI ability [31] and/or with non-symbiotic N2 fixation [33].

5. Conclusions

In farmers’ long-term tropical pastures established in the forest margins of Colombia, legumes associated with grasses (GL pastures) resulted in greater pasture biomass production than grass-alone (GA) pastures. Legumes derived on average 80% of their N from symbiotic N2 fixation, despite low fertility acid soils with low plant-available P content. Legumes significantly increased both N and P uptake by the pasture biomass. The greater N uptake by legumes could be assigned mostly to N fixed from the atmosphere. The δ15N signatures of grasses in GA vs. GL pastures suggested that sources of grass N are affected by legumes integrated in the pasture. While lower δ15N values of grasses growing in GL than GA pastures suggest that grasses could obtain fixed N via legume N transfer, exceptionally lowδ 15N values of grasses in GA pastures indicate significant potential for N input via non-symbiotic N2 fixation from the atmosphere. Overall, this study indicates that Urochloa grasses are capable to swap N sources when these grasses are grown in association with legumes. The role of different soil-plant processes such as BNI or N2 fixation from the atmosphere need to be further studied under field and also controlled conditions. This missing knowledge is critical to define the sources of N for grass growth, either in GA or GL pastures in the tropics.

Supplementary Materials

The following are available online at https://0-www-mdpi-com.brum.beds.ac.uk/1424-2818/12/11/419/s1, Table S1: Establishment and management parameters of ten grass-alone (GA) and eight grass-legume (GL) paired pastures in six farms in the Caquetá Department of Colombia, Table S2: Grass and legume species, δ15N signature of shoots, and %Ndfa observed per species per farm.

Author Contributions

Conceptualization: A.O. and J.V.; methodology: A.O., J.V., G.R.; investigation: D.M.V., J.V., G.R., K.O.; data curation: D.M.V.; validation: A.O., J.V., J.A., I.M.R.; writing—original draft preparation: D.M.V. and A.O.; writing—review and editing: D.M.V., J.V., G.R., J.A., I.M.R., A.O.; project administration: A.O., J.V.; funding acquisition: A.O., J.V., J.A.; All authors have read and agreed to the published version of the manuscript.

Funding

The authors acknowledge the financial support of the Leading House for the Latin American Region, University of St. Gallen, Switzerland. D.V. and J.A. acknowledge the UK Research and Innovation (UKRI) Global Challenges Research Fund (GCRF) GROW Colombia grant via the UK’s Biotechnology and Biological Sciences Research Council (BB/P028098/1). Additional funding for this study was received from the CGIAR Research Programs on Livestock; and Climate Change, Agriculture and Food Security (CCAFS).

Acknowledgments

We warmly acknowledge the great cooperation of farmers in the region. We thank Federica Tamburini (ETH Zurich) for mass spectrometry measurements.

Conflicts of Interest

The authors declare no conflict of interest. The funders had no role in the design of the study; in the collection, analyses, or interpretation of data; in the writing of the manuscript, or in the decision to publish the results.

References

  1. Hansen, M.C.; Potapov, P.V.; Moore, R.; Hancher, M.; Turubanova, S.A.; Tyukavina, A.; Thau, D.; Stehman, S.V.; Goetz, S.J.; Loveland, T.R.; et al. High-resolution global maps of 21st-century forest cover change. Science 2013, 342, 850–853. [Google Scholar] [CrossRef] [PubMed] [Green Version]
  2. Asner, G.P.; Townsend, A.R.; Bustamante, M.M.C.; Nardoto, G.B.; Olander, L.P. Pasture degradation in the central Amazon: Linking changes in carbon and nutrient cycling with remote sensing. Glob. Chang. Biol. 2004, 10, 844–862. [Google Scholar] [CrossRef]
  3. Jank, L.; Barrios, S.C.; Do Valle, C.B.; Simeáo, R.M.; Alves, G.F. The value of improved pastures to Brazilian beef production. Crop Pasture Sci. 2014, 65, 1132–1137. [Google Scholar] [CrossRef]
  4. Wassenaar, T.; Gerber, P.; Verburg, P.H.; Rosales, M.; Ibrahim, M.; Steinfeld, H. Projecting land use changes in the Neotropics: The geography of pasture expansion into forest. Glob. Environ. Chang. Hum. Policy Dimens. 2007, 17, 86–104. [Google Scholar] [CrossRef]
  5. Jimenez, J.J.; Lal, R. Mechanisms of C sequestration in soils of Latin America. Crit. Rev. Plant Sci. 2006, 25, 337–365. [Google Scholar] [CrossRef] [Green Version]
  6. Boddey, R.M.; Macedo, R.; Tarre, R.M.; Ferreira, E.; de Oliveira, O.C.; Rezende, C.D.; Cantarutti, R.B.; Pereira, J.M.; Alves, B.J.R.; Urquiaga, S. Nitrogen cycling in Brachiaria pastures: The key to understanding the process of pasture decline. Agric. Ecosyst. Environ. 2004, 103, 389–403. [Google Scholar] [CrossRef]
  7. De Oliveira, O.C.; de Oliveira, I.P.; Alves, B.J.R.; Urquiaga, S.; Boddey, R.M. Chemical and biological indicators of decline/degradation of Brachiaria pastures in the Brazilian Cerrado. Agric. Ecosyst. Environ. 2004, 103, 289–300. [Google Scholar] [CrossRef]
  8. Nesper, M.; Buenemann, E.K.; Fonte, S.J.; Rao, I.M.; Velasquez, J.E.; Ramirez, B.; Hegglin, D.; Frossard, E.; Oberson, A. Pasture degradation decreases organic P content of tropical soils due to soil structural decline. Geoderma 2015, 257, 123–133. [Google Scholar] [CrossRef]
  9. Steinfield, H.; Gerber, P.; Wassenaar, T.; Castel, V.; Rosales, M.; de Haan, C. Livestock’s Long Shadow: Environmental Issues and Options; FAO: Rome, Italy, 2006. [Google Scholar]
  10. FAO. Country Pasture/Forage Resource Profiles Brazil. 2006. Available online: http://www.fao.org/ag/agp/AGPC/doc/Counprof/Brazil/brazil2.htm (accessed on 10 June 2020).
  11. Navarrete, D.; Sitch, S.; Aragão, L.E.O.C.; Pedroni, L. Conversion from forests to pastures in the Colombian Amazon leads to contrasting soil carbon dynamics depending on land management practices. Glob. Chang. Biol. 2016, 22, 3503–3517. [Google Scholar] [CrossRef] [Green Version]
  12. Dias-Filho, M.B.; Davidson, E.A.; de Carvalho, C.J.R. Linking biochemical cycles to cattle pasture management and sustainability in the Amazon Basin. In The Biogeochemistry of the Amazon Basin; McClain, M.E., Victoris, R.L., Richery, J.E., Eds.; Oxford University Press: New York, NY, USA, 2001; pp. 84–105. [Google Scholar]
  13. Fisher, M.J.; Braz, S.P.; Dos Santos, R.S.M.; Urquiaga, S.; Alves, B.J.R.; Bodddey, R.M. Another dimension to grazing systems: Soil carbon. Trop. Grassl. 2007, 41, 65–83. [Google Scholar]
  14. Neill, C.; Piccolo, M.C.; Melillo, J.M.; Steudler, P.A.; Cerri, C.C. Nitrogen dynamics in Amazon forest and pasture soils measured by N-15 pool dilution. Soil Biol. Biochem. 1999, 31, 567–572. [Google Scholar] [CrossRef]
  15. Miles, J.W.; Do Valle, C.B.; Rao, I.M.; Euclides, V.P.B. Brachiaria grasses. In Warm Season (C4) Grasses; ASA, CSSA, SSSA: Madison, WI, USA, 2004; Volume Monograph No. 45, p. 39. [Google Scholar]
  16. Rao, I.M. Adapting tropical forages to low-fertility soils. In Proceedings of the Xix International Grassland Congress, São Pedro, São Paulo, Brazil, 11–21 February 2001; pp. 247–254. [Google Scholar]
  17. Fisher, M.J.; Kerridge, P.C. The agronomy and physiology of Brachiaria species. In Brachiaria: Biology, Agronomy, and Improvement; Miles, J.W., Maass, B.L., do Valle, C.B., Eds.; Centro International de Agricultura Tropical: Cali, Colombia, 1996; pp. 43–52. [Google Scholar]
  18. Schultze-Kraft, R.; Rao, I.M.; Peters, M.; Clements, R.J.; Bai, C.; Liu, G. Tropical forage legumes for environmental benefits: An overview. Trop. Grassl. Forrajes Trop. 2018, 6, 1–14. [Google Scholar] [CrossRef] [Green Version]
  19. Cadisch, G.; Sylvester-Bradley, R.; Nösberger, J. 15N-based estimation of nitrogen fixation by eight tropical forage-legumes at two levels of P:K supply. Field Crops Res. 1989, 22, 181–194. [Google Scholar] [CrossRef]
  20. Thomas, R.J. The role of the legume in the nitrogen cycle of productive and sustainable pastures. Grass Forage Sci. 1992, 47, 133–142. [Google Scholar] [CrossRef]
  21. Lüscher, A.; Mueller-Harvey, I.; Soussana, J.F.; Rees, R.M.; Peyraud, J.L. Potential of legume-based grassland-livestock systems in Europe: A review. Grass Forage Sci. 2014, 69, 206–228. [Google Scholar] [CrossRef]
  22. Cipagauta, M.; Velásquez, J.; Pulido, J.I. Producción de leche en tres pasturas del Piedemonte Amazonico del Caquetá, Colombia. Pasturas Trop. 1998, 20, 2–10. [Google Scholar]
  23. Boddey, R.M.; Casagrande, D.R.; Homem, B.G.C.; Alves, B.J.R. Forage legumes in grass pastures in tropical Brazil and likely impacts on greenhouse gas emissions: A review. Grass Forage Sci. 2020. [Google Scholar] [CrossRef]
  24. Rao, I.; Peters, M.; Castro, A.; Schultze-Kraft, R.; White, D.; Fisher, M.; Miles, J.; Lascano, C.; Blümmel, M.; Bungenstab, D.; et al. LivestockPlus—The sustainable intensification of forage-based agricultural systems to improve livelihoods and ecosystem services in the tropics. Trop. Grassl. Forrajes Trop. 2015, 3, 59–82. [Google Scholar] [CrossRef]
  25. Gaviria-Uribe, X.; Naranjo-Ramírez, J.F.; Bolívar-Vergara, D.M.; Barahona-Rosales, R. Intake and digestibility of nutrients in zebu steers grazing in intensive silvopastoral system. Arch. Zootec. 2015, 64, 21–27. [Google Scholar] [CrossRef] [Green Version]
  26. Fonte, S.J.; Nesper, M.; Hegglin, D.; Velásquez, J.E.; Ramirez, B.; Rao, I.M.; Bernasconi, S.M.; Bünemann, E.K.; Frossard, E.; Oberson, A. Pasture degradation impacts soil phosphorus storage via changes to aggregate-associated soil organic matter in highly weathered tropical soils. Soil Biol. Biochem. 2014, 68, 150–157. [Google Scholar] [CrossRef]
  27. Nakamura, S.; Saliou, P.S.; Takahashi, M.; Ando, Y.; Subbarao, G.V. The contribution of root turnover on biological nitrification inhibition and its impact on the ammonia-oxidizing archaea under Brachiaria cultivations. Agronomy 2020, 10, 1003. [Google Scholar] [CrossRef]
  28. Hammelehle, A.; Oberson, A.; Luscher, A.; Mader, P.; Mayer, J. Above- and belowground nitrogen distribution of a red clover-perennial ryegrass sward along a soil nutrient availability gradient established by organic and conventional cropping systems. Plant Soil 2018, 425, 507–525. [Google Scholar] [CrossRef]
  29. Oberson, A.; Frossard, E.; Bühlmann, C.; Mayer, J.; Mäder, P.; Lüscher, A. Nitrogen fixation and transfer in grass-clover leys under organic and conventional cropping systems. Plant Soil 2013, 371, 237–255. [Google Scholar] [CrossRef] [Green Version]
  30. Trannin, W.S.; Urquiaga, S.; Guerra, G.; Ibijbijen, J.; Cadisch, G. Interspecies competition and N transfer in a tropical grass-legume mixture. Biol. Fertil. Soils 2000, 32, 441–448. [Google Scholar] [CrossRef]
  31. Karwat, H.; Egenolf, K.; Nuñez, J.; Rao, I.; Rasche, F.; Arango, J.; Moreta, D.; Arevalo, A.; Cadisch, G. Low 15N natural abundance in shoot tissue of Brachiaria humidicola is an indicator of reduced N losses due to biological nitrification inhibition (BNI). Front. Microbiol. 2018, 9, 2383. [Google Scholar] [CrossRef]
  32. Boddey, R.; Victoria, R. Estimation of biological nitrogen fixation associated with Brachiaria and Paspalum grasses using 15N labelled organic matter and fertilizer. In Nitrogen Fixation with Non-Legumes; Springer: Dordrecht, The Netherlands, 1986; pp. 265–292. [Google Scholar]
  33. Reis, V.M.; dos Reis, F.B.; Quesada, D.M.; de Oliveira, O.C.A.; Alves, B.J.R.; Urquiaga, S.; Boddey, R.M. Biological nitrogen fixation associated with tropical pasture grasses. Aust. J. Plant Physiol. 2001, 28, 837–844. [Google Scholar] [CrossRef]
  34. Nunez, J.; Arevalo, A.; Karwat, H.; Egenolf, K.; Miles, J.; Chirinda, N.; Cadisch, G.; Rasche, F.; Rao, I.; Subbarao, G.; et al. Biological nitrification inhibition activity in a soil-grown biparental population of the forage grass, Brachiaria humidicola. Plant Soil 2018, 426, 401–411. [Google Scholar] [CrossRef]
  35. Subbarao, G.V.; Nakahara, K.; Hurtado, M.P.; Ono, H.; Moreta, D.E.; Salcedo, A.F.; Yoshihashi, A.T.; Ishikawa, T.; Ishitani, M.; Ohnishi-Kameyama, M.; et al. Evidence for biological nitrification inhibition in Brachiaria pastures. Proc. Natl. Acad. Sci. USA 2009, 106, 17302–17307. [Google Scholar] [CrossRef] [Green Version]
  36. Nyfeler, D.; Huguenin-Elie, O.; Suter, M.; Frossard, E.; Lüscher, A. Grass-legume mixtures can yield more nitrogen than legume pure stands due to mutual stimulation of nitrogen uptake from symbiotic and non-symbiotic sources. Agric. Ecosyst. Environ. 2011, 140, 155–163. [Google Scholar] [CrossRef]
  37. Instituto de Hidrología Meteorología y Estudios Ambientales (IDEAM). Atlas Climatológico, Radiación y de Viento. Available online: http://www.ideam.gov.co/web/tiempo-y-clima/ (accessed on 7 August 2020).
  38. Instituto Geográfico Agustín Codazzi (IGAC). Estudio General de Suelos y Zonificación de Tierras: Departamento de Caquetá. Escala 1:100.000; Instituto Geográfico Agustín Codazzi (IGAC): Bogotá, Colombia, 2014. [Google Scholar]
  39. Rosas-Patiño, G.; Puentes-Páramo, Y.J.; Menjivar-Flores, J.C. Liming effect on macronutrient intake for cacao (Theobroma cacao L.) in the Colombian Amazon. Cienc. Tecnol. Agropecu. 2019, 20, 5–28. [Google Scholar]
  40. Borrero Tamayo, G.; Jiménez, J.; Ricaurte Oyola, J.J.; Rivera, M.; Polanía Perdomo, J.A.; Núñez, J.; Barbosa, N.; Arango, J.; Cardoso, J.; Rao, I.M. Manual de protocolos. In Nutrición y Fisiología de Plantas-Forrajes y Fríjol; Centro Internacional de Agricultura Tropical (CIAT): Cali, Colombia, 2017. [Google Scholar]
  41. Murphy, J.; Riley, J.P. A modified single solution method for the determination of phosphate in natural waters. Anal. Chim. Acta 1962, 27, 31–36. [Google Scholar] [CrossRef]
  42. Instituto de Hidrología Meteorología y Estudios Ambientales (IDEAM). Geoportal de datos hidrometeorológicos DHIME. Available online: http://www.dhime.ideam.gov.co/ (accessed on 13 August 2020).
  43. Gómez, M.; Velásquez, J.; Miles, J.; Rayo, F. Adaptation of Brachiaria to the Amazonian piedmont in Colombia. Pasturas Trop. 2000, 22, 19–25. [Google Scholar]
  44. Shearer, G.; Kohl, D.H. N2 fixation in field settings: Estimations based on natural abundance. Aust. J. Plant Physiol. 1986, 13, 699–744. [Google Scholar] [CrossRef]
  45. Wiggenhauser, M.; Bigalke, M.; Imseng, M.; Keller, A.; Archer, C.; Wilcke, W.; Frossard, E. Zinc isotope fractionation during grain filling of wheat and a comparison of zinc and cadmium isotope ratios in identical soil–plant systems. New Phytol. 2018, 219, 195–205. [Google Scholar] [CrossRef] [Green Version]
  46. Ohno, T.; Zibilske, L.M. Determination of low concentrations of phosphorus in soil extracts using malachite green. Soil Sci. Soc. Am. J. 1991, 55, 892–895. [Google Scholar] [CrossRef]
  47. Unkovich, M.J.; Pate, J.S.; Sanford, P.; Armstrong, E.L. Potential precision of the d15N natural abundance method in the field estimates of nitrogen fixation by crop and pasture legumes in south-west Australia. Aust. J. Agric. Res. 1994, 45, 119–132. [Google Scholar] [CrossRef]
  48. Unkovich, M.; Herridge, D.; Peoples, M.; Cadisch, G.; Boddey, R.; Giller, K.; Alves, B.; Chalk, P.M. Measuring Plant-Associated Nitrogen Fixation in Agricultural Systems; ACIAR: Canberra, Australia, 2008; Volume 136. [Google Scholar]
  49. Peoples, M.; Bell, M.; Bushby, H. Effect of rotation and inoculation with Bradyrhizobium on nitrogen fixation and yield of peanut (Arachis hypogaea L., cv. Virginia Bunch). Aust. J. Agric. Res. 1992, 43, 595–607. [Google Scholar] [CrossRef]
  50. Cadisch, G.; Hairiah, K.; Giller, K.E. Applicability of the natural N-15 abundance technique to measure N-2 fixation in Arachis hypogaea grown on an Ultisol. Neth. J. Agric. Sci. 2000, 48, 31–45. [Google Scholar]
  51. Okito, A.; Alves, B.; Urquiaga, S.; Boddey, R.M. Isotopic fractionation during N-2 fixation by four tropical legumes. Soil Biol. Biochem. 2004, 36, 1179–1190. [Google Scholar] [CrossRef]
  52. Rao, I.M. Advances in improving adaptation of common bean and Brachiaria forage grasses to abiotic stress in the tropics. In Handbook of Plant and Crop Physiology; Pessarakli, M., Ed.; CRC Press: Boca Raton, FL, USA, 2014; pp. 847–889. [Google Scholar]
  53. Seiffert, N.; Zimmer, A. Contribución de Calopogonium mucunoides al contenido de nitrógeno en pasturas de Brachiaria decumbens. Pasturas Trop. 1988, 10, 8–13. [Google Scholar]
  54. Ribeiro, N.V.d.S.; Vidal, M.S.; Barrios, S.C.L.; Baldani, V.L.D.; Baldani, J.I. Genetic diversity and growth promoting characteristics of diazotrophic bacteria isolated from 20 genotypes of Brachiaria spp. Plant Soil 2020, 451, 187–205. [Google Scholar] [CrossRef]
  55. Thomas, R.J.; Lascano, C.E. The benefits of forage legumes for livestock production and nutrient cycling in pasture and agropastoral systems of acid soils savannas of Latin America. In Livestock and Sustainable Nutrient Cycling in Mixed Farming Systems of Sub-Sahara Africa; Powell, J.M., Fernandez-Rivera, S., Williams, T.O., Renard, C., Eds.; ILCA: Addis Ababa, Ethiopia, 1995; pp. 277–291. [Google Scholar]
  56. Rao, I.M.; Kerridge, P.C.; Macedo, M.C.M. Nutritional requirements of Brachiaria and adaptation to acid soils. In Brachiaria: Biology, Agronomy, and Improvement; Miles, J.W., Maass, B.L., do Valle, C.B., Eds.; CIAT: Cali, Colombia, 1996; pp. 53–71. [Google Scholar]
  57. Rao, I.; Kerridge, P. Mineral nutrition of forage Arachis. In Bioogy and Agronomy of Forage Arachis; Kerridge, P., Hardy, B., CIAT: Cali, Colombia, 1994; pp. 71–83. [Google Scholar]
  58. Cantarutti, R.B.; Tarre, R.; Macedo, R.; Cadisch, G.; Rezende, C.D.; Pereira, J.M.; Braga, J.M.; Gomide, J.A.; Ferreira, E.; Alves, B.J.R.; et al. The effect of grazing intensity and the presence of a forage legume on nitrogen dynamics in Brachiaria pastures in the Atlantic forest region of the south of Bahia, Brazil. Nutr. Cycl. Agroecosyst. 2002, 64, 257–271. [Google Scholar] [CrossRef]
  59. Rao, I.M.; Borrero, V.; Ricaurte, J.; Garcia, R. Adaptive attributes of tropical forage species to acid soils. V. Differences in phosphorus acquisition from less available inorganic and organic sources of phosphate. J. Plant Nutr. 1999, 22, 1175–1196. [Google Scholar] [CrossRef]
  60. Oberson, A.; Bünemann, E.K.; Friesen, D.K.; Rao, I.M.; Smithson, P.C.; Turner, B.L.; Frossard, E. Improving phosphorus fertility in tropical soils through biological interventions. In Biological Approaches to Sustainable Soil Systems; Uphoff, N., Ball, A.S., Fernandes, E., et al., Eds.; CRC Press: Boca Raton, FL, USA, 2006; pp. 531–546. [Google Scholar]
  61. Oberson, A.; Friesen, D.K.; Tiessen, H.; Morel, C.; Stahel, W. Phosphorus status and cycling in native savanna and improved pastures on an acid low-P Colombian Oxisol. Nutr. Cycl. Agroecosyst. 1999, 55, 77–88. [Google Scholar] [CrossRef]
  62. Bünemann, E.; Smithson, P.C.; Jama, B.; Frossard, E.; Oberson, A. Maize productivity and nutrient dynamics in maize-fallow rotations in western Kenya. Plant Soil 2004, 264, 195–208. [Google Scholar] [CrossRef]
  63. Rao, I.M.; Barrios, E.; Amezquita, E.; Friesen, D.K.; Thomas, R.; Oberson, A.; Singh, B.R. Soil phosphorus dynamics, acquisition and cycling in crop-pasture-fallow systems in low fertility tropical soils of Latin America. In Modelling Nutrient Management in Tropical Cropping Systems; Delve, R.J., Probert, M.E., Eds.; Australian Center for International Agricultural Research (ACIAR): Canberra, Australia, 2004; Volume 114, pp. 126–134. [Google Scholar]
  64. Nakamura, T.; Miranda, C.H.B.; Ohwaki, Y.; Valéio, J.R.; Kim, Y.; Macedo, M.C.M. Characterization of nitrogen utilization by Brachiaria grasses in Brazilian savannas (Cerrados). Soil Sci. Plant Nutr. 2005, 51, 973–979. [Google Scholar] [CrossRef]
  65. O’Leary, M.H. Carbon Isotopes in Photosynthesis: Fractionation techniques may reveal new aspects of carbon dynamics in plants. BioScience 1988, 38, 328–336. [Google Scholar] [CrossRef]
  66. De Moraes, J.F.L.; Volkoff, B.; Cerri, C.C.; Bernoux, M. Soil properties under Amazon forest and changes due to pasture installation in Rondônia, Brazil. Geoderma 1996, 70, 63–81. [Google Scholar] [CrossRef]
  67. Craine, J.M.; Brookshire, E.N.J.; Cramer, M.D.; Hasselquist, N.J.; Koba, K.; Marin-Spiotta, E.; Wang, L. Ecological interpretations of nitrogen isotope ratios of terrestrial plants and soils. Plant Soil 2015, 396, 1–26. [Google Scholar] [CrossRef] [Green Version]
Figure 1. (a) Shoot plant biomass production (b) N uptake and (c) P uptake in grass alone and grass-legume pastures for each plant fraction; n = 10 for grass alone and 8 for grass-legume pastures. DM = dry matter. Different letters denote statistical differences for the total plant biomass production, N and P uptake of the sward per pasture type (α = 0.05).
Diversity 12 00419 g001
Figure 2. Relationship between shoot δ15N signature of forbs and principal grasses sampled in grass-alone (open triangles, n = 10) and grass-legume (full circles, n = 8) pastures. Pearson’s correlation coefficient (r) = 0.76, p < 0.01.
Diversity 12 00419 g002
Figure 3. (a) Relationship between biomass production and δ15N signature of principal grass shoot, r = −0.5, p < 0.05. (b) Relationship between total N concentration and δ15N signature of principal grass, r = 0.5, p < 0.05. Open triangles represent grass-alone pastures, n = 10. Full circles represent grass-legume pastures, n = 8. H = Urochloa humidicola, D = U. decumbens, B = U. brizantha.
Diversity 12 00419 g003
Table 1. Soil chemical characteristics (0–10 cm soil depth) of grass-alone and grass-legume pastures sampled on farms in the Caquetá Department of Colombia. Each value represents the mean of ten plots for grass-alone, and of eight plots for grass-legume pastures.
Pasture TypepH aTotal N
(mg g Dry Soil−1) b
NH4+
(mg kg Dry Soil−1) c
NO3
(mg kg Dry Soil−1) c
Total C
(mg g Dry Soil−1) b
Bray-II P (mg kg Dry Soil−1) dC:Nδ15N (‰) bδ13C (‰) b
Grass-alone4.8 ± 0.32.9 ± 0.54.1 ± 1.03.1 ± 2.132.4 ± 5.61.27 ± 0.511.2 ± 0.75.9 ± 0.7−20.6 ± 1.6
Grass-legume4.8 ± 0.12.6 ± 0.73.9 ± 2.33.4 ± 4.528.2 ± 7.41.09 ± 0.610.6 ± 0.86.1 ± 1.2−21.0 ± 1.6
a Measured in deionized water. b Total N, C, δ15N, and δ13C determined by dry combustion using an NCS elemental analyzer coupled to an Isotope Ratio Mass spectrometer (Vario PYRO cube, Elementar, Germany and IsoPrime100 IRMS, Isoprime, United Kingdom) (precision ± 0.2‰), further details are provided in Section 2.3. c Mineral N extraction in 1M KCl and quantification of NH4+ and NO3 following Borrero et al. [40]. d Bray-II extractable P [40,41].
Table 2. Nutrient concentrations (N, P, C) and isotopic signatures of N and C in two different pasture types for each botanical fraction. Values are mean ± standard deviation, with n = 10 for grass alone, and n = 8 for grass-legume pastures. DM = dry matter, ns = not significant.
Pasture TypeBotanical FractionN Concentration
(g N kg DM−1)
P Concentration
(g P kg DM−1)
C Concentration
(g C kg DM−1)
C:Nδ15N
(‰)
δ13C
(‰)
Grass aloneForbs18.8 ± 4.1 c1.3 ± 0.4 b411.1 ± 5.4 a22.7 ± 4.7 a5.3 ± 1.1 d−25.0 ± 5.1 b
Principal grass14.9 ± 3.5 b1.1 ± 0.3 b424.0 ± 5.4 b30.0 ± 7.6 a4.5 ± 3.1 c−13.3 ± 0.5 d
Secondary grass15.3 ± 5.3 bc1.4 ± 0.3 b420.5 ± 8.1 ab30.5 ± 11.4 a2.5 ± 3.0 c−20.9 ± 6.2 c
Legumes22.1 ± 4.8 d1.2 ± 0.1 b447.9 ± 9.0 c20.7 ± 4.9 a−0.6 ± 0.6 a−31.0 ± 0.0 a
Plant litter6.8 ± 1.8 a0.4 ± 0.1 a424.8 ± 11.7 b67.1 ± 20.1 b1.9 ± 2.3 b−16.9 ± 3.8 c
Total *17.4 ± 3.9 A1.2 ± 0.3 A426.2 ± 11.5 A25.8 ± 7.1 A4.6 ± 2.9 B−17.1 ± 3.8 A
Grass legumeForbs18.4 ± 3.1 c1.4 ± 0.4 b417.4 ± 7.5 ab23.1 ± 3.7 a5.7 ± 2.5 d−25.4 ± 5.3 b
Principal grass14.8 ± 3.5 b1.3 ± 0.5 b426.9 ± 5.0 b30.1 ± 6.8 a3.8 ± 2.9 c−12.7 ± 0.4 d
Secondary grass15.4 ± 2.1 bc1.4 ± 0.3 b419.8 ± 5.0 ab27.6 ± 3.7 a3.6 ± 3.2 c−18.0 ± 3.8 c
Legumes27.8 ± 3.3 d1.3 ± 0.3 b422.1 ± 9.2 ab15.3 ± 1.8 a0.4 ± 1.0 a−29.6 ± 0.3 a
Plant litter7.9 ± 1.3 a0.5 ± 0.2 a417.1 ± 8.6 ab53.6 ± 7.3 b1.1 ± 2.1 b−16.0 ± 0.9 c
Total *20.5 ± 3.2 B1.2 ± 0.2 A404.9 ± 46.2 A20.0 ± 3.3 A2.1 ± 1.7 A−19.9 ± 3.5 A
Source of variation **Pasture typensnsp < 0.05nsnsns
Botanical fractionp < 0.001p < 0.001p < 0.001p < 0.001p < 0.001p < 0.001
Pasture type x botanical fractionnsnsp < 0.001nsnsns
Farm (random)p < 0.001p < 0.001p < 0.05nsp < 0.001p < 0.001
* Calculated values of weighted nutrient concentration or isotopic signature of each botanical fraction (forbs, grasses and legumes only) by their nutrient uptake as in Equations (2) and (3). ** Sources of variation apply only for comparison of botanical fractions. For each variable, different lowercase letters indicate statistical differences of botanical fractions within and between pasture types. Uppercase letters indicate statistical differences for the total (weighted) concentrations between pasture types according to the Tukey HSD test (α = 0.05).
Table 3. Grass and legume species, average δ15N signature of shoots and %Ndfa ± standard deviation of the mean observed per species. Ndfa = Nitrogen derived from the atmosphere, ns = not significant.
Pasture TypeSpeciesδ15N (‰)Ndfa (%)
Grass aloneU. brizantha4.7 ± 4.2 ab-
U. decumbens5.8 ± 1.1 b-
U. humidicola3.2 ± 4.2 ab-
Grass legumeU. brizantha4.9 ± 2.7 ab-
U. decumbens5.0 ± 0.0 ab-
U. humidicola2.0 ± 3.3 ab-
A. pintoi0.4 ± 0.9 a83.2 ± 14.0
P. phaseoloides1.3 ± 0.6 ab67.5 ± 9.2
Source of variationPasture typens-
Speciesp < 0.05-
Pasture type x speciesns-
Farm (random)ns-
Different letters indicate statistical differences according to the TukeyHSD test (α = 0.05).
Publisher’s Note: MDPI stays neutral with regard to jurisdictional claims in published maps and institutional affiliations.

