Article

18S rRNA Analysis Reveals High Diversity of Phytoplankton with Emphasis on a Naked Dinoflagellate Gymnodinium sp. at the Han River (Korea)

Department of Biotechnology, Sangmyung University, Seoul 03016, Korea
*
Author to whom correspondence should be addressed.
Submission received: 15 December 2020 / Revised: 25 January 2021 / Accepted: 3 February 2021 / Published: 10 February 2021
(This article belongs to the Section Microbial Diversity and Culture Collections)

Abstract

:
Biomonitoring of phytoplankton communities in freshwater ecosystems is imperative for efficient water quality management. In the present study, we present the seasonal diversity of phytoplankton from the non-reservoir area of the Han River (Korea), assessed using the 18S rRNA amplicon sequencing. Our results uncovered a considerably high eukaryotic diversity, which was predominantly represented by phytoplankton in all the seasons (38–63%). Of these, the diatoms, Cyclostephanos tholiformis, Stephanodiscus hantzschii, and Stephanodiscus sp., were frequently detected in spring and winter. Interestingly, for the first time in the Han River, we detected a large number of operational taxonomic unit (OTU) reads belonging to the naked dinoflagellate Gymnodinium sp., which dominated in autumn (15.8%) and was observed only in that season. Molecular cloning and quantitative real-time polymerase chain reaction (PCR) confirmed the presence of Gymnodinium sp. in the samples collected in 2012 and 2019. Moreover, a comparison of the present data with our previous data from a reservoir area (Paldang Dam) revealed similar patterns of phytoplankton communities. This molecular approach revealed a prospective toxic species that was not detected through microscopy. Collectively, resolving phytoplankton communities at a level relevant for water quality management will provide a valuable reference for future studies on phytoplankton for environmental monitoring.

Graphical Abstract

1. Introduction

Phytoplankton are photosynthetic microorganisms that are adapted to live and wander in the open surface waters of lakes, rivers, and oceans [1]. They include both prokaryotes (cyanobacteria) and a diverse array of eukaryotes (such as diatoms and dinoflagellates). In a balanced ecosystem, phytoplankton are the primary producers that provide food for a wide range of aquatic creatures [2]. In addition, they play a crucial role in the global cycle of carbon [1]. Phytoplankton communities are greatly affected by various environmental factors and pollutants. Thus, they can be used as bioindicators for monitoring the status of aquatic environments [3]. When nutrients such as nitrogen (N), phosphorus (P), and silicon (Si) are available in excess, phytoplankton can grow out of control, forming harmful algal blooms [2,4]. Therefore, these nutrients should be comanaged in the development of strategies to minimize blooms. Some algal species can produce toxins that have harmful effects on aquatic creatures, birds, mammals, and even humans. Therefore, continuous monitoring of phytoplankton is important for the control of toxic algal blooms, which affect the surrounding biodiversity and disrupt ecosystem functions [4].
In environmental surveys, phytoplankton are discriminated morphologically using a light microscope (LM) and scanning electron microscope (SEM). However, the structure and functions of phytoplankton communities are highly complex. Environmental conditions and biological interactions are significant factors in dynamically shaping these structures. It is difficult or impossible to estimate the diversity and structure of these communities using only morphological observations. Phytoplankton that are rare, unarmored, extremely small-sized, and/or similar-shaped are usually ignored [5,6]. For example, detection of the unarmored dinoflagellate taxa, such as Gymnodinium sp., Cochlodinium strangulatum, and Karlodinium veneficum, is difficult and problematic under microscopy, which is almost unavoidable [6,7,8].
For these reasons, various indirect methods, such as flow cytometry and molecular techniques, have been developed to discriminate phytoplankton [9,10,11]. Recently, the next-generation sequencing (NGS) approach has greatly expanded our understanding of phytoplankton diversity and function in aquatic environments. It allows high-resolution and rapid analysis of microbial and phytoplankton communities [12]. In addition, it facilitates the precise identification of rare, fragile, nano-, and pico-phytoplankton [6]. Therefore, compared to morphological analysis, NGS has revealed a greater number of identified phytoplankton taxa [6,13,14].
The Han River is the major river in South Korea, and more than 20 million people depend on this river as the primary source of water. Hence, the water quality of the river is of great concern to the citizens of Seoul. Phytoplankton distribution in the Han River has been studied over the decades [15,16,17]. To date, results from most of the studies based on microscopic observations have been inconsistent [16]. To the best of our knowledge, our previous study was the first molecular approach to study the phytoplankton communities in the Han River, Korea [14]. This study thoroughly assessed the molecular composition of phytoplankton. However, the information was limited because the study only investigated the reservoir area rather than the main river area, which represents a considerable knowledge gap. Therefore, considering the status of the river and its importance to the public, a comprehensive study on phytoplankton dynamics in the river is necessary.
The aim of the present study was to explore the seasonal diversity and community structure of phytoplankton communities in non-reservoir areas of the Han River using the 18S rRNA amplicon approach. We also aimed to compare our molecular data with those of microscopic observations. In addition, the present data were further compared with our previous data on the reservoir area (Paldang Dam) in the Han River [14]. This study can be used as a valuable reference for future studies on phytoplankton communities for environmental monitoring and management.

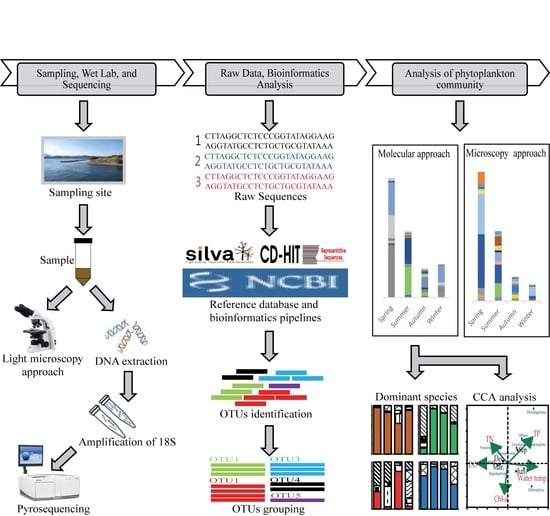
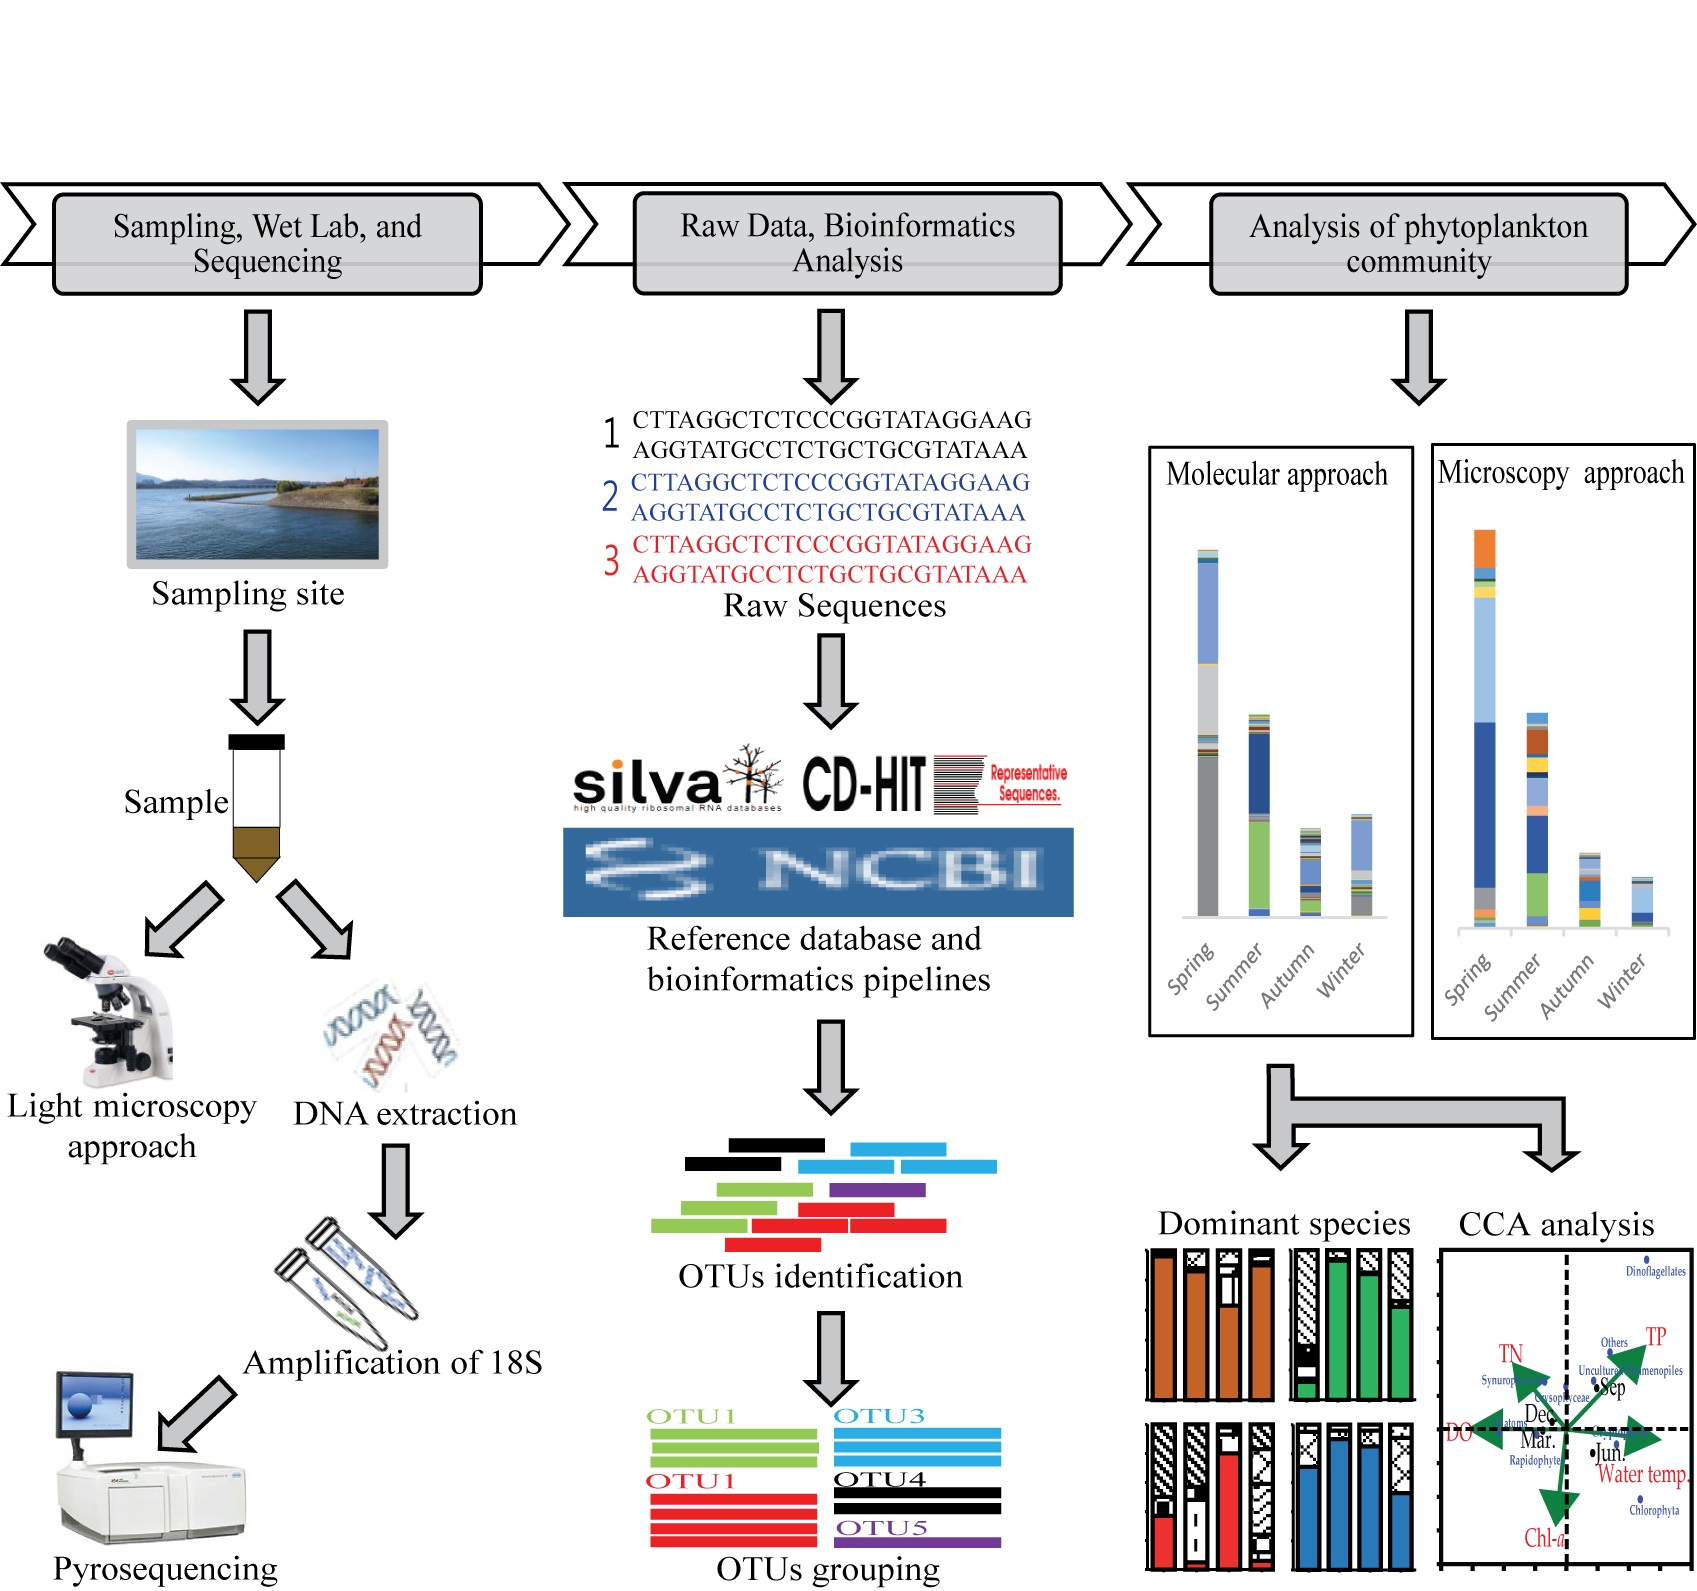
2. Materials and Methods

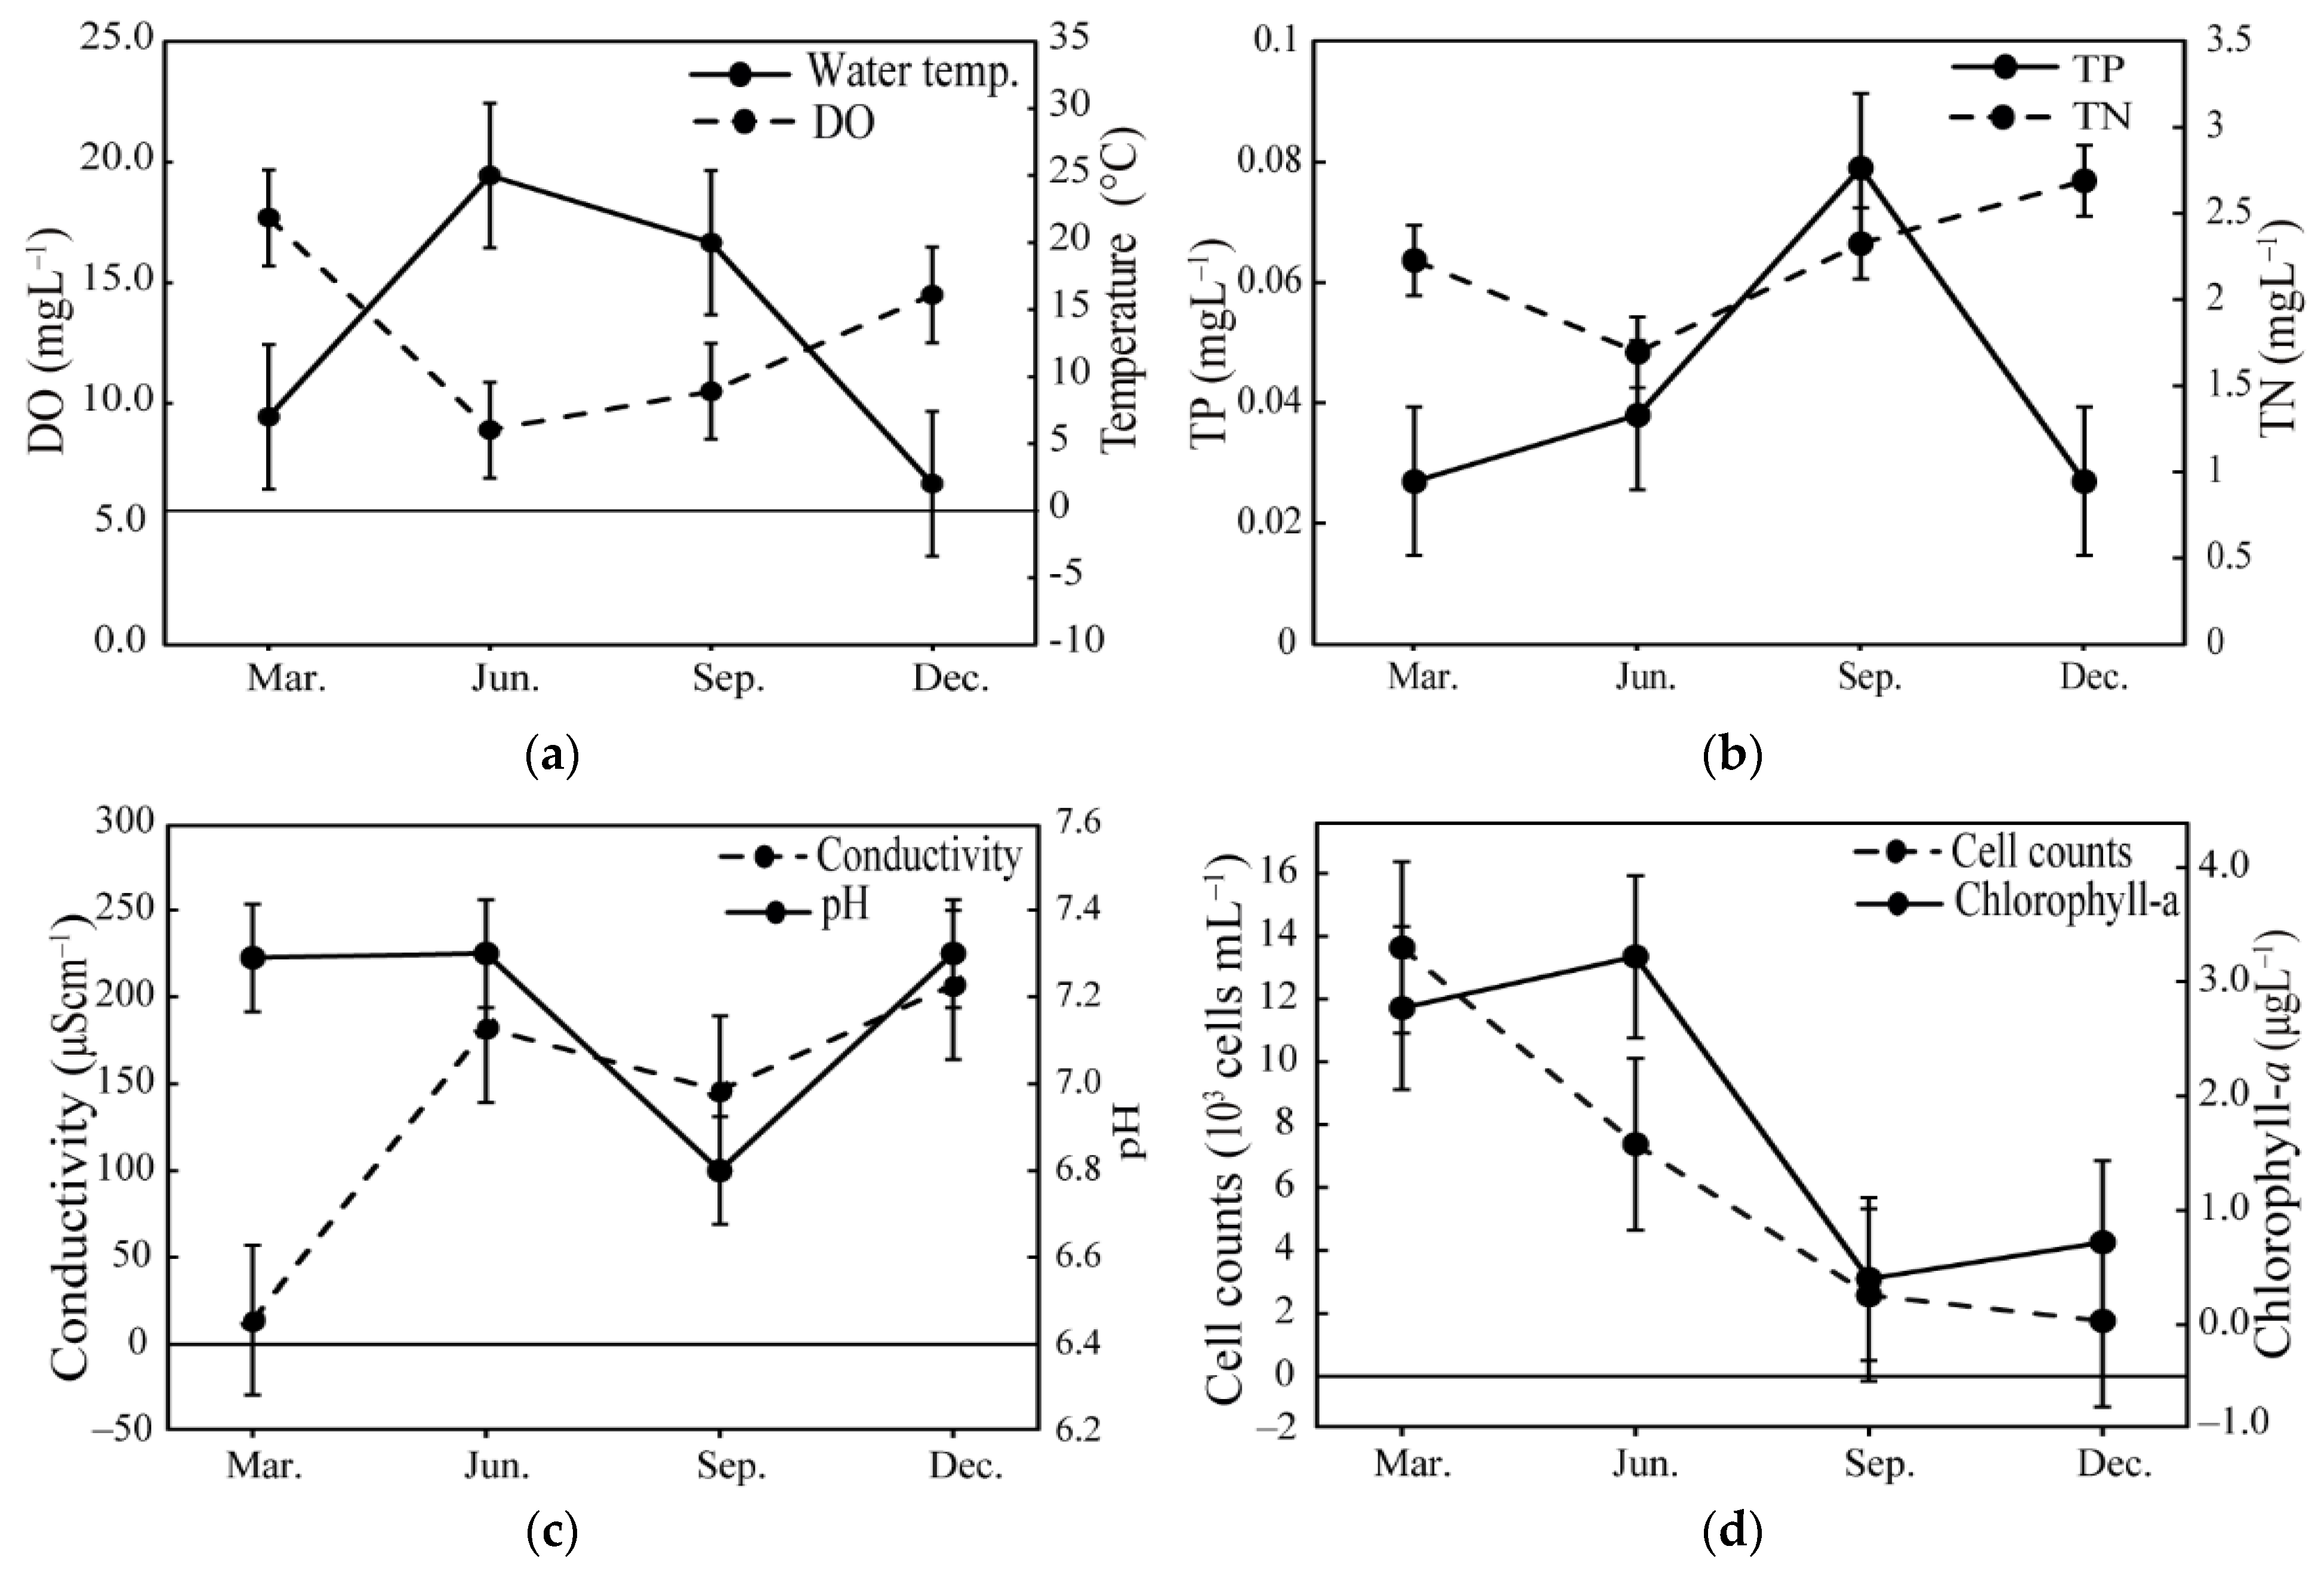
2.1. Water Sample Collections and Environmental Factors

Water samples were collected from the Cheong-Dam Bridge (GPS code: 37°31′34″ N 127°03′51″ E). The samples were collected at the surface from March to December 2012 using a 20 L bucket. The water samples (300 mL) were preserved with 1% Lugol’s solution (Sigma-Aldrich, St. Louis, MO, USA) and used for the cell identification and counting of phytoplankton, using a light microscope (Axioskop, Zeiss, Oberkochen, Germany). Phytoplankton cell counting was performed using a plankton-counting chamber (HMA-S6117, Matsunami Glass, Osaka, Japan). During sampling, water temperature, pH, dissolved oxygen (DO), and conductivity from the monitoring site of the Cheong-Dam Bridge of the Han River were measured with YSI 566 Multi Probe System (YSI Inc., Yellow Springs, OH, USA). In addition, for total genomic DNA (gDNA) extraction, samples were prepared as follows. First, a 100 μm-pore size mesh was used to remove large-sized organisms, such as zooplankton. In order to prevent clogging, a total of 500 mL of the pre-filtered freshwater was size-fractionated through a 10 μm membrane filter (Cat. No. TCTP04700, 47 mm diameter, Millipore, Billerica, MA, USA), followed by 2.0 μm (TTTP04700, 47 mm diameter, Millipore, Billerica, MA, USA) and 0.22 μm membrane filters (GVWP04700, 47 mm diameter, Millipore, Billerica, MA, USA). The membrane filters were put into microcentrifuge tube with 0.8 mL extraction buffer (100 mM Tris-HCl, 100 mM Na2-EDTA, 100 mM sodium phosphate, 1.5 M NaCl, and 1% CTAB) and were stored at −80 °C until DNA extraction.

2.2. Nutrient and Chlorophyll-a Measurement

We obtained total nitrogen (TN) and total phosphorus (TP) from the Han River Basin Environmental Office (http://www.me.go.kr/hg/web/main.do). Chlorophyll-a (Chl-a) levels were measured as described previously [18]. Briefly, a total of 200 mL water samples were filtered with a GF/F filter (Cat. No. 1825047, 47 mm diameter, Whatman, UK), and the filters were placed in 90% acetone overnight in the dark for pigments extraction. An aliquot of the supernatants was used to measure the concentration of Chl-a using a DU730 Life Science UV/Vis spectrophotometer (Beckman Coulter, Inc., Fullerton, CA, USA).

2.3. Genomic DNA Extraction

Total genomic DNA (gDNA) from the filtered samples was extracted using a modified previously described protocol [19]. Each membrane filter (10 μm, 2.0 μm, and 0.22 μm) was put in 2 mL microcentrifuge tube and was subjected to freeze-thaw cycles in liquid N2 and maintained in a 65 °C water bath. Subsequently, the tube was incubated at 37 °C for 30 min after 8 μL proteinase K (10 mg/mL in TE buffer) was added. Following incubation, 80 μL of 20% sodium dodecyl sulphate (SDS), prepared in double-distilled water (ddH2O) was added to the sample and incubated at 65 °C for 2 h. After incubation, the tube was shaken with equal volumes of chloroform-isoamyl alcohol (24:1) and centrifuged at 10,000× g for 5 min. The top phase of the mixture was transferred to a new microcentrifuge tube, to which 0.6 volume of isopropanol (≥99%) and 0.1 volume of 3 M sodium acetate (pH 5.1, prepared in ddH2O) were added. The microcentrifuge tube was again centrifuged at 14,000× g for 20 min. 1 mL cold 70% ethanol was added to the pellet after discarding the supernatant, and the sample was then centrifuged at 14,000× g for 15 min. The pellet was air-dried and re-suspended with 100 μL TE buffer (10 mM Tris-HCl, 1 mM EDTA; pH 8).

2.4. Amplicon PCR and Sequencing

Based on the methodology described by the authors of [20], the V1-V3 hypervariable region of the 18S rRNA gene was selected for amplicon analysis. The target rRNA retrieved from the environmental samples was amplified using polymerase chain reaction (PCR). PCR was performed using two universal eukaryotic primers, 18F23 (5′-ACCTGGTTGATCCTGCCAGTAG-3′) and 3NDf-R (5′-CTGGCACCAGACTTGCC-3′), the latter of which was designed as the complementary sequence to the universal primer 3NDf [14]. Each primer was tagged using multiplex identifier (MID) adaptors according to the manufacturer’s instructions (Roche, Mannheim, Germany), which allowed for the automatic sorting of the pyrosequencing-derived sequencing reads based on MID adaptors. In addition, MID-linked 18F23 and 3NDf-R were linked to the pyrosequencing primers 5′-CGTATCGCCTCCCTCGCGCCATCAG-3′ and 5′-CTATGCGCCTTGCCAGCCCGCTCAG-3′, respectively, according to the manufacturer’s instructions (Roche, Mannheim, Germany).
PCR reactions were performed in 20 μL reaction mixtures containing 2 μL of 10× Ex Taq buffer (TaKaRa, Kyoto, Japan), 2 μL of a dNTP mixture (4 mM), 1 μL of each primer (10 pM), 0.2 μL of Ex Taq polymerase (2.5 U), and 0.1 ng of the gDNA template. PCR cycling was performed in an iCycler (Bio-Rad, Hercules, CA, USA) at 94 °C for 5 min, followed by 35 cycles at 94 °C for 20 s, 52 °C for 40 s, and 72 °C for 1 min, and a final extension at 72 °C for 10 min. The resulting PCR products were electrophoresed on a 1.0% (w/v) agarose gel, stained with ethidium bromide, and viewed under ultraviolet trans-illumination.

2.5. Sequencing Read Processing, Data Cleaning, and Taxonomic Affiliation

All the amplicon sequencing reads obtained in this study were processed using the SILVA rRNA gene database project (SILVAngs 1.0; [21]). The pyrosequencing data were subjected to systematic checks to remove sequencing artifacts and low-quality reads based on our previous study [14]. In the initial quality check, low-quality reads and sequencing artifacts (i.e., reads with >1% ambiguity or 2% homopolymers) were discarded, and the remaining sequence data were then quality trimmed using the LUCY2 program [22]. Only high-quality sequence data with long reads (i.e., >350 bp) were used for further analysis. Subsequently, identical reads were identified (dereplication) and clustered at the operational taxonomic units (OTUs) on 99% similarity thresholds using the program Cd-hit-est (http://www.bioinformatics.org/cd-hit) [23]. To reduce the data size, only single reads with the longest DNA sequences were selected as unique sequence reads for OTU classification. However, a consensus sequence could also be used as a representative sequence instead of selecting the longest read. Finally, we constructed a dataset comprising different genotypic sequence reads.
For OTU classification, the unique sequence reads constructed here were subjected to BLAST searches against the GenBank database, identified, and assigned to their respective taxonomic groups. Sequence similarities of 98% with known species were considered to represent the identical species, those having from 95.0–97.9% similarity were considered to represent identical genera, and sequences with less than 95% similarity were regarded as unknown, while less than 93% were assigned to the meta-group ‘No Relative’ [14]. Each classified OTU reference read was mapped onto all reads that were assigned to the respective OTU, providing quantitative information about the classified OTU. The selected taxonomic reference sequences and OTU abundance of all the phytoplankton taxa are provided in Table S1. The thresholds stated herein were set based on 18S rRNA sequence comparisons with strains from different species and genera.

2.6. Diversity Analysis

The diversity estimator Chao-1, Shannon–Weaver diversity index (H′), and evenness were calculated using the Palaeontological Statistics Software Package (PAST) version 3.0 [24]. In addition, Good’s coverage was calculated in the SILVAngs pipeline [21]. Rarefaction curves and canonical correspondence analysis (CCA) were also calculated using PAST. The relative abundance of phytoplankton reads obtained from pyrosequencing analysis was used to calculate all the above indices. In addition, the environmental data were added for CCA analysis.

2.7. Molecular Cloning and Quantitative PCR (qPCR) Detection

To confirm the presence of the dinoflagellate Gymnodinium sp. detected in our sample, we performed gene cloning and subsequent quantitative PCR (qPCR) detection of the species. First, we determined the accurate and longer 18S rRNA sequences of the target Gymnodinium sp. from the autumn gDNA. They were amplified through PCR using the Gymnodinium sp.-specific primers (Gsp-F1; 5′-TGGCTCATTAAAACAGTTATCG-3′, Gsp-R2; 5′-GTAACCGAAGTT ACGCGTAC-3′), cloned using the TOPcloner TA kit (Enzynomics Co., Daejeon, Korea), and sequenced.
The 18S rRNA sequences of Gymnodinium sp. were compared with those collected from the NCBI database (Table S2) and used to design two qPCR primers (Gsp-18F1; 5′-GGTGGTTATTGATTACATGG-3′, Gsp-18R1; 5′-GTCAAGCGGAGCTTGCATTG-3′) intended to be specific to Gymnodinium sp. qPCR was performed using a CFX96 real-time PCR detection system (Bio-Rad, Hercules, CA, USA). The qPCR was conducted using triplicates of gDNAs of 2012 and 2019 from March to December. To create a standard curve, plasmid DNA containing the cloned Gymnodinium 18S rRNA gene was extracted from Escherichia coli cells. The plasmid DNA was diluted (1/103, 1/104, 1/105, 1/106, and 1/107) and triplicated. The no-template-controls, comprising double-distilled water (ddH2O), were also triplicated and applied to act as negative controls. A reaction mixture (20 μL) for each PCR run was prepared using the TOPreal qPCR 2× PreMIX (SYBR Green) Kit (Enzynomics, Daejeon, Korea). The cycle parameters were as follows: Preincubation for 4 min at 50 °C, initial denaturation for 15 min at 95 °C, followed by 39 cycles of 95 °C for 10 s, 63 °C for 15 s, and 72 °C for 15 s. Melting analysis (65–95 °C for 2 s) was performed after the amplification to generate a melting curve.

3. Results

3.1. Environmental and Biological Factors

DO levels exhibited seasonal variations and were found to be low in summer and autumn, but high in spring and winter (Figure 1a). Water temperature varied considerably within these months, ranging from 0–25 °C. The DO levels and water temperature were found to be inversely proportional to each other, that is, increased water temperature decreased the DO levels. TN and TP levels varied over the seasons (Figure 1b). In addition, the conductivity was found to be high in winter (207 µS cm−1) and very low in spring (14 µS cm−1) (Figure 1c). There were only a few changes in the pH over the seasons (pH = 7.3) except in autumn (pH = 6.8).
Total phytoplanktonic cell numbers were found to be high in spring and subsequently decreased until winter. Chl-a concentration varied over the seasons and was high in spring and summer and then decreased in autumn and winter (Figure 1d). The Chl-a levels seem to be congruent with phytoplankton cell numbers. For example, both Chl-a and phytoplankton cell counts were low in autumn and winter. However, in summer, the Chl-a level was higher than the total phytoplankton cell number.

3.2. Sequencing Characteristics and Diversity Indices

After the initial quality filtering step of the amplicon sequencing raw data, a total of 33,519 reads in spring, summer, autumn, and winter were generated and classified. However, 1595 reads (<350 bp) were rejected, and the remaining 31,924 reads were used for downstream analysis (Table 1). A total of 55.5%, or 17,825 reads, belonging to photosynthetic microeukaryotes were classified as phytoplankton, and insights into their composition and monthly dynamics were explored. The number of phytoplankton OTUs identified through pyrosequencing varied among the samples at 99% sequence similarity, with an average of 148 OTUs in each sample (range = 90–174). The rarefaction curve showed that most of the samples neared the plateau (Figure S1).
The Shannon-weaver diversity index (H′) was measured to characterize community diversity, which ranged from 2.11 (spring) to 3.99 (autumn). In addition, Evenness and Chao-1 analysis showed the highest value in autumn (Table 2). Good’s coverage estimator was used to assess the sampling completeness and was calculated by randomly selecting sequence reads from a given sample. Good’s coverage values ranged between 95.6% and 99.3%.

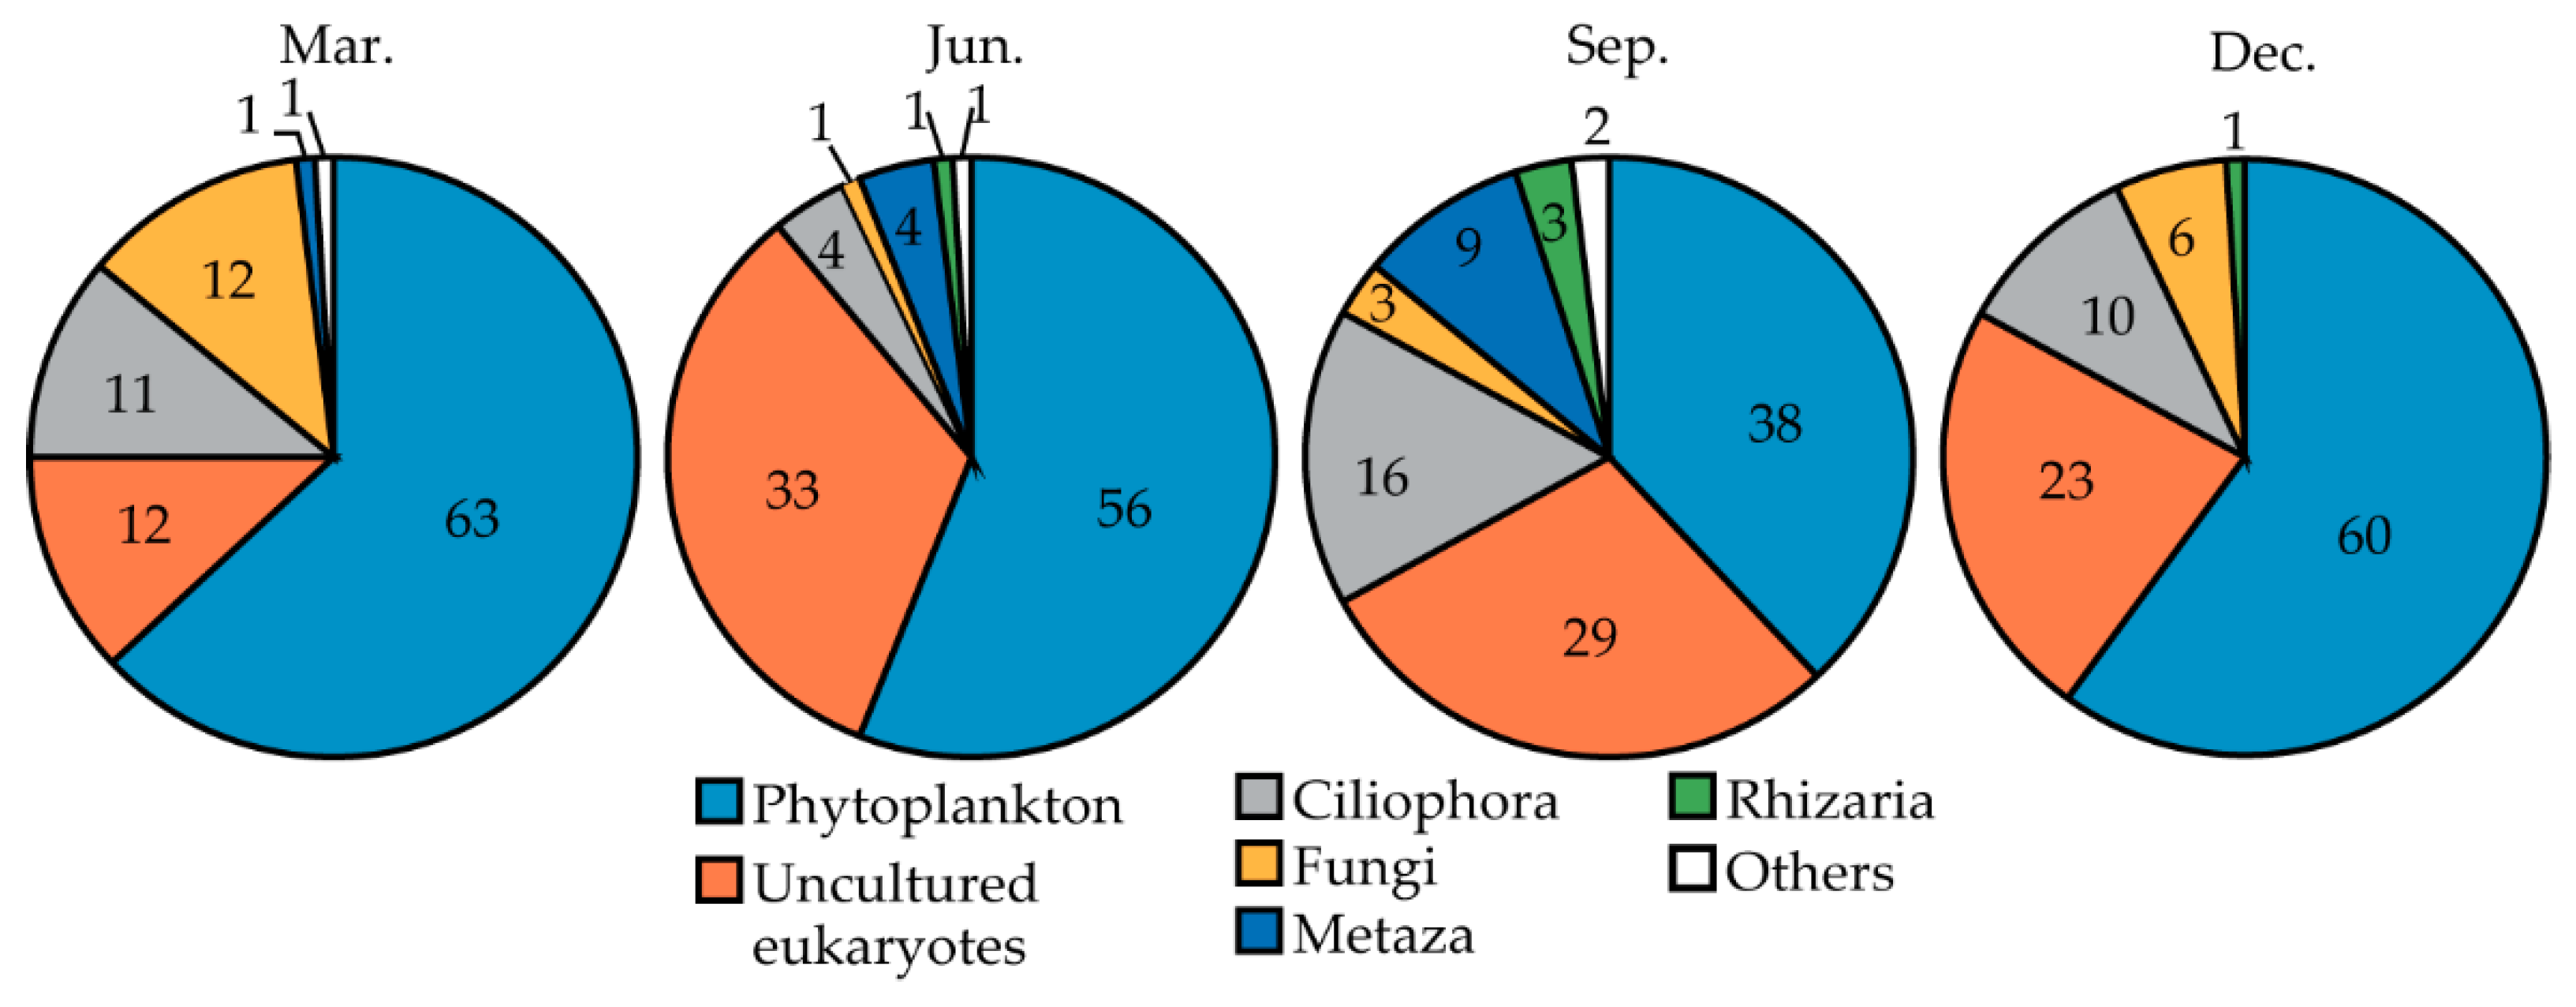
3.3. Taxonomic Composition of Microeukaryotes

The present amplicon sequencing results uncovered a considerably high eukaryotic diversity, which was represented by all known eukaryotic supergroups. Of the total classified sequences, 38–63% belonged to phytoplankton phylotypes, which were the predominant groups in all the seasons. Other major microeukaryotic groups observed were Ciliophora (11–16%), fungi (1–12%), Metazoa (0–9%), Rhizaria (~3%), and other groups with less than 1% abundance in all the seasons (Figure 2). In addition, uncultured sequences (unclassified sequences with less than 95% similarity) were found to be abundant in all the seasons, ranging from 12–33%. A BLAST search against the nr/nt databases further corroborates that uncultured sequences belong to a so-far uncharacterized group of microeukaryotes, at least by the 18S rRNA gene standards.

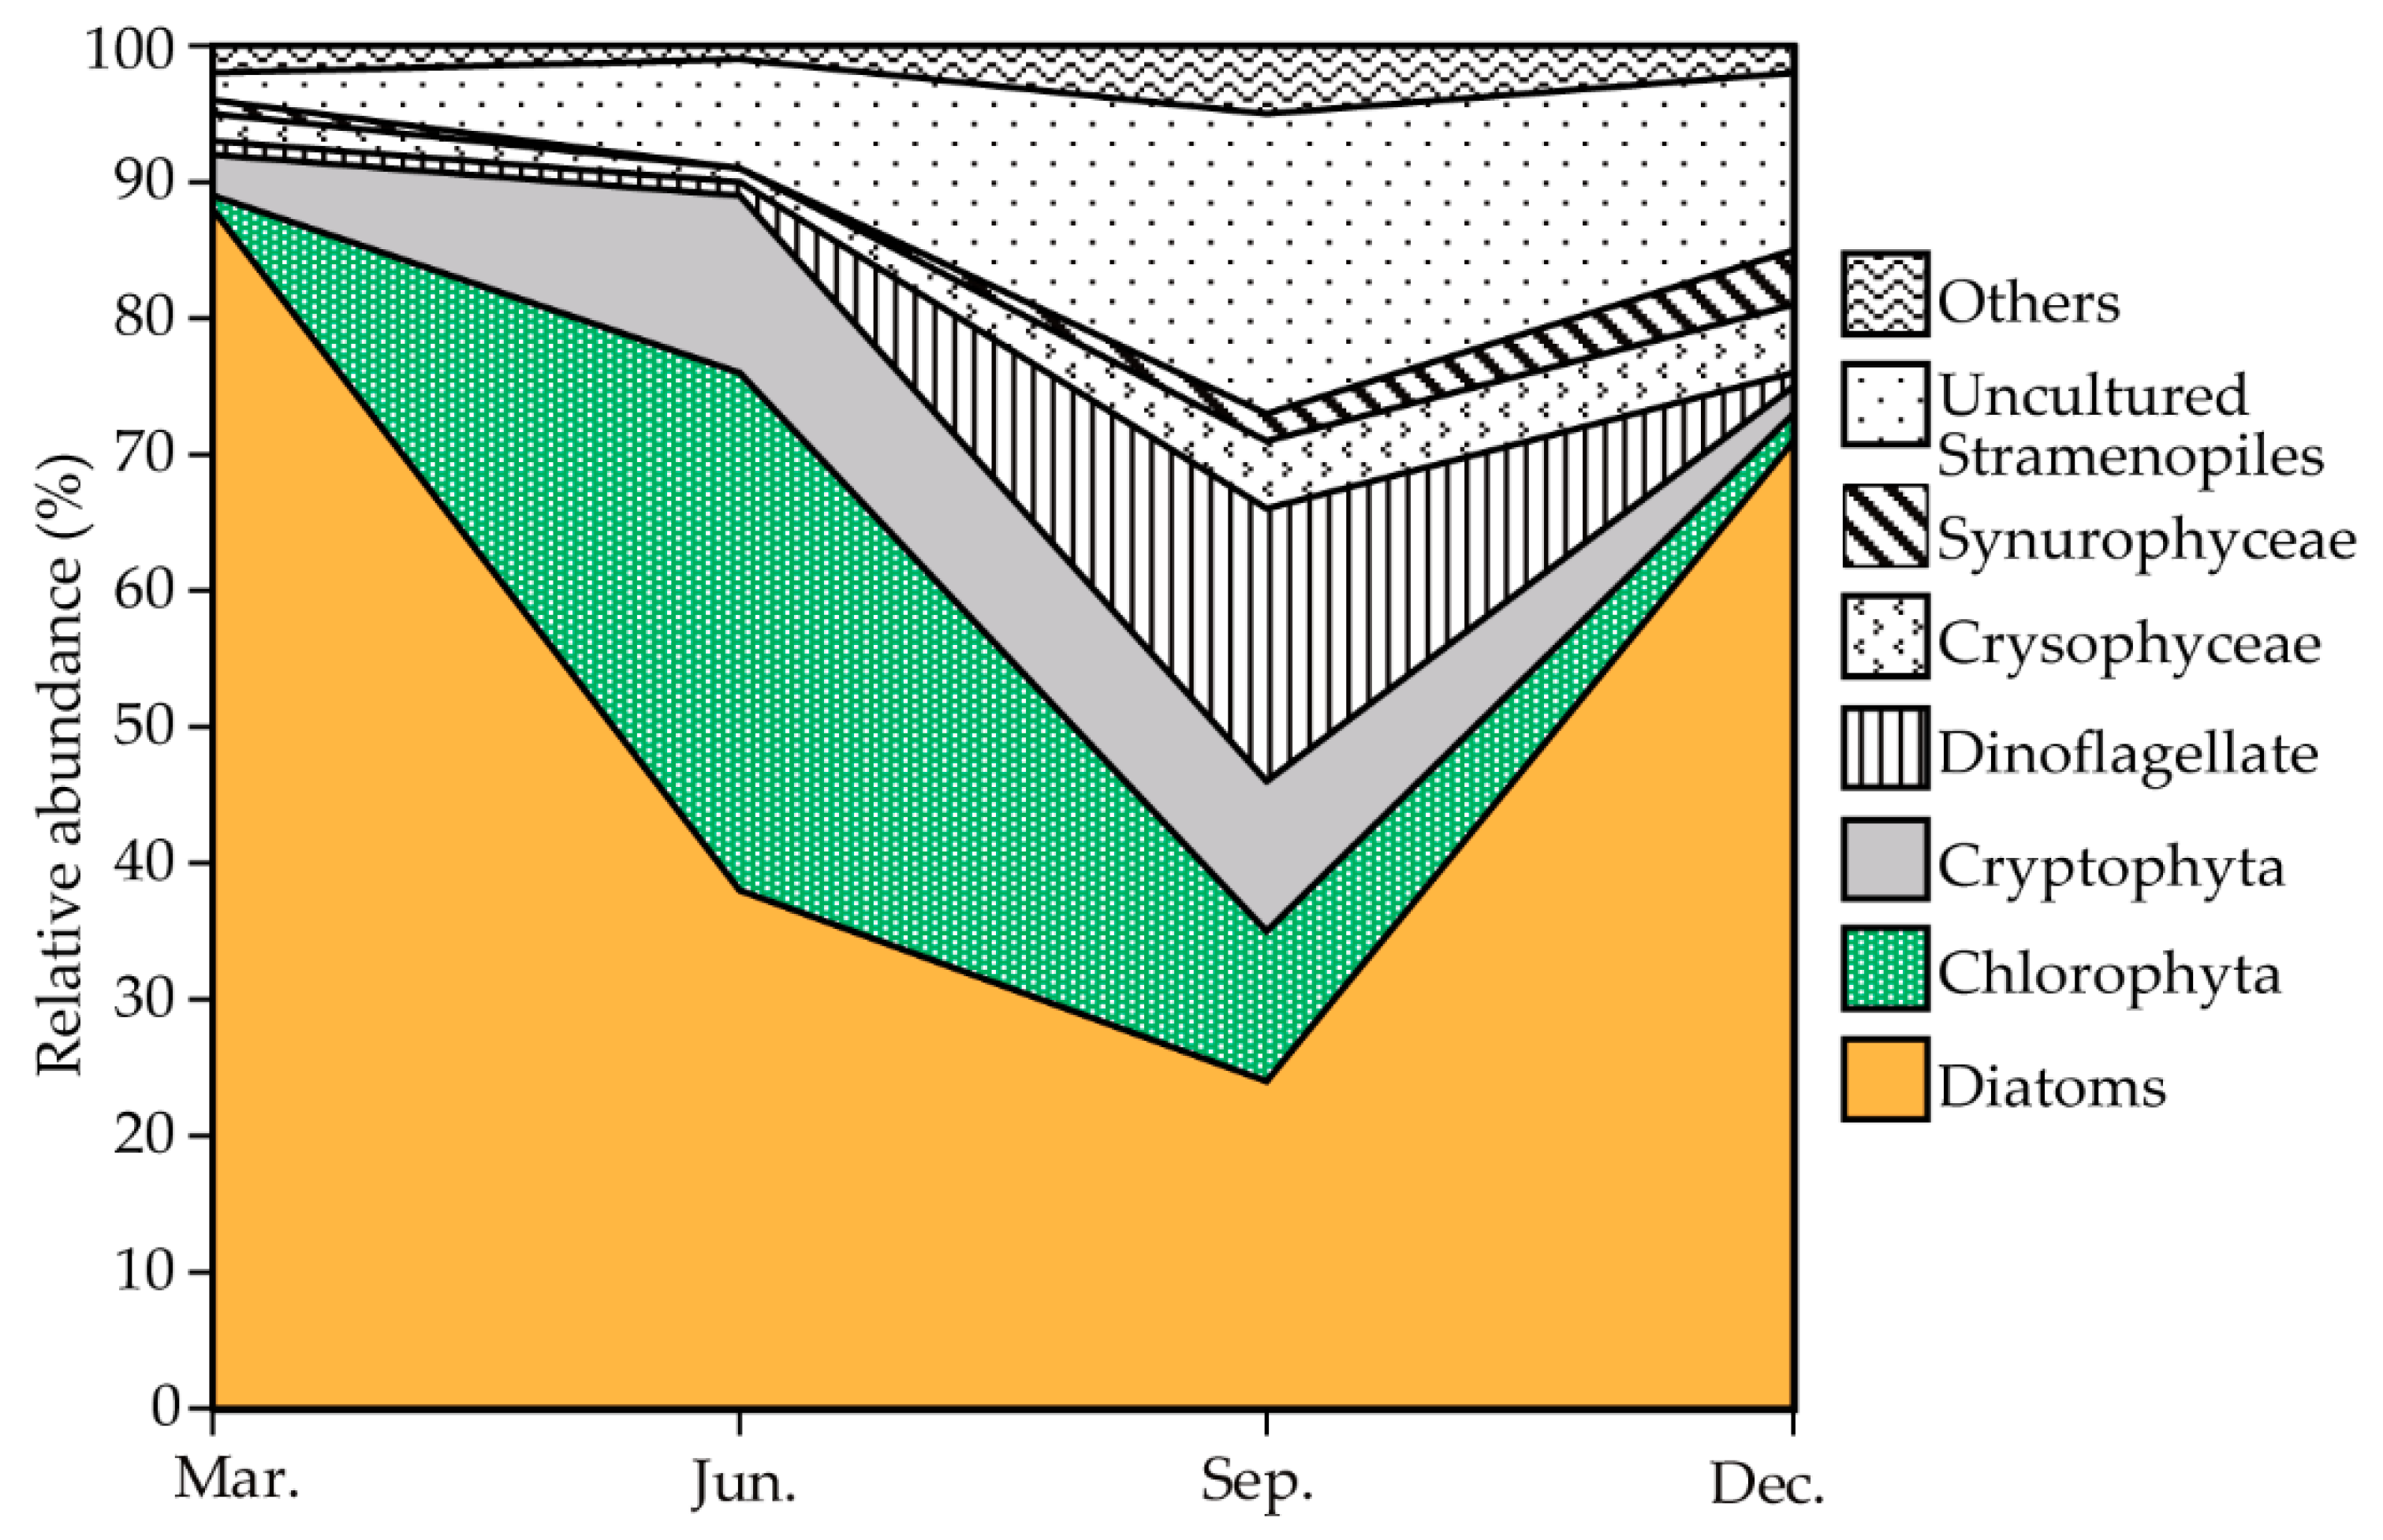
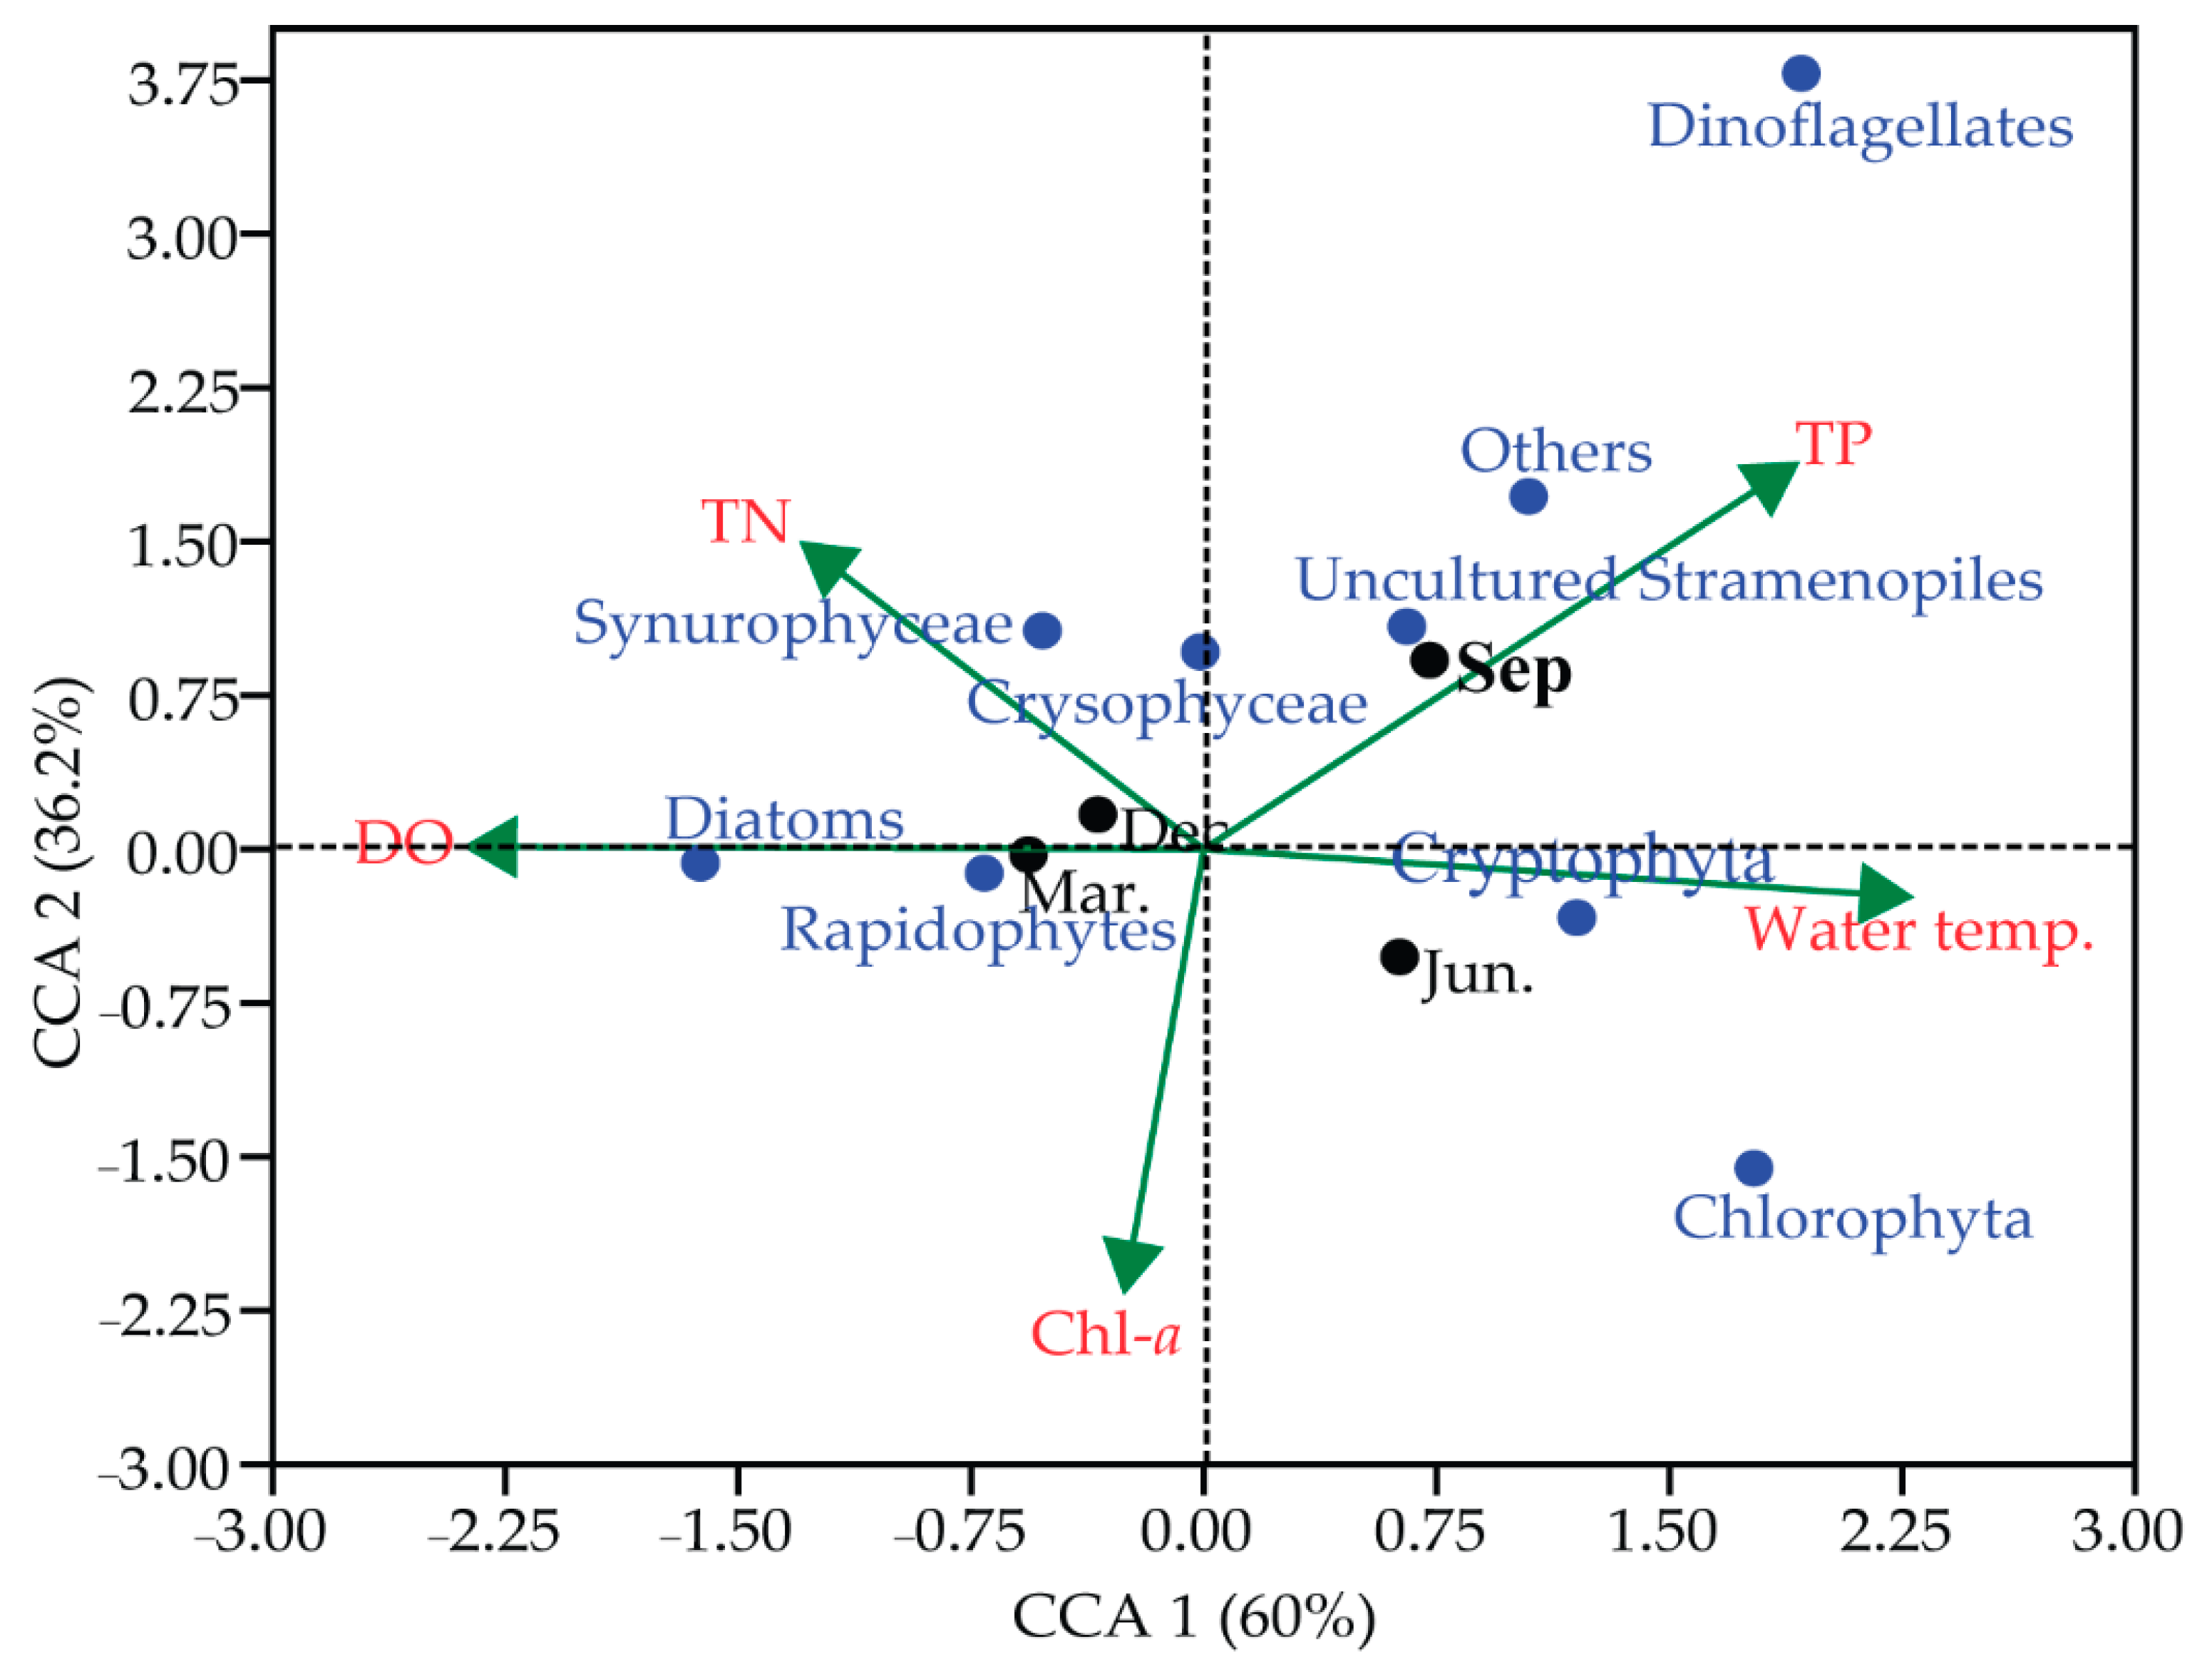
3.4. Seasonal Pattern and Community Composition of Phytoplankton

Overall, the phytoplankton community composition was mostly represented by diatoms in all seasons (24–88%). However, other major groups detected were Chlorophyta (1–38%), Cryptophyta (2–13%), Dinoflagellate (0–20%), Crysophyceae (1–5%), Synurophyceae (~4%), and other groups with less than 1% of the total phytoplankton read in all the seasons (Figure 3). In addition, unidentified sequences were frequently detected in all seasons, ranging from 2–22%. BLASTn searches showed that the unidentified sequences belong to uncultured stramenopiles.
The composition of phytoplankton varied among the seasons. The CCA plot analysis showed the relationship of the phytoplankton community structure with the seasonal samples and environmental variables (Figure 4). The diatom OTU reads were abundant in the spring and winter samples and correlated with DO. However, the dinoflagellates correlated with TP and were significantly high in autumn samples.
From the overall phytoplankton reads, >70% were attributed to diatoms, chlorophytes, cryptophytes, and dinoflagellates. Thus, these major groups were further explored in detail (Figure 5).
Diatoms. Among diatoms, the reads belonging to the phylum Coscinodiscophyceae were found to be highest in all the samples (63–96%) (Figure 5a). Stephanodiscus sp., Cyclotella sp., and Cyclostephanos tholiformis were the most frequently detected phylotypes among Coscinodiscophyceae. Fragilariophyceae (1–7%) were detected in all the samples, with Fragilaria sp. as the most frequent taxa. Among Bacillariophyceae (0–20%), Navicula sp. had the highest number of reads. In addition, Mediophyceae (1%) (Papiliocellulus elegans and Talaroneis posidoniae) was only detected in the spring samples.
Chlorophyta. Among chlorophytes, Chlorophyceae (12–93%), with Chlamydomonas sp. as the most frequent taxa, was found to be high in all the samples except in spring when uncultured green algae (64%) were dominant (Figure 5b). Other groups detected with fewer OTU reads among the green algae were Trebouxiophyceae, Ulvophyceae, and Prasinophyceae.
Dinoflagellate. In general, dinoflagellate reads were found to be less frequent in all the samples. However, in autumn, the number of OTU reads increased from 1% in summer to 20% in autumn. Uncultured dinoflagellates were high in spring (50%) (Figure 5c), and in summer, they were equally dominant with Peridiniales (43%). However, Gymnodiniales were the most frequent group observed in autumn (80%). Overall, Gymnodinium sp. (Gymnodiniales), Lepidodinium sp. (Gymnodiniales), and Peridiniopsis sp. (Peridiniales) were the dominant taxa in all the samples.
Cryptophyta. A large portion of uncultured cryptophyte sequences (53–90%) was detected frequently among the cryptophytes in all the samples (Figure 5d). Cryptomonadales (6–24%) and Pyrenomonadales (4–9%) were the only observed orders in all the classified sequences, with uncultured Cryptomonas sp. (Cryptomonadales) as the taxa with the highest number of reads (5–19%). Other taxa that occurred less frequently were Plagioselmis nannoplanctica, Guillardia theta, Goniomonas sp., and Chroomonas sp.

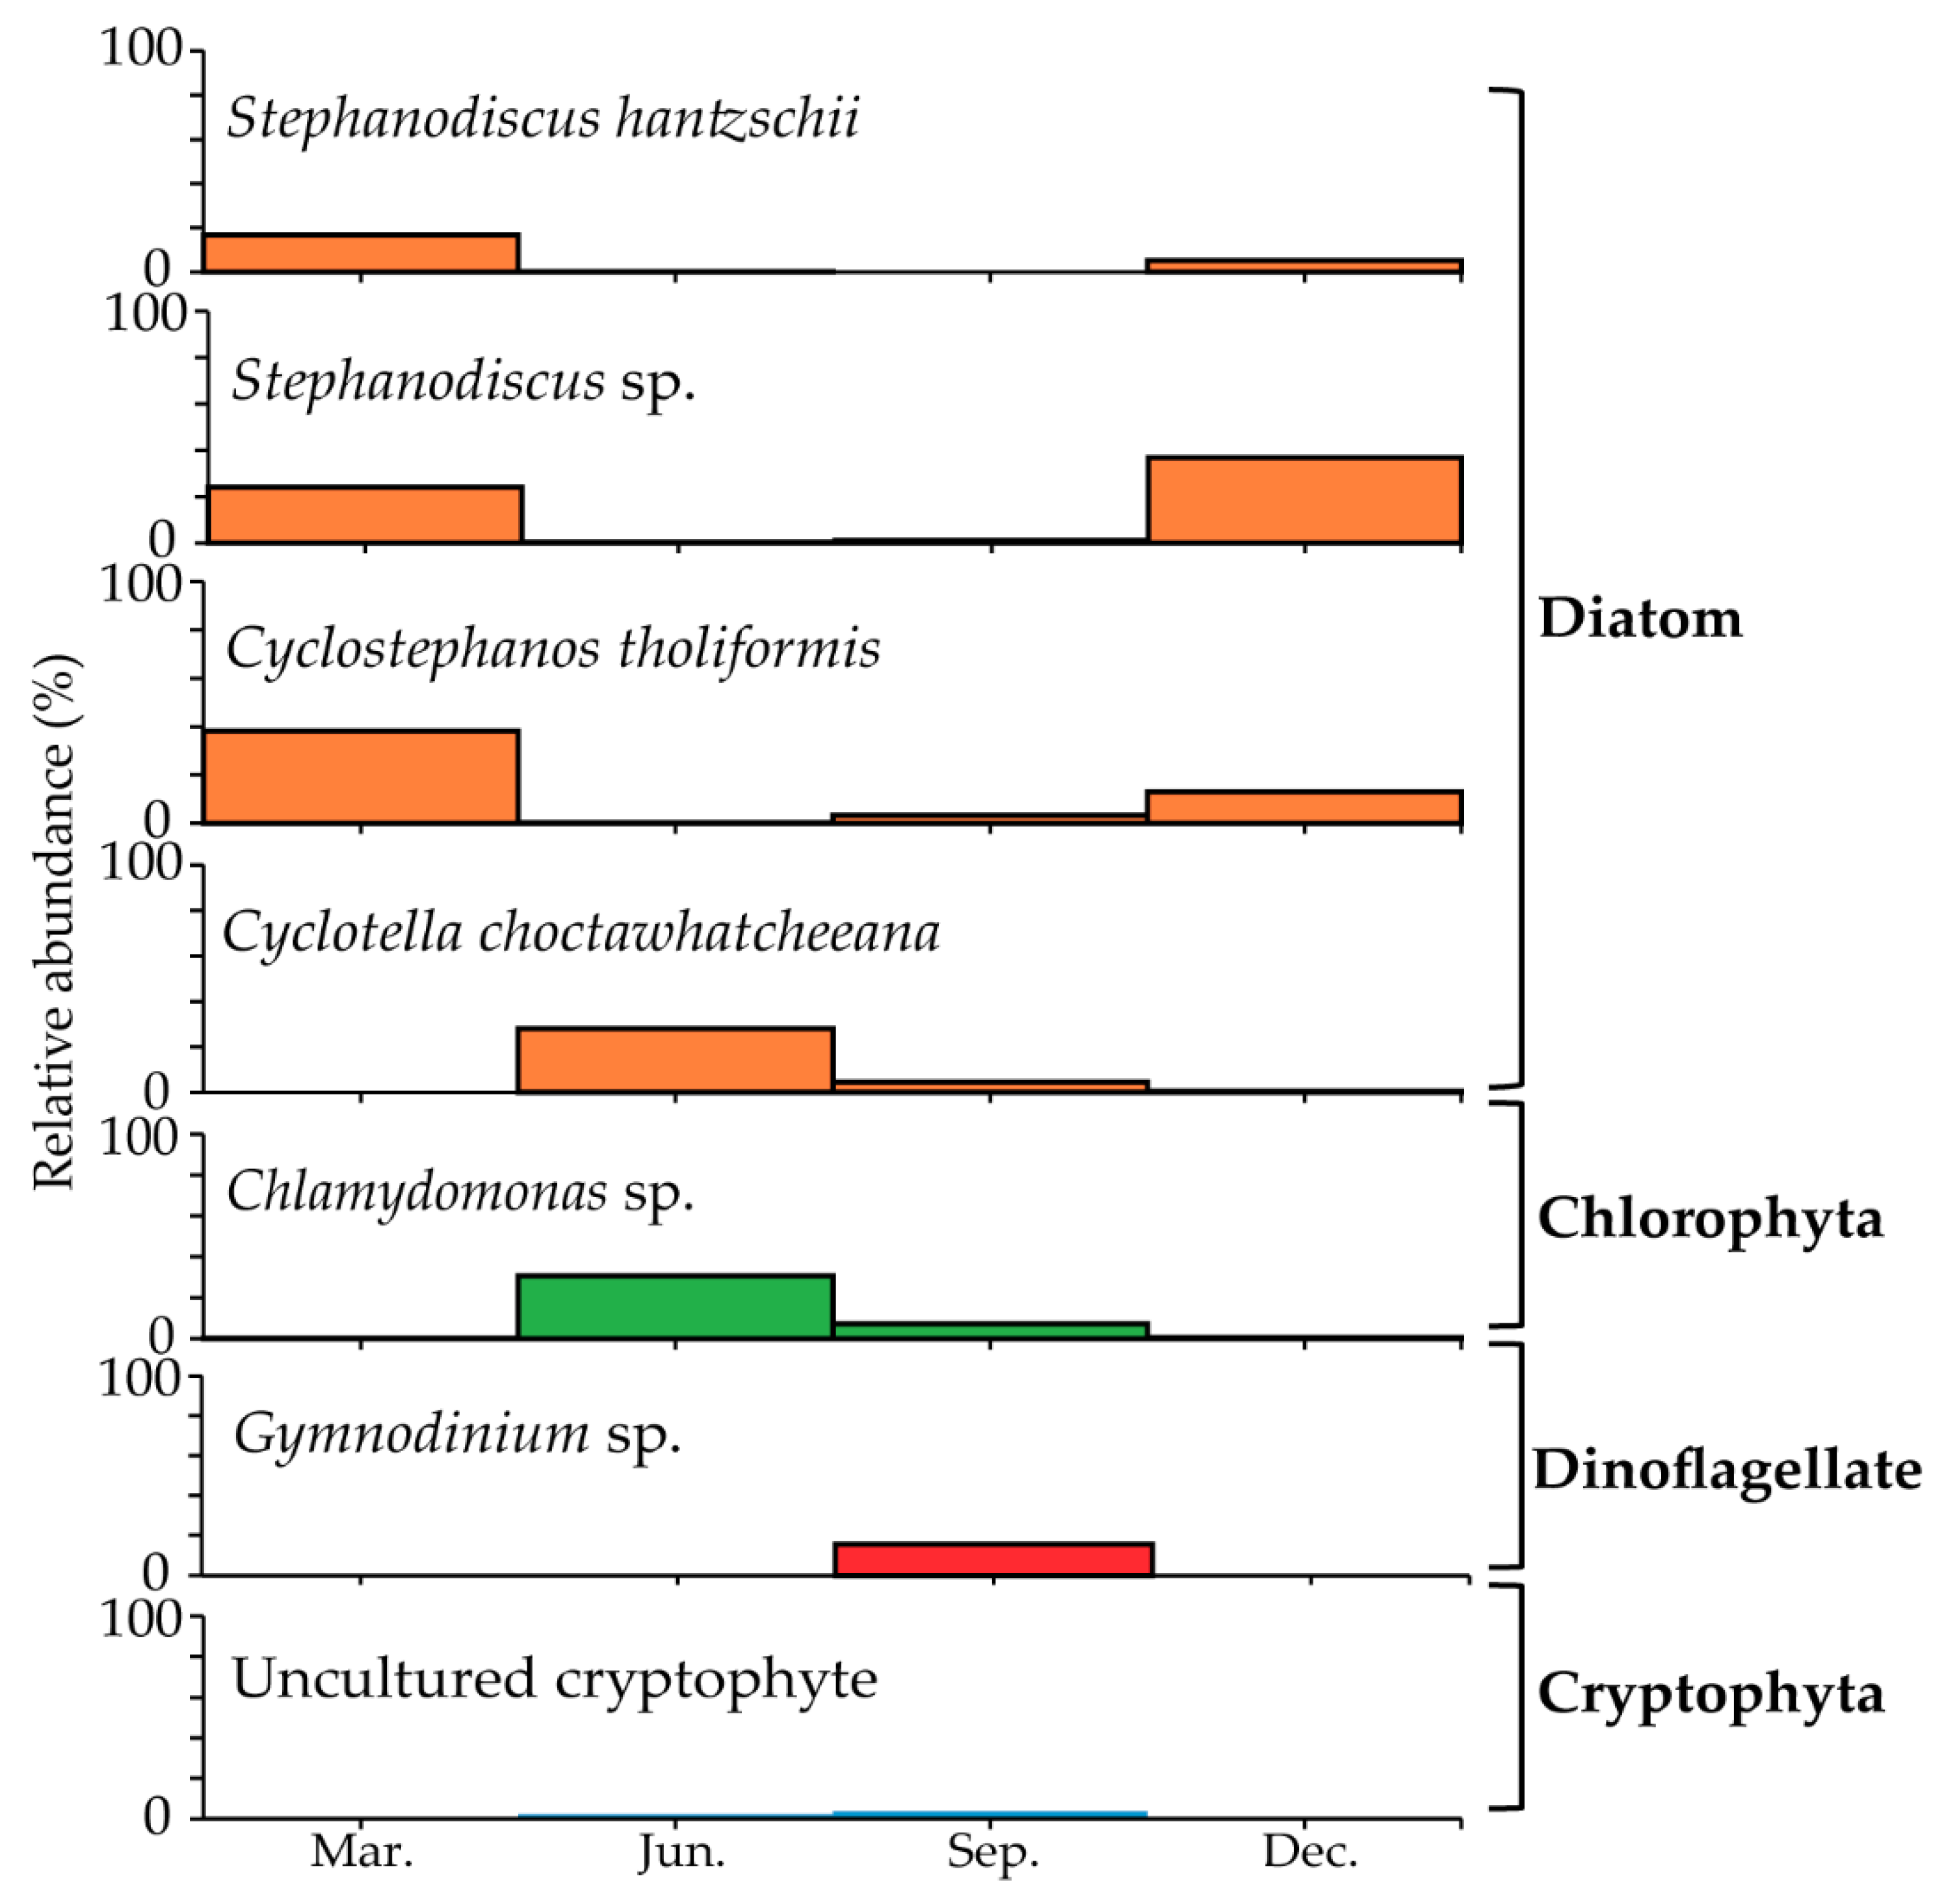
3.5. Seasonal Changes in the Dominant Species

Throughout the seasons, we identified seven taxa belonging to Diatoms, Chlorophyta, Dinoflagellate, and Cryptophyta, which had the highest number of OTU reads among phytoplankton. We examined their seasonal dynamics in detail (Figure 6). Diatom species, Cyclostephanos tholiformis, Stephanodiscus hantzschii, and Stephanodiscus sp., were the most frequently detected among the phytoplankton communities in spring and winter, with relatively low occurrence in summer and autumn. However, the diatom Cyclotella sp. and the chlorophyte Chlamydomonas sp. exhibited a similar pattern, in which they occurred frequently in summer with little or no occurrence in spring and winter. Interestingly, the naked dinoflagellate, Gymnodinum sp., dominated the phytoplankton community in autumn, with no occurrence in the rest of the seasons.

3.6. 18S rRNA Cloning and Molecular Detection of Gymnodinium sp.

The occurrence of Gymnondinium sp. in autumn samples was evaluated through molecular cloning and qPCR using monthly samples from 2012 and 2019. In the present study, we successfully obtained seven positive clones of the 18S rRNA gene (1237 bp) from the autumn samples of 2012 (Table S2). The BLASTn search of the NCBI GenBank database confirmed all the clones to be Gymnodinium sp. (AY829527) with 99.6% sequence similarity. In the qPCR analysis, Gymnodinium sp. was detected in the autumn and winter samples (September, October, November, and December). Additional analysis of 2019 samples confirmed the detection of this taxon. However, it was only detected in August and December samples (Table S3).

3.7. Comparison of Morphological and Molecular Analysis

In the present study, we compared our molecular taxonomic data with the microscopic data (Table S4). Upon comparison, we found that most of the dominant species (e.g., Stephanodiscus sp., Chlamydomonas sp., Cryptomonas sp., Cyclotella sp., and Fragilaria sp.) detected through microscopy were also detected through molecular analysis. Exceptionally, few species detected through microscopy, such as Actinastrum sp., are listed as the top three dominant species in summer, whereas they were not detected in any of the seasons through molecular analysis (Table 3). Similarly, Gymnonidinum sp. was detected through molecular analysis to be the dominant species in autumn but was not observed in the microscopic analysis.

4. Discussion

The occurrence of phytoplankton is influenced by many environmental factors, such as light, temperature, pH, and nutrients [25]. Although the factors regulating phytoplankton life cycle transitions (e.g., cyst to vegetative cell transitions) are uncertain and poorly understood [26], there is a well-established relationship between environmental variables and the taxonomic composition of phytoplankton [26,27]. In the present study, the physicochemical parameters measured, especially temperature, seem to be correlated with phytoplankton abundance. A previous study [16] reported that the dynamics of Stephanodiscus hantzchii in the lower Han River appear to be primarily affected by changes in water temperature. This suggests that seasonal temperature changes could be an important factor in determining the dominant species, as reported previously [27].
For biological factors, Chl-a has been widely used as an indicator of phytoplankton biomass [28]. Overall, Chl-a levels seem to be synchronous with phytoplankton biomass. However, the negative correlation observed in summer is, to a certain extent, expected because abundance and Chl-a are two different phytoplankton metrics. Chl-a only represents a small fraction of the biomass, and both biomass and Chl-a may show different patterns during blooms [29,30].
Our amplicon sequencing approach generated reads that uncovered a considerably high eukaryotic seasonal diversity. More than half of the total classified sequences belonged to phytoplankton. This indicates the dominance of phytoplankton over other microeukaryotic communities and supports the suggestion of the continuous use of phytoplankton as an indicator of water quality [14,28,31]. Rarefaction curves showed that our sampling efforts might be sufficient to show the phytoplankton diversity present in the samples. It is not known with certainty exactly how many reads per sample would be needed for the estimation of community composition and diversity among samples. In addition, for NGS-based methods, the importance of sampling depth when describing a microbial community is not a problem but is relevant for microscopy-based methods [13]. However, high sequencing depth is recommended to detect the major patterns of variation among microbial communities [13,32]. Therefore, in future studies, increasing sampling efforts may provide a deeper insight into the communities.
In the present study, we were able to explore phytoplankton diversity in a temperate freshwater river using an amplicon-sequencing approach, and we extensively analyzed the seasonal variations of the most frequent phytoplankton taxa. We found that the species Cyclostephanos tholiformis, Stephanodiscus hantzschii, and Stephanodiscus sp. bloom during spring and winter periods. This is similar to our previous study in the reservoir area [14]. Stephanodiscus sp. is a genus that is a well-known bloom-forming diatom in Korean rivers during winter [16,33], and the bloom density in Korean rivers is much higher than that in other rivers worldwide [34]. In contrast, Chlamydomonas sp. and Cyclotella sp. dominated during summer, which may have been due to the decline in the Stephanodiscus sp. bloom during warmer periods.
Interestingly, Gymnodinium sp. recorded the highest number of OTU reads among phytoplankton in the autumn sample, while it was not recorded in the rest of the seasons. Previously, there was no record of this taxon in the Han River. However, unclassified species of Gymnodiniphycidae were recorded in the reservoir area [14]. Both our molecular cloning and qPCR analyses confirmed and validated the occurrence of this taxon in the river. Gymnodinium sp. is a large and slow-growing dinoflagellate that can cause red tides at high concentrations [35]. In the present study, Gymnodinium sp. exhibited an “opportunistic” behavior, as described previously [36], which dominated only when other algal groups were at a minimum concentration. This showed that a minor and undetected member of the community could become a major or even dominant part of it and bring complex changes in the community composition. Some Gymnodinium species are toxic [37] and have previously been reported in Korea [38,39]. However, Gymnodinium sp. bloom has not been previously recorded in the Han River. Therefore, the abundance of this genus in the present study may indicate a significant ecological effect on the river. This poses a potential threat to other species, including human health. Therefore, further tracking of the frequency and intensity of toxic algal species through frequent monitoring is imperative, which seems feasible using NGS-based approaches.
The molecular approach via NGS has become a standard approach in phytoplankton research, opening a new window into their systematic evolution [40] and representing a promising tool for continuous monitoring of freshwater phytoplankton. However, current sequence databases are limited to phytoplankton of marine origin [13]. Therefore, it is imperative to expand the sequence databases with cultured and characterized freshwater phytoplankton for comparing environmental samples. In addition, we suggest the use of alternative marker genes, such as functional genes, in metagenomic studies, which are based on selected functional aspects of organisms and may achieve greater resolution than ribosomal RNA genes [5].
In the present study, we were able to describe phytoplankton communities using microscopic observations and molecular approaches. Both methods clearly revealed seasonal variations in phytoplankton community composition. The results from the two methods are incongruent. However, it is encouraging that seasonal patterns revealed through molecular methods resemble well-described patterns from microscopy-based observations. In both methods, Stepahanodiscus sp. dominated the spring and winter samples. However, certain taxa were underrepresented in the microscopic observations. For example, the naked dinoflagellate Gymnodinium sp. was not observed using microscopic methods but was revealed by our molecular approaches. Usually, the morphological identification of unarmored taxa under fixatives (Lugol’s solution) is difficult and problematic because of their delicate forms [7]. Several previous studies have shown an incompatible diversity pattern associated with phytoplankton identification based on microscopic and molecular methods [6,7,8,41]. [13] It has already been reported that discrepancies exist between the two types of methods because of some issues associated with both methods. For example, in microscopy, differentiation of nano- and picophytoplankton based on morphological features is almost impossible [5]. Similarly, there are certain challenges, such as the lack of adequate reference sequences in public databases, and biases introduced during bioinformatic treatments of the NGS data, for example, OTU clustering, chimera detection, and taxonomic assignment, associated with the NGS-based methods [42]. Therefore, both microscopic and molecular methods can be used together to resolve issues related to phytoplankton diversity.
By comparing our present data on the river area with those of our previous study on the reservoir area of the Han River [14], we found that similar patterns were observed in the environmental factors as well as phytoplankton composition. In both areas, Stephanodiscus sp. was the dominant taxa in spring and winter. However, there were some differences in the composition of dominant phytoplankton, especially within dinoflagellates. Peridiniopsis sp. bloomed in the late summer in the reservoir area, whereas Gymnodinium sp. bloom was detected in the river area. Both taxa were recorded in the respective studies. In the reservoir area, studies have shown that, in addition to the usual environmental factors, water stability and retention time are among the important factors influencing phytoplankton composition [43]. In the river area, the water flow regime is a great contributor to phytoplankton composition [44]. However, these factors were not measured in these studies. Therefore, further studies are needed to investigate the physical and chemical factors influencing phytoplankton community composition in the temperate region.

5. Conclusions

In the present study, we revealed the seasonal diversity of phytoplankton from the main river area of the Han River using 18S rRNA amplicon sequencing. This study detected a high number of species and could differentiate similar phytoplankton species more accurately as compared to those with microscopic examinations. Particularly, our molecular approach detected a dinoflagellate Gymnodinium sp. that dominated the phytoplankton community in autumn for the first time. The abundance of this genus may have a significant ecological effect on the river. Therefore, further tracking of the frequency and intensity of potentially toxic algal species by frequent monitoring is imperative, which seems feasible using NGS-based approaches. Molecular data from the current study provide a valuable reference for future studies on phytoplankton communities for proper water quality management.

Supplementary Materials

The following are available online at https://0-www-mdpi-com.brum.beds.ac.uk/1424-2818/13/2/73/s1, Figure S1: Rarefaction curves representing the numbers of Operational Taxonomic Units (OTUs) of the phytoplankton v. the number of tags sampled from molecular data, Table S1: Relative abundance of phytoplankton OTUs recovered by amplicon sequencing, Table S2: List of taxa used to design qPCR primer for 18S rRNA gene, Table S3: Gymnodinium sp. qPCR Assays. (+, target sequence detected; −, target sequence not detected), Table S4: List of phytoplankton taxa and their cell counts (cells/mL) identified by microscopy.

Author Contributions

Conceptualization, Supervision, J.-S.K.; Analysis, writing and editing, B.L.M.; real-time PCR experiment, T.K.; writing—review and editing, J.-S.K. All authors have read and agreed to the published version of the manuscript.

Funding

This work was supported by the National Research Foundation of Korea Grant funded by the Korean Government (2016R1D1A1A09920198 and 2020R1A2C2013373).

Institutional Review Board Statement

Not applicable.

Informed Consent Statement

Not applicable.

Data Availability Statement

The data presented in this study are available in Supplementary Materials Table S1.

Acknowledgments

We thank Lee for the field sampling and S. Abassi for English editing and critical comments on the early version of the manuscript.

Conflicts of Interest

The authors declare no conflict of interest.

References

  1. Graham, L.E.; Graham, J.M.; Lee, W.W. Algae, 2nd ed.; Benjamin Cummings: San Francisco, CA, USA, 2009. [Google Scholar]
  2. What Are Phytoplankton? Available online: https://oceanservice.noaa.gov/facts/phyto.html (accessed on 2 June 2020).
  3. Rakocevic-Nedovic, J.; Hollert, H. Phytoplankton community and chlorophyll a as trophic state indices of Lake Skadar (Montenegro, Balkan). Environ. Sci. Pollut. Res. 2005, 12, 146–152. [Google Scholar] [CrossRef]
  4. Anderson, D.; Glibert, P.; Burkholder, J. Harmful algal blooms and eutrophication: Nutrient sources, composition, and consequences. Estuaries 2002, 25, 704–726. [Google Scholar] [CrossRef]
  5. Imhoff, J.F. New dimensions in microbial ecology—Functional genes in studies to unravel the biodiversity and role of functional microbial groups in the environment. Microorganisms 2016, 4, 19. [Google Scholar] [CrossRef]
  6. Huo, S.; Li, X.; Xi, B.; Zhang, H.; Ma, C.; He, Z. Combining morphological and metabarcoding approaches reveals the freshwater eukaryotic phytoplankton community. Environ. Sci. Eur. 2020, 32, 1–14. [Google Scholar] [CrossRef] [Green Version]
  7. Siano, R.; Kooistra, W.H.; Montresor, M.; Zingone, A. Unarmoured and thin-walled dinoflagellates from the Gulf of Naples, with the description of Woloszynskia cincta sp. nov. (Dinophyceae, Suessiales). Phycologia 2009, 48, 44–65. [Google Scholar] [CrossRef]
  8. Gómez, F.; Richlen, M.L.; Anderson, D.M. Molecular characterization and morphology of Cochlodinium strangulatum, the type species of Cochlodinium, and Margalefidinium gen. nov. for C. polykrikoides and allied species (Gymnodiniales, Dinophyceae). Harmful Algae 2017, 63, 32–44. [Google Scholar] [CrossRef] [PubMed]
  9. Ebenezer, V.; Medlin, L.K.; Ki, J.S. Molecular detection, quantification, and diversity evaluation of microalgae. Mar. Biotech. 2012, 14, 129–142. [Google Scholar] [CrossRef]
  10. Sun, F.; Pei, H.Y.; Hu, W.R.; Song, M.M. A multi-technique approach for the quantification of Microcystis aeruginosa FACHB-905 biomass during high algae-laden periods. Environ. Technol. 2012, 33, 1773–1779. [Google Scholar] [CrossRef]
  11. Rohrlack, T.; Edvardsen, B.; Skulberg, R.; Halstvedt, C.B.; Tkilen, H.C. Oligopeptide chemotypes of the toxic freshwater cyanobacterium Planktothrix can form subpopulations with dissimilar ecological traits. Limnol. Oceanogr. 2008, 53, 1279–1293. [Google Scholar] [CrossRef]
  12. Shang, L.; Hu, Z.; Deng, Y.; Liu, Y.; Zhai, X.; Chai, Z.; Liu, X.; Zhan, Z.; Dobbs, F.C.; Tang, Y.Z. Metagenomic sequencing identifies highly diverse assemblages of dinoflagellate cysts in sediments from ships’ ballast tanks. Microorganisms 2019, 7, 250. [Google Scholar] [CrossRef] [Green Version]
  13. Eiler, A.; Drakare, S.; Bertilsson, S.; Pernthaler, J.; Peura, S.; Rofner, C.; Simek, K.; Yang, Y.; Znachor, P.; Lindstrãm, E.S.; et al. Unveiling distribution patterns of freshwater phytoplankton by a next generation sequencing based approach. PLoS ONE 2013, 8, e53516. [Google Scholar] [CrossRef]
  14. Boopathi, T.; Ki, J.S. Unresolved diversity and monthly dynamics of eukaryotic phytoplankton in a temperate freshwater reservoir explored by pyrosequencing. Mar. Freshw. Res. 2016, 67, 1680–1691. [Google Scholar] [CrossRef]
  15. Jeong, S.W.; Lee, J.H.; Yu, J.S. Environmental studies of the lower part of the Han River V. Blooming characteristics of phytoplankton communities. Algae 2003, 18, 255–262. [Google Scholar] [CrossRef]
  16. Jung, S.W.; Kwon, O.Y.; Lee, J.H.; Han, M.S. Effects of water temperature and silicate on the winter blooming diatom Stephanodiscus hantzschii (Bacillariophyceae) growing in eutrophic conditions in the lower Han River, South Korea. J. Freshw. Ecol. 2009, 24, 219–226. [Google Scholar] [CrossRef] [Green Version]
  17. Jung, S.W.; Kwon, O.Y.; Yun, S.M.; Joo, H.M.; Kang, J.-H.; Lee, J.H. Impacts of dam discharge on river environments and phytoplankton communities in a regulated river system, the lower Han River of South Korea. J. Ecol. Environ. 2014, 37, 1–11. [Google Scholar] [CrossRef] [Green Version]
  18. Parsons, T.R.; Maita, Y.; Lalli, C.M.I. A Manual of Chemical and Biological Methods for Seawater Analysis; Pergamon Press: Oxford, UK, 1984. [Google Scholar]
  19. Faria, D.; Lee, M.-D.; Lee, J.-B.; Lee, J.; Chang, M.; Youn, S.; Suh, Y.; Ki, J.-S. Molecular diversity of phytoplankton in the East China Sea around Jeju Island (Korea), unraveled by pyrosequencing. J. Oceanogr. 2014, 70, 11–23. [Google Scholar] [CrossRef]
  20. Ki, J.S. Hypervariable regions (V1–V9) of the dinoflagellate 18S rRNA using a large dataset for marker considerations. J. Appl. Phycol. 2012, 24, 1035–1043. [Google Scholar] [CrossRef]
  21. Quast, C.; Pruesse, E.; Yilmaz, P.; Gerken, J.; Schweer, T.; Yarza, P.; Peplies, J.; Glockner, F.O. The SILVA ribosomal RNA gene database project: Improved data processing and web-based tools. Nucleic Acids Res. 2013, 41, D590–D596. [Google Scholar] [CrossRef]
  22. Li, S.; Chou, H.H. LUCY2: An interactive DNA sequence quality trimming and vector removal tool. Bioinformatics 2004, 20, 2865–2866. [Google Scholar] [CrossRef] [Green Version]
  23. Li, W.; Godzik, A. Cd-hit: A fast program for clustering and comparing large sets of protein or nucleotide sequences. Bioinformatics 2006, 22, 1658–1659. [Google Scholar] [CrossRef] [Green Version]
  24. Hammer, Ø.; Harper, D.A.; Ryan, P.D. PAST: Paleontological statistics software package for education and data analysis. Palaeontol. Electron. 2001, 4, 9. [Google Scholar]
  25. Scott, J.T.; Marcarelli, A. Cyanobacteria in freshwater benthic environments. In Ecology of Cyanobacteria II; Whitton, B.A., Ed.; Springer: Dordrecht, The Netherlands, 2012; pp. 271–289. [Google Scholar]
  26. Grigorszky, I.; Tihamér Kiss, K.; Pór, G.; Dévai, G.; Nagy, A.S.; Somlyai, I.; Ács, É. Temperature and growth strategies as the essential factors influencing the occurrence of Stephanodiscus minutulus (Kützing) Cleve & Möller and Palatinus apiculatus (Ehrenberg) Craveiro, Calado, Daugbjerg & Moestrup. Fundam. Appl. Limnol. 2017, 189, 167–175. [Google Scholar] [CrossRef]
  27. Oliveira, S.A.; Ferragut, C.; Bicudo, C.E.M. Relationship between phytoplankton structure and environmental variables in tropical reservoirs with different trophic states. Acta Bot. Bras. 2020, 34, 83–93. [Google Scholar] [CrossRef]
  28. Brito, A.; Brotas, V.; Caetano, M.; Coutinho, T.P.; Bordalo, A.; Icely, J.; Neto, J.; Serôdio, J.; Moita, T. Defining phytoplankton class boundaries in Portuguese transitional waters: An evaluation of the ecological quality status according to the water framework directive. Ecol. Indic. 2012, 19, 5–15. [Google Scholar] [CrossRef]
  29. Domingues, R.B.; Barbosa, A.; Galvão, H. Constraints on the use of phytoplankton as a biological quality element within the Water Framework Directive in Portuguese waters. Mar. Pollut. Bull. 2008, 56, 1389–1395. [Google Scholar] [CrossRef] [PubMed]
  30. Spatharis, S.; Tsirtsis, G. Ecological quality scales based on phytoplankton for the implementation of Water Framework Directive in the Eastern Mediterranean. Ecol. Indic. 2010, 10, 840–847. [Google Scholar] [CrossRef]
  31. Yu, Z.; Yang, J.; Zhou, J.; Yu, X.; Liu, L.; Lv, H. Water stratification affects the microeukaryotic community in a subtropical deep reservoir. J. Euk. Microbiol. 2014, 61, 126–133. [Google Scholar] [CrossRef] [PubMed]
  32. Hamady, M.; Knight, R. Microbial community profiling for human microbiome projects: Tools, techniques, and challenges. Genome Res. 2009, 19, 1141–1152. [Google Scholar] [CrossRef] [Green Version]
  33. Lee, K.; Yoon, S.K. A study on the phytoplankton in the Paldang Dam reservoir. III. The changes of diatom community structure. Algae Korean Phycol. Soc. 1996, 11, 277–283. [Google Scholar]
  34. Ha, K.; Kim, H.W.; Joo, G.J. The phytoplankton succession in the lower part of hypertrophic Nakdong River (Mulgum), South Korea. In Phytoplankton and Trophic Gradients; Springer: Dordrecht, The Netherlands, 1998; pp. 217–227. [Google Scholar]
  35. Rollo, F.; Sassaroli, S.; Boni, L.; Marota, I. Molecular typing of the red-tide dinoflagellate Gonyaulax polyedra in phytoplankton suspensions. Aquat. Microb. Ecol. 1995, 9, 55–61. [Google Scholar] [CrossRef]
  36. Rott, E. Some aspects of the seasonal distribution of flagellates in mountain lakes. In Flagellates in Freshwater Ecosystems. Developments in Hydrobiology; Jones, R.I., Ilmavirta, V., Eds.; Springer: Dordrecht, The Netherlands, 1988; Volume 45, pp. 159–170. [Google Scholar]
  37. Bolch, C.J.; Subramanian, T.A.; Green, D.H. The toxic dinoflagellate Gymnodinium catenatum (Dinophyceae) requires marine bacteria for growth 1. J. Phycol. 2011, 47, 1009–1022. [Google Scholar] [CrossRef] [PubMed]
  38. Jeong, H.J.; Yoo, Y.D.; Kang, N.S.; Rho, J.R. Ecology of Gymnodinium aureolum. I. Feeding in western Korean waters. Aquat. Microbiol. Ecol. 2010, 59, 239–255. [Google Scholar] [CrossRef] [Green Version]
  39. Lee, J.B.; Kim, G.B. New records of five unarmored genera of the family Gymnodiniaceae (Dinophyceae) in Korean Waters. Korean J. Environ. Biol. 2017, 35, 273–288. [Google Scholar] [CrossRef]
  40. Kaarunya, E.; Sundari, M.S.; Somasundaram, S.T.; Anantharaman, P. Simple approach combining microscopic and molecular techniques to identify diatoms isolated from Vellar Estuary, South East Coast of India. J. Algal Biomass Util. 2016, 7, 71–77. [Google Scholar]
  41. Lopes, V.R.; Ramos, V.; Martins, A.; Sousa, M.; Welker, M.; Antunes, A.; Vasconcelos, V.M. Phylogenetic, chemical and morphological diversity of cyanobacteria from Portuguese temperate estuaries. Mar. Environ. Res. 2012, 73, 7–16. [Google Scholar] [CrossRef] [PubMed]
  42. Tapolczai, K.; Keck, F.; Bouchez, A.; Rimet, F.; Vasselon, V. Diatom DNA metabarcoding for biomonitoring: Strategies to avoid major taxonomical and bioinformatical biases limiting molecular indices capacities. Front. Ecol. Evol. 2019, 7, 409. [Google Scholar] [CrossRef] [Green Version]
  43. Yang, C.; Nan, J.; Li, J. Driving factors and dynamics of phytoplankton community and functional groups in an estuary reservoir in the Yangtze River, China. Water 2019, 11, 1184. [Google Scholar] [CrossRef] [Green Version]
  44. Leland, H.V. The influence of water depth and flow regime on phytoplankton biomass and community structure in a shallow, lowland river. Hydrobiologia 2003, 506, 247–255. [Google Scholar] [CrossRef]
Figure 1. (a) Seasonal variations in dissolved oxygen (DO) and water temperature; (b) Total phosphorus (TP) and total nitrogen (TN); (c) Conductivity and pH; and (d) Cell counts and Chlorophyll-a (Chl-a).
Diversity 13 00073 g001
Figure 2. The proportion of microeukaryote taxonomic group identified using 18S rRNA amplicon sequencing. The taxonomic identity of the others represents taxa with <1% composition of total reads within each site. “Uncultured” are sequences with less than 95% sequence similarities.
Diversity 13 00073 g002
Figure 3. Composition of phytoplankton community, as assessed using 18S rRNA amplicon sequencing. The taxonomic identity of others represents taxa with <1% composition of total reads within each site.
Diversity 13 00073 g003
Figure 4. Canonical Correspondence Analysis (CCA) plot showing the correlation among phytoplankton community (blue dots), seasonal samples (black dots), and environmental variables (green arrow and red labels). The plot was based on the relative abundance of phytoplankton reads. The taxonomic identity of others represents taxa with <1% composition of total reads within each site.
Diversity 13 00073 g004
Figure 5. Seasonal variation in composition of major phytoplankton community; (a) Diatom; (b) Chlorophyta; (c) Dinoflagellate; (d) Cryptophyta. Uncultured are sequences with less than 95% sequence similarities.
Diversity 13 00073 g005
Figure 6. Relative abundance of dominant species from the major phytoplankton community.
Diversity 13 00073 g006
Table 1. Amplicon sequencing data for microeukaryotic community with emphasis on eukaryotic phytoplankton (EP).
MonthTotal ReadsClassified ReadsRejected ReadsEP ReadsNo. of EP OTU% of EP
Mar.12,58712,046541757911063
Jun.94079012395508315656
Sep.71386685453254017438
Dec.43874181206250612160
Total33,51931,924159517,70856155.5
Table 2. Shannon–Weaver diversity index (H′), evenness, Chao-1 estimator, and Good’s coverage obtained from phytoplankton phylotypes recovered in the present study.
ParameterMonth
Mar.Jun.Sep.Dec.
Shannon (H′)2.112.753.992.89
Evenness0.080.100.300.16
Chao-1121170207134
Good’s coverage95.698.799.398.2
Table 3. Dominant phytoplankton phylotypes detected at the genus level (top 3) through microscopy and molecular methods.
MonthSpecies Detected through MicroscopyRatio (%)Phylotypes Detected through
Amplicon Sequencing
Ratio (%)
Mar.Stephanodiscus sp.72.8Cyclostephanos tholiformis38.1
Cyclotella sp.5.4.Stephanodiscus sp.24.1
Cryptomonas sp.2.7Stephanodiscus hantzschi16.7
Jun.Stephanodiscus sp.26.8Chlamydomonas sp.30.5
Fragilaria sp.12.8Cyclotella sp.28.1
Actinastrum sp.11.4Uncultured Cryptophyte2.3
Sep.Fragilaria sp.13.6Gymnodinium sp.15.6
Navicula sp.9.7Chlamydomonas sp.7.3
Stephanodiscus sp.5.0Cyclotella choctawhatcheeana4.4
Dec.Stephanodiscus spp.68.4Stephanodiscus sp.36.7
Navicula sp.14.1Cyclostephanos tholiformis.13.2
Chlamydomonas sp.10.9Stephanodiscus hantzschi5.4
Publisher’s Note: MDPI stays neutral with regard to jurisdictional claims in published maps and institutional affiliations.

