Article

Land Use Effects on Airborne Bacterial Communities Are Evident in Both Near-Surface and Higher-Altitude Air

by
Allison M. Spring
1,
Kenneth D. Domingue
2,
Thomas V. Kerber
2,
Margaret M. Mooney
2,
Rebecca L. Hale
3,
Kristina M. Lemmer
2 and
Kathryn M. Docherty
1,*
1
Department of Biological Sciences, Western Michigan University, Kalamazoo, MI 49006, USA
2
Department of Mechanical and Aerospace Engineering, Western Michigan University, Kalamazoo, MI 49006, USA
3
Department of Biological Sciences, Idaho State University, Pocatello, ID 83209, USA
*
Author to whom correspondence should be addressed.
Submission received: 23 December 2020 / Revised: 4 February 2021 / Accepted: 15 February 2021 / Published: 18 February 2021
(This article belongs to the Special Issue Microbial Ecology in the Atmosphere)

Abstract

:
Land use influences the composition of near-surface airborne bacterial communities, and bacteria can be transported through the atmosphere at global scales. The atmosphere mixes vertically, but rigorously assessing whether the effects of land use on atmospheric communities extends to higher altitudes requires examining communities from multiple altitudes collected at a stable location and timeframe. In this study, we collected near-surface (<2 m) and higher-altitude (150 m) air samples from three sites in an agricultural/developed location and a forested/undeveloped location. We used bacterial 16S rRNA amplicon sequencing to compare communities and predict functionality by altitude. Higher-altitude and near-surface communities did not differ in composition within each location. Communities collected above the undeveloped location were equally variable at both altitudes; higher-altitude samples from the developed location predominantly contained Firmicutes and were less variable than near-surface samples. We also compared airborne taxa to those present in soil and snow. Communities from higher-altitude samples above the developed location contained fewer overlapping taxa with soil and snow sources, and overlapping Operational Taxonomic Units (OTUs) among the three sources differed by location. Our results suggest that land use affects the composition of both near-surface and higher-altitude airborne bacterial communities and, therefore, may influence broad bacterial dispersal patterns. This small-scale pilot study provides a framework for simultaneously examining local and regional airborne microbial communities that can be applied to larger studies or studies using different types of samplers.

Graphical Abstract

1. Introduction

Atmospheric transport is a major mechanism for microbial dispersal to all global ecosystems, and it is estimated that there are between 105 and 106 cells in each cubic meter of air [1,2]. Due to their small size and low sedimentation rates, microorganisms, which include bacteria, fungi and microeukaryotes, can remain airborne for long periods of time and be transported over intercontinental distances (e.g., [3,4,5,6,7,8]). For example, microorganisms associated with Saharan Desert dust from Algeria were detected ~2250 km north in the Swiss Alps after a 40-h-long deposition event [8]. Even further distances have been calculated for airborne microbial dispersal between dust sources from China, South Korea and Japan to the west coast of North America after spending 10 days airborne [7]. Comparisons of communities using DNA-based and RNA-based methodologies indicate that some microorganisms are likely viable during atmospheric transport [9,10,11] and act as physical surfaces for condensation and ice nuclei formation in clouds and fog, contributing to the hydrologic cycle [1,12,13]. When aerially disbursed microorganisms deposit on the Earth’s surface, they introduce novel biodiversity [14,15] which can influence community- and ecosystem-level parameters such as soil microbial biomass and metabolic diversity [16]. As a result, ecosystem responses to environmental changes, such as drought, can be altered, suggesting that airborne microbial dispersal is connected to regional- and global-scale processes [16]. However, the question remains: How do these patterns of microbial dispersal change when the underlying ecosystem is disrupted?
Changes in land use may alter which types of microorganisms are distributed through the atmosphere, which could affect ecosystem processes. Microorganisms fall within the general category of bioaerosols—or particles released from terrestrial and marine systems into the atmosphere, either as individual particles or attached to dust particles or water droplets [17]. These can consist of both living and non-living components, including fungi, pollen, bacteria and viruses or fragments of their metabolic products (e.g., mycotoxins) and the outer membranes of the cell walls of Gram-negative bacteria (e.g., endotoxins) [17,18,19,20]. Plants, soils, surface water and sewage all make significant contributions to near-surface airborne communities [21,22,23,24,25,26,27,28]. With land-use development, which includes both conversion to agriculture and urbanization, sources shift from native plants and undisturbed soils to agricultural sources such as livestock, crop plants and tilled soils or urban sources such as impervious surfaces, wastewater, and landfills. These sources change the types of microorganisms that are present in the local taxonomic pools found in near-surface air (<2 m from surface) (e.g., [24,27,29,30]) and reflect the ecosystem convergence patterns observed in communities of macroorganisms and ecosystem processes in developed areas [31]. For example, when considered at a continental scale, dust-deposited bacterial communities collected in developed areas are more similar to each other than those collected from undeveloped sites [24]. However, at a local scale, site-to-site variation in near-surface airborne communities are stronger drivers of bacterial community variation than overall land use [27,28,32]. Taken together, these results indicate that land use change has the potential to influence all microbial dispersal and biogeographic patterns, but only if the effects of land use extend to the regional taxonomic pool of microorganisms that are broadly distributed higher in the atmosphere.
Studies to date that have examined higher-altitude bacterial communities demonstrate that taxa indicative of both natural and anthropogenic sources are present in the upper troposphere and stratosphere [33,34]. The vertical atmosphere is thought to act as a strong habitat filter, possibly screening which taxa are distributed broadly by selecting microorganisms that are capable of sporulation and DNA repair mechanisms in response to UV exposure, desiccation, oxidative stress and cold temperatures [7,35]. Spore-forming Clostridiales [34] and a consistent group of core bacterial taxa [33] were observed in tropospheric samples, demonstrating the potential for an altitude filter to influence the regional taxonomic pool of microorganisms. However, higher-altitude studies have typically been conducted using a powered aircraft that flew over broad regional areas, so it was not possible to collect simultaneous independent replicates or to pair high-altitude and near-surface samples with specific sites or land uses.
If the effects of land use change extend higher in the atmosphere, continued development could have dramatic consequences for distribution and deposition of airborne microbial communities and subsequent ecosystem functions and responses to disturbance. The question remains: do local (site-specific) and regional land uses only affect near-surface airborne communities, or do they extend higher into the atmosphere, where they have the potential to influence larger patterns of dispersal? Answering this question requires simultaneous sampling at multiple altitudes from stable positions during the same timeframe. This is difficult to achieve, and our study provides a small-scale example of how tethered helikites can be used to complete this type of sampling for airborne bacterial communities with passive samplers. We collected airborne samples at three replicate sites at two different land-use locations: agricultural/developed and forested/undeveloped. We determined whether communities collected near the terrestrial surface, or local taxonomic pool, were similar to those collected simultaneously from the same position 150 m above the surface, or the regional taxonomic pool. Anthropogenic effects on airborne communities and bioaerosol concentrations can be strengthened by seasonality [36,37], though seasonal changes are not always observed [38,39]. For this investigation, we collected samples in the winter because we wanted to focus on a time when anthropogenic influences on airborne bacterial communities are likely at a maximum and bacterial contributions from plants are at a minimum [23]. It is well established that airborne communities can differ by land use; here, we focused on questions related to the effects of land use on community connectivity between altitudes. Specifically, we addressed three questions: (1) Are there indications that bacterial community composition and selected putative functions, differ between near-surface air and higher-altitude air? (2) If so, is there evidence that underlying land use could affect the relationship between near-surface and higher-altitude airborne communities? (3) Does land use development result in a change the connectivity between terrestrial (soil and snow) bacterial communities and airborne communities?

2. Materials and Methods

2.1. Airborne Bacterial Community Sampling

In winter 2016–2017, we collected airborne samples at three sites near Pellston, in northern Michigan, located in Emmet and Cheboygan counties and at three sites in Kalamazoo County, in southwest Michigan, USA (Figure 1, Tables S1 and S2). We worked with land owners to select sites that had sufficiently large open areas to safely fly each of three 4.8-m diameter helikites at an altitude of 150 m for six hours, which is the maximum altitude allowed by the United States Federal Aviation Administration (FAA) for tethered flight vehicles [40]. We calculated land cover information surrounding 10,000 m of each site using the National Land cover database in ArcGIS 10.6.1 [41]. Sites near Pellston, which we call the “undeveloped location”, were predominantly forested (31.6%) and wetland (18.6%) land covers (Table S1). The sites near Kalamazoo, which we call the “developed location”, were predominantly surrounded by agricultural (42.3%) and developed (25.9%) land uses (Table S1). We sampled at the three developed sites (Parkview Campus, Asylum Lake Preserve and Schoolcraft Airstrip) on 23 December 2016. We sampled at two undeveloped sites (University of Michigan Biological Station (UMBS) UVB Field and Robinson Road) on 13 January 2017; due to time constraints, we sampled at the third undeveloped site (Chickagami Trail) on 14 January 2017.
At each of the six sites, we collected an air sample from less than 2 m (suspended from a tripod) and a sample from 150 m (suspended from a tethered helikite) above the ground, using Remote Airborne Microbial Passive (RAMP) samplers, as described in [42]. Examples of the sampling set-up are presented in Figure S1. In brief, this is a remotely operated passive sampler that we designed for use with the helikite. Each sampler weighs under 2.7 kg (6 lbs), which is the payload limit for tethered flight, according to FAA regulations [40]. We decontaminated and prepared the RAMP samplers one day prior to sampling, including a field blank control sampler, which remained closed during the sampling period. We used this field blank to correct for possible contamination during sampler preparation and transport. We hung low-altitude samplers from a tripod at 1.4 m; when open, they extended down to 0.5 m above the ground. We opened all samplers using a remote once they reached their target altitude to prevent contamination from non-target altitudes. During the six-hour sampling period, onboard weather sensors collected air temperature, barometric pressure and humidity data (Table S3). The program code for Arduino operation is publicly available, as described in [42]. We also recorded ground temperature, wind speed and wind direction every hour during sampling.
Once the six-hour sampling was complete, we remotely closed the RAMP samplers and transported them back to the laboratory. We decontaminated the outsides of the closed RAMP samplers using 70% ethanol and a UV irradiation chamber for 10 min. We then removed the collection dishes and placed them in zip-sealing plastic bags at 4 °C overnight until we could complete DNA extraction. We removed and stored collection dishes from the field blank sampler in the same way.
At each of the six sites, we also aseptically collected three 10-cm snow samples and one soil sample using a 5-cm diameter corer. We collected soil and snow samples from an undisturbed area near the base of the helikite tether at each site. We stored these samples on ice in zip-sealing plastic bags during transport to the laboratory, where they were stored at −80 °C until DNA extraction could be completed.

2.2. DNA Extraction

We extracted DNA from air samples and the field blank control within 24 h of collection using a MoBio PowerWater® DNA Isolation Kit (MoBio Laboratories, Carlsbad, CA, USA) as described in [42]. We extracted DNA from 0.25 g of soil samples using the MoBio PowerSoil® DNA Isolation Kit (MoBio Laboratories, Carlsbad, CA, USA), according to the manufacturer’s instructions. We combined and homogenized the three snow samples collected from each site prior to DNA extraction. We melted the snow samples in a sterile beaker and then filtered 40 mL of water through 0.2-µm sterile filters (Whatman, Buckinghamshire, UK) and extracted DNA from the filter using the MoBio PowerWater® DNA Isolation Kit (MoBio Laboratories, Carlsbad, CA, USA) with the amended protocol described in [42]. For all extractions, we included an extraction control to identify any contaminants introduced during the extraction or sequencing process. DNA extracts were stored at −80 °C until sequencing could be completed.

2.3. DNA Sequencing and Bioinformatics

Amplicon preparation and next-generation sequencing were performed at Michigan State University’s Genomic Core—Research Technology Support Facility. The V4 hypervariable region of the bacterial 16S rRNA gene was amplified using primers 515F and 806R [43] and examined on agarose gel. Samples were normalized and pooled into single wells; then, Mi-Seq sequencing was performed (Illumina, San Diego, CA, USA). We used PANDAseq version 2.8 [44] to remove all sequences that were shorter than 247 bp and longer than 275 bp from the dataset and to combine forward and reverse reads. We used QIIME v.1.9.1 [43] using the vsearch algorithm version 2.4.3 [45] to remove chimeras and cluster Operational Taxonomic Units (OTUs), as described in [46]. We classified OTUs using the Silva version 128 database [47]. We removed sequences identified as mitochondria, chloroplasts, Archaea and all sequences identified as Ralstonia, which are common contaminants in DNA extraction kits [48]. We removed any OTUs identified in extraction controls from the respective samples (air, snow or soil). For air samples only, we removed any OTUs identified in the field blank control boxes that were more abundant in the control than on average across the six air samples, as described in [42]. For the six developed- location air samples, the number of sequences per sample ranged from 3430 to 78,959, so we rarefied all samples to 3430 for within-site air community comparisons, as per recommendations suggested in [49]. For the six undeveloped-location air samples, the number of sequences ranged from 10,503 to 56,460, so we rarefied all samples to 10,503 for within-site air community comparisons. Collector’s curves indicate that the air communities were sampled sufficiently (Figure S2). For analyses comparing soil, snow and air samples, we did not rarefy sequences because we wanted to compare complete taxonomic overlap of OTUs; one snow sample (from the Parkview site) was not included in this analysis due to low sequencing success. The sequence reads are publicly available in the National Center for Biotechnology Information Sequence Read Archive (NCBI SRA, PRJNA627456).
To explore predicted functional data, we identified OTUs using the Greengenes version 13.8 reference database [50] and then used Phylogenetic Investigation of Communities by Reconstruction of Unobserved States (PICRUSt) version 1.1.3 to determine predicted Kyoto Encyclopedia of Genes and Genomes (KEGG) 1–3 pathways [51,52]. We targeted a predicted pathway analysis to those pathways related to bacterial DNA repair and sporulation to address the question of whether altitude-related stress impacts DNA repair and sporulation.

2.4. Land Cover and Statistical Analyses

We calculated backwards trajectories of air masses (Figure 1) using the online version of the National Oceanic and Atmospheric Administration (NOAA) Hybrid Single-Particle Lagrangian Integrated Trajectory (HYSPLIT) model using the Global Data Assimilation System (GDAS1) database [53]. For each day of sampling, we calculated a 6-h backwards trajectory for both 2 and 150 m above ground level (AGL), to correspond with the exact time period and altitude of each sampling effort. We imported shapefiles into ArcGIS (10.6.1) and created a 10,000-m buffer surrounding each trajectory. We calculated trajectories from a central point between all sites at each location and chose 10,000 m as the buffer because it encompassed all sites at both locations. We used the National Land Cover database within each of these buffer areas to determine land cover [41].
The study design tests whether airborne communities differ between near-surface and higher-altitude air at two locations with different land uses and whether location influences airborne community variability and connectivity with snow and soil bacterial communities. To address question 1, we used QIIME version 1.9.1 to calculate weighted UniFrac distances between near-surface and higher-altitude air samples collected at each location [54]. We used the “vegan” package [55] in R version 3.5.1 to test for differences between airborne communities by altitude using regression-based models implemented with envfit. We visualized community similarity among samples using separate principle coordinates analysis (PCoA) ordinations for each location. We calculated OTU richness and Shannon diversity for all air samples and compared these metrics by altitude. To examine differences in functionality by altitude, we compared the relative abundances of predicted pathways for sporulation, nucleotide excision repair, DNA repair and recombination pathways. We calculated the relative abundances of bacterial orders present at each altitude and conducted Wilcoxon ranked-sum tests to describe differences in altitude overlap patterns in the developed and undeveloped locations. We also used similarity percentage (SIMPER) to determine the most influential OTUs driving differences between altitudes in each location [56]. For all parametric statistical approaches, we tested datasets for normality and skewness and transformed them as appropriate. Significance was assessed at α = 0.05.
To address question 2, we calculated the average pairwise distances between the ordination points representing the three near-surface samples and the three high-altitude samples at each location. We compared these averages to the pairwise distance between all near-surface-to-high-altitude pairwise distances using analysis of variance (ANOVA). We also compared pairwise distances of near-surface and high-altitude samples that were co-located at individual sites within a location to pairwise distances of samples that were not co-located. We used Welch’s t-test to determine whether average distances were affected by co-location.
To address question 3, we calculated the number of overlapping OTUs present in near-surface air, high-altitude air, snow and soil datasets. We represented these results with Venn diagrams, using the “Venn Diagram” package (version 1.6.0) in R [57]. We considered an OTU as overlapping if, after quality filtering steps, it was present at least one time in at least one replicate from two of the four sources. For overlap results, only presence/absence of OTUs was considered. We also calculated the relative abundances of bacterial families present in each sample source and used Wilcoxon ranked-sum tests to describe differences in connectivity between sources at each location.

2.5. Considerations of the Experimental Approach

Our study approach is unique because it allowed us to sample at stable positions at three replicate sites and altitudes concurrently within the same air mass. We needed to take several considerations into account to test this approach. In accordance with United States FAA regulations, the tethered helikites we used to collect our samples could only be flown to a maximum altitude of 150 m. In addition, helikite sampling requires that: sites have sufficient clearance to tether and launch a 4.8-m diameter helikite, sites are at least 9.65-km distant from all airports, meteorological conditions on sampling days have low wind and no precipitation and field crew are sufficiently trained for safe operation [40]. A crew of three people is required to launch and maintain one helikite during sampling, so in order to complete this study, we trained nine team members.
Though our experiment was necessarily limited in scale, we took several experimental design and sampling considerations into account. First, in order to complete sampling in both a developed and an undeveloped locations, we needed to sample two different air masses because the locations are geographically distant. We also needed to sample on different dates at the different locations due to time, budget and personnel constraints, so development, location and sampling date are not independent. To correct for this, we focused our statistical analyses on within-location/date groups only instead of comparisons by location. We assumed that we were testing for an effect of land use instead of an effect of biome or soil type. Both Kalamazoo and Pellston are located in the “deciduous broadleaf forest” biome [58]. Soil types differ between the two sites: near Kalamazoo, soils are typically Alfisols or Mollisols, whereas near Pellston, they are typically Spodosols or Entisols. However, there was not a difference in soil bacterial community composition by location (permanova, p = 0.22).
Second, on the dates we sampled, the wind traveled from the northwest to the undeveloped sites we sampled (Figure 1). While this is a common wind direction experienced in Pellston all year round, winds predominantly travel from the west, where the air mass would also pass over forest and the northern part of Lake Michigan [59]. On the date we sampled in the developed location, the wind traveled from the south (Figure 1). Wind travels from the south for approximately one-third of the year in Kalamazoo; the rest of the year, wind travels from the west or southwest [60]. In either case, the predominant land use that these air masses would travel over is agricultural, though a full west wind would also pass over the lower part of Lake Michigan, which could affect results. Wind direction could influence the results, leading to day-to-day variations in airborne bacterial community composition and potential differences in atmospheric–terrestrial connectivity [28,61].
Third, until recently, scientists relied solely on culture-dependent methods for detecting airborne microbial diversity, but these methods reveal only a small fraction of microorganisms in the atmosphere and underestimate the volume and diversity of airborne bacteria [62]. Next-generation sequencing allows us to analyze large quantities of environmental samples with precision [63]. However, air samples often contain low microbial biomass as compared to other environments such as soil and marine habitats, making it difficult to perform next-generation approaches [64]. Powered bioaerosol samplers provide the opportunity to increase biomass collection as well as assess particulate fractions and concentrations. They are a great option when the investigator can be close at hand. However, many bioaerosol samplers are heavier than the 2.7-kg (6 lbs) FAA limitation for the weight of a payload attached to a tethered balloon [40]. Several popular bioaerosol samplers exceed these regulations, such as Coriolis μ air samplers (Bertin Instruments, Montigny-le-Bretonneux, France) and some liquid impinger samplers that require vacuum filtration. We found that smaller powered samplers such as the Button Aerosol Sampler (SKC, Inc. Eighty Four, PA, USA) are difficult to turn on and off remotely, so that collecting samples from non-target altitudes can be avoided. Their battery life is also inconsistent at cold temperatures (personal observations). We did not test the Air Ideal sampler (bioMérieux Inc., Durham, NC, USA), which is also light enough for this application. For the purposes of our study, a passive sampler was the best option to pair with additional weather sensors for temperature, humidity and pressure using the tethered helikite approach, and we collected sufficient biomass to complete next-generation sequencing with these samplers.
Fourth, even with sufficient biomass, it is still a challenge to detect which microorganisms are active in the atmosphere. Atmospheric samples contain diverse communities, with a high number of rare members [6,9,65,66]. Rare members of bacterial communities can be disproportionately active community members, so sequencing to a depth which reaches saturation is exceedingly important for bacterial research [4,9,67]. Our collector’s curve indicates that we completely sampled airborne communities despite low biomass yields, but because sequencing success was variable from sample to sample, we rarefied all datasets for more accurate comparisons (Figure S2). The DNA-based approach we used provides a snapshot of the bacterial community, but further studies using transcriptomics or proteomics approaches can address whether community members are dormant or active.
Fifth, few bioaerosol studies discuss contamination control procedures, which is critically important when examining low-yield biomass samples [34]. The passive samplers we used avoid contamination from powered aircraft and only sample at target altitudes. In addition, our unique use of a field blank sampler allowed us to correct for contaminant OTUs, in addition to negative controls in our DNA extractions. Field blanks are common controls used in biogeochemical studies but are rarely used in microbial ecology. We recommend the use of a field blank for all airborne microbial community studies since it can reveal spurious OTUs or flaws in the sampling decontamination procedure.

3. Results

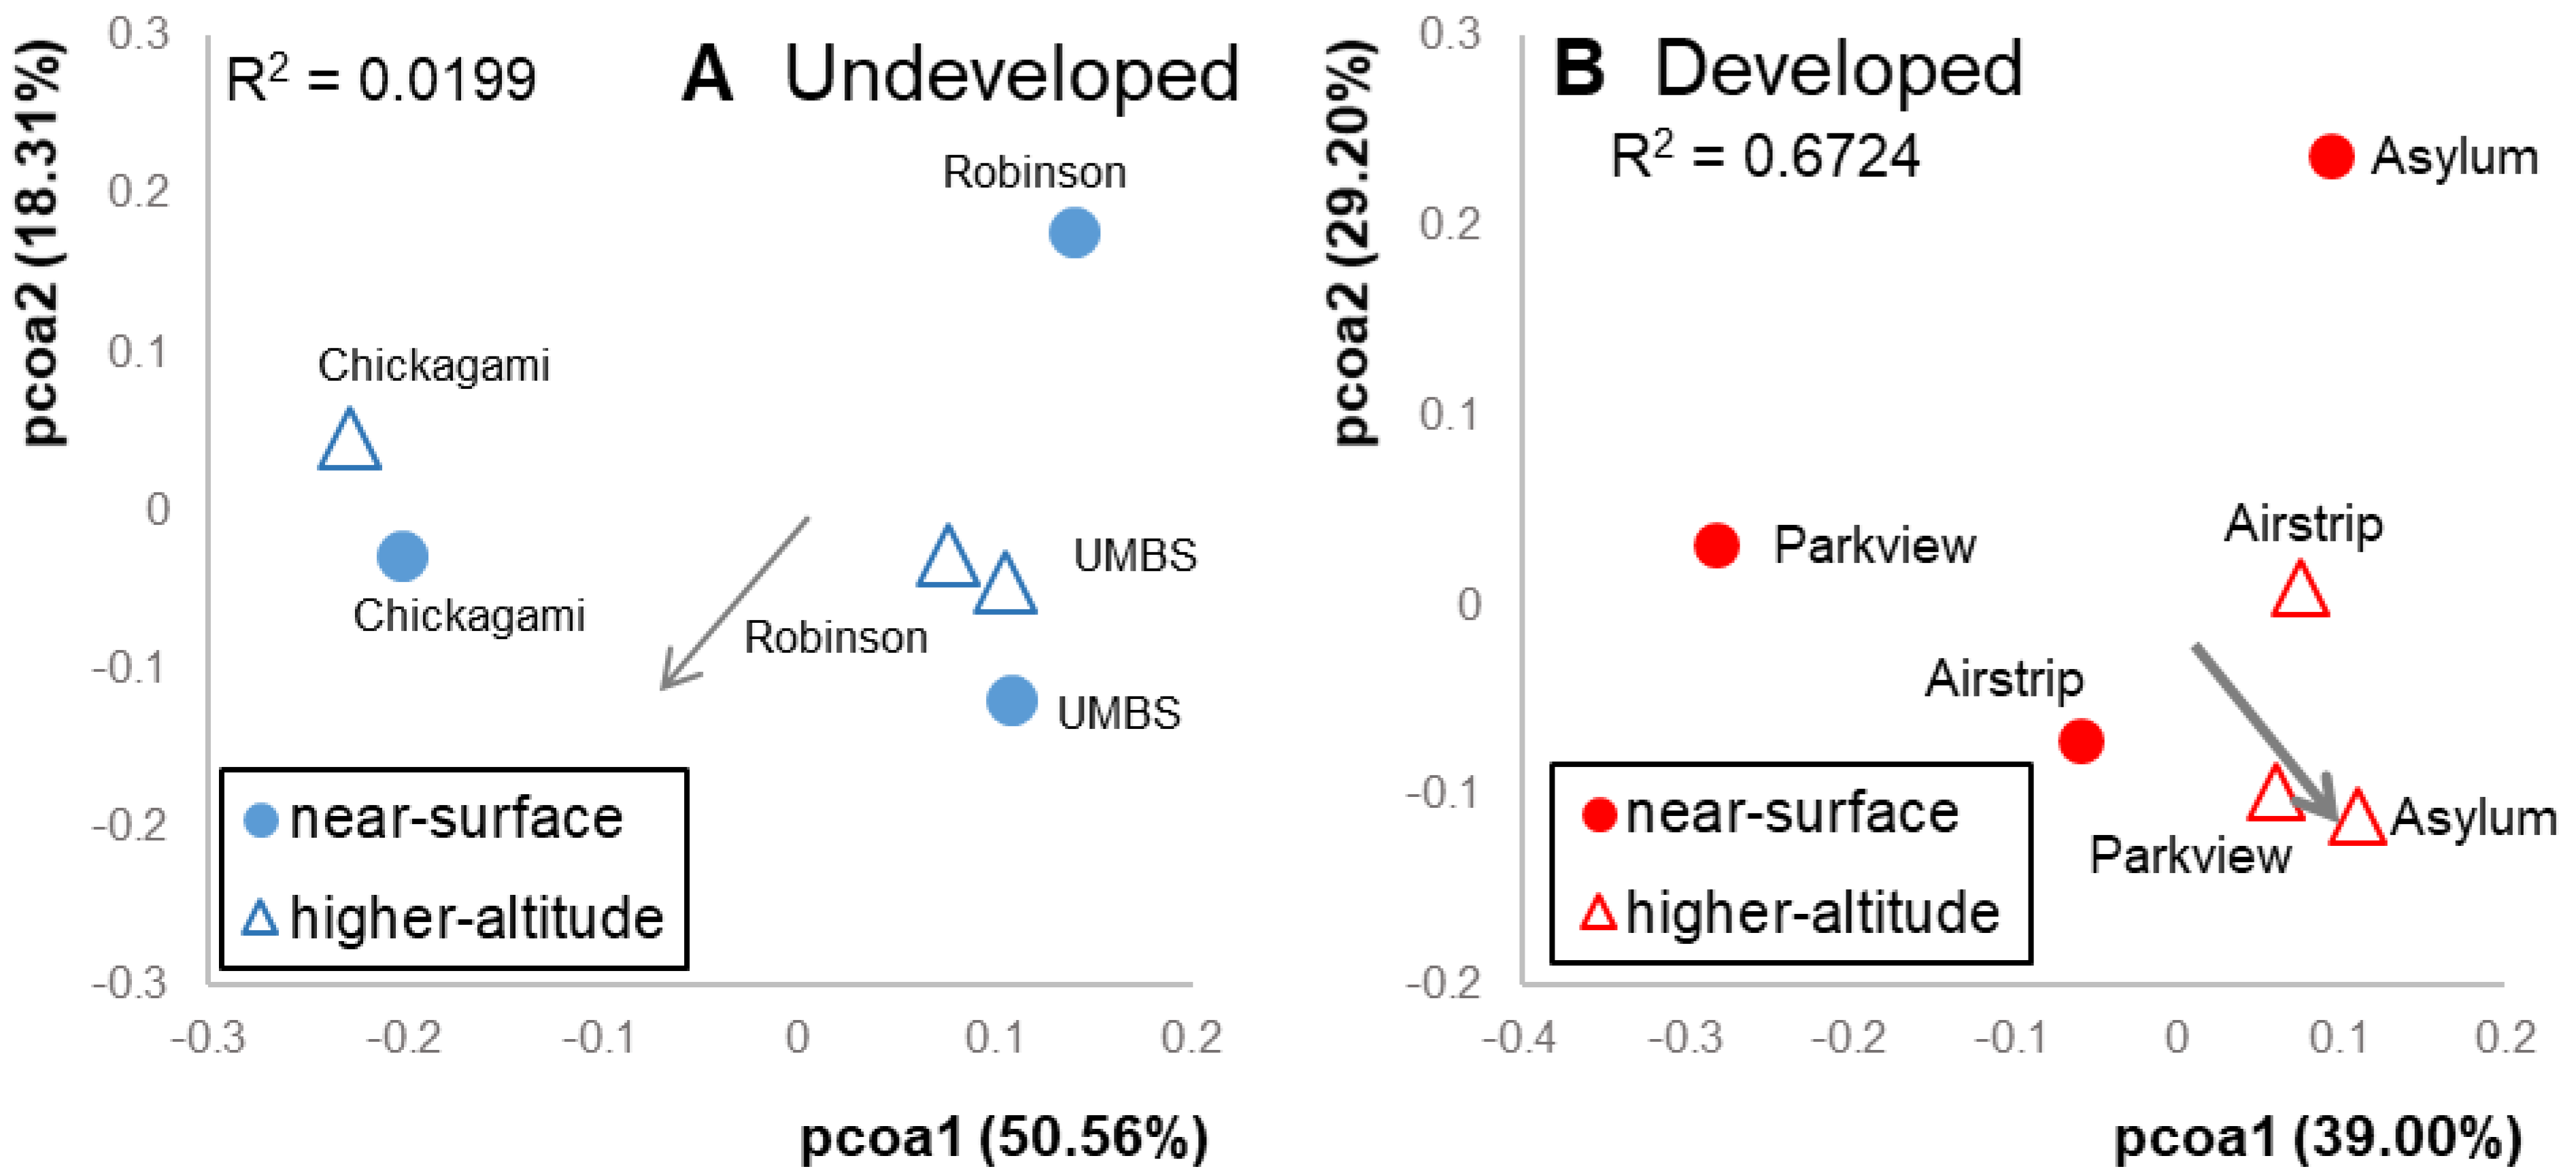
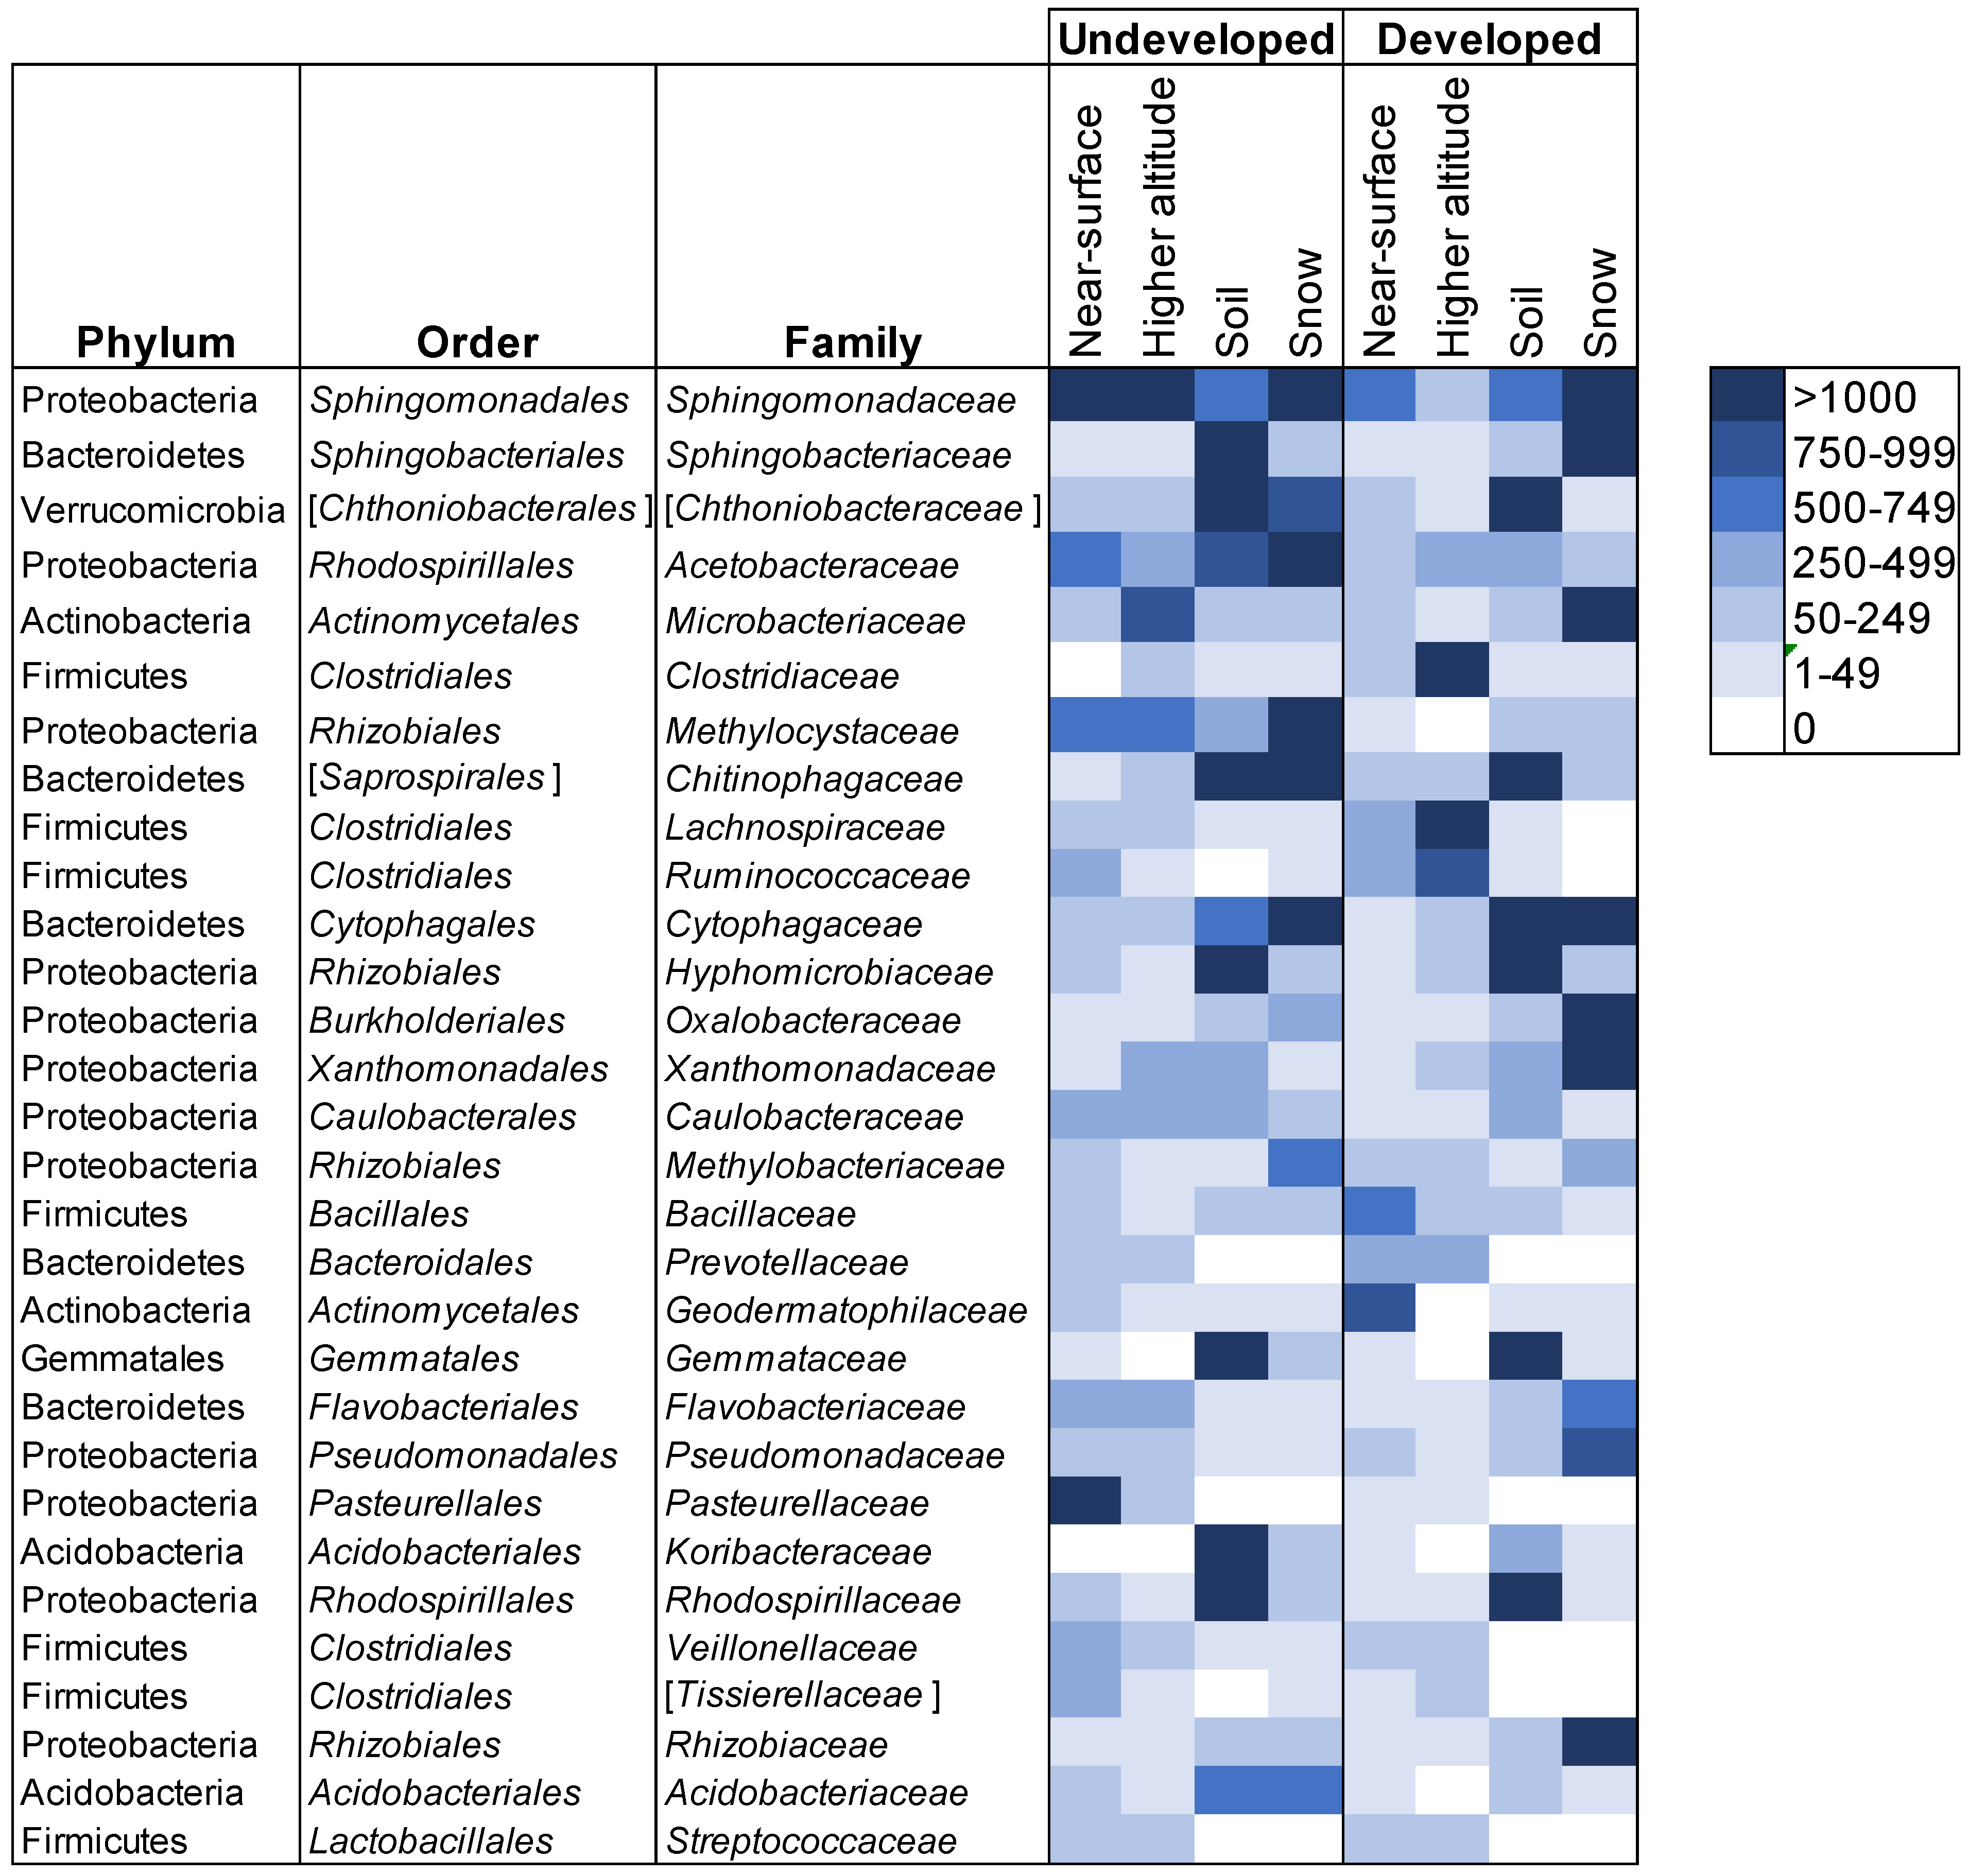
3.1. Airborne Community Results by Location

Specific percentages of land uses over which the air masses traveled are shown in Table S3. When all samples were considered together, land use explained 57% of the variation in airborne bacterial communities (p = 0.043). Altitude only explained eight percent of the variation in airborne communities, which was not significant (p = 0.701, Figure S3). OTU richness was significantly higher (p = 0.05) at the undeveloped location (635 ± 299) than at the developed location (251 ± 52). Phylogenetic diversity was marginally higher (p = 0.09) at the undeveloped location (30.05 ± 12.68) than at the developed location (16.60 ± 2.12). The five most abundant bacterial orders across all twelve air samples were Clostridiales (17%), Rhizobiales (11%), Actinomycetales (10%), Sphingomonadales (9%) and Bacillales (5%). Sphingomonadales (Wilcox p = 0.019) and Pasteurellales (Wilcox p = 0.030) were significantly more abundant in samples collected at the undeveloped location than at the developed location (Figure 2). Other major orders did not significantly differ between the two locations; however, some prominent orders (Bacillales, Caulobacterales and Flavobacteriales) were more abundant at the undeveloped location, though not significantly (Figure 2). At the family level, Sphingomonadaceae, Methylocystaceae and Pasteurellaceae were more abundant at the undeveloped location and Lachnospiraceae and Lactobacillaceae were significantly higher at developed location. Average relative abundances for all bacterial orders are shown in Figure 3. Since it is well-established that airborne communities can differ by land use, the remainder of our results focus on differential patterns within each land-use type (i.e., undeveloped and developed).

3.2. Effects of Altitude

Meteorological conditions and wind speeds were similar on the days of the sampling events at both locations (12.95 km hr−1 at undeveloped and 11.10 km hr−1 at developed). Within each location, separate patterns emerged. In the undeveloped location, near-surface bacterial communities were similar to higher-altitude communities (altitude, R2 = 0.0199, Figure 4A). Near-surface and higher-altitude ordination points were equally dispersed, and neither of these averages differed from the pairwise distances between randomized cross-altitude pairs (p = 0.41) However, near-surface and higher-altitude samples collected from the same undeveloped sites were more similar to each other than cross-site pairs (p = 0.05). This suggests that local site effects influenced the composition of both near-surface and higher-altitude air samples at the undeveloped location. OTU richness and phylogenetic diversity did not differ between altitudes (p = 0.63 and 0.67, respectively), and the relative abundances of predicted functional pathways did not differ (sporulation: p = 1.0; nucleotide excision repair: p = 0.7; DNA repair and recombination: p = 0.7). Taxa within the orders Actinomycetales, Rhizobiales and Sphingomonadales were shared in similar abundances between the two altitudes (Figure 2). OTUs that contributed most to differences in airborne communities were predominantly within the orders Bacillales, Actinomycetales and Sphingomonadales, which were more abundant at higher altitudes. Meanwhile, Bacteroidales, Pasteurellales and other Sphingomonadales OTUs were more abundant at lower altitudes. (Table S4).
At the developed location, altitude explained 67% of the variation in bacterial communities. Though this was not statistically significant (p = 0.2), it is 33 times the explanatory power of altitude at the undeveloped location, suggesting that different mechanisms may be at play in the two land use types (Figure 4B). Higher-altitude communities were more similar to each other than near-surface communities or to random cross-altitude pairs (p = 0.02), indicating community homogeneity across the high-altitude samples. However, samples collected from different altitudes at the same site were no more similar to each other than by chance (p = 0.84). This suggests that local site sources distinguish near-surface air in the developed location just as they do in the undeveloped location. However, homogeneous communities in higher-altitude air overwhelm these local site effects in the regional taxonomic pool. OTU richness and phylogenetic diversity did not differ between altitudes (p = 0.83 and 0.82, respectively). Taxa within the orders Clostridiales, Actinomycetales and Bacteroidales were shared in similar abundances at both altitudes (Figure 2). OTUs that distinguished high altitude samples were predominantly within Firmicutes (Clostridiaceae, Lactobacillaceae, Lachnospiraceae and Aerococcaceae). Conversely, OTUs that distinguished the near-surface communities were within the families Mycoplasmataceae, Xanthomonadaceae and Geodermatophilaceae (Table S4). Predicted pathways for sporulation were marginally more abundant in the higher-altitude samples than in the near-surface samples (p = 0.1), as expected with higher abundances of Firmicutes. As in the undeveloped site, relative abundances of predicted pathways for DNA repair did not differ by altitude (nucleotide excision repair: p = 1.0; DNA repair and recombination: p = 1.0).

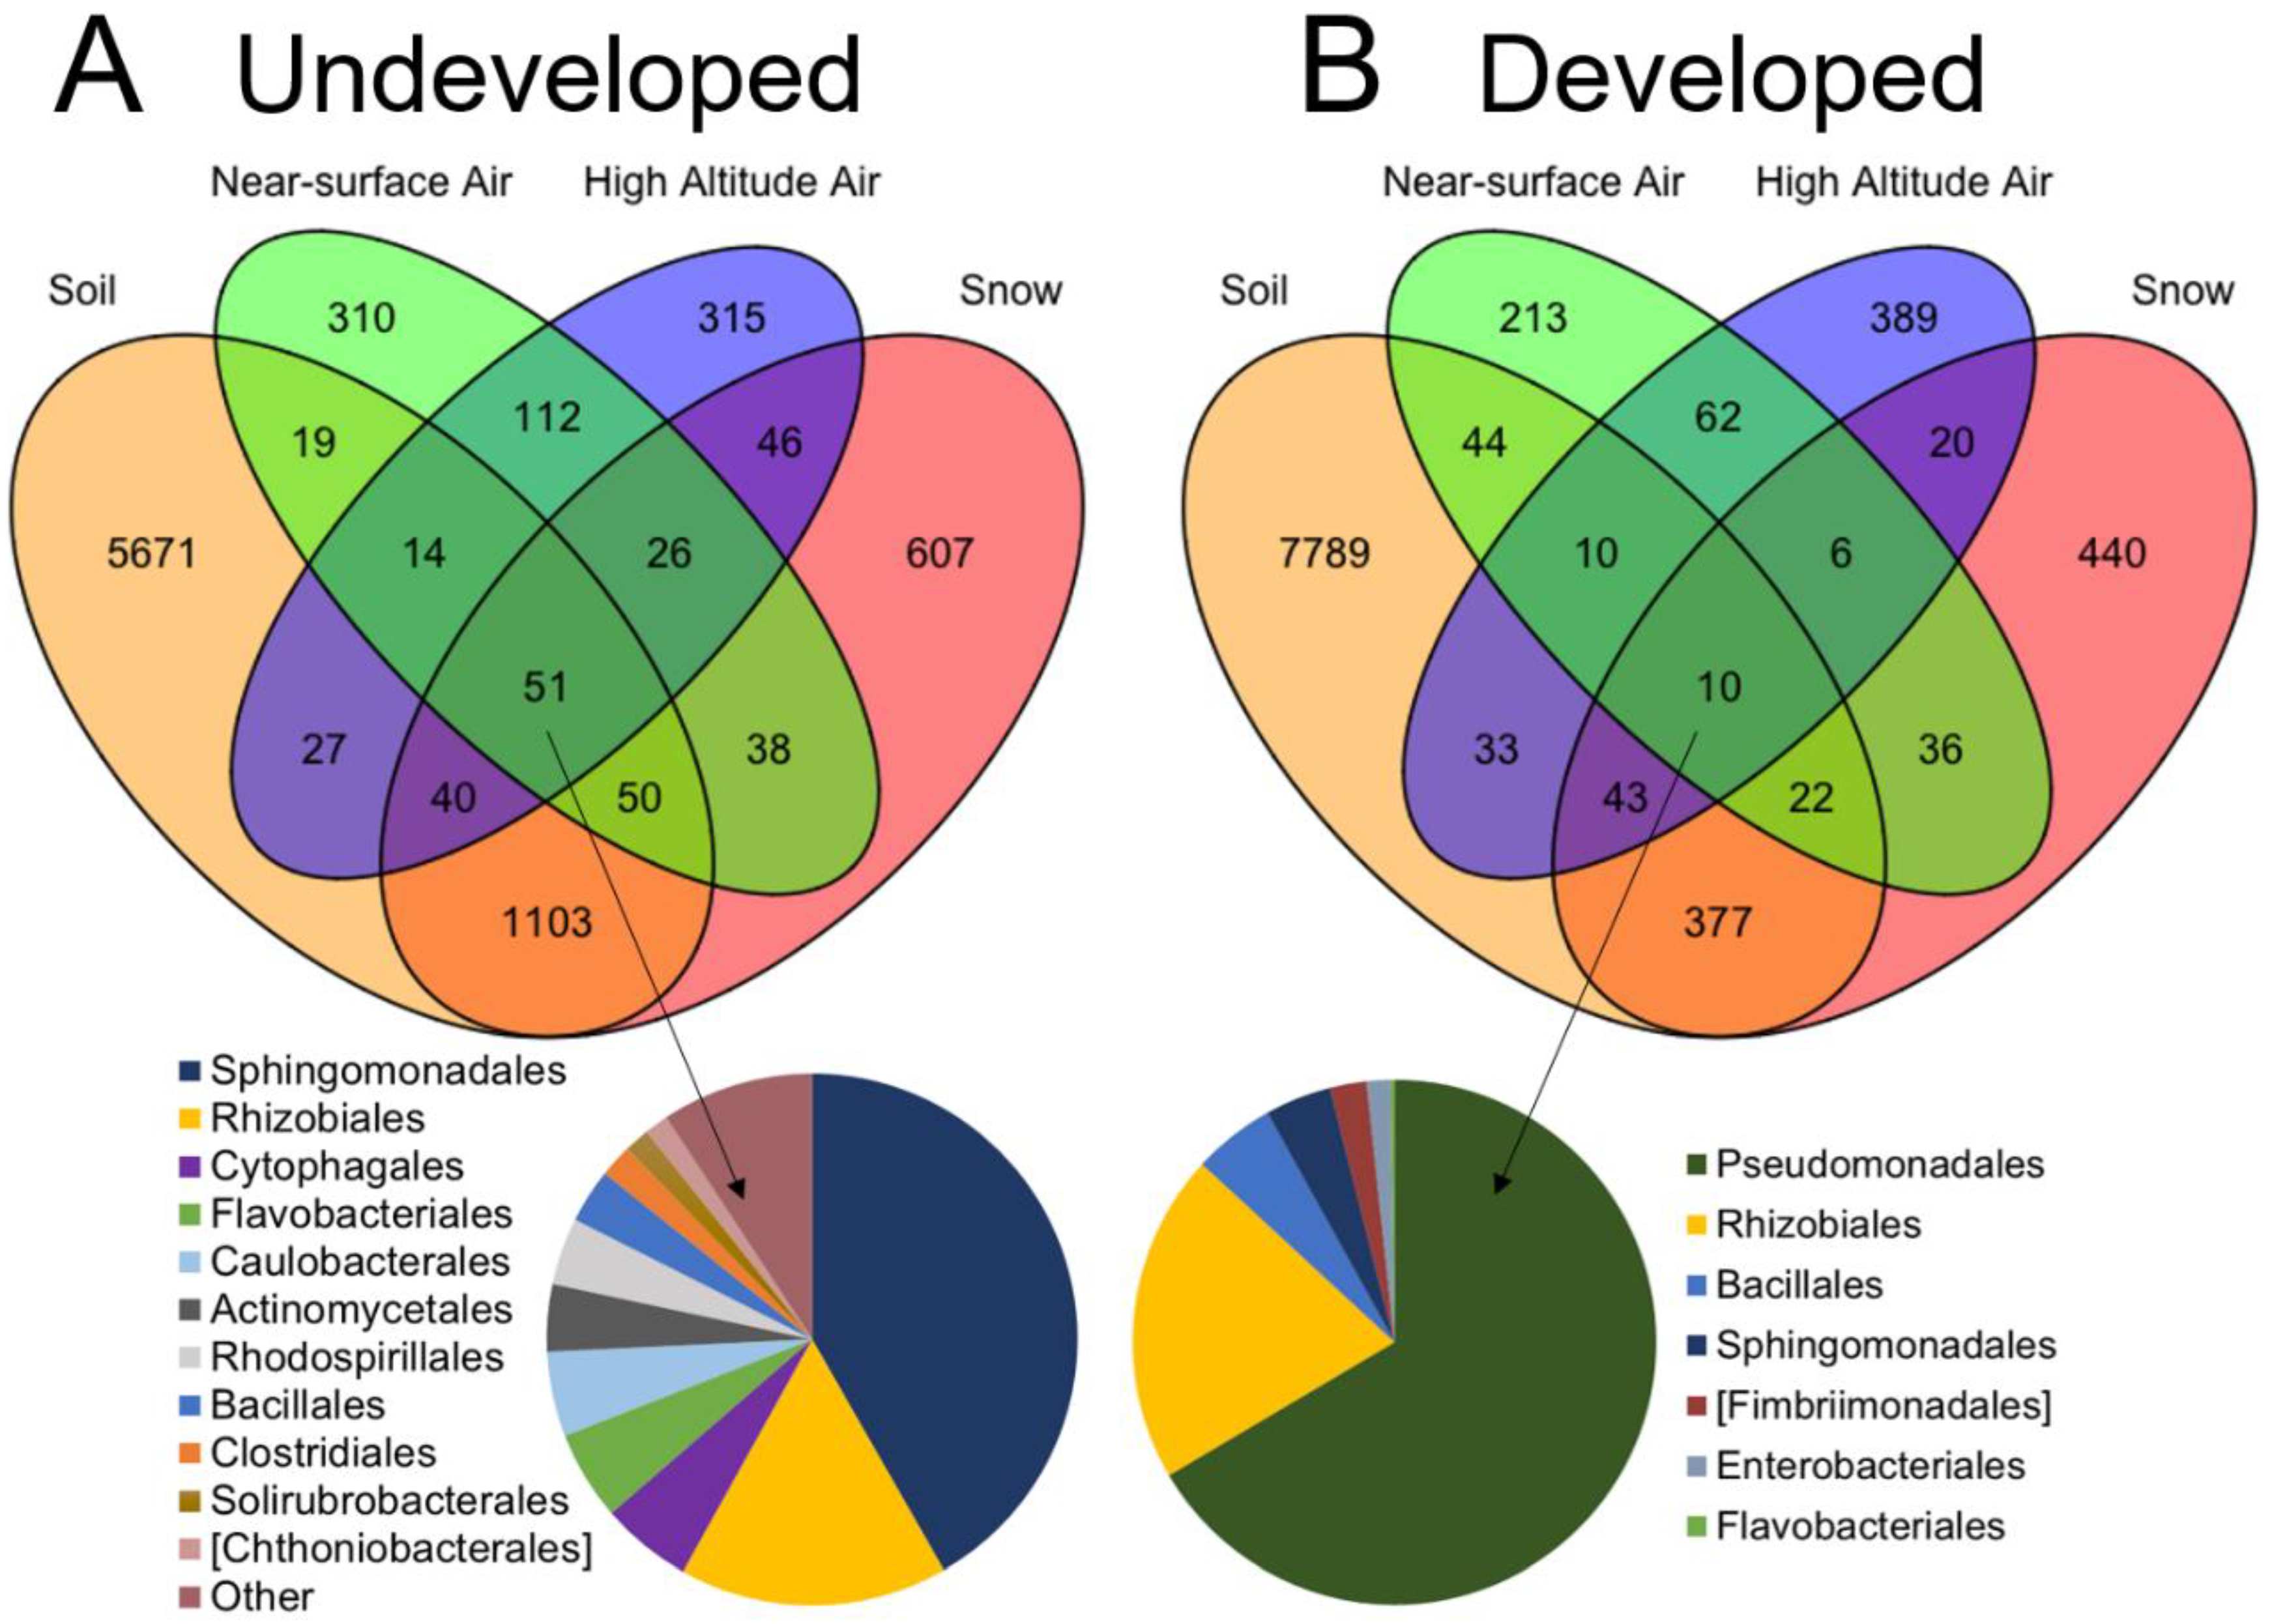
3.3. Connectivity between Sample Sources

Our community results suggest that bacterial community connectivity is disrupted between near-surface and higher-altitude air at developed sites. To examine this further, we compared communities collected from atmospheric and terrestrial sources from each of four sample provenances (soil, snow, near-surface air and higher altitude air). Communities in all four groups differed from each other at both sampling locations (permanova: undeveloped, p = 0.01; developed p = 0.001). For comparison between communities collected from soil, snow and air only, we used unrarefied sequence data from two sites near the developed location (Asylum Lake Preserve and Schoolcraft Airstrip) and two sites near the undeveloped location (Robinson Road and UMBS UVB Field). The snow sample from Parkview (developed location) had low sequencing success and we excluded it from the analysis. Since we sampled Chickagami Trail (undeveloped location) on a different day than other sites from this location, we excluded these samples from the source overlap analysis. We did this to avoid the addition of potentially confounding variation by date and to balance our design.
At the undeveloped location, more OTUs overlapped between sample provenances than at the developed location (Figure 5A), driven by a lower overlap between terrestrial sources and higher-altitude air above developed land uses. At the undeveloped location, near-surface air communities shared 5.3% of OTUs with soil communities, 10.3% with snow communities and 16.3% with OTUs that overlapped between soil and snow communities, for a total of 31.9%. Higher-altitude air communities shared a comparable 6.4% of OTUs with soil communities, 11.4% with snow and 14.4% with OTUs that overlapped between soil and snow communities, for a total of 32.3%. In total, 0.6% of OTUs overlapped between all four sample provenances in the undeveloped location.
In contrast, near-surface air communities at the developed location shared 13.4% of OTUs with soil communities, 10.4% with snow communities and 7.9% with OTUs that overlapped between soil and snow communities, for a total of 31.7% (Figure 5B). Higher-altitude communities at the developed location shared 7% of OTUs with soil communities, 4.5% with snow communities and 3.5% with OTUs that overlapped between soil and snow communities, for a total of 15.5%. In total, 0.1% of OTUs overlapped between all four sample provenances in the developed location. Near-surface and higher-altitude communities at the undeveloped location and the near-surface communities at the developed location each carried 50–53% unique OTUs not shared by any other provenance. In contrast, higher-altitude communities from the developed location carried 68% unshared OTUs.
The relative abundances of the predominant orders in air, soil and snow samples are presented in Figure 3 for each location. Seventeen bacterial orders were present in all sample provenances from the undeveloped location and only seven orders were present in the developed location (Figure 5). We examined the order-level composition of the taxa shared by all four provenances in each location. Rhizobiales and Bacillales were abundant in both the undeveloped and developed locations (totals of 18.2% and 4.1%, respectively). However, Sphingomonadales contributed most to the shared community (42%) in the undeveloped location, while Pseudomonadales predominated the shared community (67%) at the developed location (Figure 5).
We explored this further using a heatmap approach to examine which families were shared most frequently in all provenances (Figure 6). In the undeveloped location, OTUs within Sphingomonadaceae were shared in high abundances among all four sample provenances. Acetobacteraceae were also present in all provenances, but were most abundant in snow and soil, and then decreased in abundance from lower- to higher-altitude air. Many families were disproportionately abundant in soil and snow, indicating a potential lack of airborne dispersal in their life histories, such as Chitinophagaceae, Cytophagaceae, Chthoniobacteraceae and Acidobacteriaceae. Conversely, OTUs within Pasteurellaceae and Microbacteriaceae were more abundant in airborne samples but were either absent or in low abundance in soil and snow. There were several similarities at the developed location. Sphingomonadaceae were also shared by all sample provenances at the developed sites, and the same four orders were disporporationately present in soil and snow. In contrast, Clostridiaceae were most abundant in higher-altitude air samples and Rhizobiaceae, Xanthomonadaceae and Oxalobacteraceae were abundant in snow samples only. While it is not possible to determine whether these communities act as sources or sinks, our results provide evidence that land use affects connectivity between soil, snow and airborne bacterial communities, notably at higher altitudes. Homogenous, higher-altitude communities that traveled over developed land carried more OTUs representative of anthropogenic sources and exhibited less overlap with near-surface atmospheric and terrestrial communities.

4. Discussion

The results of our pilot study suggest that the effects of land use development extend to the composition of higher-altitude airborne bacterial communities, but development also influences the connectivity between airborne bacterial communities and terrestrial sources. The approach we employed provides a framework for describing microbial diversity and dispersal in terms of local and regional taxonomic pools. While small in scale, our results suggest that the land use over which an air mass travels can influence not only the composition of airborne bacterial communities at multiple altitudes, but also the local connectivity between atmospheric and terrestrial bacterial communities. Near-surface air samples over both land uses were affected by local factors that distinguished communities from site to site. Higher-altitude air that traveled over developed land carried bacterial communities that were more homogeneous across the three sampled sites, with higher relative abundances of taxa that are likely anthropogenically associated. Higher-altitude air that traveled over undeveloped land carried more heterogeneous and diverse communities with naturally associated taxa. Taken together, our results suggest that development influences the types of bacterial community connectivity that exist between near-surface, higher-altitude air and terrestrial bacterial sources.
All near-surface airborne bacterial communities in our study carried local, site-specific signatures, regardless of land use. As a result, near-surface communities at either location were no more similar to each other than they were to any higher-altitude communities. This phenomenon has been demonstrated previously with other near-surface air samples [27,28]. Our results indicate that local site effects likely extended to higher altitudes only at the undeveloped location, though verification with further replication and sampling in multiple air masses is necessary to confirm this result. At the developed location, higher-altitude air carried a homogenous community predominated by anthropogenically associated taxa, suggesting connectivity across a regional, instead of local, scale. A proposed mechanism is depicted in the conceptual diagram in Figure S4.
At the undeveloped sampling sites, the air mass we sampled passed over a heterogeneous landscape consisting of open water, forests, wetlands and few human developments. Both near-surface and higher-altitude bacterial communities were equally heterogeneous, and local effects influenced site-to-site variation at both altitudes. As a result, near-surface and higher-altitude communities collected from the same site shared more similar community composition than samples collected from different sites at the same altitude. Furthermore, nearly half of the OTUs present in the air samples at either altitude were shared with snow or soil bacterial communities. The most predominant OTUs shared between air, soil and snow were Sphingomonadales and Rhizobiales, many members of which are plant-associated taxa or are found in freshwater and soil environments (e.g., Sphingomonas [58]; Microbacteriaceae [68]; Methylocystaceae [69]).
In contrast, the air masses we sampled in the developed location passed over predominantly agricultural land. Here, near-surface airborne communities were also distinctive by site, but higher-altitude communities were more homogeneous thanas higher-altitude communities collected at the undeveloped location. In particular, high abundances of spore-forming Firmicutes within the order Clostridiales (e.g., Lachnospiraceae, Clostridiaceae and Ruminococcaceae) present in our higher-altitude samples, as well as those collected in the upper troposphere by others, suggest a large contribution from anthropogenic sources to the regional taxonomic pool, since taxa within these groups are associated with agriculture, livestock and wastewater [34]. Taxa within Firmicutes also predominated near-surface communities at our developed location, as has been demonstrated previously for developed sites located in the Midwestern United States [24,27,36]. However, their prevalence in higher-altitude air suggests that the mechanism for this phenomenon is likely regional transport from agricultural areas in higher-altitude air. It is probable that when this higher-altitude air mixes with near-surface air, anthropogenically associated Firmicutes are introduced at lower altitudes.
Several other studies that have investigated bacterial communities at much higher altitudes have done so over broad geographic scales and using powered aircraft, making the effects of specific local land uses difficult to parse out [10,33,34,35]. In support of our results, Smith and colleagues found that airborne bacterial communities collected at 0.3 to 12 km in altitude over the western United States were similar to the samples we collected at 150 m above the developed sites in this study [34]. These high-altitude samples carried indicators of agriculture, livestock feedlots and wastewater, such as Lachnospiraceae and Ruminococcaceae. The 12-km samples contained higher relative abundances of Clostridiaceae than ground-level air samples [34]. Because of this, we expect that the influence of land use we describe extends to higher altitudes, though it is not possible to conduct this test in the United States with tethered helikite-based sampling due to FAA restrictions [40]. Interestingly, there were no altitudinal differences in the predicted functional pathways for DNA repair that we targeted, though other studies have suggested that UV irradiation and low atmospheric pressure may act as important habitat filters and/or mutagens in samples collected at higher altitudes [35,70,71,72]. We expect that the samples we collected from 150 m were not sufficiently high to detect the effects of UV irradiation and other extreme conditions, which may be more of a consideration in the stratosphere.
The mechanism for atmospheric–terrestrial connectivity between bacterial communities may also be affected by development. While near-surface air shared a similar percentage of OTUs between soil and snow at both the developed and undeveloped locations, over two-thirds of the OTUs carried by higher-altitude air that passed over developed land were not shared with any local soil, snow or near-surface air communities. In contrast to the undeveloped location, the most predominant OTUs shared in the developed location were members of Pseudomonadales, which is a ubiquitous group associated with humans and other animals, food spoilage, wastewater, soil and plants. The similarity between communities collected at higher altitudes above the developed location was over two times greater than above the undeveloped location. Most of the developed area over which this air mass traveled is agricultural, and it is well known that agricultural development can lead to convergence of many ecosystem parameters, including plant communities, soil microbial communities and biogeochemical patterns [73,74]. While our study is small in scale, our results provide evidence that agricultural convergence effects extend to higher-altitude air masses but are not obvious near the surface. While further replication is necessary to confirm this, our data help clarify the observation made by Barberán and colleagues that dust-deposited microbial communities exhibit patterns of development-related homogenization at a continental scale [24]. It is likely that the homogenous regional taxonomic pool from higher altitudes facilitates this pattern, rather than site-specific local pools.
Our results indicate that both near-surface and higher-altitude airborne communities differed by the land use over which the air mass traveled. Furthermore, higher-altitude communities may either be strongly connected to local sources or they may be more connected to regional sources. There are many factors that could cause these patterns. For example, taller trees in an undeveloped forested location could disrupt predominant winds and lead to greater mixing between near-surface and higher-altitude air. A higher bacterial load is also more likely to be present in air samples at developed locations, with dust-borne microorganisms more capable of transport in highly disturbed developed areas. Our approach provides a new framework for addressing how and when connectivity between multiple altitudes in the atmosphere and terrestrial sources are affected by anthropogenic activities. We recognize that in this experimental design, sampling date and location co-vary. We corrected for the effect of date as much as possible by sampling on days that had similar meteorological conditions and wind speeds to minimize differences. Atmospheric mixing in the troposphere is well documented [59,60,61,62], and it is possible that the wind and mixing patterns in Pellston could have led to more mixing between the near-surface and higher-altitude air masses. However, if this were the case, we would have expected to see greater homogenization across all communities and fewer site-specific effects. We also note that due to timing, we needed to sample at the Chickagami site in Pellston one day after the other two sites, and the communities from these samples were more similar to the other undeveloped replicates than developed samples. This observation suggests that location and direction of the prevailing air mass are more influential than date, but a more robust study would need to be completed to address this conclusively.

5. Conclusions

Our study demonstrates a framework for testing the effects of land use on near-surface and higher-altitude microbial communities, which reflect local and regional taxonomic pools, respectively. We observed differences in the type of connectivity between atmospheric and terrestrial communities in developed and undeveloped locations, but we cannot conclude whether soil and snow are sources or sinks for airborne taxa. Further work with greater replication is needed in this area to track whether certain provenances are more likely to act as sources, as well as the physiological parameters that allow certain microbial taxa to be more capable of aerosolization and airborne transport than others. Using the appropriate experimental design, source–sink models can be useful tools that leverage high-throughput sequence data [75]. This could be accomplished with time-series sampling linked to specific terrestrial activities, such as tilling and fertilizing agricultural fields.
Our results provide compelling evidence that agricultural development is linked to convergence in higher-altitude bacterial communities. Further work to demonstrate this effect requires more sampling of airborne communities in developed and undeveloped locations across a broad geographic scale. Other factors such as temporal and seasonal variability [23,29,61], ecosystem type [24], predominant vegetation type [26], agricultural activity [2] and atmospheric pollution [21] also affect the composition of airborne bacterial communities and require further attention.

Supplementary Materials

The following are available online at https://0-www-mdpi-com.brum.beds.ac.uk/1424-2818/13/2/85/s1, Figure S1: Example Images of Sampling with Tethered Helikites; Table S1: Land Cover from Individual Sites; Table S2: Land Cover from Air Mass Trajectories; Table S3: Arduino Atmospheric Data; Figure S2: Collector’s Curves; Figure S3: Community Variation by Location; Table S4: Distinguishing OTUs by Altitude; Figure S4: Conceptual Diagram of Proposed Mechanism.

Author Contributions

Conceptualization, K.M.D., K.M.L., K.D.D., and A.M.S.; methodology, K.M.D., K.M.L., K.D.D., A.M.S., M.M.M., and T.V.K.; formal analysis, K.M.D., K.M.L., A.M.S., and R.L.H.; investigation, K.M.D., K.M.L., K.D.D., A.M.S., M.M.M., T.V.K., and R.L.H.; resources, K.M.D., K.M.L., and R.L.H.; data curation, K.M.D. and A.M.S.; writing—original draft preparation, A.M.S., K.M.D., and R.L.H.; writing—review and editing, A.M.S., K.M.D., R.L.H., K.M.L., K.D.D., M.M.M., and T.V.K.; visualization, A.M.S., K.M.D., and R.L.H.; supervision, K.M.D., K.M.L., and K.D.D.; project administration, K.M.D., K.M.L.; funding acquisition, K.M.D., K.M.L., R.L.H., A.M.S., M.M.M., and K.D.D. All authors have read and agreed to the published version of the manuscript.

Funding

This research was funded by the National Science Foundation, award number 1550748, Western Michigan University’s Lee Honors College, College of Arts and Sciences Interdisciplinary Research Initiative Award and Undergraduate Research and Creative Activities Award.

Institutional Review Board Statement

Not applicable.

Informed Consent Statement

Not applicable.

Data Availability Statement

The sequence reads and metadata are publicly available in the National Center for Biotechnology Information Sequence Read Archive (NCBI SRA) under accession number PRJNA627456.

Acknowledgments

The authors thank Steve Keto, Asylum Lake Preserve Association, Chickagami Trail Association, University of Michigan Biological Station, Adam Schubel and Justin Fox for help with site access, and Douglas Pearce for field assistance.

Conflicts of Interest

The authors declare no conflict of interest.

References

  1. Bowers, R.M.; Lauber, C.L.; Wiedinmyer, C.; Hamady, M.; Hallar, A.G.; Fall, R.; Knight, R.; Fierer, N. Characterization of Airborne Microbial Communities at a High-Elevation Site and Their Potential To Act as Atmospheric Ice Nuclei. Appl. Environ. Microbiol. 2009, 75, 5121–5130. [Google Scholar] [CrossRef] [PubMed] [Green Version]
  2. Schmale, D.G.; Ross, S.D. Highways in the Sky: Scales of Atmospheric Transport of Plant Pathogens. Annu. Rev. Phytopathol. 2015, 53, 591–611. [Google Scholar] [CrossRef] [PubMed] [Green Version]
  3. Burrows, S.M.; Elbert, W.; Lawrence, M.G. Bacteria in the global atmosphere. Atmos. Chem. Phys. 2009, 9, 9263–9280. [Google Scholar] [CrossRef] [Green Version]
  4. Choudoir, M.J.; Barberán, A.; Menninger, H.L.; Dunn, R.R.; Fierer, N. Variation in range size and dispersal capabilities of microbial taxa. Ecology 2018, 99, 322–334. [Google Scholar] [CrossRef] [PubMed] [Green Version]
  5. Roberts, M.S.; Cohan, F. Recombination and migration rates in natural populations of Bacillus subtilis and Bacillus mojavensis. Evolution 1995, 49, 1081–1094. [Google Scholar] [CrossRef] [PubMed]
  6. Seifried, J.S.; Wichels, A.; Gerdts, G. Spatial distribution of marine airborne bacterial communities. Microbiology 2015, 4, 475–490. [Google Scholar] [CrossRef]
  7. Smith, D.J.; Timonen, H.J.; Jaffe, D.A.; Griffin, D.W.; Birmele, M.N.; Perry, K.D.; Ward, P.D.; Roberts, M.S. Intercontinental Dispersal of Bacteria and Archaea by Transpacific Winds. Appl. Environ. Microbiol. 2013, 79, 1134–1139. [Google Scholar] [CrossRef] [Green Version]
  8. Meola, M.; Lazzaro, A.; Zeyer, J. Bacterial Composition and Survival on Sahara Dust Particles Transported to the European Alps. Front. Microbiol. 2015, 6, 1454. [Google Scholar] [CrossRef] [Green Version]
  9. Klein, A.M.; Bohannan, B.J.M.; Jaffe, D.A.; Levin, D.A.; Green, J.L. Molecular Evidence for Metabolically Active Bacteria in the Atmosphere. Front. Microbiol. 2016, 7, 772. [Google Scholar] [CrossRef]
  10. Amato, P.; Joly, M.; Besaury, L.; Oudart, A.; Taib, N.; Moné, A.I.; Deguillaume, L.; Delort, A.-M.; Debroas, D. Active microorganisms thrive among extremely diverse communities in cloud water. PLoS ONE 2017, 12, e0182869. [Google Scholar] [CrossRef] [PubMed] [Green Version]
  11. Gong, J.; Qi, J.; Beibei, E.; Yin, Y.; Gao, D. Concentration, viability and size distribution of bacteria in atmospheric bioaerosols under different types of pollution. Environ. Pollut. 2020, 257, 113485. [Google Scholar] [CrossRef]
  12. Möhler, O.; DeMott, P.J.; Vali, G.; Levin, Z. Microbiology and atmospheric processes: The role of biological particles in cloud physics. Biogeosciences 2007, 4, 2559–2591. [Google Scholar] [CrossRef] [Green Version]
  13. Evans, S.E.; Dueker, M.E.; Logan, J.R.; Weathers, K.C. The biology of fog: Results from coastal Maine and Namib Desert reveal common drivers of fog microbial composition. Sci. Total. Environ. 2019, 647, 1547–1556. [Google Scholar] [CrossRef]
  14. Jones, S.E.; Newton, R.J.; McMahon, K.D. Potential for atmospheric deposition of bacteria to influence bacterioplankton communities. FEMS Microbiol. Ecol. 2008, 64, 388–394. [Google Scholar] [CrossRef]
  15. Kaushik, R.; Balasubramanian, R.; Dunstan, H. Microbial Quality and Phylogenetic Diversity of Fresh Rainwater and Tropical Freshwater Reservoir. PLoS ONE 2014, 9, e100737. [Google Scholar] [CrossRef] [PubMed]
  16. Evans, S.E.; Bell-Dereske, L.P.; Dougherty, K.M.; Kittredge, H.A. Dispersal alters soil microbial community response to drought. Environ. Microbiol. 2020, 22, 905–916. [Google Scholar] [CrossRef]
  17. Fröhlich-Nowoisky, J.; Kampf, C.J.; Weber, B.; Huffman, J.A.; Pöhlker, C.; Andreae, M.O.; Lang-Yona, N.; Burrows, S.M.; Gunthe, S.S.; Elbert, W.; et al. Bioaerosols in the Earth system: Climate, health, and ecosystem interactions. Atmos. Res. 2016, 182, 346–376. [Google Scholar] [CrossRef] [Green Version]
  18. Oie, S.; Kamiya, A. Bacterial contamination of aerosol solutions containing antibiotics. Microbios 1995, 82, 109–113. [Google Scholar]
  19. Solans, X.; Alonso, R.M.; Constans, A.; Alfonso, M. Exposición laboral a hongos y bacterias ambientales en una planta de selección de residuos de envases. Rev. Iberoam. Micol. 2007, 24, 131–135. [Google Scholar] [CrossRef]
  20. Thomas, M.; Jarobe, G.; Frazer, R. Infection Control in the Dental Office. Dent. Clin. N. Am. 2008, 52, 609–628. [Google Scholar] [CrossRef]
  21. Brodie, E.L.; DeSantis, T.Z.; Parker, J.P.M.; Zubietta, I.X.; Piceno, Y.M.; Andersen, G.L. Urban aerosols harbor diverse and dynamic bacterial populations. Proc. Natl. Acad. Sci. USA 2006, 104, 299–304. [Google Scholar] [CrossRef] [Green Version]
  22. Bertolini, V.; Gandolfi, I.; Ambrosini, R.; Bestetti, G.; Innocente, E.; Rampazzo, G.; Franzetti, A. Temporal variability and effect of environmental variables on airborne bacterial communities in an urban area of Northern Italy. Appl. Microbiol. Biotechnol. 2012, 97, 6561–6570. [Google Scholar] [CrossRef] [Green Version]
  23. Bowers, R.M.; Clements, N.; Emerson, J.B.; Wiedinmyer, C.; Hannigan, M.P.; Fierer, N. Seasonal Variability in Bacterial and Fungal Diversity of the Near-Surface Atmosphere. Environ. Sci. Technol. 2013, 47, 12097–12106. [Google Scholar] [CrossRef] [PubMed]
  24. Barberán, A.; Ladau, J.; Leff, J.W.; Pollard, K.S.; Menninger, H.L.; Dunn, R.R.; Fierer, N. Continental-scale distributions of dust-associated bacteria and fungi. Proc. Natl. Acad. Sci. USA 2015, 112, 5756–5761. [Google Scholar] [CrossRef] [PubMed] [Green Version]
  25. Li, J.; Zhou, L.; Zhang, X.; Xu, C.; Dong, L.; Yao, M. Bioaerosol emissions and detection of airborne antibiotic resistance genes from a wastewater treatment plant. Atmos. Environ. 2016, 124, 404–412. [Google Scholar] [CrossRef]
  26. Lymperopoulou, D.S.; Adams, R.I.; Lindow, S.E. Contribution of Vegetation to the Microbial Composition of Nearby Outdoor Air. Appl. Environ. Microbiol. 2016, 82, 3822–3833. [Google Scholar] [CrossRef] [Green Version]
  27. Docherty, K.M.; Pearce, D.S.; Lemmer, K.M.; Hale, R.L. Distributing regionally, distinguishing locally: Examining the underlying effects of local land use on airborne bacterial biodiversity. Environ. Microbiol. 2018, 20, 3529–3542. [Google Scholar] [CrossRef]
  28. Mhuireach, G.Á.; Betancourt-Román, C.M.; Green, J.L.; Johnson, B.R. Spatiotemporal Controls on the Urban Aerobiome. Front. Ecol. Evol. 2019, 7, 43. [Google Scholar] [CrossRef] [Green Version]
  29. Bowers, R.M.; McLetchie, S.; Knight, R.; Fierer, N. Spatial variability in airborne bacterial communities across land-use types and their relationship to the bacterial communities of potential source environments. ISME J. 2010, 5, 601–612. [Google Scholar] [CrossRef] [PubMed] [Green Version]
  30. Mhuireach, G.; Johnson, B.R.; Altrichter, A.E.; Ladau, J.; Meadow, J.F.; Pollard, K.S.; Green, J.L. Urban greenness influences airborne bacterial community composition. Sci. Total. Environ. 2016, 571, 680–687. [Google Scholar] [CrossRef] [Green Version]
  31. Groffman, P.M.; Cavender-Bares, J.; Bettez, N.D.; Grove, J.M.; Hall, S.J.; Heffernan, J.B.; Hobbie, S.E.; Larson, K.L.; Morse, J.L.; Neill, C.; et al. Ecological homogenization of urban USA. Front. Ecol. Environ. 2014, 12, 74–81. [Google Scholar] [CrossRef] [Green Version]
  32. Karlsson, E.; Johansson, A.-M.; Ahlinder, J.; Lundkvist, M.J.; Singh, N.J.; Brodin, T.; Forsman, M.; Stenberg, P. Airborne microbial biodiversity and seasonality in Northern and Southern Sweden. PeerJ 2020, 8, e8424. [Google Scholar] [CrossRef] [Green Version]
  33. DeLeon-Rodriguez, N.; Lathem, T.L.; Rodriguez, R.L.M.; Barazesh, J.M.; Anderson, B.E.; Beyersdorf, A.J.; Ziemba, L.D.; Bergin, M.; Nenes, A.; Konstantinidis, K.T. Microbiome of the upper troposphere: Species composition and prevalence, effects of tropical storms, and atmospheric implications. Proc. Natl. Acad. Sci. USA 2013, 110, 2575–2580. [Google Scholar] [CrossRef] [PubMed] [Green Version]
  34. Smith, D.J.; Ravichandar, J.D.; Jain, S.; Griffin, D.W.; Yu, H.; Tan, Q.; Thissen, J.; Lusby, T.; Nicoll, P.; Shedler, S.; et al. Airborne Bacteria in Earth’s Lower Stratosphere Resemble Taxa Detected in the Troposphere: Results From a New NASA Aircraft Bioaerosol Collector (ABC). Front. Microbiol. 2018, 9, 1752. [Google Scholar] [CrossRef]
  35. Smith, D.J.; Griffin, D.W.; McPeters, R.D.; Ward, P.D.; Schuerger, A.C. Microbial survival in the stratosphere and implications for global dispersal. Aerobiology 2011, 27, 319–332. [Google Scholar] [CrossRef]
  36. Bowers, R.M.; Sullivan, A.P.; Costello, E.K.; Collett, J.L.; Knight, R.; Fierer, N. Sources of Bacteria in Outdoor Air across Cities in the Midwestern United States. Appl. Environ. Microbiol. 2011, 77, 6350–6356. [Google Scholar] [CrossRef] [Green Version]
  37. Adhikari, A.; Reponen, T.; Grinshpun, S.A.; Martuzevicius, D.; Lemasters, G. Correlation of ambient inhalable bioaerosols with particulate matter and ozone: A two-year study. Environ. Pollut. 2006, 140, 16–28. [Google Scholar] [CrossRef]
  38. Park, J.; Ichijo, T.; Nasu, M.; Yamaguchi, N. Investigation of bacterial effects of Asian dust events through comparison with seasonal variability in outdoor airborne bacterial community. Sci. Rep. 2016, 6, 35706. [Google Scholar] [CrossRef] [PubMed] [Green Version]
  39. Tipton, L.; Zahn, G.; Datlof, E.; Kivlin, S.N.; Sheridan, P.; Amend, A.S.; Hynson, N.A. Fungal aerobiota are not affected by time nor environment over a 13-y time series at the Mauna Loa Observatory. Proc. Natl. Acad. Sci. USA 2019, 116, 25728–25733. [Google Scholar] [CrossRef] [PubMed] [Green Version]
  40. Federal Aviation Adminstration of the United States of America. Code of Federal Regulations: Moored Balloons, Kites, Amateur Rockets, Unmanned Free Balloons and Certain Model Aircraft 1963-2016, Section 101.1–101.7. Available online: https://rgl.faa.gov/regulatory_and_guidance_library/rgfar.nsf/farsbysect?openview&count=-1&restricttocategory=part+101 (accessed on 25 January 2021).
  41. Homer, C.; Dewitz, J.; Yang, L.; Jin, S.; Danielson, P.; Xian, G.; Coulston, J.; Herold, N.; Wickham, J.; Megown, K. Completion of the 2011 National Land Cover Database for the Conterminous United States—Representing a Decade of Land Cover Change Information. Photogramm. Eng. Remote Sens. 2015, 81, 346–354. [Google Scholar] [CrossRef]
  42. Spring, A.M.; Docherty, K.M.; Domingue, K.D.; Kerber, T.V.; Mooney, M.M.; Lemmer, K.M. A Method for Collecting Atmospheric Microbial Samples from Set Altitudes for Use with Next-Generation Sequencing Techniques to Characterize Communities. Air Soil Water Res. 2018, 11, 1–12. [Google Scholar] [CrossRef]
  43. Caporaso, J.G.; Kuczynski, J.; Stombaugh, J.; Bittinger, K.; Bushman, F.D.; Costello, E.K.; Fierer, N.; Peña, A.G.; Goodrich, J.K.; Gordon, J.I.; et al. QIIME Allows Analysis of High-Throughput Community Sequencing data. Nat. Methods 2010, 7, 335–336. [Google Scholar] [CrossRef] [Green Version]
  44. Masella, A.P.; Bartram, A.K.; Truszkowski, J.M.; Brown, D.G.; Neufeld, J.D. PANDAseq: Paired-end assembler for illumina sequences. BMC Bioinform. 2012, 13, 31. [Google Scholar] [CrossRef] [Green Version]
  45. Rognes, T.; Flouri, T.; Nichols, B.; Quince, C.; Mahé, F. VSEARCH: A versatile open source tool for metagenomics. PeerJ 2016, 4, e2584. [Google Scholar] [CrossRef] [PubMed]
  46. Pearce, D.S.; Hoover, B.A.; Jennings, S.; Nevitt, G.A.; Docherty, K.M. Morphological and genetic factors shape the microbiome of a seabird species (Oceanodroma leucorhoa) more than environmental and social factors. Microbiome 2017, 5, 146. [Google Scholar] [CrossRef] [Green Version]
  47. Quast, C.; Pruesse, E.; Yilmaz, P.; Gerken, J.; Schweer, T.; Yarza, P.; Peplies, J.; Glöckner, F.O. The SILVA Ribosomal RNA Gene Database Project: Improved Data Processing and Web-Based Tools. Nucleic Acids Res. 2012, 41, D590–D596. [Google Scholar] [CrossRef] [PubMed]
  48. Laurence, M.; Hatzis, C.; Brash, D.E. Common Contaminants in Next-Generation Sequencing That Hinder Discovery of Low-Abundance Microbes. PLoS ONE 2014, 9, e97876. [Google Scholar] [CrossRef]
  49. Weiss, S.; Xu, Z.Z.; Peddada, S.; Amir, A.; Bittinger, K.; Gonzalez, A.; Lozupone, C.; Zaneveld, J.R.; Vázquez-Baeza, Y.; Birmingham, A.; et al. Normalization and microbial differential abundance strategies depend upon data characteristics. Microbiome 2017, 5, 1–18. [Google Scholar] [CrossRef] [PubMed] [Green Version]
  50. DeSantis, T.Z.; Hugenholtz, P.; Larsen, N.; Rojas, M.; Brodie, E.L.; Keller, K.; Huber, T.; Dalevi, D.; Hu, P.; Andersen, G.L. Greengenes, a chimera-checked 16S rRNA gene database and workbench compatible with ARB. Appl. Environ. Microbiol. 2006, 72, 5069–5072. [Google Scholar] [CrossRef] [Green Version]
  51. Langille, M.G.I.; Zaneveld, J.; Caporaso, J.G.; McDonald, D.; Knights, D.; Reyes, J.A.; Clemente, J.C.; Burkepile, D.E.; Thurber, R.L.V.; Knight, R.; et al. Predictive functional profiling of microbial communities using 16S rRNA marker gene sequences. Nat. Biotechnol. 2013, 31, 814–821. [Google Scholar] [CrossRef]
  52. Ogata, H.; Goto, S.; Sato, K.; Fujibuchi, W.; Bono, H.; Kanehisa, M. KEGG: Kyoto Encyclopedia of Genes and Genomes. Nucleic Acids Res. 1999, 27, 29–34. [Google Scholar] [CrossRef] [PubMed] [Green Version]
  53. Stein, A.F.; Draxler, R.R.; Rolph, G.D.; Stunder, B.J.B.; Cohen, M.D.; Ngan, F. NOAA’s HYSPLIT Atmospheric Transport and Dispersion Modeling System. Bull. Am. Meteorol. Soc. 2015, 96, 2059–2077. [Google Scholar] [CrossRef]
  54. Lozupone, C.; Knight, R. UniFrac: A New Phylogenetic Method for Comparing Microbial Communities. Appl. Environ. Microbiol. 2005, 71, 8228–8235. [Google Scholar] [CrossRef] [Green Version]
  55. Oksanen, J.; Blanchet, F.G.; Friendly, M. Community Ecology Package: “Vegan”, version 2.5-6; Springer: Berlin/Heidelberg, Germany, 2019. [Google Scholar]
  56. Clarke, K.R. Non-parametric multivariate analyses of changes in community structure. Aust. J. Ecol. 1993, 18, 117–143. [Google Scholar] [CrossRef]
  57. Chen, H.; Boutros, P.C. VennDiagram: A package for the generation of highly-customizable Venn and Euler diagrams in R. BMC Bioinform. 2011, 12, 35. [Google Scholar] [CrossRef] [PubMed] [Green Version]
  58. Glaeser, S.P.; Kämpfer, P. The Family Sphingomonadaceae. In The Prokaryotes: Alphaproteobacteria and Betaproteobacteria; Rosenberg, E., DeLong, E.F., Lory, S., Stackebrandt, E., Thompson, F., Eds.; Springer: Berlin/Heidelberg, Germany, 2014; pp. 641–707. [Google Scholar]
  59. Average Weather at Pellston Regional Airport of Emmet County. Available online: https://weatherspark.com/y/146680/Average-Weather-at-Pellston-Regional-Airport-of-Emmet-County-Michigan-United-States-Year-Round (accessed on 2 May 2020).
  60. Average Weather at Kalamazoo-Battle Creek International Airport. Available online: https://weatherspark.com/y/146615/Average-Weather-at-Kalamazoo-Battle-Creek-International-Airport-Michigan-United-States-Year-Round (accessed on 2 May 2020).
  61. Fierer, N.; Liu, Z.; Rodríguez-Hernández, M.; Knight, R.; Henn, M.; Hernandez, M.T. Short-Term Temporal Variability in Airborne Bacterial and Fungal Populations. Appl. Environ. Microbiol. 2007, 74, 200–207. [Google Scholar] [CrossRef] [Green Version]
  62. Li, C.-S.; Huang, T.-Y. Fluorochrome in Monitoring Indoor Bioaerosols. Aerosol Sci. Technol. 2006, 40, 237–241. [Google Scholar] [CrossRef]
  63. Shokralla, S.; Spall, J.L.; Gibson, J.F.; Hajibabaei, M. Next-generation sequencing technologies for environmental DNA research. Mol. Ecol. 2012, 21, 1794–1805. [Google Scholar] [CrossRef]
  64. Behzad, H.; Gojobori, T.; Mineta, K. Challenges and Opportunities of Airborne Metagenomics. Genome Biol. Evol. 2015, 7, 1216–1226. [Google Scholar] [CrossRef] [Green Version]
  65. Fahlgren, C.; Hagström, A.; Nilsson, D.; Zweifel, U.L. Annual Variations in the Diversity, Viability, and Origin of Airborne Bacteria. Appl. Environ. Microbiol. 2010, 76, 3015–3025. [Google Scholar] [CrossRef] [Green Version]
  66. Kembel, S.W.; Meadow, J.F.; O’Connor, T.K.; Mhuireach, G.; Northcutt, D.; Kline, J.; Moriyama, M.; Brown, G.Z.; Bohannan, B.J.M.; Green, J.L. Architectural Design Drives the Biogeography of Indoor Bacterial Communities. PLoS ONE 2014, 9, e87093. [Google Scholar] [CrossRef]
  67. Jones, S.E.; Lennon, J.T. Dormancy contributes to the maintenance of microbial diversity. Proc. Natl. Acad. Sci. USA 2010, 107, 5881–5886. [Google Scholar] [CrossRef] [PubMed] [Green Version]
  68. Evtushenko, L.I.; Takeuchi, M. The Family Microbacteriaceae. In The Prokaryotes: Volume 3: Archaea. Bacteria: Firmicutes, Actinomycetes; Dworkin, M., Falkow, S., Rosenberg, E., Schleifer, K.-H., Stackebrandt, E., Eds.; Springer: New York, NY, USA, 2006; pp. 1020–1098. [Google Scholar]
  69. Webb, H.K.; Ng, H.J.; Ivanova, E.P. The Family Methylocystaceae. In The Prokaryotes: Alphaproteobacteria and Betaproteobacteria; Rosenberg, E., DeLong, E.F., Lory, S., Stackebrandt, E., Thompson, F., Eds.; Springer: Berlin/Heidelberg, Germany, 2014; pp. 341–347. [Google Scholar]
  70. Chudobova, D.; Cihalova, K.; Jelinkova, P.; Zitka, J.; Nejdl, L.; Guran, R.; Klimanek, M.; Adam, V.; Kizek, R. Effects of Stratospheric Conditions on the Viability, Metabolism and Proteome of Prokaryotic Cells. Atmosphere 2015, 6, 1290–1306. [Google Scholar] [CrossRef] [Green Version]
  71. Waters, S.M.; Zeigler, D.R.; Nicholson, W.L. Experimental Evolution of Enhanced Growth by Bacillus subtilis at Low Atmospheric Pressure: Genomic Changes Revealed by Whole-Genome Sequencing. Appl. Environ. Microbiol. 2015, 81, 7525–7532. [Google Scholar] [CrossRef] [Green Version]
  72. Khodadad, C.L.; Wong, G.M.; James, L.M.; Thakrar, P.J.; Lane, M.A.; Catechis, J.A.; Smith, D.J. Stratosphere Conditions Inactivate Bacterial Endospores from a Mars Spacecraft Assembly Facility. Astrobiology 2017, 17, 337–350. [Google Scholar] [CrossRef] [PubMed] [Green Version]
  73. Soares-Filho, B.S.; Nepstad, D.C.; Curran, L.M.; Cerqueira, G.C.; Garcia, R.A.; Ramos, C.A.; Voll, E.; McDonald, A.; Lefebvre, P.; Schlesinger, P. Modelling conservation in the Amazon basin. Nat. Cell Biol. 2006, 440, 520–523. [Google Scholar] [CrossRef]
  74. Rodrigues, J.L.M.; Pellizari, V.H.; Mueller, R.; Baek, K.; Jesus, E.D.C.; Paula, F.S.; Mirza, B.; Hamaoui, G.S.; Tsai, S.M.; Feigl, B.; et al. Conversion of the Amazon rainforest to agriculture results in biotic homogenization of soil bacterial communities. Proc. Natl. Acad. Sci. USA 2012, 110, 988–993. [Google Scholar] [CrossRef] [PubMed] [Green Version]
  75. Knights, D.; Kuczynski, J.; Charlson, E.S.; Zaneveld, J.; Mozer, M.C.; Collman, R.G.; Bushman, F.D.; Knight, R.T.; Kelley, S.T. Bayesian community-wide culture-independent microbial source tracking. Nat. Methods 2011, 8, 761–763. [Google Scholar] [CrossRef] [PubMed] [Green Version]
Figure 1. Site locations and land use from air mass trajectories. (A) Locator map highlighting Michigan, USA. (B) Average backwards trajectories calculated for sites sampled in Kalamazoo, MI, USA (developed location in the south), and sites sampled in Pellston, MI, USA (undeveloped location in the north). Red lines indicate high-altitude air mass trajectories (150 m), and blue lines indicate near-surface air mass trajectories (less than 2 m), during the 6 h of sampling time. (C) A 10,000-m land use buffer surrounding each backward trajectory of air mass for the two sampled locations. Table S1 shows land use percentages for each of the trajectory buffers.
Diversity 13 00085 g001
Figure 2. Bacterial orders by altitude. Average abundances of bacterial orders were calculated for each category, which included three samples each for near-surface (<2 m) and higher-altitude (150 m) air in both forested/undeveloped and agricultural developed locations. Average relative abundances of the bacterial orders that make up 1% or more of all air samples are shown. Key indicates the average abundance of operational taxonomic units (OTUs) per order in each set of samples.
Diversity 13 00085 g002
Figure 3. Average relative abundances of bacterial orders. Bubble plot indicating the average relative abundances of bacterial orders that are at least 2% abundant in any sample. Orders (indicated by colored circles) and phyla (indicated by brackets) from each sample are shown for provenance in the undeveloped (n = 2) and developed (n = 3) locations. The size of each bubble represents the percent relative abundance group indicated in the key at the bottom of the figure.
Diversity 13 00085 g003
Figure 4. Principal coordinates analysis (PCoA) ordinations based on weighted UniFrac distances (Figure 1) of variation in communities at the (A) undeveloped location and (B) developed location. Altitude did not explain a significant amount of variation in the undeveloped location (envfit, R2 = 0.0199, p = 0.9); altitude explained 67% of variation in developed communities (envfit, R2 = 0.6724, p = 0.2).
Diversity 13 00085 g004
Figure 5. Venn diagrams showing OTU overlap between four sampling provenances: near-surface air, higher-altitude air, soil and snow at the (A) undeveloped and (B) developed locations. Inlaid pie graphs indicate the community composition of the OTUs shared by all four provenances.
Diversity 13 00085 g005
Figure 6. Average number of OTUs for each category of samples. For each category, two samples were averaged. Names in brackets are candidate taxa. The 30 most abundant families are shown. Bacterial communities in soil or snow samples did not vary by site within each location (permanova: undeveloped location, p = 0.79; developed location, p = 0.815) or between the developed and undeveloped locations (permanova: soil, p = 0.218; snow, p = 0.38). Soil samples were three times more diverse than snow samples and nine times more diverse than air samples. A number of bacterial families were present in air samples that were absent from snow and soil samples, notably, Prevotellaceae, Pasteurellaceae and Streptococcaceae. Other families such as Clostridiaceae, Bacillaceae, Lachnospiraceae and Ruminococcaceae were present in communities from all provenances, but were more abundant in air samples.
Diversity 13 00085 g006
Publisher’s Note: MDPI stays neutral with regard to jurisdictional claims in published maps and institutional affiliations.

