
Fawn Counts and Adult Female Site Use Are Mismatched Indicators of Habitat Quality in an Endangered Deer


1
Department of Applied Ecology, North Carolina State University, Raleigh, NC 27695, USA
2
Department of Wildlife Ecology and Conservation, University of Florida, 110 Newins Ziegler Hall, Gainesville, FL 32611, USA
3
North Carolina Museum of Natural Sciences, Raleigh, NC 27601, USA
*
Author to whom correspondence should be addressed.
Diversity 2021, 13(2), 92; https://0-doi-org.brum.beds.ac.uk/10.3390/d13020092
Submission received: 31 December 2020
/
Revised: 12 February 2021
/
Accepted: 18 February 2021
/
Published: 21 February 2021
(This article belongs to the Special Issue Global Patterns of Endemic and Threatened Species in Relation to Environment and Habitat)
Abstract
:Many ungulates are spotted as neonates. This trait is unique to individuals, making their identification feasible from remote cameras. Key deer (Odocoileus virginianus clavium) are an endangered subspecies of white-tailed deer endemic to the lower Florida Keys, U.S.A. Habitat loss and hunting were historical drivers of population decline but recent studies report positive associations of key deer with urbanization. Using opposing camera traps at 56 sites throughout the National Key Deer Refuge on Big Pine Key, we used spot patterns to uniquely identify and estimate fawn abundance with N-mixture models. We further compared those inferences to models informed by adult doe counts to see how well tracking adult females alone corresponded with fawn habitat associations. Our results indicated that fawn abundance was negatively associated with increasing elevation and human trails, contrary to models based on adult female observations alone. The lowest elevations where fawns were most abundant were associated with dense wetland plant communities, which were likely selected for thermal cover and warrant further investigation given that those areas are most vulnerable to sea-level rise. Our methods showcase the utility of identifying neonates from camera trap photos and draw attention to possible misaligned inferences when tracking adult females in isolation.
1. Introduction
Large herbivores, particularly ungulates, are some of the most important mammal community members for their roles as plant predators and seed dispersers globally. However, these species are also broadly threatened due to habitat loss and hunting pressure where regulations or their enforcement are limited [1,2]. Additionally, these species are economically important in many countries where there is regulated harvest and their presence leads to conservation gains in the environment [3,4]. Given these important roles and regulations, many government institutions and researchers have implemented long-term monitoring programs to inform management of ungulate populations [5,6].
The key deer (Odocoileus virginianus clavium) is an endangered subspecies of white-tailed deer that is endemic to the lower Florida Keys in the United States. Since the 1950s, key deer have received attention due to historic population declines associated with hunting and an increasing human presence in the Florida Keys prior to their listing on the Endangered Species List in 1967 [7]. Increasing urbanization has led to the development of major roadways and fragmentation throughout their remaining habitat, with contemporary key deer habitat use often associated with these urban areas [7]. Contemporary threats include vehicular collisions, particularly along US Route 1, habituation to humans and supplemental feeding [7,8,9], as well as a new world screwworm (Cochliomyia hominivorax) outbreak and near direct strike from Hurricane Irma in 2017 [10].
Multiple techniques have been used to track the key deer population over time [8,9]. These techniques included using road-based distance sampling, traditional mark-recapture, and tracking road-mortality to obtain useful population-level information [11]. Some of these methods have proven insufficient due to low precision estimates and logistical and resource constraints [7]. Villanova et al. [12] used fecal DNA and spatially explicit capture–recapture methods to estimate the global population of approximately 1000 individuals.
Camera traps are commonly used as a noninvasive method to survey wildlife [13,14]. They are particularly useful to obtain data to estimate population sizes of species that are uniquely identifiable [15]. While adult male white-tailed deer are uniquely identifiable for a portion of the year based on antler characteristics [5,16]; adult females are less reliably identifiable. However, fawns are born with spot patterns that can be used to uniquely identify individuals with camera traps [17]. Therefore, we predicted that using uniquely identified individual fawns from camera trap surveys could provide robust insights about important habitat requirements for population recruitment beyond using counts of adult deer for inferences. Here, we identified key deer fawns based on their spot patterns and used N-mixture models to estimate site-level fawn abundance based on habitat associations, and then examined how those patterns aligned with detections of adult females.
2. Materials and Methods
We used camera trap data from surveys conducted on the National Key Deer Refuge, and other public lands managed by the U.S. Fish and Wildlife Service, on Big Pine Key, FL, USA. The refuge habitat contains four primary land covers along an elevational gradient across lowland to upland habitats. The lowland habitats consist of: (1) buttonwood (Conocarpus erectus) transition zones with saltwater marsh grasses (Spartina spp.) and scrub mangroves (e.g., red (Rhizophora mangle), black (Avicennia germinans), and white (Laguncularia racemose)); (2) freshwater marshes with saw grasses (Cladium spp. [18]); and the remaining upland habitat is made up of mostly (3) pine (Pinus elliottii) rocklands; and (4) tropical hardwood hammocks (e.g., pigeon plum (Coccoloba diversifolia), poisonwood (Metopium toxiferum), and gumbo-limbo (Bursera simaruba), etc. [18]).
The initial camera sampling design was implemented as part of a survey of mesopredators and endangered small mammals [19,20]. We used the bycatch camera trap images of key deer does and fawns to examine their habitat associations. Eighty-four sites were surveyed between 16 April–2 June 2014, but only a subset of those sites was included in analyses of fawns due to the timing of the fawning season. Therefore, camera trap data for fawn analyses came from 56 sites surveyed from 1 May to 2 June 2014. Cameras were left active at each site for 15–16 days, whereas the total sampling period occurred over 32 days. We considered these sites to be unbiased for key deer surveys because they are representative of the entire wildlife refuge and the encompassing habitats.
We established camera trap locations along game trails and natural funnels to ensure high detection rates of target species [20]. Each camera site had two opposing camera traps (Reconyx PC800 or PC850, RECONYX, Inc., Holmen, WI, USA) set to take 10 photos once triggered with no delay between additional triggers, to identify a high proportion of adult does and individual fawns.
We extracted all key deer doe and fawn detection data from the cameras. Does were distinguished from bucks based on the absence of antlers or antler buds but were excluded in cases where the head was absent from the photo and other external genitalia were not visible. For fawn data, we only included young of the year with spots and selected one photo of either or both flanks of the fawn from each individual detection sequence. We cropped each of the images of fawns to contain only that flank for examination. We then entered all of the cropped photos of the left flanks of the fawns into Wild-ID 1.0 [21], and the algorithm presented all potential matches. Once all potential matches were either manually accepted or rejected, Wild-ID created a matrix that congregated all the matches and individuals without matches. We then repeated this process for all the right flank images of fawns. All the individuals were either matched by both flanks or determined to only be identified by their left or right flank in cases where the individual was not detected by the paired camera trap, which we accounted for in our analyses. The workflow of individual identification is presented in Figure 1. We visually confirmed and validated all flank matches.
We measured habitat covariates that we identified a priori as potentially important drivers of key deer fawn abundance on Big Pine Key (Figure 2). We included the presence of human trails as a binary covariate if camera stations were located directly on (1) or off (0) trails, because we suspected that human foot traffic would directly affect doe habitat use and fawn abundance. Previous research has suggested that key deer prefer upland habitats including pine rocklands and upland hammocks [7], so we used a LiDar-derived digital elevation model to examine these habitat associations at a high resolution. We calculated the mean elevation within a 25 m buffer centered on the cameras because elevation is the driver of habitat changes in the Keys, but also reflects the susceptibility of sites to flooding and saltwater incursion from storms and hurricanes [22]. We used a buffer-wide average because some sites were artificially elevated on old roads and berms. Human development is common throughout Big Pine Key, and we suspected that development would affect the distribution and abundance of key deer does and fawns [7,23]; therefore, we measured the linear distance of all camera sites to the nearest residential development. We further measured the distance to the road to account for road-specific effects on deer distributions over development alone.
We used N-mixture models that account for imperfect and heterogeneous detection [24] to estimate local site fawn abundance and doe detection rates associated with the habitat characteristics. These models have been applied to effectively estimate white-tailed deer populations in controlled experiments [25]. We used individual counts of fawns identified from their right and left flanks as the two repeated surveys at each site. Therefore, detection probability was related to the cameras’ sensitivity and animal movement in the sensory zones of cameras, and less affected by confounding effects of habitat or individual availability. We then modeled the counts of doe key deer from each opposing camera trap as our two repeated surveys and included potential site-effects on detection probability. We first modeled site fawn abundance and doe counts with a Poisson distribution followed by a negative binomial (NB) distribution to account for overdispersion to determine the most appropriate distribution for further models. We then compared six a priori models with an information–theoretic approach, in which we modeled fawn abundance and doe detection rates as (1) constant or as a function of (2) elevation, (3) distance to development, (4) distance to road, or (5) binary trail covariates, as well as an additive model of (6) anthropogenic effects that included trails and distances to developments (Table 1). We included human trails as a detection covariate in all doe count models because site occurrence on trails was supported over a constant detection model. The models followed a hierarchical structure, in that each model had an intercept for the detection and abundance estimates plus an additional estimate for dispersion (minimum K = 3 parameters). Additional parameters corresponded with each additional covariate on either detection (only in doe models) or abundance (fawn and doe models). We considered models to have substantial support if they were within <2 ΔAICc units, received more model support than the null model, and if the confidence intervals associated with covariate relationships excluded 0 [26]. We implemented these models in the “unmarked” package [27], within the computational software R v.3.0.2 [28].
3. Results
3.1. Fawn Identification
We obtained 381 detections of key deer fawns. There were 203 detections of the left flanks of fawns and 178 detections of the right flanks of fawns. Of these, we were able to match 49 individuals with both left and right flanks detected by both opposing cameras on 115 occasions. There were 33 individuals with right flank only detections and 28 individuals with left flank only detections. We cannot positively confirm that the deer with left flank only or right flank only images were distinct individuals; therefore, we know there were a minimum of 82 and a maximum of 110 individual fawns identified. After manually confirming individuals with matches and those without matches, we determined that Wild-ID missed 24.74% of right flank matches and 36.49% of left flank individuals.
3.2. Fawn Models
Site-level abundance of key deer fawns was associated with several covariates, with no single model receiving >95% of the Akaike weight (Table 1). Elevation was the most supported covariate model related to fawn abundance. As elevation increased, the abundance of fawns decreased (βe = −0.956 ± 0.351 SE). The next supported model included anthropogenic factors including the presence of human trails and distance from development. The presence of a trail was negatively related (βt = −0.601 ± 0.351 SE) to fawn abundance, while the increasing distance from development was positively related to abundance of fawns (βd = 0.002 ± 0.001 SE). Distance from development was further supported in the third top model, with a weak, but positive relationship (βd = 0.002 ± 0.001 SE). Additional covariate relationships from less supported models are presented in Table 1.
3.3. Doe Models
We detected adult key deer does on 705 occasions and 667 occasions from the two opposing cameras across all 56 sites. The site-level detection rates of key deer does were associated with several covariates, with no single model receiving >95% of the Akaike weight; however, the null NB model was the second most supported after the elevation model (Table 2). Similar to fawn models, elevation was the most supported covariate model related to adult doe detection rates, although covariate associations were in opposition. As elevation increased, the detection rates of adult key deer does increased (βe = 0.456 ± 0.256 SE). Contrary to our a priori predictions, key deer doe detection probability was negatively associated with site occurrence on human trails (βt = −0.354 ± 0.179 SE). Although additional models received support, the covariate associations and their 95% confidence intervals strongly overlapped 0.
4. Discussion
Our results reveal that unique identification of fawns based on spot patterns can be helpful for estimating fawn population size, habitat associations, and potential recruitment. More notably, the habitat associations of fawn abundance increasing at lower elevations and decreasing on human trails are mismatched with the inferences from doe counts. These opposing patterns could be problematic if doe counts in isolation are used to inform management. This method is widely applicable for different research studies and management strategies pertaining to all deer and other ungulates with spotted offspring.
Furthermore, adopting this method to reduce double-counting fawns when calculating fawn to doe ratios could reduce biases in these commonly used management metrics. For example, Chitwood et al. [29] determined the recruitment rate of fawns by dividing the total number of fawn photos by the total number of adult female deer photos. While that method was relatively consistent with simultaneously collected radio-tag data, accounting for individual fawns as we did herein may further refine the precision of recruitment estimates.
We used the Wild-ID program [21], which provided a method for creating preliminary matches, but required verification and manual matching of those individual matches that were missed. We determined that Wild-ID misclassified ~25–36% of individual matches. This suggests that even after using a computer-aided algorithm to make individual matches, researchers still need to manually review all fawn photos to confirm and/or add additional matches in individual detection history databases. Newer artificial intelligence methods [30] will likely improve the matching ability of automated identification in future projects, making this a useful method for deer fawn abundance estimation at larger scales.
Our N-mixture model results suggested that there was a strong positive association between fawn counts and lower elevations, which is contrary to previous research following radio-tagged adult key deer and fawns [7,23]. Fawn abundance was positively related to low lying habitats with dense grasses (e.g., Cladium and Spartina) and shrub cover that are more typical of lower elevations than in the upland habitats. These trends correspond with bedding and parturition sites selected by many mainland white-tailed deer populations [31,32]. Although our results suggest that fawns occurred more densely in lowlands and coastal transition zones, adult female counts exhibited the opposite pattern of higher detections in upland habitats. These adult doe models correspond with the previous work of Lopez et al. [11] that compared data from 1968–1972 and 1998–2000 and suggested that key deer preferred upland habitats and avoided lowlands. This may be because our systematic placement of camera traps across the island was less biased as opposed to the radio-tagging of individuals near urban areas in Peterson et al. [23] and Lopez et al. [7], or that fawns are dropped in this habitat for protection even though the adult females spend other significant portions of their lives in the upland habitats. In either circumstance, the misaligned patterns of adult doe counts versus fawn abundance models suggests that both data types, as well as other data types (e.g., radio telemetry), should be examined to ensure a representative sample for inferences when making management decisions in the future.
White-tailed deer found on the mainland drop their fawns in areas with denser cover to protect their fawns from predation even when predation risk is higher in such places [33]. Unlike mainland white-tailed deer, key deer have been without native mammalian predators for centuries and therefore likely exhibit less anti-predatory behavior [34]. Interestingly, the strong selection for dense cover observed in mainland deer has been attributed to the “hider” antipredator strategy of white-tailed deer, and when home-ranges for mainland fawns consist of more complex cover types, the fawns are preyed upon less [35]. However, key deer do not have mammalian predators; thus, the strong selection for dense cover structure in lowlands may be due to another mechanism. Due to the relatively extreme summer temperatures for key deer compared to much of the mainland white-tailed deer range, they may select these areas for thermal cover. Thermal stress is a major disruptor of lactation in mammals within subtropical and tropical regions, because stressed does suffer from substantially reduced milk production [36]. Reduced milk supplies may be problematic to fawns, especially if they are also heat stressed. Thus, thermal refugia may be particularly important to key deer given the ambient temperature extremes they experience during lactation and may explain our observed patterns in habitat use. These lowland habitats are clearly important for key deer fawns and potentially future recruitment, even though adult doe count models suggested that they are less strongly selected than upland habitats. The Florida Keys are experiencing sea-level rise that will likely limit lowland habitats, especially if plant communities cannot keep up with shifting elevational gradients. These constraints should be considered in management and conservation action plans for key deer and other endangered mammals in the Florida Keys [20,37].
5. Conclusions
Our data indicated that using photo-identification of temporary spot patterns on fawns is a useful technique to identify and count individuals. These individual identifications were successfully used to determine which habitat factors are associated with fawn abundance. Elevation appears to be an important factor associated with fawn abundance in the Florida Keys. We suggest that there is a stronger relationship with elevation than other factors in predicting fawn abundance, possibly due to habitat cover found in the lower elevations creating better thermal protection for fawning. This could have repercussions on conservation and management decisions for the key deer as sea-level rises and elevational gradients shift.
Author Contributions
Conceptualization, M.V.C.; methodology, J.G.J., M.A.L., and M.V.C.; formal analysis, J.G.J. and M.V.C.; data curation, J.G.J. and M.V.C.; writing—original draft preparation, J.G.J., M.A.L., and M.V.C.; writing—review and editing, M.A.L. and M.V.C. All authors have read and agreed to the published version of the manuscript.
Funding
This research received no external funding but was conducted on data collected under a project funded by the U.S. Fish and Wildlife Service.
Institutional Review Board Statement
The study was conducted according to the guidelines of the North Carolina State University Institutional Animal Care and Use Committee (IACUC) #13-003-O.
Data Availability Statement
The data in this study are available upon request from the corresponding author and accompany the paper on Michael Cove’s ResearchGate profile.
Acknowledgments
This work was supported by the USFWS, the Florida Keys National Wildlife Refuge Complex, USGS Patuxent Wildlife Research Center, and NC Cooperative Fish and Wildlife Research Unit as part of the dissertation research of M. Cove under the guidance of Beth Gardner, Ted Simons, and Allan O’Connell. Special thanks to Andy Maurer, Phillip Hughes, Sandra Sneckenberger, Anne Morkill, Chad Anderson, Adam Emerick, Chris Eggleston, and Nancy Finley for their support during their tenures in the Keys. We also thank the Office of Undergraduate Research and Martha Reiskind from the Department of Applied Ecology at North Carolina State University for their support. All research was approved under U.S. Fish and Wildlife Service Permit #2013-008 and North Carolina State University Institutional Animal Care and Use Committee (IACUC) #13-003-O.
Conflicts of Interest
The authors declare no conflict of interest.
References
- Ripple, W.J.; Newsome, T.M.; Wolf, C.; Dirzo, R.; Everatt, K.T.; Galetti, M.; Macdonald, D.W. Collapse of the world’s largest herbivores. Sci. Adv. 2015, 1, e1400103. [Google Scholar] [CrossRef] [Green Version]
- Schipper, J.; Chanson, J.S.; Chiozza, F.; Cox, N.A.; Hoffmann, M.; Katariya, V.; Lamoreux, J.; Rodrigues, A.S.L.; Stuart, S.N.; Temple, H.J.; et al. The Status of the World’s Land and Marine Mammals: Diversity, Threat, and Knowledge. Science 2008, 322, 225–230. [Google Scholar] [CrossRef] [PubMed] [Green Version]
- Krieger, D.J. Economic Value of Forest Ecosystem Services: A Review; The Wilderness Society: Washington, DC, USA, 2001. [Google Scholar]
- Milner, J.M.; Bonenfant, C.; Mysterud, A.; Gaillard, J.-M.; Csányi, S.; Stenseth, N.C. Temporal and spatial development of red deer harvesting in Europe: Biological and cultural factors. J. Appl. Ecol. 2006, 43, 721–734. [Google Scholar] [CrossRef]
- Jacobson, H.A.; Kroll, J.C.; Browning, R.W.; Koerth, B.H.; Conway, M.H. Infrared-triggered cameras for Censusing White-Tailed Deer. Wildl. Soc. Bull. 1997, 25, 547–556. [Google Scholar]
- Smart, J.C.R.; Ward, A.I.; White, P.C.L. Monitoring woodland deer populations in the UK: An imprecise science. Mammal Rev. 2004, 34, 99–114. [Google Scholar] [CrossRef]
- Lopez, R.R.; Silvy, N.J.; Wilkins, R.N.; Frank, P.A.; Peterson, M.J.; Peterson, M.N. Habitat-Use Patterns of Florida Key deer: Implications of Urban Development. J. Wildl. Manag. 2004, 68, 900–908. [Google Scholar]
- Lopez, R.R.; Harveson, P.M.; Peterson, M.N.; Silvy, N.J.; Frank, P.A. Changes in ranges of Florida Key deer—Does population density matter? Wildl. Soc. Bull. 2005, 33, 343–348. [Google Scholar] [CrossRef]
- Parker, I.D.; Lopez, R.R.; Silvy, N.J.; Davis, D.S.; Owen, C.B. Long-term effectiveness of US 1 crossing project in reducing florida key deer mortality. Wildl. Soc. Bull. 2011, 35, 296–302. [Google Scholar] [CrossRef]
- Parker, I.D.; Parker, J.; Montalvo, A.E.; Lopez, R.R.; Silvy, N.J.; Lund, A.A.; Barham, E.; Finn, D.S.; Crawford, M. Florida Key Deer Presence on Outer Islands Following New World Screwworm and Hurricane Irma. Southeast. Nat. 2020, 19, 20. [Google Scholar] [CrossRef]
- Lopez, R.R.; Silvy, N.J.; Pierce, B.L.; Frank, P.A.; Wilson, M.T.; Burke, K.M. Population Density of the Endangered Florida Key Deer. J. Wildl. Manag. 2004, 68, 570–575. [Google Scholar] [CrossRef]
- Villanova, V.L.; Hughes, P.T.; Hoffman, E.A. Combining genetic structure and demographic analyses to estimate persistence in endangered Key deer (Odocoileus virginianus clavium). Conserv. Genet. 2017, 18, 1061–1076. [Google Scholar] [CrossRef]
- Kays, R.; Arbogast, B.S.; Baker-Whatton, M.; Beirne, C.; Boone, H.M.; Bowler, M.; Burneo, S.F.; Cove, M.V.; Ding, P.; Espinosa, S.; et al. An empirical evaluation of camera trap study design: How many, how long and when? Methods Ecol. Evol. 2020, 11, 700–713. [Google Scholar] [CrossRef]
- O’Connell, A.F.; Nichols, J.D.; Karanth, K.U. (Eds.) Camera Traps in Animal Ecology: Methods and Analyses; Springer: Berlin/Heidelberg, Germany, 2010. [Google Scholar]
- Zheng, X.; Owen, M.A.; Nie, Y.; Hu, Y.; Swaisgood, R.R.; Yan, L.; Wei, F. Individual identification of wild giant pandas from camera trap photos—A systematic and hierarchical approach. J. Zool. 2016, 300, 247–256. [Google Scholar] [CrossRef]
- Parsons, A.W.; Forrester, T.; McShea, W.J.; Baker-Whatton, M.C.; Millspaugh, J.J.; Kays, R. Do occupancy or detection rates from camera traps reflect deer density? J. Mammal. 2017, 98, 1547–1557. [Google Scholar] [CrossRef]
- Chandler, R.B.; Engebretsen, K.; Cherry, M.J.; Garrison, E.P.; Miller, K.V. Estimating recruitment from capture–recapture data by modelling spatio-temporal variation in birth and age-specific survival rates. Methods Ecol. Evol. 2018, 9, 2115–2130. [Google Scholar] [CrossRef]
- USFWS. Multi-Species Recovery Plan for South Florida; US Fish and Wildlife Service Report; USFWS: Vero Beach, FL, USA, 1999.
- Cove, M.V.; Gardner, B.; Simons, T.R.; O’Connell, A.F. Co-occurrence dynamics of endangered Lower Keys marsh rabbits and free-ranging domestic cats: Prey responses to an exotic predator removal program. Ecol. Evol. 2018, 8, 4042–4052. [Google Scholar] [CrossRef] [Green Version]
- Cove, M.V.; Gardner, B.; Simons, T.R.; Kays, R.; O’Connell, A.F. Free-ranging cats (Felis catus) on public lands: Estimating density, movement, activity and diet. Biol. Invasions 2018, 20, 333–344. [Google Scholar] [CrossRef]
- Bolger, D.T.; Morrison, T.A.; Vance, B.; Lee, D.; Farid, H. A computer-assisted system for photographic mark-recapture analysis. Methods Ecol. Evol. 2012, 3, 813–822. [Google Scholar] [CrossRef]
- Saha, S.; Bradley, K.; Ross, M.S.; Hughes, P.; Wilmers, T.; Ruiz, P.L.; Bergh, C. Hurricane effects on subtropical pine rocklands of the Florida Keys. Clim. Chang. 2011, 107, 169–184. [Google Scholar] [CrossRef]
- Peterson, M.N.; Lopez, R.R.; Frank, P.A.; Porter, B.A.; Silvy, N.J. Key deer fawn response to urbanization: Is sustainable development possible? Wildl. Soc. Bull. 2004, 32, 493–499. [Google Scholar] [CrossRef]
- Royle, J.A.; Dorazio, R.M. Hierarchical Modeling and Inference in Ecology: The Analysis of Data from Populations, Metapopulations and Communities; Elsevier: London, UK, 2008. [Google Scholar]
- Keever, A.C.; McGowan, C.P.; Ditchkoff, S.S.; Acker, P.K.; Grand, J.B.; Newbolt, C.H. Efficacy of N-mixture models for surveying and monitoring white-tailed deer populations. Mammal Res. 2017, 62, 413–422. [Google Scholar] [CrossRef]
- Burnham, K.; Anderson, D.R. Model Selection and Multi-Model Inference, 2nd ed.; Springer: New York, NY, USA, 2002; p. 63. [Google Scholar]
- Fiske, I.; Chandler, R. Unmarked: An R Package for Fitting Hierarchical Models of Wildlife Occurrence and Abundance. J. Stat. Softw. 2011, 43, 1–23. [Google Scholar] [CrossRef] [Green Version]
- R Core Development Team. R: A Language and Environment for Statistical Computing; R Foundation for Statistical Computing: Vienna, Austria, 2018. [Google Scholar]
- Chitwood, M.C.; Lashley, M.A.; Kilgo, J.C.; Cherry, M.J.; Conner, L.M.; Vukovich, M.; Ray, H.S.; Ruth, C.; Warren, R.J.; DePerno, C.S.; et al. Are camera surveys useful for assessing recruitment in white-tailed deer? Wildl. Biol. 2017, 2017, 1–6. [Google Scholar] [CrossRef] [Green Version]
- Norouzzadeh, M.S.; Nguyen, A.; Kosmala, M.; Swanson, A.; Palmer, M.S.; Packer, C.; Clune, J. Automatically identifying, counting, and describing wild animals in camera-trap images with deep learning. Proc. Natl. Acad. Sci. USA 2018, 115, E5716–E5725. [Google Scholar] [CrossRef] [PubMed] [Green Version]
- Huegel, C.N.; Gladfelter, H.L.; Dahlgren, R.B. Bedsite Selection by White-Tailed Deer Fawns in Iowa. J. Wildl. Manag. 1986, 50, 474. [Google Scholar] [CrossRef]
- Chitwood, M.C.; Lashley, M.A.; Kilgo, J.C.; Pollock, K.H.; Moorman, C.E.; DePerno, C.S. Do biological and bedsite characteristics influence survival of neonatal white-tailed deer? PLoS ONE 2015, 10, E0119070. [Google Scholar] [CrossRef]
- Chitwood, M.C.; Lashley, M.A.; Moorman, C.E.; Deperno, C.S. Setting an evolutionary trap: Could the hider strategy be maladaptive for white-tailed deer? J. Ethol. 2017, 35, 251–257. [Google Scholar] [CrossRef] [PubMed] [Green Version]
- Cove, M.V.; Maurer, A.S.; O’Connell, A.F. Camera traps reveal an apparent mutualism between a common mesocarnivore and an endangered ungulate. Mamm. Biol. 2017, 87, 143–145. [Google Scholar] [CrossRef]
- Gulsby, W.D.; Kilgo, J.C.; Vukovich, M.; Martin, J.A. Landscape heterogeneity reduces coyote predation on white-tailed deer fawns. J. Wildl. Manag. 2017, 81, 601–609. [Google Scholar] [CrossRef]
- Nardone, A.; Ronchi, B.; Lacetera, N.; Ranieri, M.; Bernabucci, U. Effects of climate changes on animal production and sustainability of livestock systems. Livest. Sci. 2010, 130, 57–69. [Google Scholar] [CrossRef]
- Taillie, P.J.; Jolly, S.R.; Bobay, L.R.; Sneckenberger, S.; Mccleery, R.A. Habitat use across multiple scales suggests resilience to rising seas for endangered island endemic compared to sympatric invasive species. Anim. Conserv. 2020. [Google Scholar] [CrossRef]
Figure 1.
Workflow using Wild-ID to identify individual key deer (Odocoileus virginianus clavium) fawns from camera traps, 1 May–2 June 2014.
Figure 1.
Workflow using Wild-ID to identify individual key deer (Odocoileus virginianus clavium) fawns from camera traps, 1 May–2 June 2014.

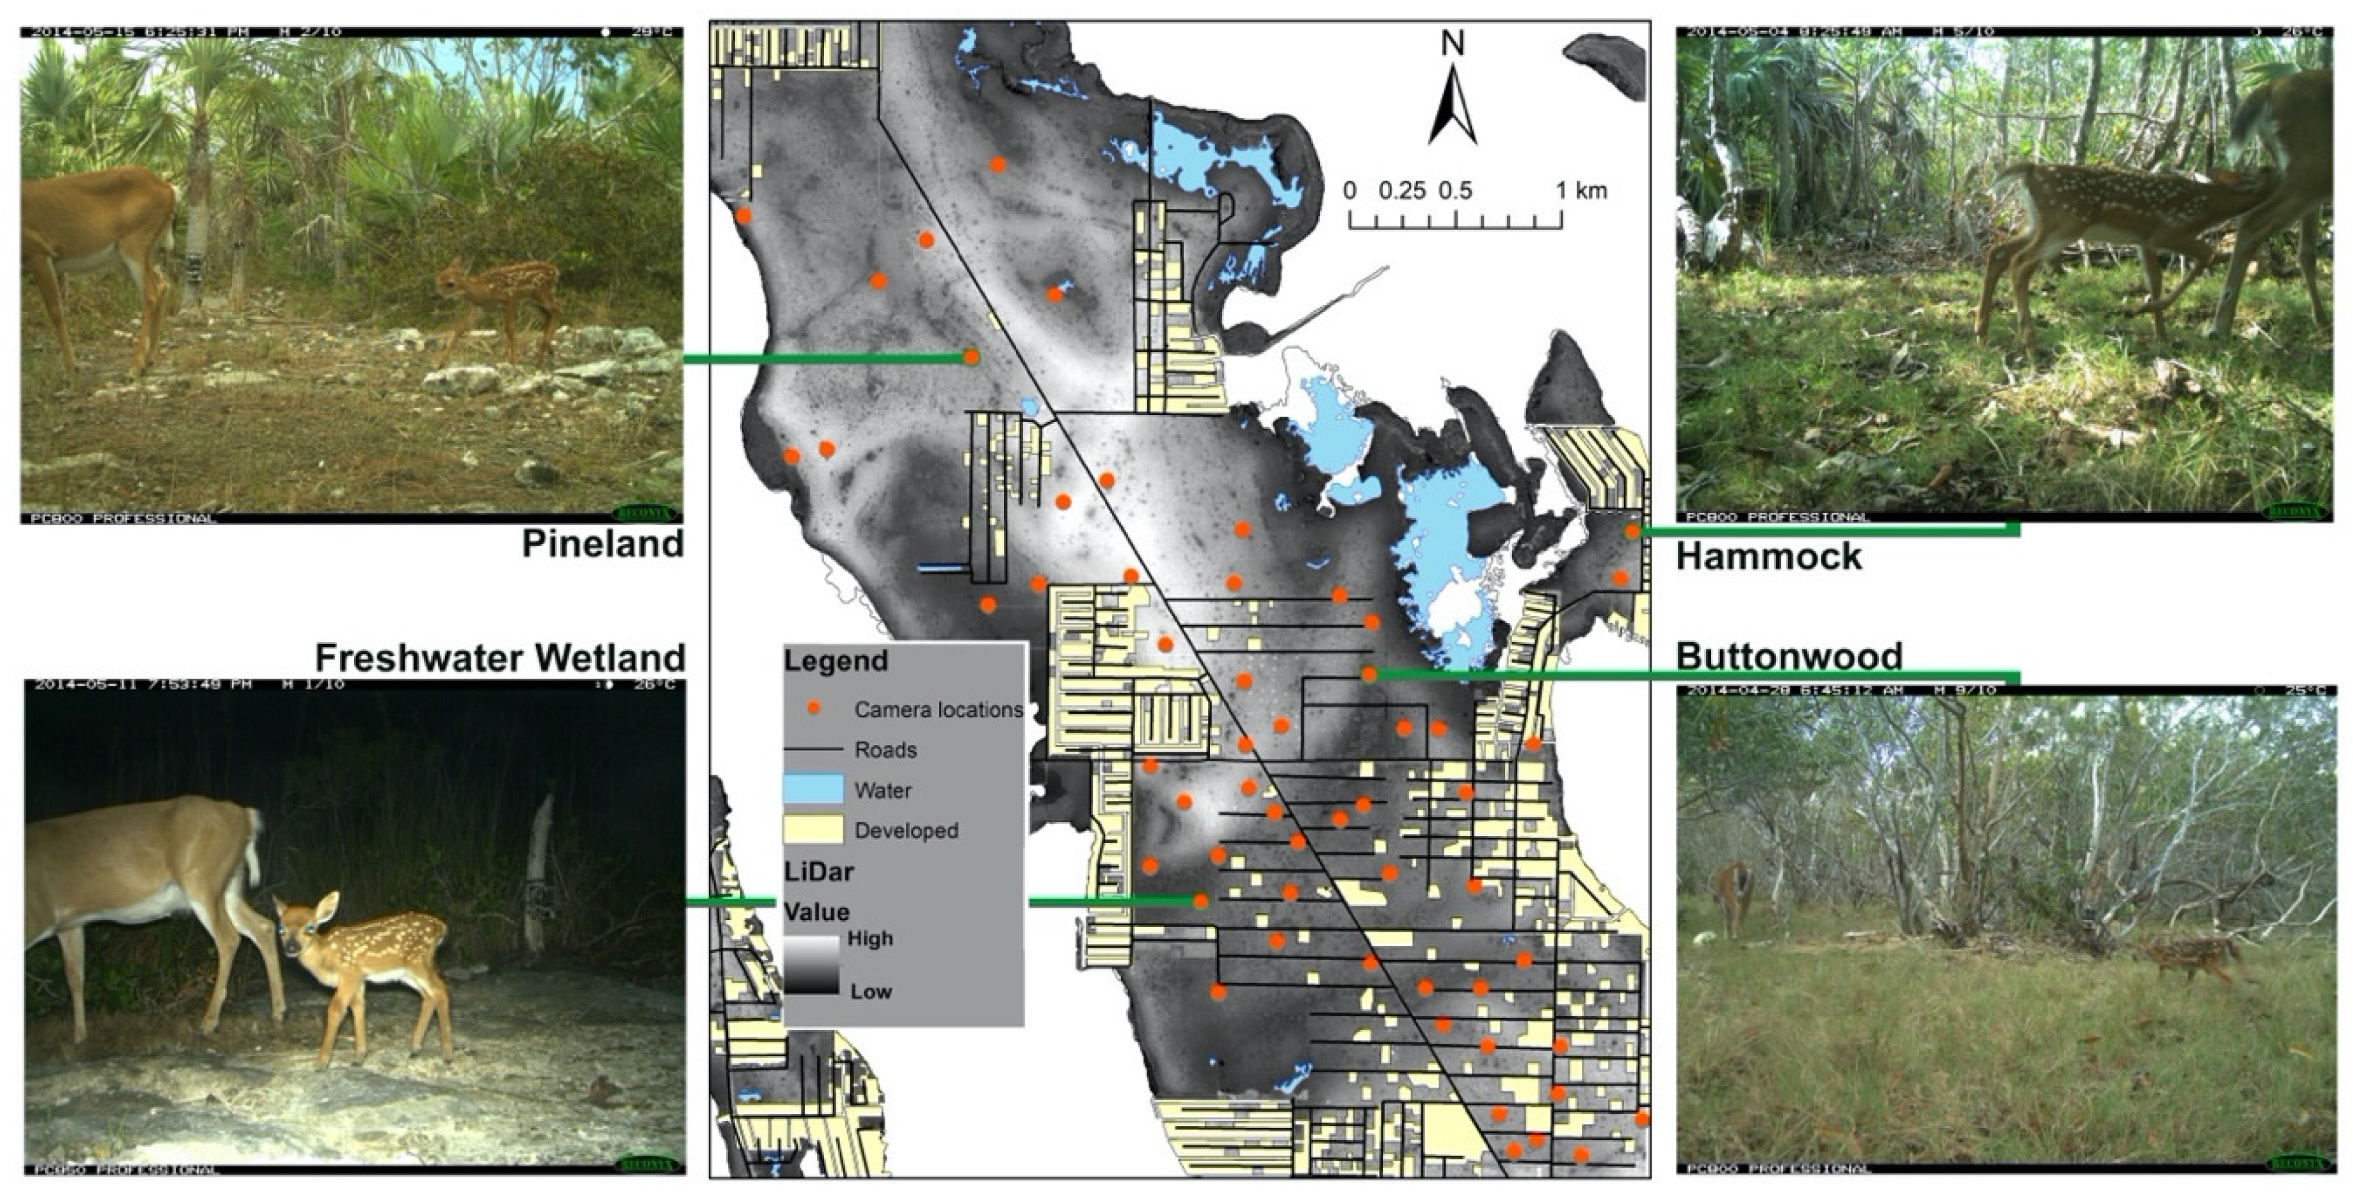
Figure 2.
Camera trap locations, habitat elevation (LiDar), developed areas, and representative photos of habitats from surveys of individually identifiable key deer (Odocoileus virginianus clavium) fawns and unidentifiable adult does detected in the National Key Deer Refuge, Big Pine Key, Florida, 1 May–2 June 2014.


Table 1.
Model selection results and estimated β coefficients (±SE) relating key deer (Odocoileus virginianus clavium) fawn abundance to habitat and anthropogenic covariates, from camera trap data collected in the National Key Deer Refuge, Big Pine Key, Florida, U.S.A., 1 May–2 June 2014. Included are the number of model parameters (K, minimum of 3 with detection and abundance intercepts along with overdispersion estimates), the Akaike information criterion corrected for small sample size (AICc), the difference from the top model (ΔAICc), the Akaike weight (ω), and the log-likelihood (LL).
| Model | K | AICc | ΔAICc | ω | LL | Estimated β Coefficients (SE) |
|---|---|---|---|---|---|---|
| elevation | 4 | 296.46 | 0 | 0.23 | −143.84 | βe = −0.956 (0.351) |
| anthropogenic | 5 | 296.95 | 0.49 | 0.18 | −142.88 | βt = −0.601 (0.351) βd = 0.002 (0.001) |
| development | 4 | 297.34 | 0.88 | 0.15 | −144.28 | βd = 0.002 (0.001) |
| null NB | 3 | 298.29 | 1.82 | 0.09 | −145.91 | − |
| trail | 4 | 299.65 | 3.19 | 0.05 | −145.43 | βt = −0.335 (0.341) |
| road | 4 | 300.5 | 4.04 | 0.03 | −145.86 | βr = 0.000 (0.001) |
Table 2.
Model selection results and estimated β coefficients (±SE) relating key deer (Odocoileus virginianus clavium) adult doe detection rates to habitat and anthropogenic covariates, from camera trap data collected in the National Key Deer Refuge, Big Pine Key, Florida, USA, 1 May–2 June 2014. Included are the number of model parameters (K, minimum of 4 with detection and abundance intercepts along with trail detection and overdispersion estimates), the Akaike information criterion corrected for small sample size (AICc), the difference from the top model (ΔAICc), the Akaike weight (ω), and the log-likelihood (LL).
| Model | K | AICc | ΔAICc | ω | LL | Estimated β Coefficients (SE) |
|---|---|---|---|---|---|---|
| elevation | 5 | 798.10 | 0 | 0.37 | −393.45 | βe = 0.456 (0.256) |
| null NB | 4 | 798.89 | 0.79 | 0.25 | −395.05 | − |
| road | 5 | 799.54 | 1.44 | 0.18 | −394.17 | βr = 0.001 (0.001) |
| development | 5 | 800.71 | 2.61 | 0.1 | −394.76 | βd = 0.001 (0.000) |
| trail | 5 | 801.10 | 3.00 | 0.08 | −394.95 | βt = 0.110 (0.237) |
| anthropogenic | 6 | 803.21 | 5.11 | 0.03 | −394.75 | βt = 0.009 (0.256) βd = 0.001 (0.001) |
Publisher’s Note: MDPI stays neutral with regard to jurisdictional claims in published maps and institutional affiliations. |
© 2021 by the authors. Licensee MDPI, Basel, Switzerland. This article is an open access article distributed under the terms and conditions of the Creative Commons Attribution (CC BY) license (http://creativecommons.org/licenses/by/4.0/).
Share and Cite
MDPI and ACS Style
Jacobs, J.G.; Lashley, M.A.; Cove, M.V. Fawn Counts and Adult Female Site Use Are Mismatched Indicators of Habitat Quality in an Endangered Deer. Diversity 2021, 13, 92. https://0-doi-org.brum.beds.ac.uk/10.3390/d13020092
AMA Style
Jacobs JG, Lashley MA, Cove MV. Fawn Counts and Adult Female Site Use Are Mismatched Indicators of Habitat Quality in an Endangered Deer. Diversity. 2021; 13(2):92. https://0-doi-org.brum.beds.ac.uk/10.3390/d13020092
Chicago/Turabian StyleJacobs, Julia G., Marcus A. Lashley, and Michael V. Cove. 2021. "Fawn Counts and Adult Female Site Use Are Mismatched Indicators of Habitat Quality in an Endangered Deer" Diversity 13, no. 2: 92. https://0-doi-org.brum.beds.ac.uk/10.3390/d13020092
Note that from the first issue of 2016, this journal uses article numbers instead of page numbers. See further details here.