Article

Production Performance of Moina macrocopa (Straus 1820) (Crustacea, Cladocera) Cultured in Different Salinities: The Effect on Growth, Survival, Reproduction, and Fatty Acid Composition of the Neonates

1
Faculty of Fisheries and Food Sciences, Universiti Malaysia Terengganu, Kuala Nerus, Kuala Terengganu 21030, Malaysia
2
Graduate School of Fisheries and Environmental Sciences, Fa Bunkyo 1-14, Nagasaki 852-8521, Japan
3
Faculty of Marine and Environmental Sciences, Universiti Malaysia Terengganu, Kuala Nerus, Kuala Terengganu 21030, Malaysia
4
Institute of Tropical Biodiversity and Sustainable Development, Universiti Malaysia Terengganu, Kuala Nerus, Kuala Terengganu, Terengganu 21030, Malaysia
*
Author to whom correspondence should be addressed.
Submission received: 27 November 2020 / Revised: 11 February 2021 / Accepted: 16 February 2021 / Published: 26 February 2021

Abstract

:
Salinity is a known factor in shaping population dynamics and community structure through direct and indirect effects on aquatic ecosystems. Salinity changes further influence food webs through competition and predation. The responses of Moina macrocopa (Cladocera) collected from Setiu Wetland lagoon (Terengganu) was evaluated through manipulative laboratory experiments to understand the ability of M. macrocopa to tolerate high salinity stress. Specifically, the fatty acid composition, growth, survival, and reproduction of this cladocerans species was examined. Sodium chloride (NaCl) as used in the treatments water with the concentration 0, 4, 6, 8, 12, and 15 salinity. Fatty acid levels were determined using Gas Chromatography and Mass Spectrophotometry (GC-MS). The results indicated that optimal conditions produced the highest fatty acid content, especially the polyunsaturated fatty acid content, such as EPA (eicosapentaenoic acid), ALA (alpha-linoleic acid), ARA (arachidonic acid), and DHA (docosahexaenoic acid). Furthermore, M. macrocopa survival was best at salinity 0, with a percentage of 98%, whereas the opposite occurred at salinity 15, with approximately 20% of viable animals surviving. Besides, M. macrocopa also showed the highest reproduction rate at salinity 0 (e.g., average initial age of reproduction, 4.33 ± 0.58 days) compared with other salinities level. Interestingly, the difference in growth at different salinities was not evident, an unusual finding when considering adverse effects such as osmoregulation pressure on the organism. Based on the results, we conclude that M. macrocopa can only tolerate salinity below salinity 8 and cannot withstand stressful environmental conditions associated with salinities above 8.

Graphical Abstract

1. Introduction

The global climate is changing rapidly in recent years. Industrialization, sea level rise, and urbanization often cause a variety of negative impacts on the aquatic ecosystems. Global warming and climate change have been described as the key factors contributing to rising sea levels. The increase in sea level rise has one of the most severe consequences. Consequently, coastal areas such as saltwater intrusion, coastal flooding, and coastal erosion can affect the inland ecosystem. They can also cause changes in the severity and frequency of severe events due to the combined effects of high spring tides, storm surges, surface waves, and river flooding. Zooplankton populations address environmental fluctuation conditions ranging from seasonal and predictable to unusual and unpredictable occurrences [1]. Salinity typically fluctuates temporarily and is a vital influence on zooplankton’s composition and dynamics in inland coastal systems, as even marginally increased salinity adversely affects species. Salinity rises particularly as a result of marine intrusions in these aquatic systems. In contrast, salinity decreases after heavy rain and the main river inflow [2,3].
Furthermore, salt concentrations in freshwater habitats have increased because of industrial activities and urbanization, with resultant impacts on freshwater animals [4]. Agricultural operations, urbanization, and other coastal growth projects are rapidly taking place in Southeast Asia that can drastically alter the geomorphological structures [
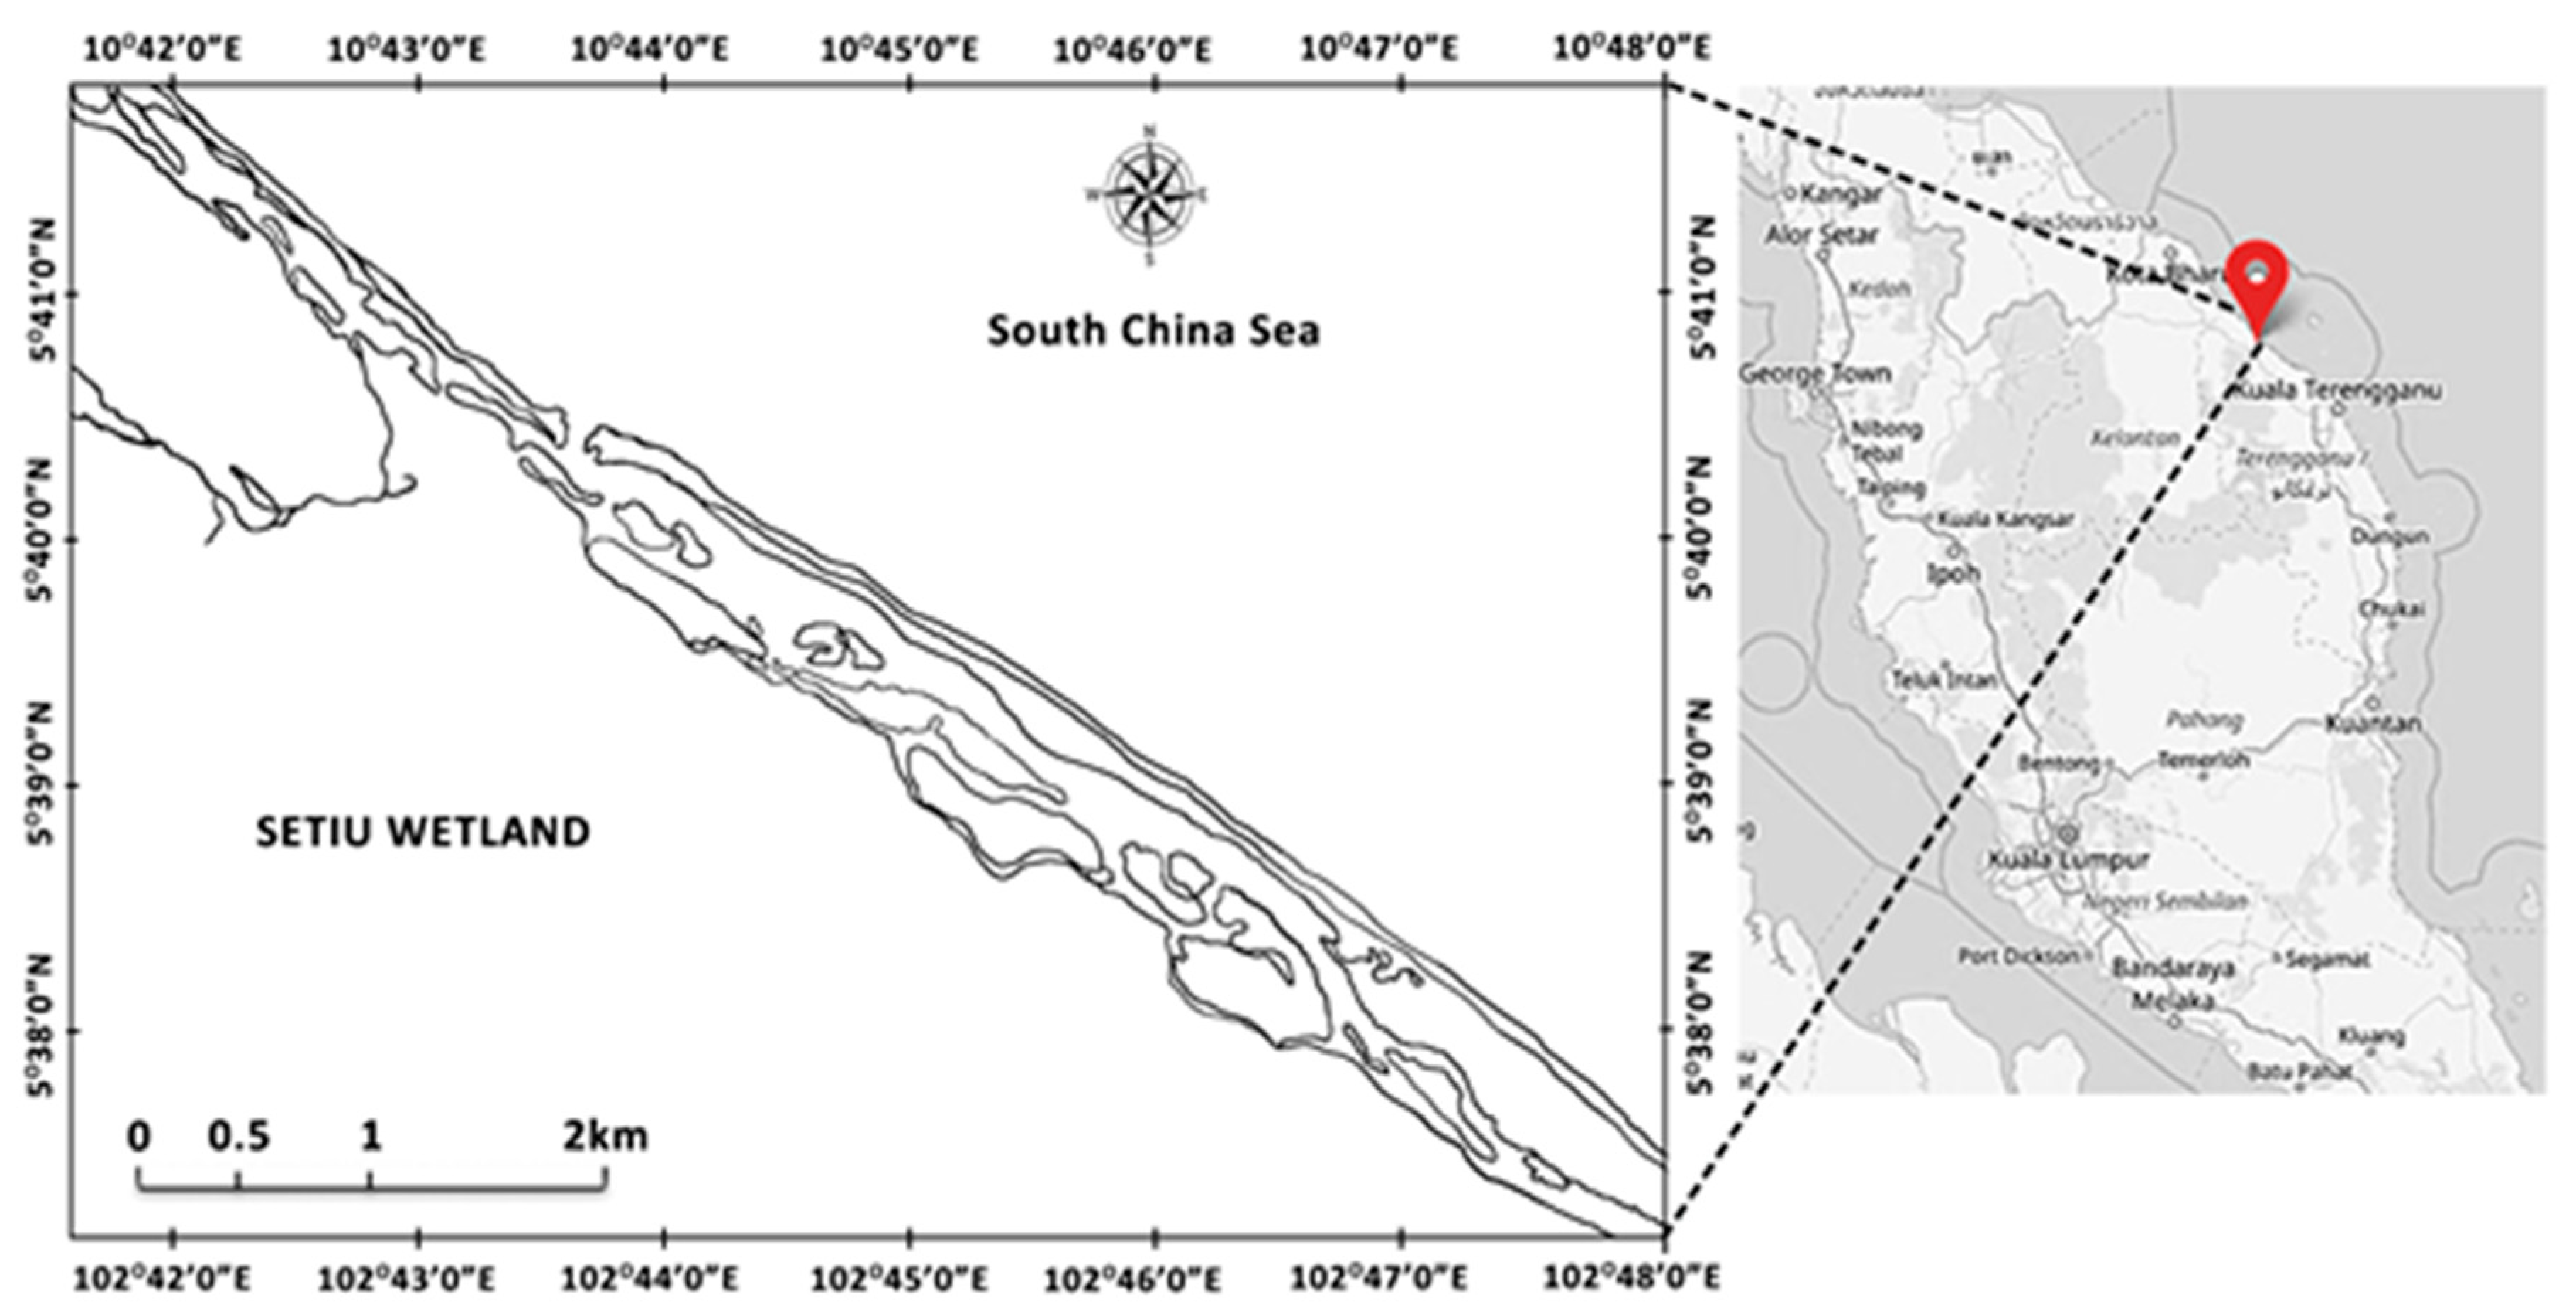
5]. The Setiu Wetland lagoon is considered a major location for brackish water mariculture activities, including finfish cage, pond culture, and shellfish farming [5]. This anthropogenic interference has both directly and indirectly degraded the natural environment of Setiu Wetland lagoon. Increased seawater levels and coastal erosion have significantly led to increases in salinity [4], affecting aquatic ecosystems and biodiversity [5]. Aquatic organisms are sensitive to changes in water quality. Small fish are more opportunistic in nature in that they can adapt and survive in stressful conditions found in shallow lagoons [6]. Zooplankton is an important community in the aquatic ecosystem for energy transfer from primary producers to fishes [6,7]. Factors such as zooplankton and ecosystem species type heavily influence the feeding of small fish [8]. The ecosystem’s condition affects both foraging efficiency and predation risk and may beneficially increase the former and decrease the latter in fish [9].
Zooplankton species distribution and abundance are influenced by environmental factors such as water transparency, climate change, and nutritional food content [10,11,12]. The abundance and diversity [13] of zooplankton and phytoplankton [4] are affected by salinity and available diets in the environment. Therefore, water salinity shifts also can alter the original taxa composition and ecological processes, such as primary productivity, decomposition, nutrient cycles, and food web function [14]. Salinity increase in freshwater can reduce zooplankton richness, especially in the cladoceran community, and thus, change the adaptation of the species to a more salt-tolerant species [5]. Research on cladocerans has been widely conducted due to their ecological importance, sensitivity towards environmental changes, and ease of handling [15]. Cladocerans are an important group in the zooplankton community with most of the species living in freshwater environments with salinities of <1 [4]. This is due to osmoregulation adaptations that only allow them to tolerate lower salinity levels [16]. This represents rapid changes in osmotic hemolymph concentration during salinity acclimation. Rapid osmotic adjustment and the relatively wide tolerance range of cladocera can encourage the colonization of contrasting environments whenever other ecological constraints are less important [17]. A few cladoceran species have shown an ability to adapt to salinity changes. However, this adaptation can negatively impact the growth and reproduction of the cladoceran species compared to their original habitat. Cladocerans are reported to be abundant in freshwater ecosystems as compared to brackish water environments [18]. However, a few cladoceran species can live in a saline environment, with brackish water species, tolerating beyond salinity 13 [16]. The dynamics and abundance of cladocerans are influenced by increased salt levels in freshwater environments [19]. A previous study by Ismail [20] showed that the highest salinity at the study area was 17.76 while the normal in-situ parameter was supposed to be in the range of 28–29 °C, 3.8–4.5 mg/L 7.5pH and salinity 2–6, respectively.
Moina sp., commonly referred to as water fleas, are crustaceans within the family of Moinidae, which inhibit freshwater and thrives in both brackish and marine environment [21]. The reproductive cycle of Moina sp. has both a sexual and asexual phase. Normally, the population consists of all females that reproduce asexually. Under optimum conditions, Moina sp. reproduce at only 4 to 7 days of age, with a brood size of 4 to 22 per female [22]. Broods are produced every 1.5 to 2.0 days [22], with most females producing 2 to 6 broods during their lifetime [22]. Under adverse environmental conditions, males are produced, and sexual reproduction occurs, resulting in resting egg (ephippia) production. This case is similar to brine shrimp eggs production. The stimuli for the switch from asexual to sexual reproduction in populations of Moina sp. are an abrupt reduction in the food supply and significant change in environmental conditions. The density of Moina sp. cultures routinely reaches densities of 5000 individuals per Litre (19,000/gallon) and therefore, they are well adapted to an intensive culture [22]. M. macrocopa are rich in protein and nutrients. They are excellent live foods for fish and prawn larvae when compared to other live feeds such as rotifer and Artemia [9] However, the fatty acid content of Moina sp. and other live food species such as copepods varies when they are cultivated with different culture media and different levels of environmental stress [23,24].
Studies have shown that lowering ambient temperature tends to increase C20–22 polyunsaturated fatty acid production in planktonic crustaceans [25]. However, the study on the impact of other environmental parameters on freshwater cladocerans, such as salinity change, is still limited and some quantitative data are only available on the fatty acid profiles of zooplankton at different temperatures but salinity-induced effects on the fatty acid composition of M. macrocopa have not been evaluated [26]. Lipids and fatty acids are structural components of cell membranes that play an essential role in growth, survival, and reproduction of aquatic organisms, especially in the early life stages of larvae [
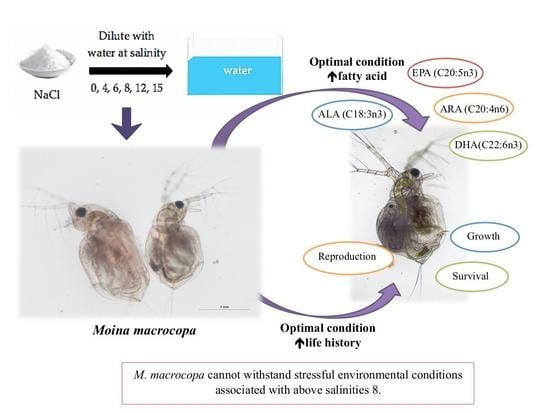
26]. Salinity changes in the freshwater habitat can impact the distribution or, community structure of water fleas, and can affect feeding behavior and also have an indirect impact on nutritional composition. The current study investigated the tolerance of M. macrocopa to salinity changes. This study’s objectives were to evaluate the ability of M. macrocopa to adapt to a saline environment up to salinity 15 [27] and, to investigate the potential of M. macrocopa to saline tolerance [16]. Specifically, this study aimed to assess the impact of salinity on fatty acid composition, growth, survival, and reproduction of M. macrocopa when exposed to different salinity levels. M. macrocopa is also considered a useful indicating animal to evaluate the impacts of increasing salinity on the aquatic environment.

2. Materials and Methods

2.1. Cultivation of Moina Macrocopa

Live M. macrocopa were collected from the lagoon of Setiu Wetland (Figure 1) at the beginning of the month (March, April, May), located in the state of Terengganu (N 5°68′ E 102°70′), and cultured in the Hatchery of University Malaysia Terengganu before use in the experiments. A zooplankton net (sizes from 50 to 200 µm) was used to sample zooplankton in the sampling area. Salinity, dissolved oxygen, and water temperature at the sampling site were measured using a YSI Multi-probe instrument (YSI Model 33) (Table 1). The plankton were collected by pulling the plankton net through the water horizontally and the plankton were further filtered and rinsed before placed into the bottle.
Moina sp. were isolated and cultured in a 100 mL flask (Figure 2) filled with freshwater (salinity 0) and, were periodically upscaled to 2000 L tanks for mass culture once the density reached 10 individuals per milliliter (ind/mL). Water parameters were maintained at 26 °C to 30 °C, salinity 0 with a light regime of 12 h light: 12 h dark [23]. In the current study, individuals in the neonates’ stage >24 h old were used [4] and isolation of neonates was carried out using nets with different mesh sizes (50 µm to 200 µm) into each container with 10 mL of culture medium. A single neonates per replicate and 20 replicates of each treatment with salinity 2, 4, 6, 8, 12, and 15 were studied. Hence, at least 20 egg-carrying females were required for each treatment. The test animals were observed twice daily until egg being carried were noticed in their brood chamber. Following this, animals were monitor every hour, the time of first reproduction was recorded when the first neonate was released from the brood chamber and the experiment was then ceased. The time was recorded in hour in the reproduction period between salinity treatments. During the experiment, M. macrocopa were fed fresh microalgae at a concentration of 14 × 107 cells/mL [28]. Microalgae Nannochloropsis sp. were used as feed to maintain similarity with the original habitat food resource. Pure microalgae stock was cultured at room temperature (25 °C to 28 °C) with 24 h of light. The algal strain Nannochloropsis sp. was obtained from the UMT hatchery algal laboratory and, the algae were cultured as feed for M. macrocopa. Microalgae were harvested when the culture reached the exponential phase [29] or before the decline phase [30]. To maintain M. macrocopa cultivation’s salinity, the Nannochloropsis sp. was cultured at a lower salinity by gradually decreasing the salinity until it reached the same range of M. macrocopa cultivation.
Changes in growth, survival, and reproduction of M. macrocopa were examined at six different salinities. The salinity level used was within the range of those able to occur within the original habitat of Setiu Lagoon. According to [5,31], the water salinity in Setiu Wetland ranges from salinity 0 to 35.0. In the laboratory, M. macrocopa was tested at salinity 0, 4, 6, 8, 12, and 15 [13], for the similarity of the range of salinity in Setiu wetland. The effect of salinity treatments was conducted by using sodium chloride (NaCl) solution as test waters. Every treatment ran in parallel with control in three replicates, each replicate contained 10 neonates (average number were taken from each replicate for all treatments) in 100 mL test water in 250 mL glass beakers. The artificial test water was diluted with the synthetic freshwater media to the respective test salinity. Test media were prepared by diluting saline water with synthetic freshwater media until the required salinities were recorded with a salinity conductivity- temperature Meter (YSI Model 33). The culture medium (salinity 0) was used as a control to mimic the original habitat of freshwater M. macrocopa in nature with no salinity level.
The average percentage survival of M. macrocopa was determined every alternate day by using a zooplankton counting chamber. The initial density was known, the final density of M. macrocopa was then recorded to generate a survival estimate (final density divided by initial counted density). The growth of M. macrocopa was determined with 10 individuals daily by measuring body length (from the base of the caudal spine to the anterior edge of the head) with a projection microscope. The experiment was carried out for 15 days until the entire cohort died. This experiment was conduct by using the equation by Pianka 1988 [32] to measure the reproductive capacity of M. macrocopa, and life tables were used to record and analyze reproduction data. The life table variables included the initial age at maturation, longevity (days), survival/survivorship, average longevity, gross reproduction rate, net reproduction rate, generation time, and life expectancy. These variables were estimated as follows:
A g e   o f   f i r s t   m a t u r a t i o n   ( d a y )   =   a g e   a t   w h i c h   t h e   f i r s t   b r o o d   a p p e a r s   f r o m   a   f e m a l e
L o n g e v i t y   ( d a y )   =   t h e   a v e r a g e   n u m b e r   o f   d a y s   o f   s u r v i v a l   o f   t h e   f e m a l e
S u r v i v a l / S u r v i v o r s h i p   = l x
A v e r a g e   l o n g e v i t y   = n x n
G r o s s   r e p r o d u c t i o n   r a t e   = m x
N e t   r e p r o d u c t i o n   r a t e ( R 0 ) = l x m x
G e n e r a t i o n   t i m e ( T )   = l x m x x R 0
L i f e   e x p e c t a n c y   ( e x ) = T x n x
where, lx: Proportion individual surviving to age x; nx: Number of individual alive for each age class; n: Number of animals; mx: Age-specific fecundity (number of neonates produced per surviving female at age x); Tx: Generation time at age x.
The intrinsic rate of population increases (r) was calculated at the end of the experiment, and all the data were recorded at 15 to 16 days which was equivalent to the average lifespan (cycle) of M. macrocopa.

2.2. Analysis of Fatty Acid

The zooplankton samples from each treatment were collected and freeze-dried before fatty acid analysis. Fatty acids (FAs) were extracted from freeze-dried M. macrocopa samples using a technique of [33] for both qualitative and quantitative examination. The extracted FAs were transesterified into fatty acid methyl esters (FAME) using a strong acid at 80 °C to 85 °C for about an hour. After this treatment, purified water and hexane were added and the upper organic layer transferred to a vial [34]. This step was performed several times to achieve complete extraction of FAME. Samples were then dried and dissolved again in 20 µL hexane to get 50 times concentration, removing all solvent peaks (i.e., toluene). The concentrated samples were then injected into gas chromatography-mass spectrometry (GC-MS) to read the spectra using caprylic acid (CH3 (CH2)6COOH) as an internal standard.

2.3. Data Analysis

This study’s data were expressed as Mean ± SD and were analyzed using one-way analysis of variance (ANOVA) to test for differences among salinity treatments. Post hoc Tukey’s multiple comparison tests were used to determine the significant differences of means between treatments. The level of significant difference was set at p < 0.05.

3. Results

3.1. Survival and Growth of M. Macrocopa in Different Salinities

The survival and growth of M. macrocopa at different salinity levels are shown in Table 2 and Table 3 below. The highest survival of M. macrocopa occurred at salinity 0 (91.16 ± 1.67%) (p < 0.05, refer to Table 2, Figure 3) while the lowest survival (approximately 13%) occurred at the salinity of 15. The survival rate at salinity 4 (81.89 ± 8.08%) and salinity 6 (75.31 ± 7.93%) were lower than in the control at salinity 0 (p < 0.05, refer to Table 2, Figure 3). The growth of M. macrocopa showed a positive relationship with the lowering of salinities at 0 (1.35 ± 0.28 mm), 4 (1.32 ± 0.25 mm), and 6 (1.30 ± 0.25 mm) with growth not being significantly affected. When the salinity reached 8 (0.72 ± 0.61 mm), 12 (0.39 ± 0.54 mm) and 15 (0.23 ± 0.43 mm), the growth of M. macrocopa became slower (Figure 4 and Table S4). There was no significant difference between salinity ranges on the growth of M. macrocopa (Table 3).

3.2. Age of First Maturation and Average Longevity

The life table parameters of M. macrocopa are shown in Table 4. Salinity significantly influenced the initial age of reproduction (p < 0.05, refer to Figure 5). Females began to reproduce after 4.33 ± 0.58 days at salinity 0, compared longer delay for salinity 4 (5.33 ± 0.58 days), 6 (46.67 ± 1.15 days), and 8 (11.67 ± 0.58 days). However, there was no difference in reproduction between salinity 0 and 4 (p > 0.05, refer to Figure 5). The average longevity of M. macrocopa was positively correlated with salinity (p < 0.05, refer to Figure 6), where average longevity was reduced with increased salinity. Female of M. macrocopa survived longer at salinity 0 (12.67 ± 0.58 days), compared with other treatment (Figure 6). Furthermore, no life table data can be recorded at salinity 12 and 15, since all the M. macrocopa were found dead before each cohort was able to reproduce (Figure 6).

3.3. Net Reproduction Rate and Gross Reproduction Rate

The net reproduction rate is the average number of females in a population produced during a female’s lifetime (Figure 7). The net reproduction rates of M. macrocopa ranged with rates for salinity 0 (29.58 ± 7.27 offspring/female), 4 (16.001 ± 4.23 offspring/female), 6 (8.17 ± 1.78 offspring/female), and 8 (3.52 ± 1.04 offspring/female) that revealed significant differences in reproductive rates among salinity treatments (p < 0.05, refer to Figure 8). The increase of salinity showed a statistical difference in gross reproductions rates of M. macrocopa (p < 0.05, refer to Figure 8). The highest gross reproduction rate is at salinity 0 (7.33 ± 1.53 offspring/female) followed by salinity 4 (5.67 ± 0.57 offspring/female), 6 (5.00 ± 1.00 offspring/female) and 8 (3.00 ± 1.00 offspring/female) (Figure 8). The net reproduction rates and gross reproduction rate of M. macrocopa decreased with salinity increases (Figure 7 and Figure 8). There was a significant difference between the salinity 0 as control and salinity 4 (p < 0.05, refer to Table 4), for net reproduction or gross reproduction rate (Figure 8).

3.4. Generation Time and Intrinsic Rate of Population Increase

The time from the laying of eggs to when an individual reaches sexual maturity is known as generation time (Figure 9). The generation time for M. macrocopa was shorter at salinity 0 (6.78 ± 2.18 days) and longer at salinity 8 (11.67 ± 0.57 days). There was no significant difference in generation time between all the treatments (p > 0.05, refer to Figure 9). Based on the results, salinity showed an inverse relationship with the intrinsic rate (p < 0.05, refer to Figure 10). The M. macrocopa showed a high intrinsic rate at salinity 0 (0.14 ± 0.04) compared with the rate at salinity 4 (0.087 ± 0.023), 6 (0.060 ± 0.01) and 8 (0.012 ± 0.006) as seen in Figure 10.

3.5. Fatty Acid Compositions of M. Macrocopa

The fatty acid compositions of M. macrocopa grown at different salinities are shown in Table 5 and Table 6. The fatty acid contents were significantly affected by salinity levels that cohorts were exposed to (p < 0.05). The highest level of fatty acids content considering saturated and polyunsaturated fatty acids in M. macrocopa was recorded for the salinity of 0 (p < 0.05). The highest level of fatty acid as the sum of the saturated, monosaturated, and polyunsaturated, as a percentage of total fatty acids, was recorded in the control treatment at the lowest salinity level. The amount of EPA (C20:5) in M. macrocopa were higher at the lowest salinity levels 0 (3.407 ± 0.189%) than at higher salinity levels (p < 0.05). The increase of salinity from 0 (8.867 ± 0.252%) to 15 (0.047 ± 0.014%) significantly abated the C18:1 monosaturated fatty acids in M. macrocopa (p < 0.05, refer to Table 5 and Table 6). The content of polyunsaturated fatty acids (PUFA) was significantly higher for a salinity level treatment of 0 than at higher salinity levels in M. macrocopa (p < 0.05). The highest polyunsaturated fatty acids were recorded for eicosapentaenoic acid (EPA) (0.725 ± 0.047) at the salinity of 0 (p < 0.05). The highest alpha-linoleic acid (ALA) content in M. macrocopa was also found at salinity 0 and 4 (0.474 ± 0.047%, 0.135 ± 0.047%) respectively, p < 0.05, refer to Table 5 and Table 6).

4. Discussion

Freshwater ecosystems are becoming increasingly threatened, partly due to the rise in the salinity of groundwater (i.e., from seawater intrusion) and water regime modifications, which reduce the frequency of high flow flushing events [25,35,36] These changes will significantly impact both the survival rate [37] and reproduction [37,38] of M. macrocopa. This study demonstrated how the increase of salinity, especially sodium chloride (NaCl) affects survival and life history traits of a freshwater cladoceran species through an examination of effects on M. macrocopa, which may be representative the of impact to other members of zooplankton communities. The present study results indicated that the increase in salinity influenced the survival, growth, and reproduction of M. macrocopa.
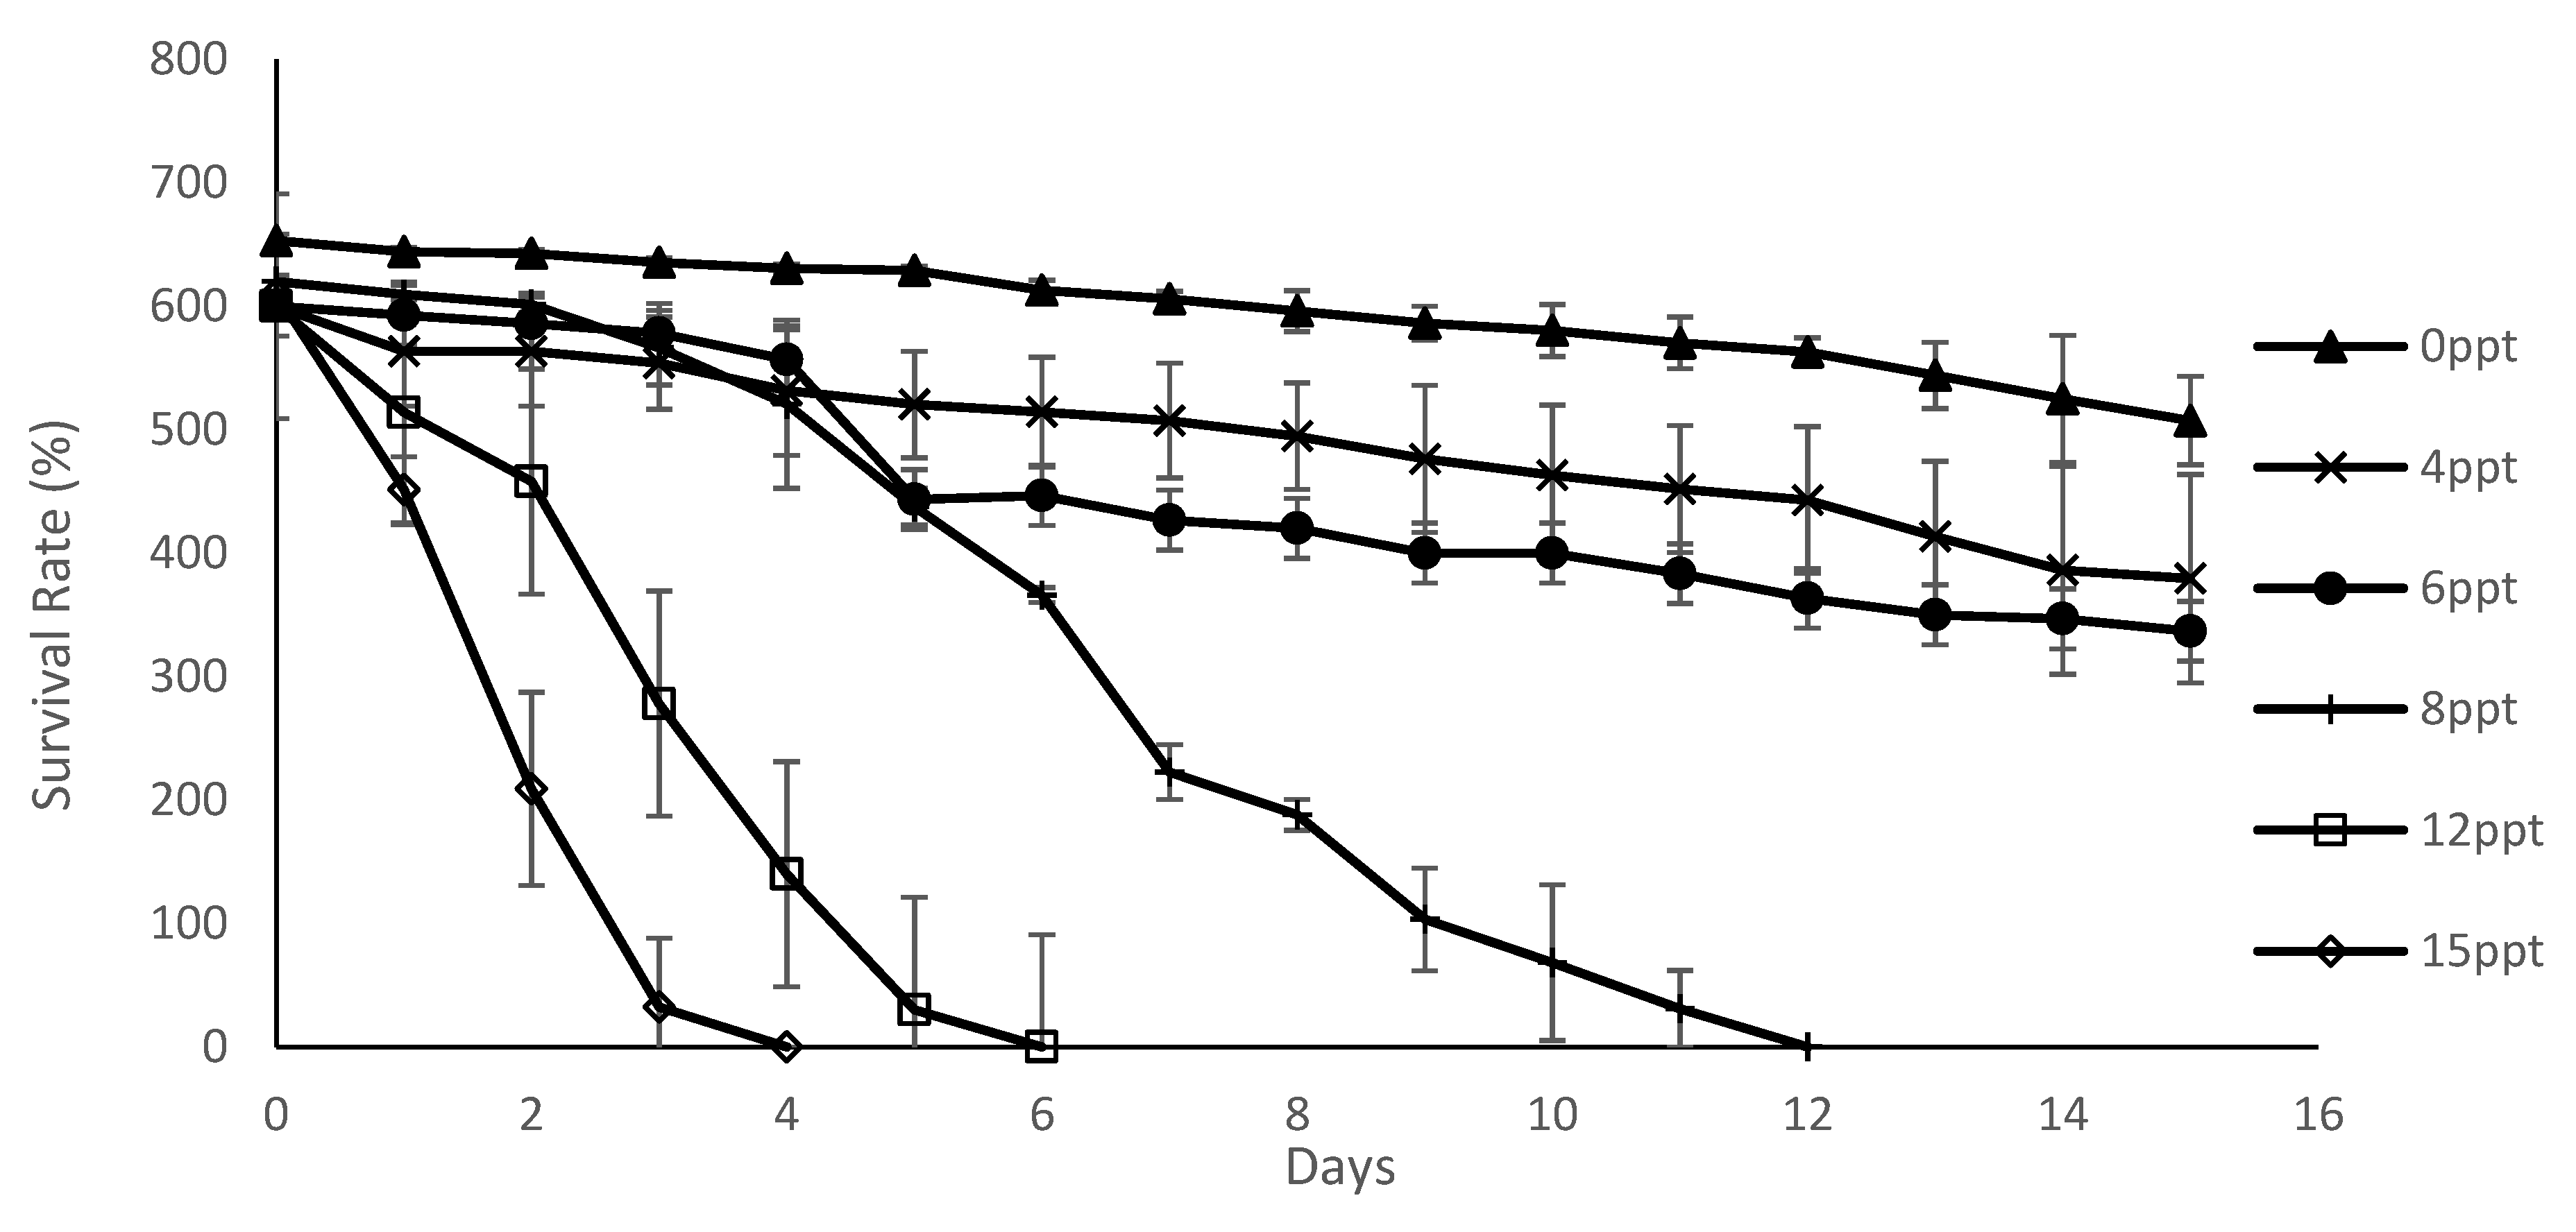
M. macrocopa achieved the highest recorded survival rate at treatment salinity of 0, compared to other salinity range treatments. As indicated by [39] for another species of cladoceran, Latonopsis australis, L. australis had the highest survival rate recorded for an environmental salinity of 0, which also decreased, with the increase of the salinity level in the natural environment. Moreover, according to the study of [40], the survival rate of Moina eugenie decreased with increased salinity and [4], further supported this where the survival rate of Daphnia magna was shown to decrease with increasing salt concentration. It is concluded that the survival rate of M. macrocopa is undoubtedly, significantly affected by the increase of salinity levels.
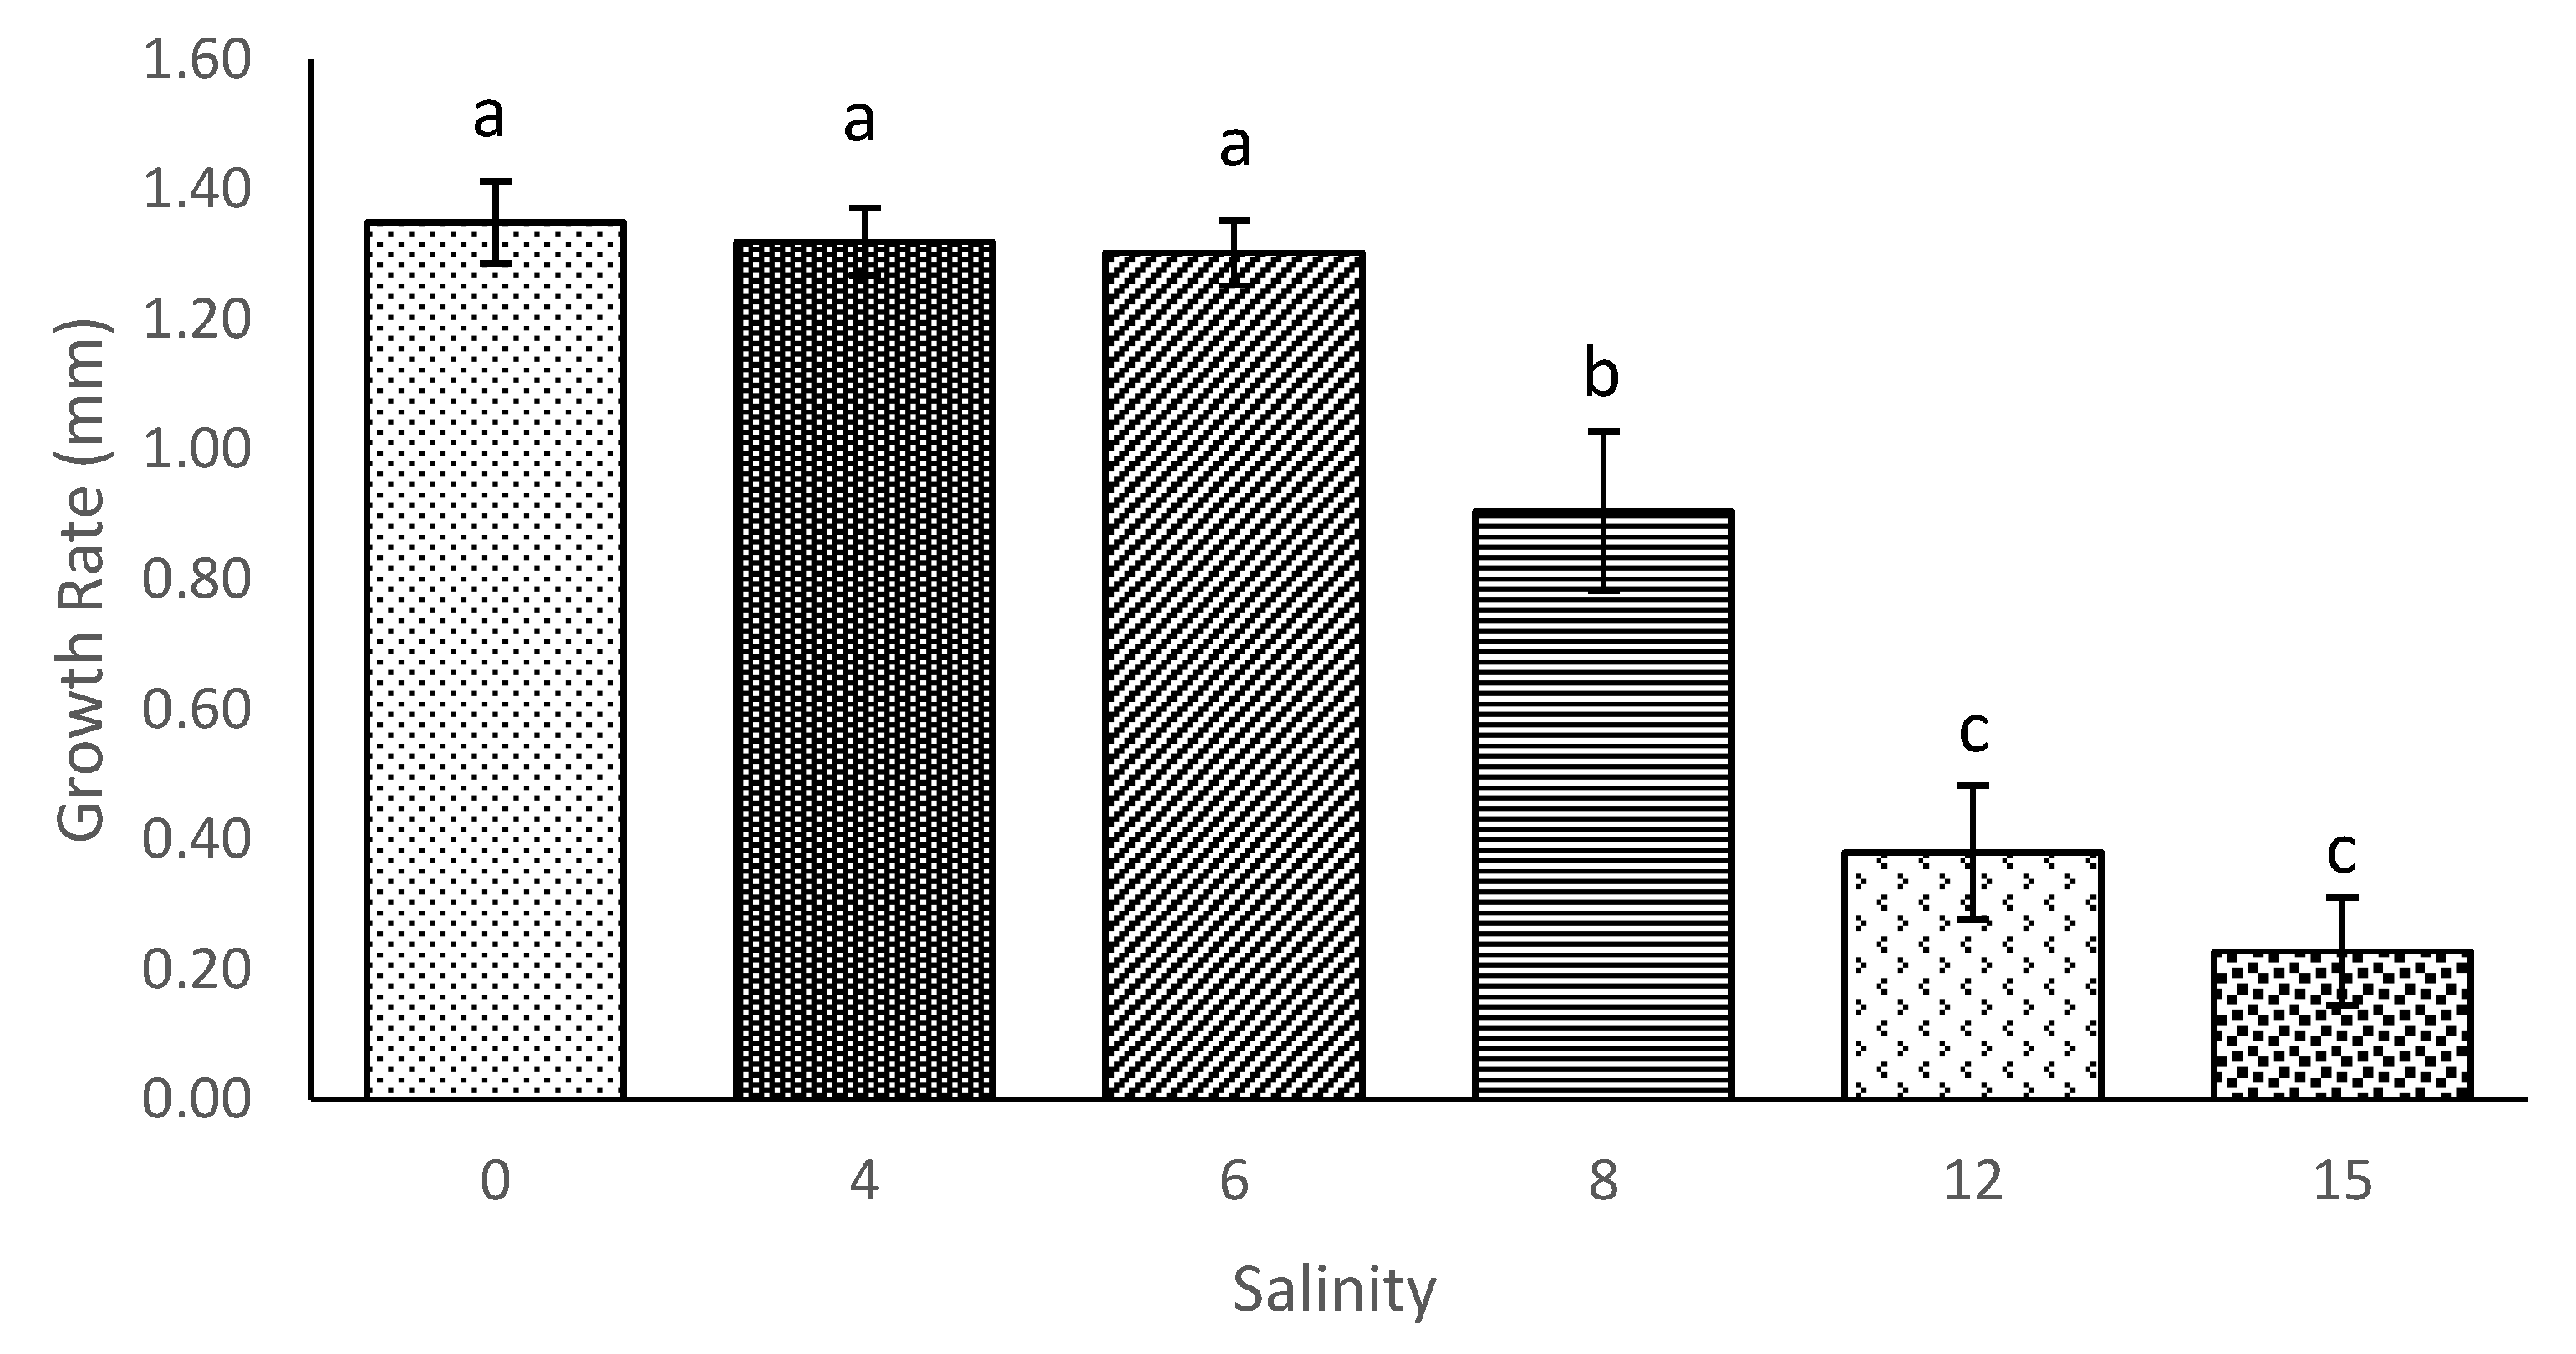
The current study showed that the length of M. macrocopa does not experience a significant reduction in environments with high salinities, up to a point. The results showed the positive growth of M. macrocopa in salinity levels from 0 until 6. However, when the salinity was increased to 8, 12, and 15, the growth of M. macrocopa became slower. The slowest growth was observed at salinity 15, which might have resulted from some regulatory stress that occurred in the culture [41]. Increased salinity stress can also add additional energy costs for metabolism and osmoregulation to redirect energy from somatic growth. In a stressful environment, animals which spend more energy in reproduction are an adaptation to increase mortality [12]. This conclusion is also aligned with the findings of [27] investigating the growth rate of exotic cladoceran, Daphnia exilis which also did not show any changes under a salinity regime of 6 but started to decline in growth when salinity reached 8 and above.
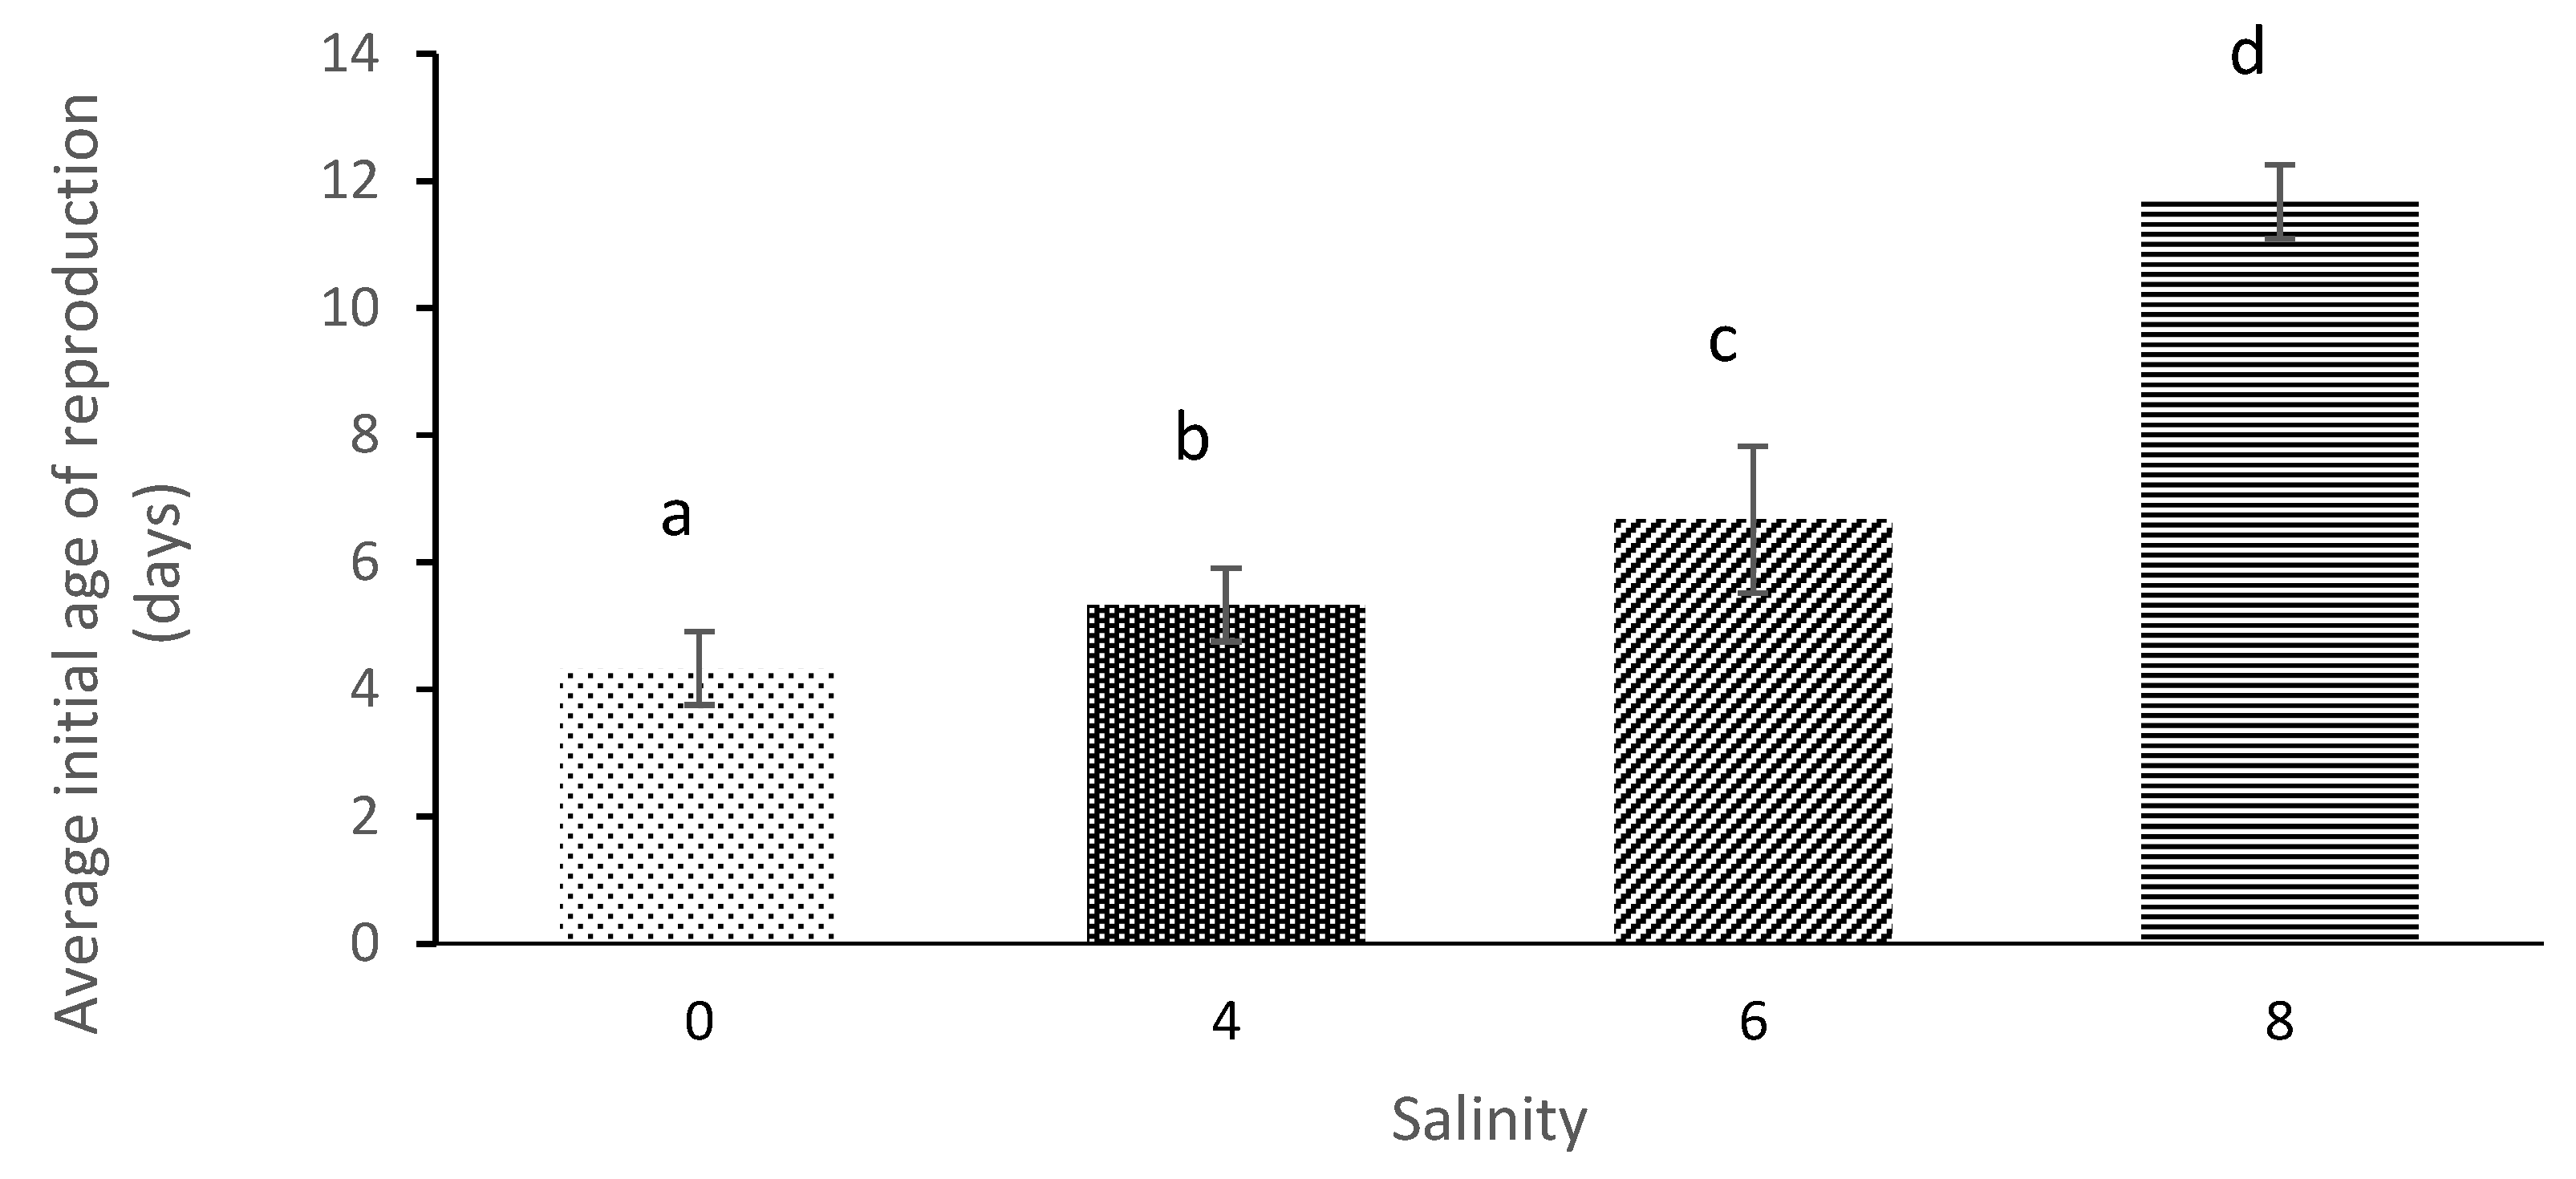
Female reproduction was affected by salinity and the maturation of M. macrocopa was delayed at the highest salinity. These results are comparable to those obtained by [42], who noted that the sexual maturation of M. macrocopa was delayed by 1 day at a salinity level of 5.5 when compared to 0. Additionally, [4], noted that the reproduction age of D. magna was delayed from 7 days until 9 days at salinity levels of 0 and 2.66, respectively.
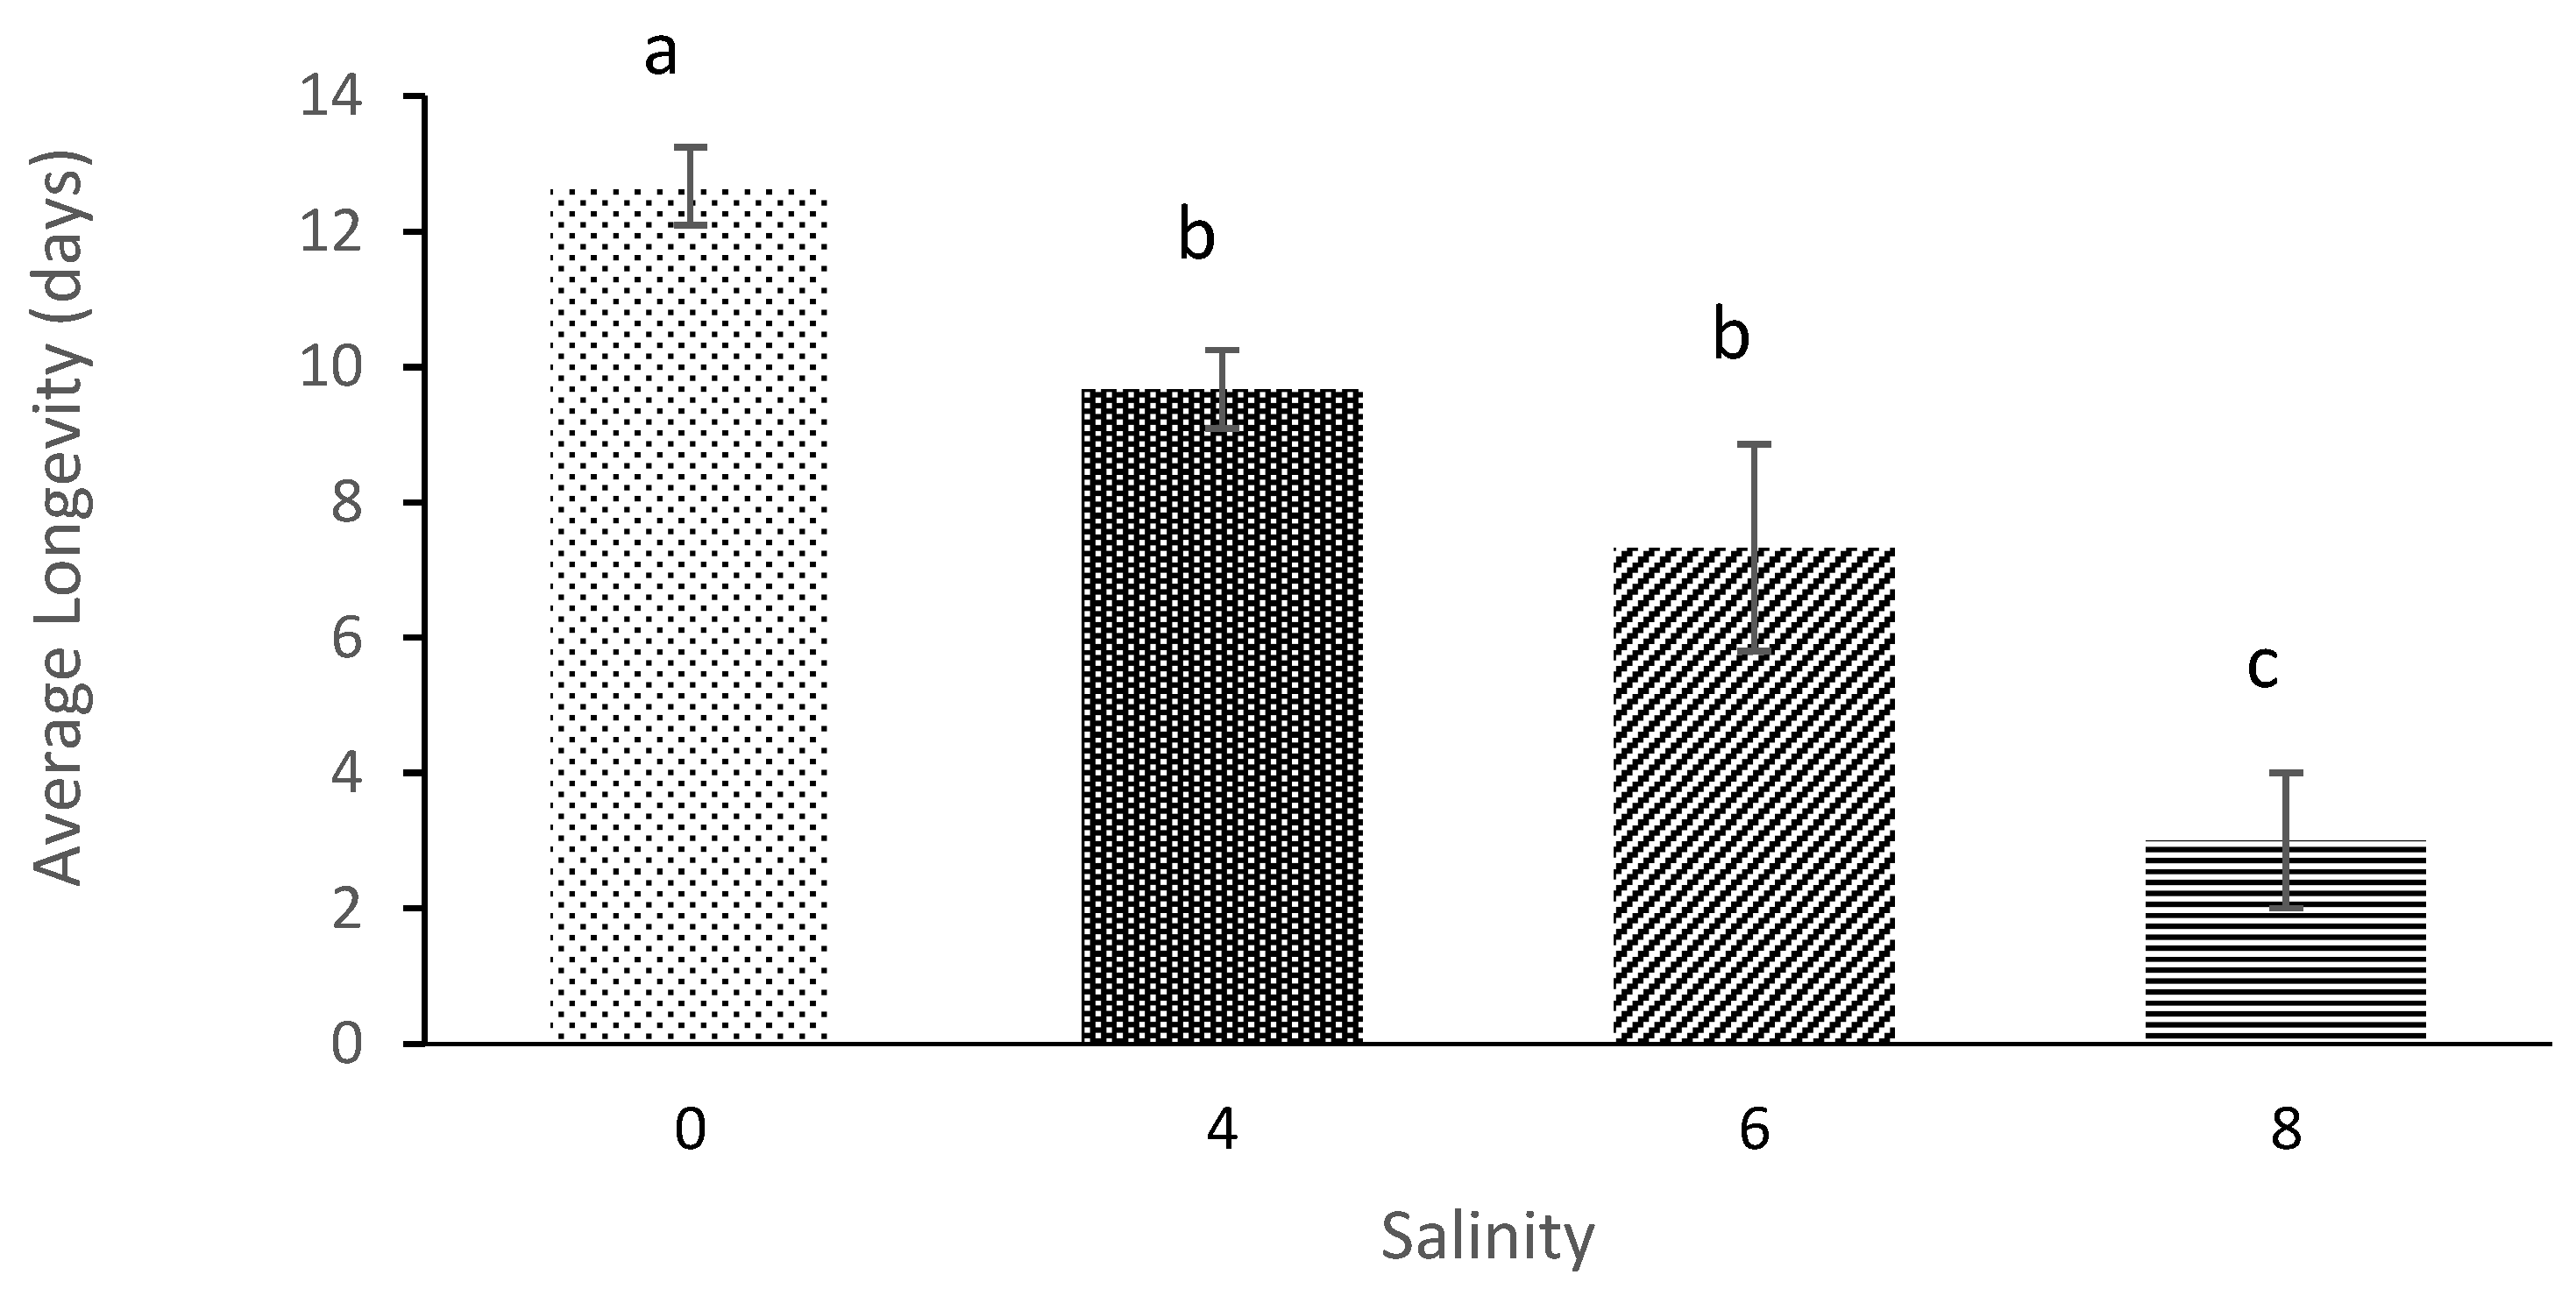
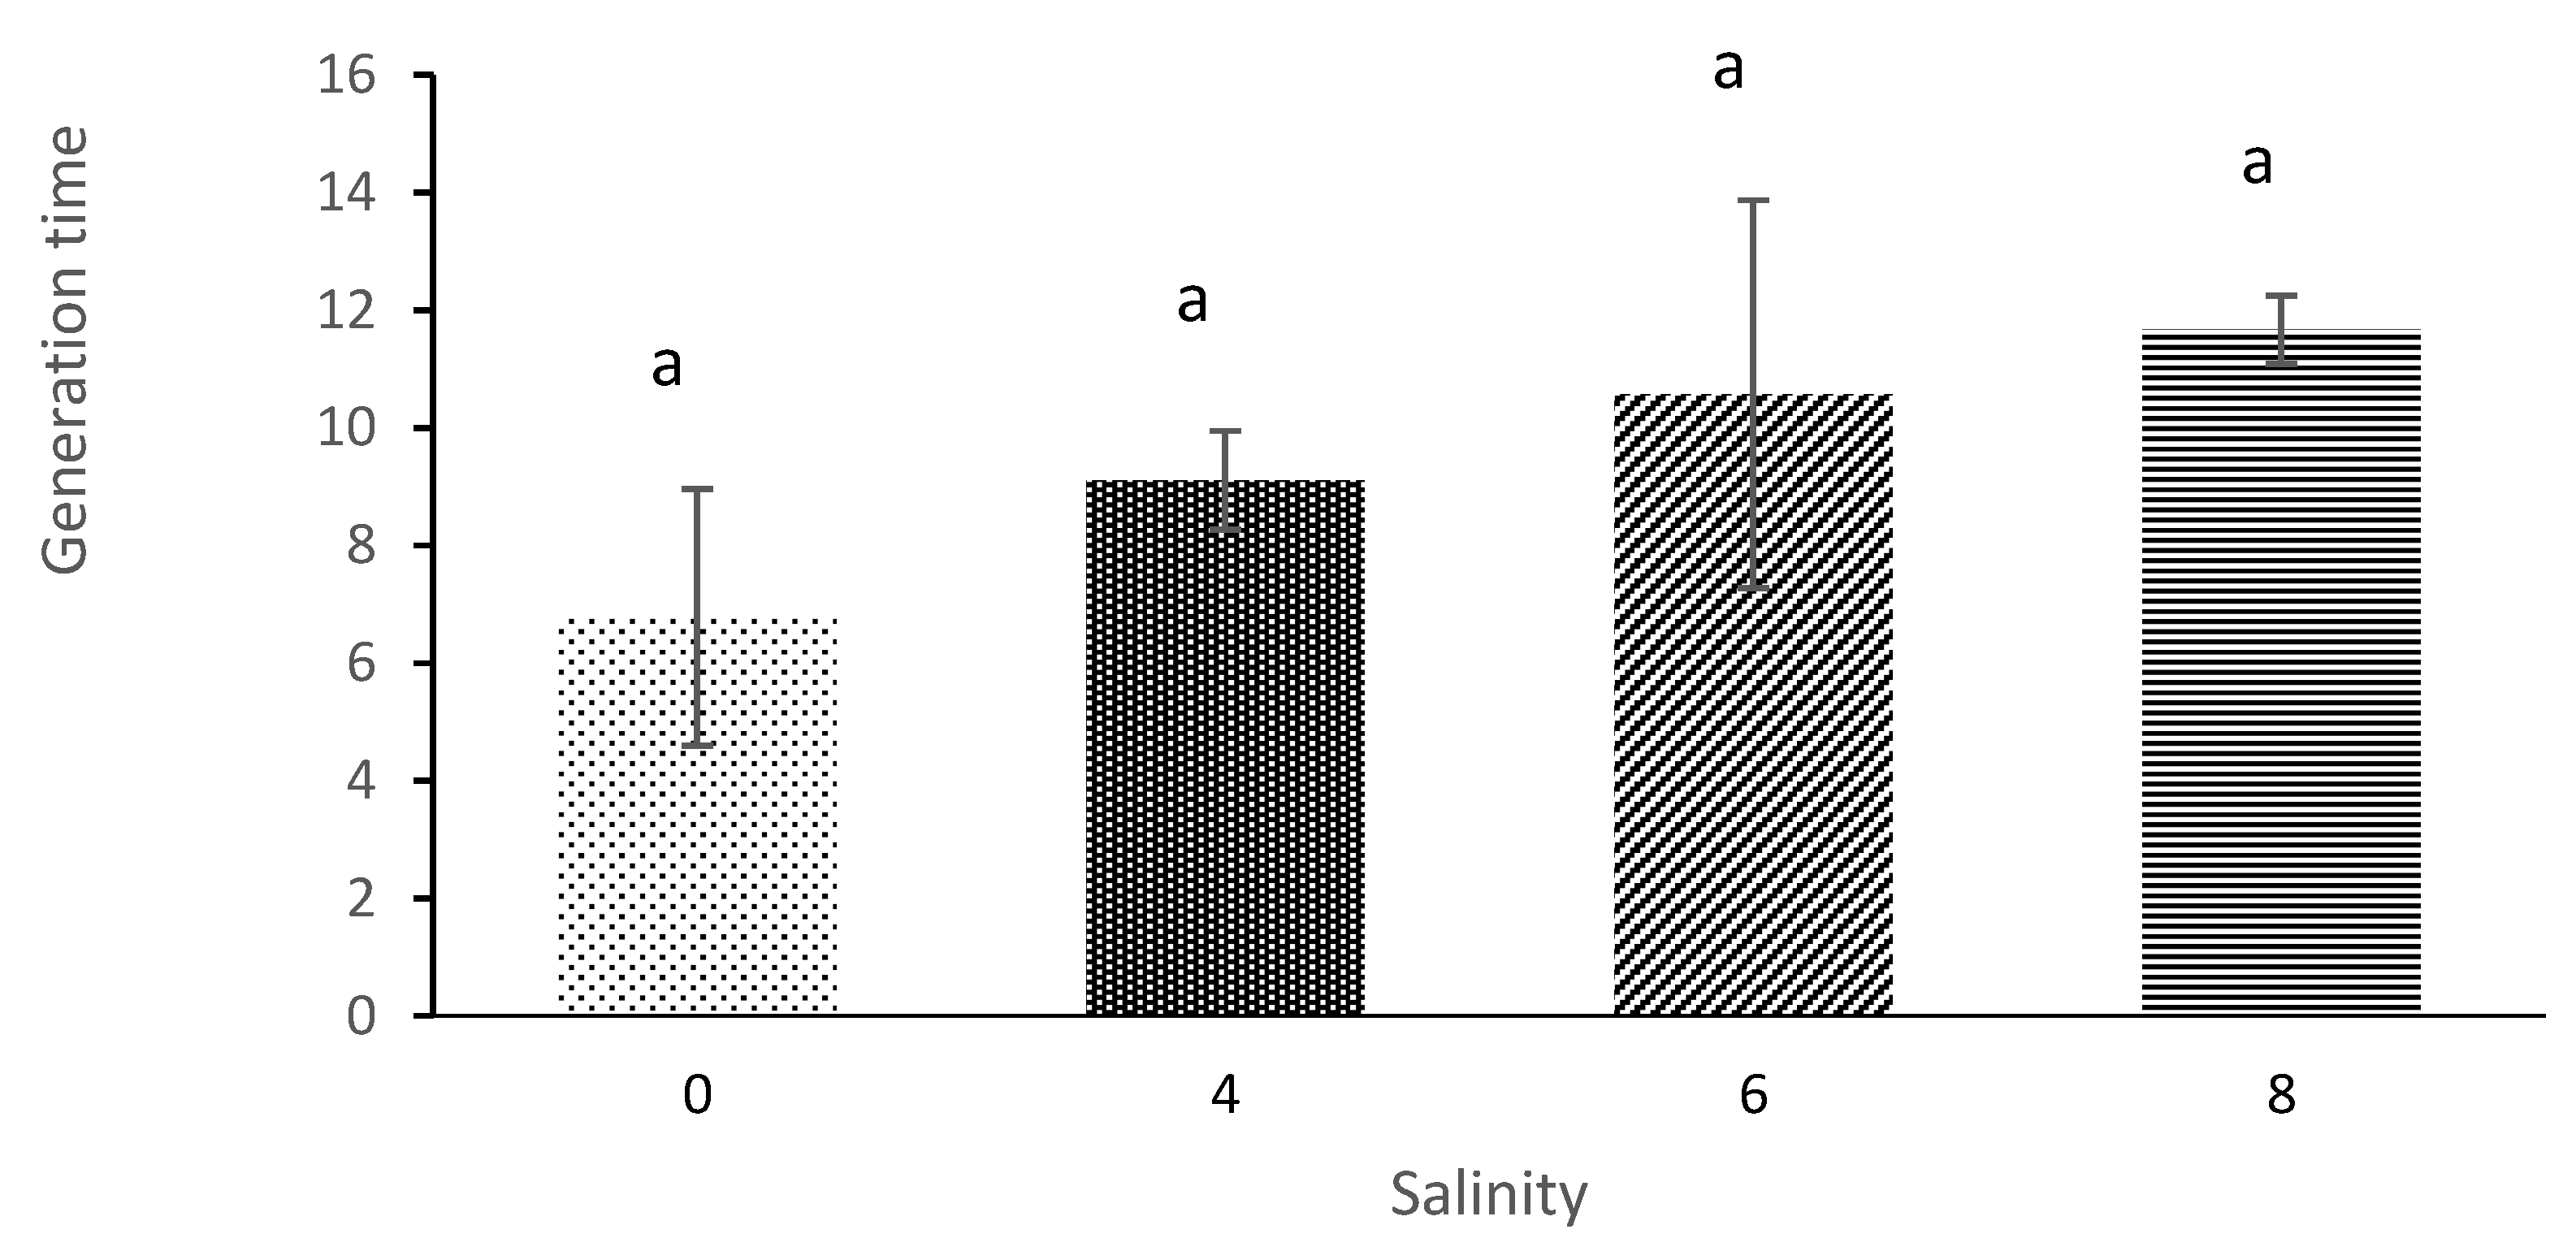
The current study results showed that the average lifespan of M. macrocopa was 12.3 days of salinity 0 and, 9.6 days at salinity 6. These are similar results to a study by [43], where the average lifespan of D. magna was also significantly affected by salt concentration. The results showed that maximum average lifespan (57.7 days) occurred at the salinity of 0. In contrast, the shortest lifespan (25.2 days) occurred at salinity 7. Furthermore, in studies of Simocephalus vetulus, the results also showed that this cladoceran’s lifespan decreased drastically when the salinity level was increased apart from food impacts that positively influence the lifespan of copepods [10,11,44].
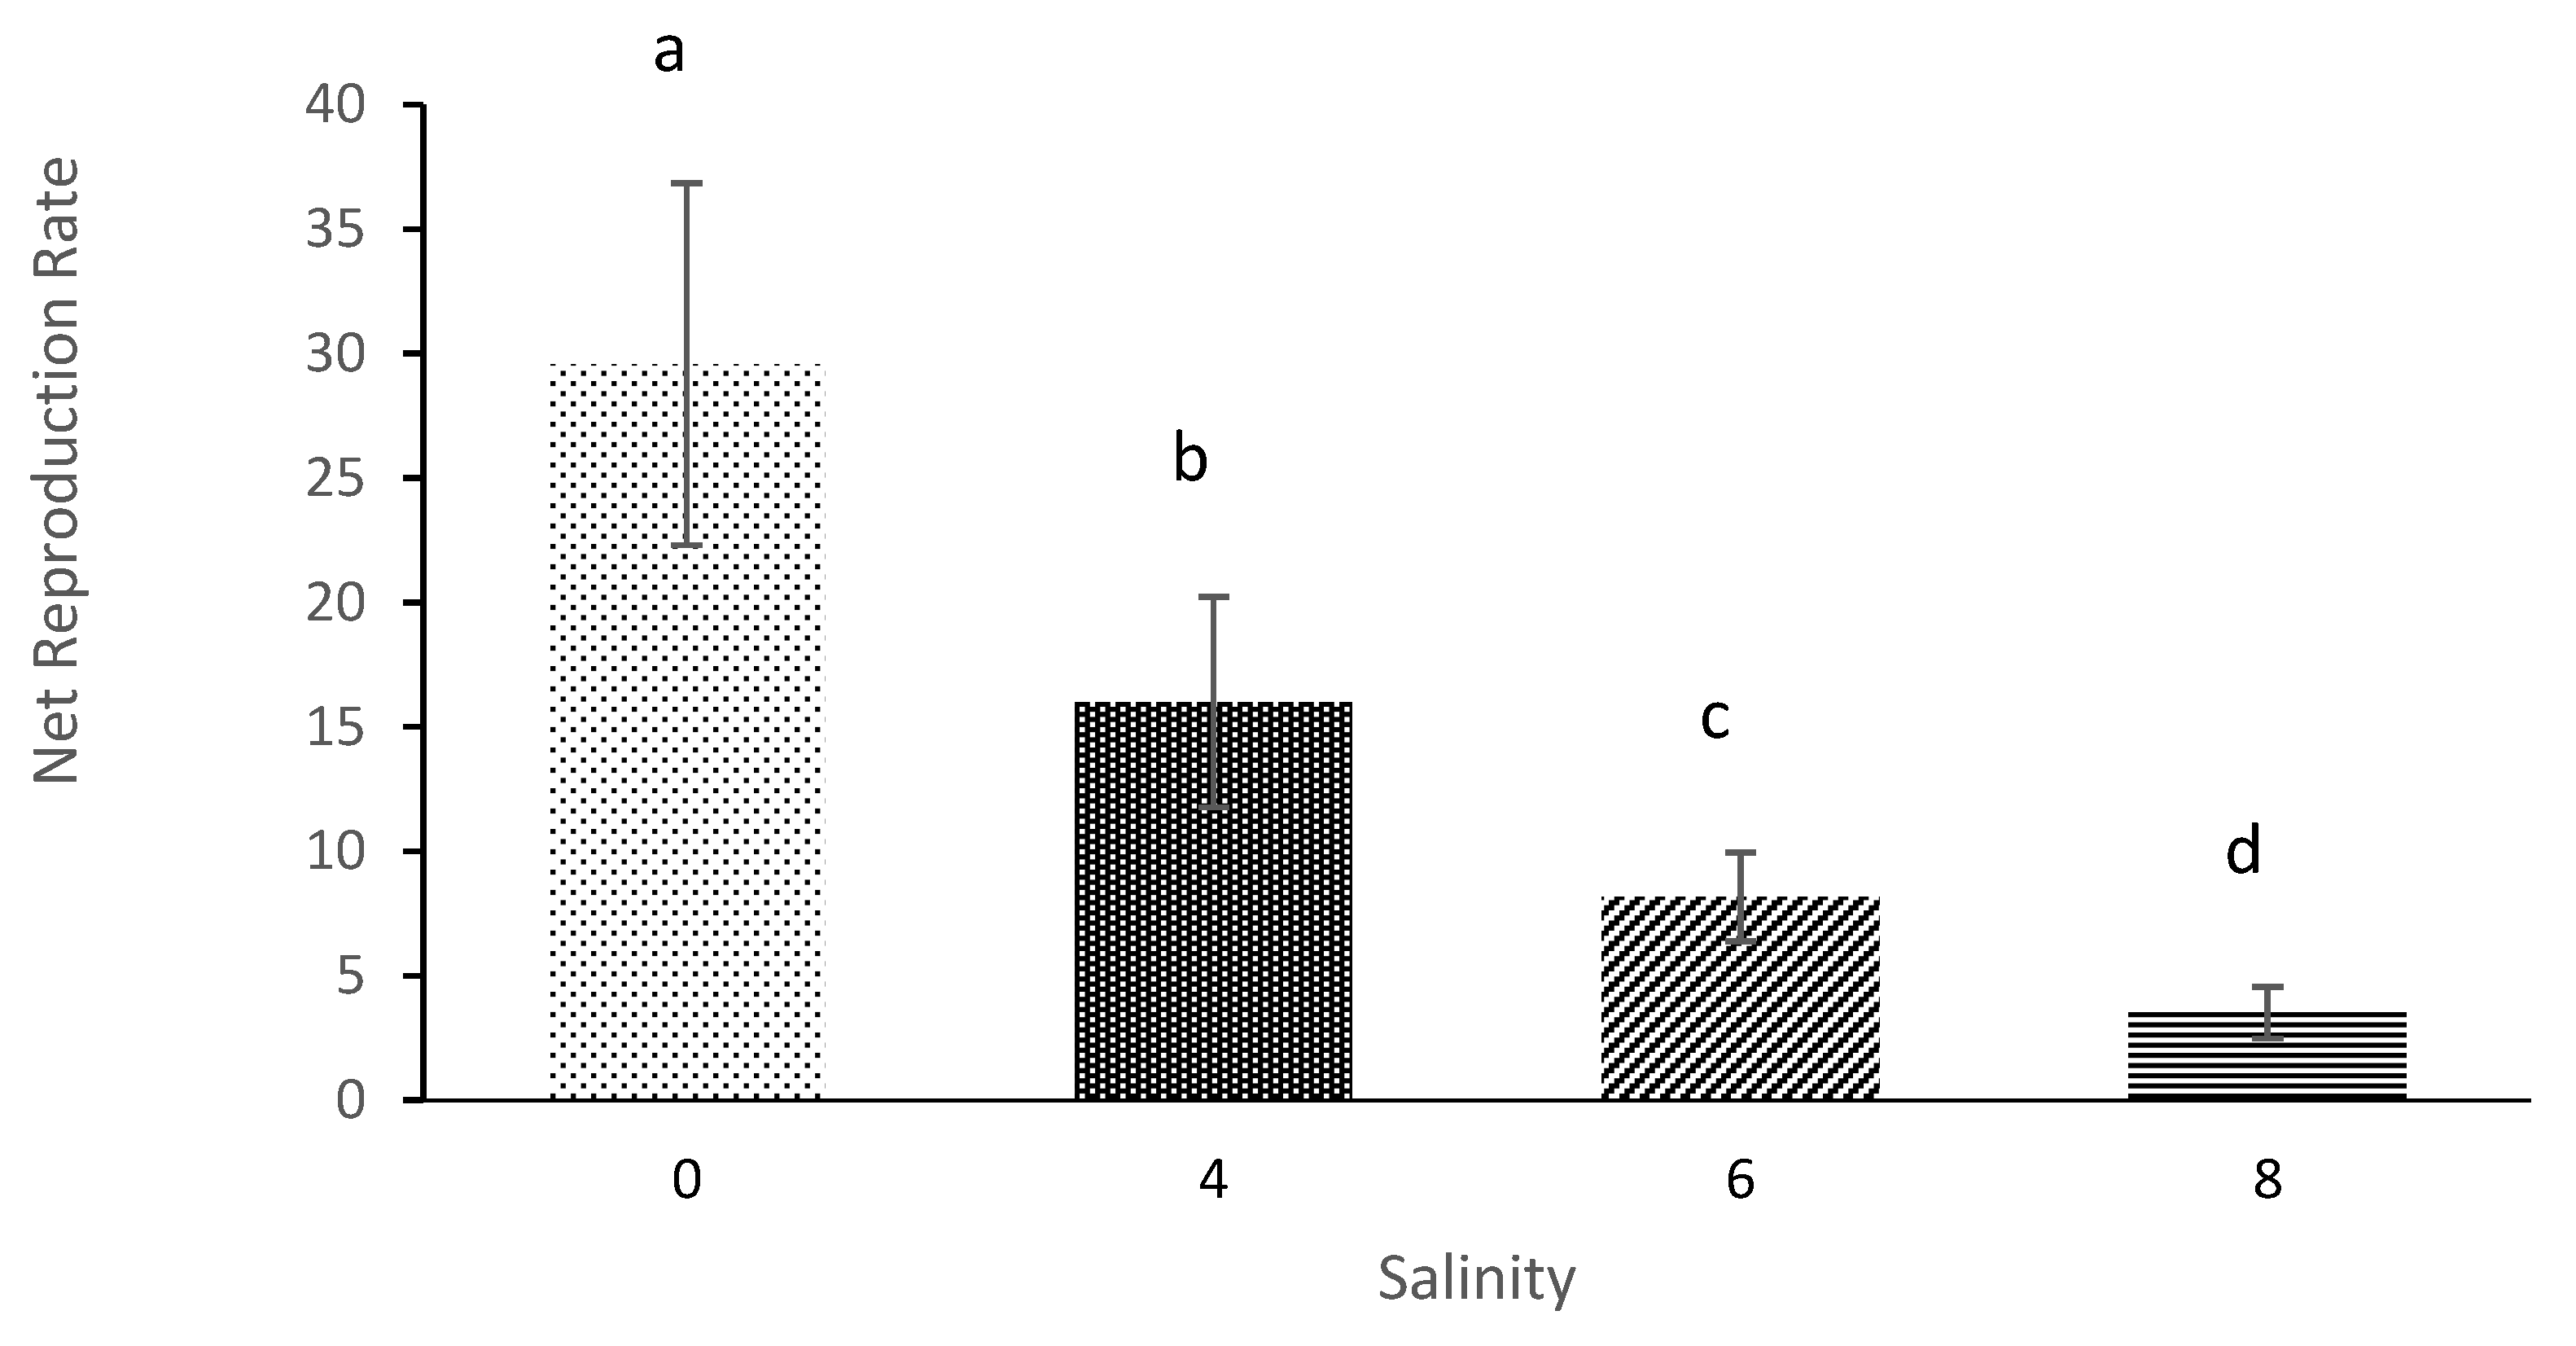
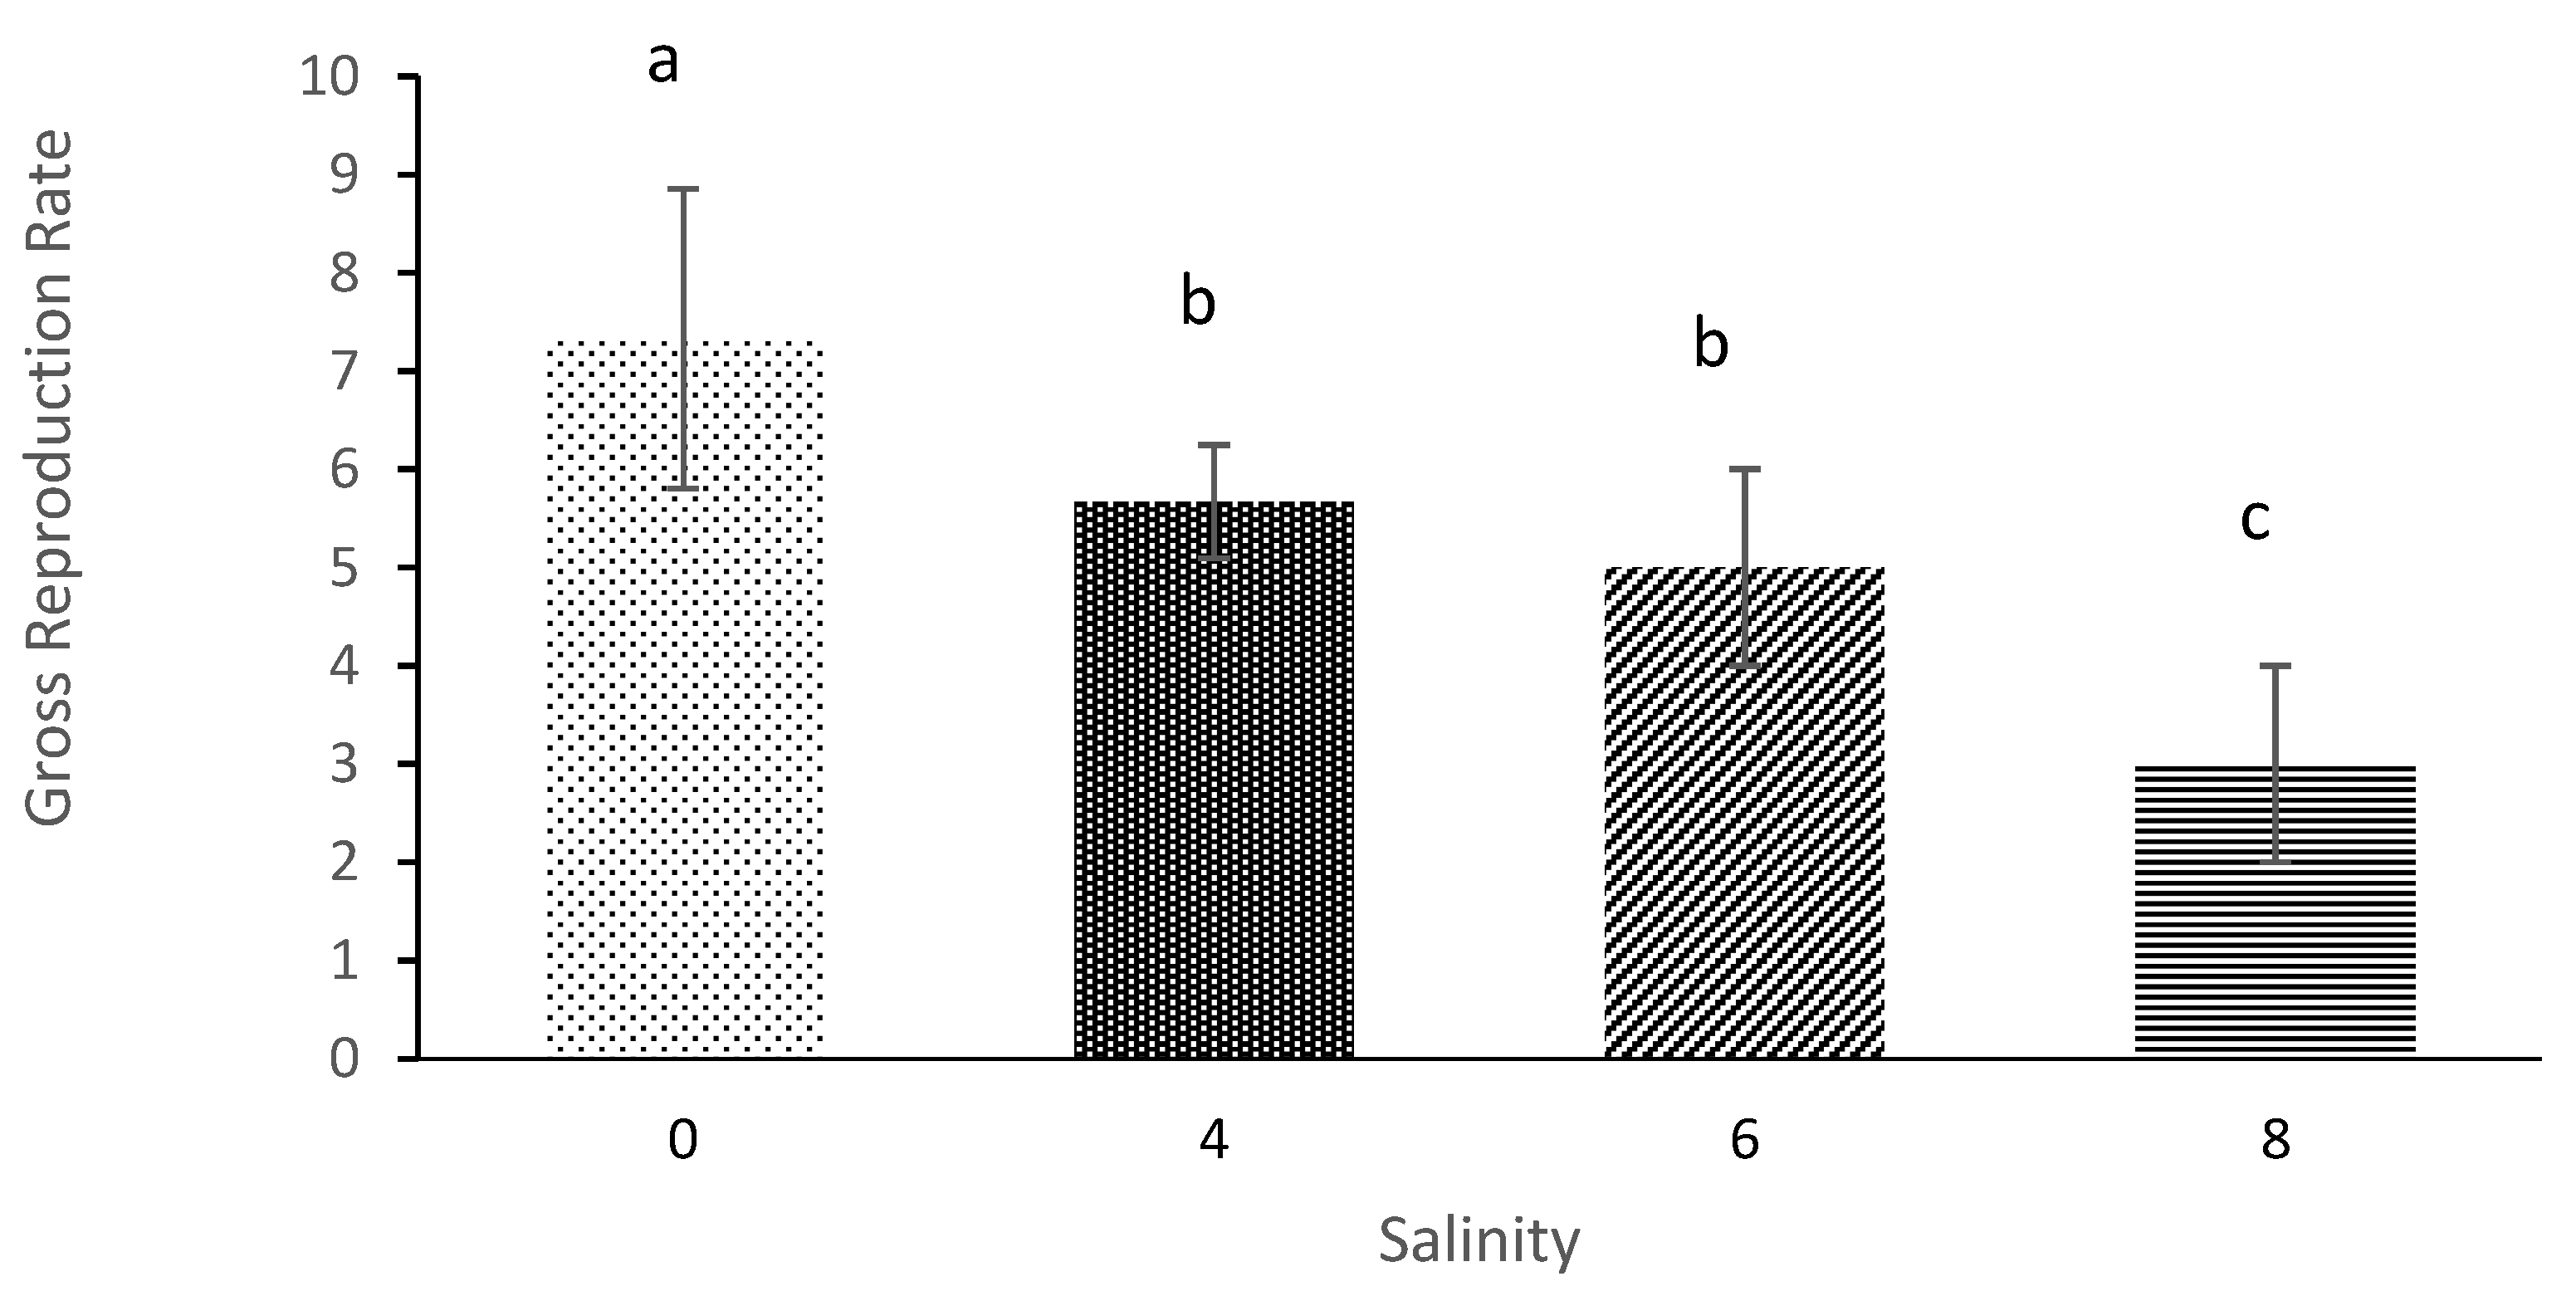
The offspring net and gross reproduction rates of M. macrocopa were also affected when salinity increased. The previous study also showed that the number of offspring produce was the most affected parameters on the life table as caused by an increase of salinity for D. magna and D. longispina [45]. Furthermore, in an observation-based study by [39], the findings also showed that the offspring of Latonopsis australis were significantly influenced by high salinity. It is concluded that salinity clearly impacts reproduction of offspring of this cladoceran.
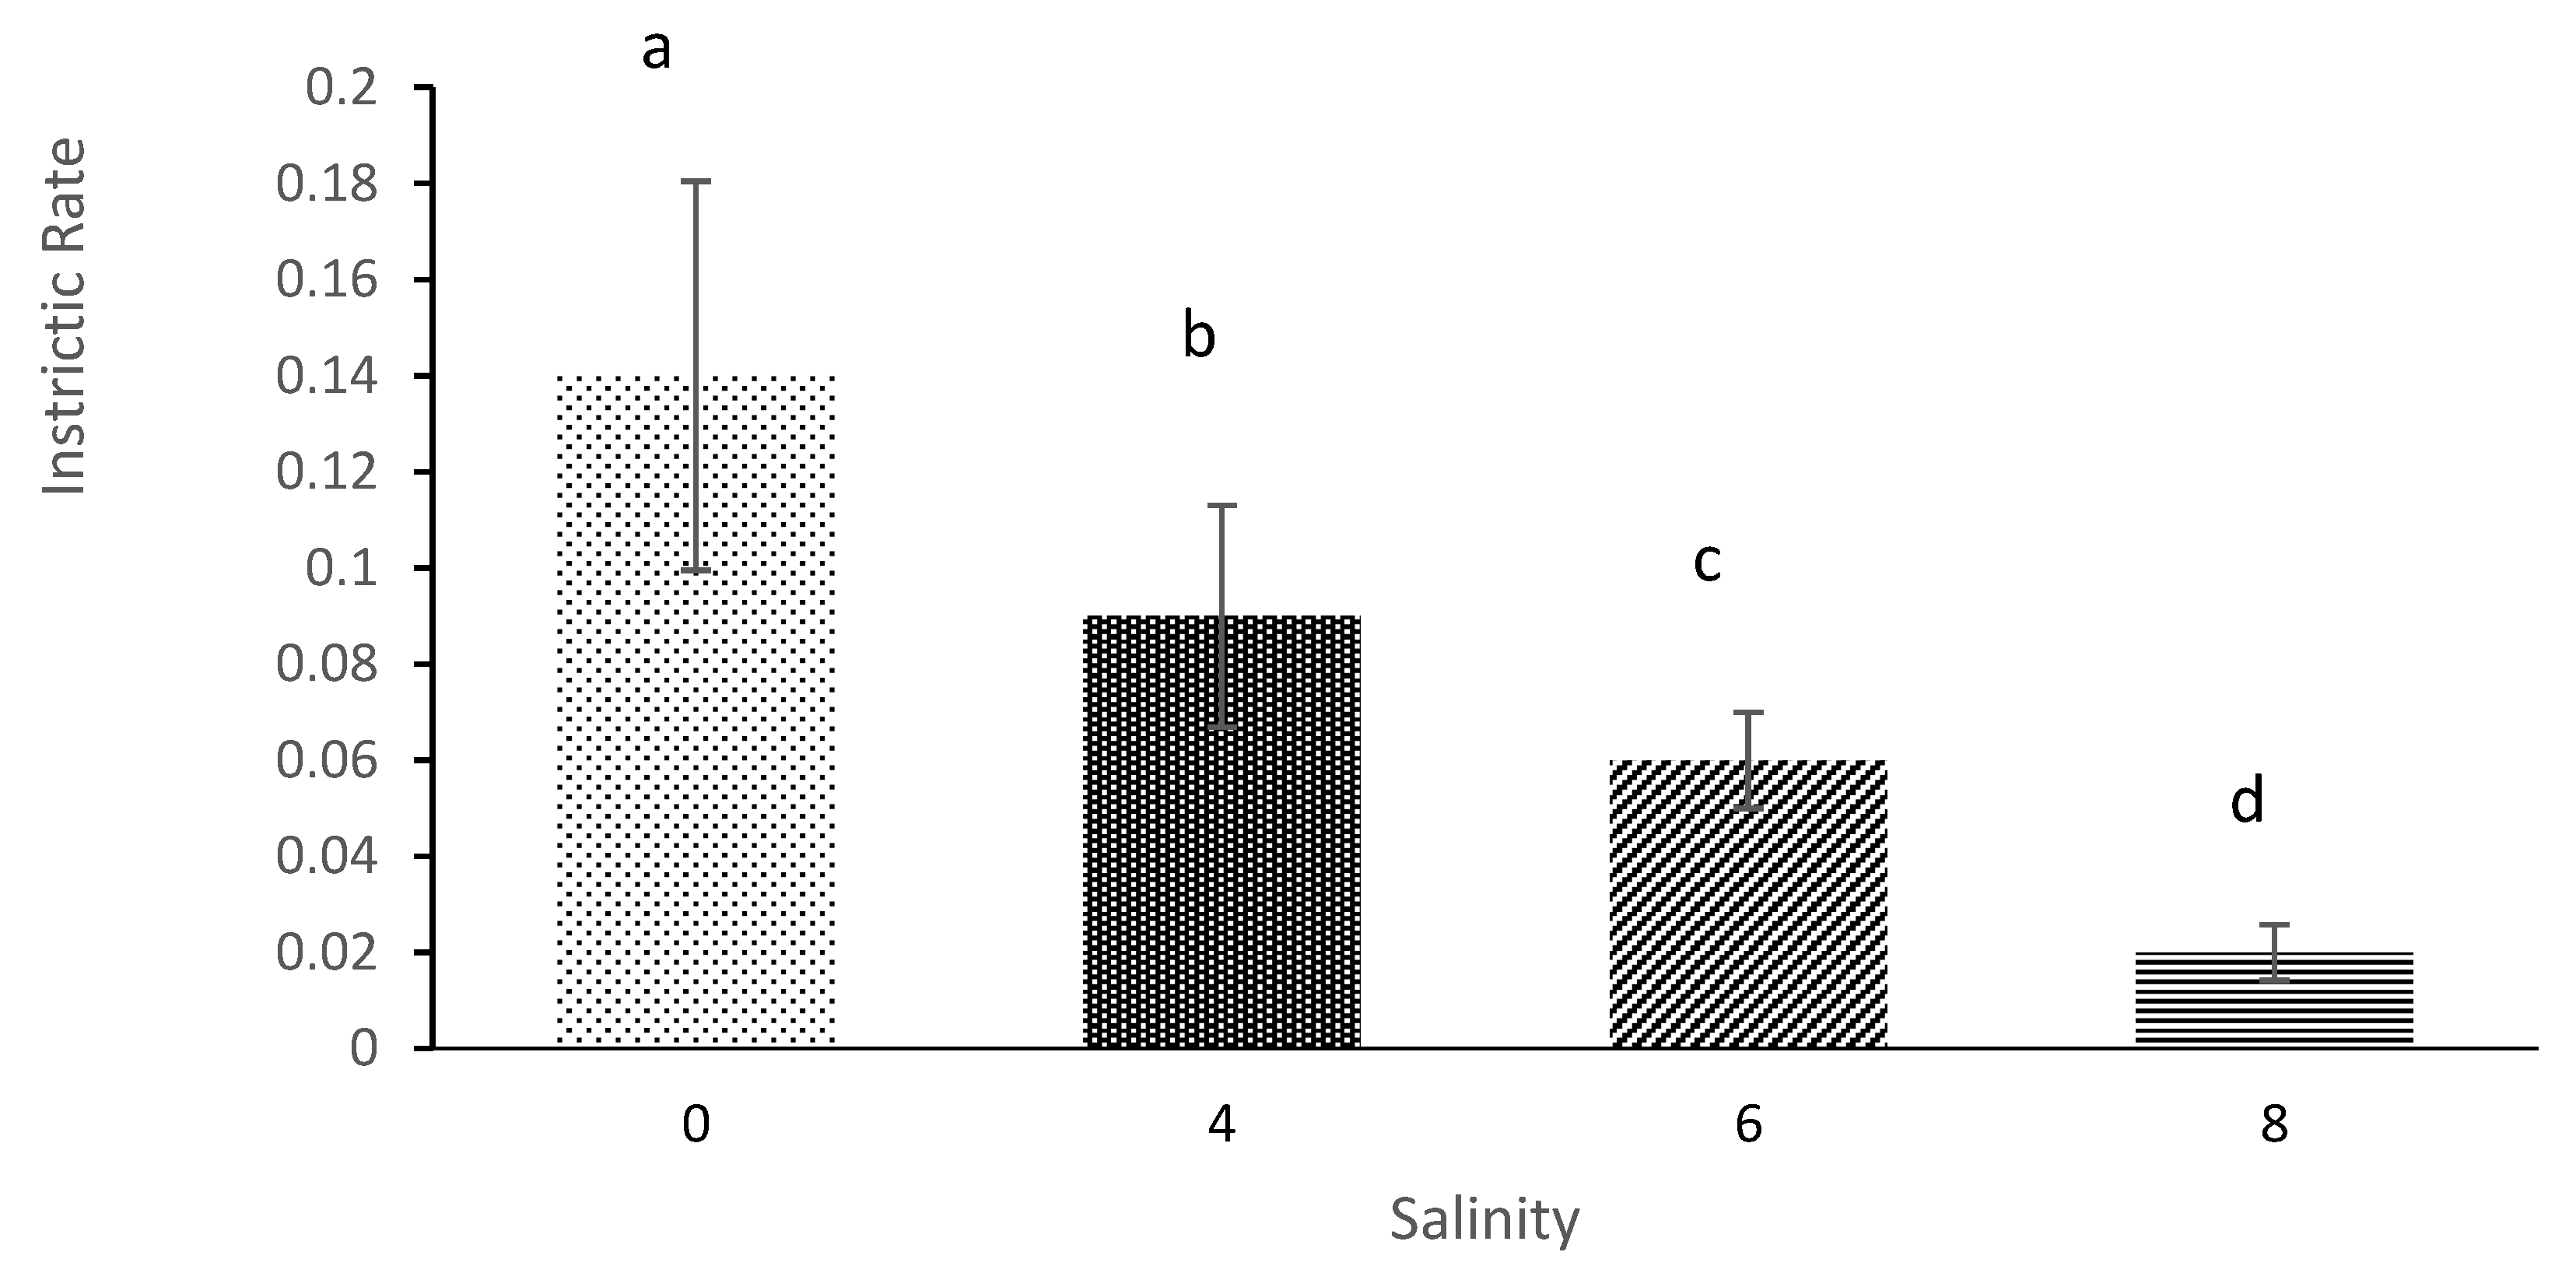
Salinity levels impact the intrinsic rate (births minus deaths) for M. macrocopa population. This claim was supported in similar research done by [39] where the intrinsic rate of Latonopsis australis decreased when the salinity levels of treatments increased. In the current study, life table parameters at salinity more than 8 also cannot be reliably acquired because salinity higher than 8 is beyond the tolerance of M. macrocopa. [13] D. longispina reproduced and lived well in salinity below salinity 5 but then started to decline when salinity levels increased. Thus, the present study concludes that M. macrocopa can achieve the optimum growth population when salinity is below 6. Zooplankton is sensitive to change in the aquatic environment that can significantly change ambient conditions within the aquatic ecosystem [46]. The increase of salt concentration can cause the disappearance of species that cannot tolerate highly saline conditions. Meanwhile, salinity is a strong mechanism that can change aquatic communities [47].
Furthermore, no life table data can be recorded for salinities of 12 and 15 since the M. macrocopa are dead before being able to reproduce. Therefore, various freshwater invertebrate species (including cladocerans) are more sensitive to NaCl salinity than to the effect produced by the array of chemical compounds present in sea salt [41]. Higher content of salinity level might be fatal to freshwater cladocerans especially M. macrocopa. The highest salinity at which life table could be recorded was only at salinity 8. It is strongly supported by [4], the highest salinity will cause cladoceran stress and mortality. Apart from that, M. macrocopa that spending most of their life stages under good conditions (food and environment) may adapt their salinity tolerance only with considerable time-lags.
The observations in the current study showed that fatty acid expression is higher at the optimum culture conditions (salinity 0 and 4) compared to other salinity level treatments. This effect is probably due to the minimal stress undergone by the cultured M. macrocopa at these optimum conditions, which is finally reflected in obtaining a rich fatty acid profile. Similar observations were also reported [48,49,50] where live feed underwent minimal stress during the culture period produced superior survival, growth and reproduction. High polyunsaturated fatty acids achieved by M. macrocopa might be due to Nannochloropsis sp. as food sources, which were conducted to imitate feed in the natural environment. The amount of EPA and DHA in algae varies greatly among different algal species and environmental conditions. EPA content in Nannochloropsis sp. is 23.4 mg g−1 [24]. Microalgae such as Nannochloropsis sp. have received increasing interest as a target live feed for aquatic animals because of the high contents of EPA [7].

5. Conclusions

In conclusion, the survival, growth, reproduction rate, and fatty acid profile of M. macrocopa were affected by different salinity treatment ranges. M. macrocopa produced better growth rate, survival rate, and productivity at the salinity of 0 which is a normal freshwater environment. Salinity at 4 also provided relatively good growth for M. macrocopa. Most of the present study results showed no significant difference between salinity treatments of 0 and 4. The salinity above 8 was intolerable for M. macrocopa and to be above the critical salinity maximum (CSMax) or acute phase for cladoceran. Apart from that, fatty acid content also significantly abated with increased salinity levels. The highest content of fatty acid produced was with M. macrocopa being cultured in optimal salinity levels of 0 and 4, which are considered to be normal in their natural habitat. Some cladocera species’ ability to withstand stressful physiological environments, such as increased salinity, leads to a shelter from severe predation and competition typically found in more complex populations. It also can be expected that cladocera species capable of surviving under these conditions are those competitively disadvantaged or more susceptible to predation. That might be the case for Moina sp., which can grow at Setiu Wetland during times of significantly increased salinity [51]. Furthermore, salinity can directly and indirectly affect aquatic organism population dynamics. Small changes in salinity tend to be beneficial under natural conditions, where salinity can directly and indirectly mediate multiple biotic and abiotic processes [52]. Overall, the result of direct and indirect effects of minor salinity changes under natural conditions, advantaging cladocera’s population growth.
Comparing results in the whole NaCl concentration range tested, we can conclude that the impairment effects on fatty acid content, growth, reproduction, and survival under the current treatments were provoked by salinity stress. Although the result of the present study shows that the survival rate, life history and fatty acids of M. macrocopa were significantly affected by the increase in salinity, future detailed studies are required to understand how freshwater species, including other species of zooplankton which can adapt to a higher saline stressed environment. The present results shown for the responses of neonates towards different salinity can further indicated the similar physiological reactions on the adult’s stages of Moina macrocopa. Thus, future researchers can use these findings for further study and research on the development of species characterization and on the factors affecting the abundance and zooplankton composition within the freshwater community, thus providing more ecologically relevant information on primary productivity in the ecosystem.

Supplementary Materials

The following are available online at https://0-www-mdpi-com.brum.beds.ac.uk/1424-2818/13/3/105/s1, Figure S1: The hypothesis test summary of the survival in M. macrocopa, Figure S2: The hypothesis test summary of the survival in M. macrocopa. Figure S3: The hypothesis test summary of the survival data, Table S1: The detailed SPSS data on the growth of M. macrocopa., Table S2: The ANOVA results on the growth of M. macrocopa in responds to different salinity, Table S3: The survival of M. macrocopa in responds to different salinity, Table S4: Population density data of M. macrocopa, Table S5: The mean, standard deviation, sum of squares data on the effect of salinity on survival and reproductive capacity of M. macrocopa in response to different salinity; Table S6: The ANOVA data on fatty acid effects in response to different salinity.

Author Contributions

N.W.R. plan the idea of the overall research and assist in the research framework, H.S., A.Y., S.N. had done the research. A.H. and M.A.G. assist in revising and improve the clarity of the overall manuscript. A.H. involved in providing ideas through his previous works. All authors have read and agreed to the published version of the manuscript.

Funding

This work is jointly supported by the Knowledge Transfer Grant (Vot Number 58106), and LRGS Grant (Vot Number 56040) under Ministry of Higher Education Malaysia.

Institutional Review Board Statement

Not Applicable.

Informed Consent Statement

Not Applicable.

Data Availability Statement

The data presented in this study are available on request from the corresponding author. The data are not publicly available due to privacy.

Acknowledgments

We wish to thank our laboratory and hatchery assistances En. Mat Zain, En. Yaacob and En. Adhwa for their advice and facilities support.

Conflicts of Interest

The authors declare no conflict of interest.

References

  1. Schallenberg, M.; Hall, C.J.; Burns, C.W. Consequences of climate-induced salinity increases on zooplankton abundance and diversity in coastal lakes. Mar. Ecol. Prog. Ser. 2003, 251, 181–189. [Google Scholar] [CrossRef]
  2. Suzuki, M.S.; Figueiredo, R.O.; Castro, S.C.; Silva, C.F.; Pereira, E.A.; Silva, J.A.; Aragon, G.T. Sand bar opening in a coastal lagoon (Iquipari) in the northern region of Rio de Janeiro State: Hydrological and hydrochemical changes. Braz. J. Biol. 2002, 62, 51–62. [Google Scholar] [CrossRef] [PubMed] [Green Version]
  3. Santangelo, J.M.; Rocha, A.D.M.; Bozelli, R.L.; Carneiro, L.S.; Esteves, F.D.A. Zooplankton responses to sandbar opening in a tropical eutrophic coastal lagoon. Estuar. Coast. Shelf Sci. 2007, 71, 657–668. [Google Scholar] [CrossRef]
  4. Suhett, A.L.; Steinberg, C.E.W.; Santangelo, J.M.; Bozelli, R.L.; Farjalla, V.F. Natural dissolved humic subtances increases the lifespan and promote transgenerational resistance to salt stress in the cladoceran Moina macrocopa. Environ. Sci. Pollut. Res. 2011, 18, 1004–1014. [Google Scholar] [CrossRef]
  5. Vieira, A.C.B.; Medeiros, A.M.A.; Ribeiro, L.L.; Crispim, M.C. Population Dynamics of Moina minuta (Hansen, 1899), Ceriodaphnia cornuta (Sars, 1886), and Diaphanosoma spinulosum (Herbst, 1967) (Crustacean: Branchiopoda) in Different Nutrients (N and P) Concentration Ranges. Acta Limnol. Bras. 2011, 23, 1–9. [Google Scholar] [CrossRef]
  6. Bezirci, G.; Akkas, S.B.; Rinke, K.; Yildirim, F.; Kalaylioglu, Z.; Severcan, F.; Beklioglu, M. Impacts of salinity and fish-exuded kairomone on the survival and macromolecular profile of Daphnia pulex. Ecotoxicology 2012, 21, 601–614. [Google Scholar] [CrossRef] [PubMed]
  7. Rasdi, N.W.; Arshad, A.; Ikhwanuddin, M.; Hagiwara, A.; Yusoff, F.M.; Azani, N. A review on the improvement of cladocera (Moina) nutrition as live food for aquaculture: Using valuable plankton fisheries resources. J. Environ. Biol. 2020, 41, 1239–1248. [Google Scholar] [CrossRef]
  8. Castro, B.B.; Loureiro, C.; Cuo, A.P.; Pedrosa, M.A.; Goncales, F. Life-history responses of salinity-tolerant and salinity-sensitive lineages of stenohalinecladocerans do not confirm clonal differentiation. Hydrobiologia 2012, 702, 73–82. [Google Scholar] [CrossRef]
  9. Gabriela, C.; Alicia, V.; Santiago, E. Acute effects of Nacl and Na2SO4 on Daphnia menucoensis Paggi, 1996 and Moina eugeniae Olivier, 1954 (Crustacea, Cladocera). Res. Zool. 2014, 4, 8–12. [Google Scholar] [CrossRef]
  10. Rasdi, N.W.; Qin, J.G. Copepod supplementation as a live food improved growth and survival of Asian seabass Lates calcarifer larvae. Aquac. Res. 2018, 49, 3606–3613. [Google Scholar] [CrossRef]
  11. Rasdi, N.W.; Qin, J.G. Impact of food type on growth, survival and reproduction of the cyclopoid copepod Cyclopina kasignete as a potential live food in aquaculture. Aquac. Int. 2018, 26, 1281–1295. [Google Scholar] [CrossRef]
  12. Samat, N.A.; Yusoff, F.M.; Rasdi, N.W.; Karim, M. Enhancement of live food nutritional status with essential nutrients for improving aquatic animal health: A review. Animals 2020, 10, 2457. [Google Scholar] [CrossRef]
  13. Canedo-Arguelles, M.; Hawkins, C.P.; Kefford, B.J.; Schafer, R.B.; Dyack, B.J.; Brucet, S.; Buchwalter, D.; Dunlop, J.; Fror, O.; Lazorchak, J.; et al. Saving freshwater from salts. Science 2016, 351, 914–916. [Google Scholar] [CrossRef] [PubMed]
  14. Gokce, D.; Turhan, D.O. Effects of salinity tolerance on survival and life history of 2 cladocerans. Turk. J. Zool. 2014, 38, 347–353. [Google Scholar] [CrossRef]
  15. Afonina, E.Y.; Tashlykova, N.A. Plankton community and the relationship with the environment in slaine lakes of Onon-Torey plain, Northeastern Mongolia. Saudi J. Biol. Sci. 2017. [Google Scholar] [CrossRef]
  16. El-Gamal, M.M.; Mona, M.H.; Abdel, R.F.; Salim, H.K.; Nour Eldeen, M.F. Salinity and temperature effect on survival and life history of freshwater cladoceran Daphnia longispina inhabiting Egyptian water. Sci. Afric J. Sci. Issues Res. Essays 2014, 2, 365–374. [Google Scholar]
  17. Teschner, M. Effects of salinity on the life history and fitness of Daphnia magna: Variability within and between populations. In Cladocera as Model Organisms in Biology; Springer: Dordrecht, The Netherlands, 1995; pp. 33–41. [Google Scholar]
  18. Freitas, E.C.; Rocha, O. Acute and chronic effects of sodium and potassium on the tropical freshwater cladoceran Pseudosida ramosa. Ecotoxicology 2010, 20, 88–96. [Google Scholar] [CrossRef] [PubMed]
  19. Sarma, S.S.S.; Nandini, S.; Morales-Ventura, J.; Delgado-Martínez, I.; González-Valverde, L. Effects of NaCl salinity on the population dynamics of freshwater zooplankton (rotifers and cladocerans). Aquat. Ecol. 2006, 40, 349. [Google Scholar] [CrossRef]
  20. Ismail, S.S.; Ramli, N.H.; Semawi, N.M.; Kadir, M.A.A.; Ali, A.N. Variations in physico-chemical parameters and Chl-a concentration in Setiu Wetlands lagoon during the northeast and inter-monsoon seasons 2018. In Proceedings of the IOP Conference Series: Earth and Environmental Science, Changsha, China, 18–20 September 2020; IOP Publishing: Bristol, UK, 2020; Volume 494, p. 012014. [Google Scholar]
  21. Martinez-Jeronimo, F.; Martinez-Jeronimo, L. Chronic effect of NaCl salinity on a freshwater strain of Daphnia magna Straus (Crustacea: Cladocera): A demographic study. Ecotoxicol. Environ. Saf. 2007, 67, 411–416. [Google Scholar] [CrossRef]
  22. Forro Korovchinsky, N.M.; Kotov, A.A.; Petrusek, A. Global diversty of cladoceran (Cladocera; crustacean) in freshwater animal diversity assessment. Hydrobiologia 2008, 595, 177–184. [Google Scholar] [CrossRef]
  23. Gama-Flores, J.L.; Huidobro-Salas, M.E.; Sarma, S.S.S.; Nandini, S.; Zepeda-Mejia, R.; Gulati, R.D. Temperature and age affect the life history characteristics and fatty acid profiles of Moina macrocopa (Cladocera). J. Therm. Biol. 2015, 53, 135–142. [Google Scholar] [CrossRef]
  24. Gani, P.; Sunar, N.M.; Matias-Peralta, H.; Abdul Latiff, A.A.; Abdul Razak, A.R. Influence of Initial Cell Concentrations on the Growth Rate and Biomass Productivity of Microalgae in Domestic Wastewater. Appl. Ecol. Environ. Res. 2016, 14, 399–409. [Google Scholar] [CrossRef]
  25. El-Deeb, G.M.M.; Habashy, M.M.; Kossa, F.I.; Mohammady, E.Y. Effects of salinity on survival, growth and reproduction of the water flea, Daphnia magna. Nat. Sci. 2009, 7, 28–42. [Google Scholar]
  26. Goncalves AM, M.; Castro, B.B.; Pardal, M.A.; Goncalves, F. Salinity effects on survival and life history of two freshwater cladocerans (Daphnia magna and Daphnia longispina). Ann. Limnol. Int. J. Limnol. 2007, 43, 13–20. [Google Scholar] [CrossRef]
  27. Ismail, H.N.; Qin, J.G.; Seuront, L. Dietary responses of the brackish cladoceran Daphniopsis australis fed on different algal species. J. Exp. Mar. Biol. Ecol. 2011, 409, 275–282. [Google Scholar] [CrossRef]
  28. Grzesiuk, M.; Mikulski, A. The effect of salinity on freshwater crustaceans. Pol. J. Ecol. 2006, 54, 669–674. [Google Scholar]
  29. Haridevan, G.; Jyothibabu, R.; Arunpandi, N.; Jagadesan, L.; Biju, L. Influence of salinity on the life table demography of a rare cladoceran. Environ. Monit. Assess. 2015, 187, 643. [Google Scholar] [CrossRef]
  30. Kumar, K.H.; Kiran, B.R. A report on diversity of cladocera in sewage fed tank of Bhadravathi taluk, Karnataka. Int. J. Fauna Biol. Stud. 2016, 3, 18–20. [Google Scholar]
  31. Hardy Elsa, R.; Duncan, A. Food Concentration and Temperature Effects on Life Cycle Characteristics of Tropical Cladocera (Daphnia gessneri Herbst, Diaphanosoma sarsi Richard, Moina reticulate (Daday)): I. Development Time. Acta Amaz. 1994, 24, 119–134. [Google Scholar] [CrossRef] [Green Version]
  32. Pianka, E.R. Evolutionary Ecology, 4th ed.; Harper and Row: New York, NY, USA, 1988; 468p. [Google Scholar]
  33. Ichihara, K.; Fukubayashi, Y. Preparation of fatty acid methyl esters for gas-liquid chromatography. J. Lipid Res. 2010, 51, 3635–3640. [Google Scholar] [CrossRef] [Green Version]
  34. Fuster, I.H.; Retter, C.V.; Sabat, P.; Jiliberto, R.R. Osmoregulatory and demographic responses to salinity of the exotic cladoceran Daphnia exilis. J. Plankton Res. 2010, 32, 1405–1411. [Google Scholar] [CrossRef] [Green Version]
  35. Iannacone, O.; Alvariño, F. Evaluation of the environmental risk of cartep insecticide in bioassays with three invertebrates. Tech. Agric. 2002, 62, 366–374. [Google Scholar] [CrossRef]
  36. Coldsnow, K.D.; Matters, B.M.; Hintz, W.D.; Relyea, R.A. Rapid evolution of tolerance to road salt in zooplankton. Environ. Pollut. 2017, 222, 367–373. [Google Scholar] [CrossRef]
  37. Kefford, B.J.; Palmer, C.G.; Pakhomova, L.; Nugegoda, D. Comparing test systems to measure the salinity tolerance of freshwater invertebrates. Water SA 2004, 30, 499–506. [Google Scholar] [CrossRef] [Green Version]
  38. Anton-Pardo, M.; Armengol, Z. Effects of salinity and water temporality on zooplankton community in coastal Mediterranean ponds. Estuar. Coast. Shelf Sci. 2012, 114, 93–99. [Google Scholar] [CrossRef]
  39. Lani, M.N.; Rivan, N.F.M.; Ismail, A.; Omar, W.B.W.; Hassan, Z.; Suhaili, Z. Comparative Study of Physico-Chemical Analyses of Different Water Resources in Setiu Wetland, Terengganu. Food Sci. Technol. 2018, 25–37. [Google Scholar] [CrossRef]
  40. Patil, V.; Källqvist, T.; Olsen, E.; Vogt, G.; Gislerød, H. Fatty acid composition of 12 microalgae for possible use in aquaculture feed. Aquac. Int. 2007, 15, 1–9. [Google Scholar] [CrossRef]
  41. Sarma, S.S.S.; Nandini, S. Review of recent ecotoxicological studies on cladocerans. J. Environ. Sci. Health Part B 2006, 41, 1417–1430. [Google Scholar] [CrossRef] [PubMed]
  42. Püttmann, M.; Krug, H.; von Ochsenstein, E.; Kattermann, R. Fast HPLC Determination of Serum Free Fatty Acids in the Picomole Range. Clin. Chem. 1993, 39, 825–832. [Google Scholar] [CrossRef] [PubMed]
  43. Tabet, R.; Ayadi, H.; Koken, M.; Leignel, V. Homeostatic responses of crustaceans to salinity changes. Hydrobiologia 2017, 799, 1–20. [Google Scholar] [CrossRef]
  44. Loureiro, C.; Pereira, J.L.; Pedrosa, M.A.; Gonçalves, F.; Castro, B.B. Competitive outcome of Daphnia-Simocephalus experimental microcosms: Salinity versus priority effects. PLoS ONE 2013, 8, e70572. [Google Scholar] [CrossRef]
  45. Toruan, R.L. Zooplankton community emerging from fresh and saline wetlands. Ecohydrol. Hydrobiol. 2012, 12, 53–63. [Google Scholar] [CrossRef] [Green Version]
  46. Bouchnak, R.; Steinberg, C.E.W. Algal diets and natural xenobiotics impact energy allocation in cladocerans. II. Moina macrocopa and Moina micrura. Limnologica 2013, 44, 23–31. [Google Scholar] [CrossRef]
  47. Rottmann, R.W.; Scott Graves, J.; Watson, C.; Yanong, R.P.E. Culture Techniques of Moina: The Ideal Daphnia for Feeding Freshwater Fish Fry. In UF/IFAS Tropical Aquaculture Laboratory 813; The Institute of Food and Agricultural Sciences IFAS Publishing: Ocala, FL, USA, 1992; pp. 671–5230. [Google Scholar]
  48. Scharf, F.S.; Manderson, J.P.; Fabriziob, M.C. The effects of seafloor habitat complexity on survival of juvenile fishes: Species-specific interactions with structural refuge. J. Exp. Mar. Biol. Ecol. 2006, 335, 167–176. [Google Scholar] [CrossRef]
  49. Soni, H.B.; Thomas, S. Occurrence of zooplanktons at sacred palustrine habitat, Central Gujarat, India, with conservation and management strategies. Int. J. Environ. 2014, 3, 111–121. [Google Scholar] [CrossRef] [Green Version]
  50. Souza, A.T.; Dias, E.; Nogueira, A.; Campos, J.; Marques, J.C.; Martin, I. Population ecology and habitat preferences of juvenile flounder Platichthys flesus (Actinopterygii: Pleuronectidae) in a temperate estuary. J. Sea Res. 2013, 79, 60–69. [Google Scholar] [CrossRef]
  51. Herbst, D.B. Gradients of salinity stress, environmental stability and water chemistry as a templet for defining habitat types and physiological strategies in inland salt waters. In Saline Lakes; Springer: Dordrecht, The Netherlands, 2001; pp. 209–219. [Google Scholar]
  52. Hall, C.J.; Burns, C.W. Mortality and growth responses of Daphnia carinata to increases in temperature and salinity. Freshw. Biol. 2001, 47, 451–458. [Google Scholar] [CrossRef]
Figure 1. The location of sampling area at Setiu Wetland, Terengganu. The online map service retrieves from (https://www.google.com.my/maps/search/setiu+wetland/@4.2777739,101.7082448,7.36z) via Google map.
Diversity 13 00105 g001
Figure 2. Illustration of the sampling method of Moina sp.
Diversity 13 00105 g002
Figure 3. The survival rate of M. macrocopa for different salinity treatments.
Diversity 13 00105 g003
Figure 4. The growth rate of M. macrocopa for different salinity treatments. The different small letters indicate significant differences between different salinity treatments (p < 0.05).
Diversity 13 00105 g004
Figure 5. The average initial age of reproduction of M. macrocopa for different salinity treatments. The different small letters indicate significant differences between different salinity treatments (p < 0.05).
Diversity 13 00105 g005
Figure 6. The average longevity of M. macrocopa for different salinity treatments. The different small letters indicate significant differences between different salinity treatments (p < 0.05).
Diversity 13 00105 g006
Figure 7. The net reproduction rate of M. macrocopa for different salinity treatments. The different small letters indicate significant difference between different salinity treatments (p < 0.05).
Diversity 13 00105 g007
Figure 8. The gross reproduction rate of M. macrocopa for different salinity treatments. The different small letters indicate significant differences between different salinity treatments (p < 0.05).
Diversity 13 00105 g008
Figure 9. The generation time of M. macrocopa for different salinity treatments. The different small letters indicate significant differences between different salinity treatments (p > 0.05).
Diversity 13 00105 g009
Figure 10. The intrinsic rate of population increases of M. macrocopa for different salinity treatments. The different small letters indicate significant differences between different salinity treatments (p < 0.05).
Diversity 13 00105 g010
Table 1. The in-situ parameters of the sampling area.
MonthTemperature (°C)Dissolved Oxygen (mg/L)pHSalinity
1 March 202028.324.217.166.23
1 April 202029.674.457.502.11
2 May 202029.333.897.242.08
Table 2. The survival rate of M. macrocopa on different ranges of salinity. All values are mean ± standard deviation (n = 3). The different small letters indicate significant differences between different salinity (p < 0.05).
SalinitySurvival Rate (%) (Mean ± SD)
091.16 ± 1.67 a
481.89 ± 8.08 b
675.31 ± 7.93 c
843.69 ± 2.20 d
1221.04 ± 1.13 e
1513.35 ± 1.25 e
Table 3. Growth rate of M. macrocopa on different ranges of salinity. All values are mean ± standard deviation (n = 3). The different small letters indicate a significant difference between different salinity levels (p < 0.05).
SalinityGrowth Rate (mm) (Mean ± SD)
01.35 ± 0.28 a
41.32 ± 0.25 a
61.30 ± 0.25 a
80.72 ± 0.61 b
120.39 ± 0.54 c
150.23 ± 0.43 c
Table 4. Life table parameters for M. macrocopa. All values are mean ± standard deviation (n = 3). The different small letters indicate significant differences between different salinity (p < 0.05).
SalinityAverage Initial Age of Reproduction (Days)Average Longevity (Days)Net Reproduction RateGross Reproduction RateGeneration TimeIntrinsic Rate of Population Increases
04.33 ± 0.58 a12.67 ± 0.58 a29.58 ± 7.27 a7.33 ± 1.53 a6.78 ± 2.18 a0.14 ± 0.04 a
45.33 ± 0.58 b9.67 ± 0.58 b16.001 ± 4.23 b5.67 ± 0.57 b9.11 ± 0.84 a0.087 ± 0.023 b
66.67 ± 1.15 c7.33 ± 1.53 b8.17 ± 1.78 c5.00 ± 1.00 c10.56 ± 3.29 a0.060 ± 0.01 c
811.67 ± 0.58 d3.00 ± 01.00 c3.52 ± 1.04 d3.00 ± 1.00 d11.67 ± 0.577 a0.012 ± 0.006 d
12 *------
15 *------
* Life table parameters for salinity 12 and 15 cannot be measured and recorded because all the treatments reached mortality before being able to reproduce.
Table 5. Fatty acid composition (% total fatty acids) of Moina macrocopa grown at different salinities. All values are mean ± standard deviation (n = 3). The different small letters indicate significant differences between; different salinity (p < 0.05). The bold fatty acid species are described in the results.
Fatty AcidSalinities
04681215
C14:03.407 ± 0.189 a2.977 ± 0.157 a1.789 ± 0.65 b0.511 ± 0.168 c0.183 ± 0.002 c0.008 ± 0.006 c
C16:027.746 ± 2.585 a26.220 ± 1.926 a19.451 ± 1.534 b4.427 ± 1.366 c0.017 ± 0.001 d0.007 ± 0.004 d
C16:11.200 ± 0.290 a0.563 ± 0.235 b0.037 ± 0.023 c0.012 ± 0.002 c--
C18:1 (n9)8.867 ± 0.252 a5.923 ± 0.484 b3.380 ± 1.124 c0.920 ± 0.459 d0.1037 ± 0.031 d0.047 ± 0.014 d
C22:1 (n9)0.229 ± 0.0325 a0.062 ± 0.009 b0.007 ± 0.002 c0.002 ± 0.002 c0.001 ± 0.001 c-
C18:2 (n6)24.033 ± 1.952 a13.269 ± 2.376 b5.070 ± 0.354 c1.116 ± 0.703 d0.368 ± 0.319 d0.055 ± 0.044 d
C18:3 (n3)(ALA)0.474 ± 0.047 a0.135 ± 0.047 b0.014 ± 0.020 c0.001 ± 0.001 c--
C20:4 (n6)(ARA)0.616 ± 0.082 a0.145 ± 0.364 b0.041 ± 0.442 c0.006 ± 0.001 d0.002 ± 0.002 d0.001 ± 0.001 d
C20:5 (n3)(EPA)0.725 ± 0.047 a0.420 ± 0.318 a0.004 ± 0.004 b---
C22:6 (n3)(DHA)1.151 ± 0.133 a1.173 ± 0.356 a0.427 ± 0.300 b0.002 ± 0.002 b0.001 ± 0.001 b-
ALA: Alpha-linolenic acid; ARA: Arachidonic acid; EPA: Eicosapentaenoic acid; DHA: Docosahexaenoic acid.
Table 6. Fatty acid composition (% total fatty acids) of Nannochloropsis sp. The bold fatty acid species are described in the results
Fatty AcidNanochloropsis sp.
C14:03.77 ± 1.60
C16:028.14 ± 2.15
C16:118.17 ± 2.68
C18:1(n9)8.02 ± 1.63
C18:2(n6)4.25 ± 0.73
C18:3(n3)(ALA)0.84 ± 0.17
C20:4(n6)(ARA)5.28 ± 1.05
C20:5(n3)(EPA)25.88 ± 3.79
C22:6(n3)(DHA)0.49 ± 0.25
ALA: Alpha-linolenic acid; ARA: Arachidonic acid; EPA: Eicosapentaenoic acid; DHA: Docosahexaenoic acid.
Publisher’s Note: MDPI stays neutral with regard to jurisdictional claims in published maps and institutional affiliations.

