
Diversity of Dominant Soil Bacteria Increases with Warming Velocity at the Global Scale


Department of Bioscience and Bioinformatics, Kyushu Institute of Technology, Iizuka, Fukuoka 820-8502, Japan
*
Author to whom correspondence should be addressed.
Diversity 2021, 13(3), 120; https://0-doi-org.brum.beds.ac.uk/10.3390/d13030120
Submission received: 22 January 2021
/
Revised: 10 March 2021
/
Accepted: 10 March 2021
/
Published: 12 March 2021
(This article belongs to the Section Microbial Diversity and Culture Collections)
Abstract
:Understanding global soil bacterial diversity is important because of its role in maintaining a healthy global ecosystem. Given the effects of environmental changes (e.g., warming and human impact) on the diversity of animals and plants, effects on soil bacterial diversity are expected; however, they have been poorly evaluated at the global scale to date. Thus, in this study, we focused on the dominant soil bacteria, which are likely critical drivers of key soil processes worldwide, and investigated the effects of warming velocity and human activities on their diversity. Using a global dataset of bacteria, we performed spatial analysis to evaluate the effects of warming velocity and human activities, while statistically controlling for the potentially confounding effects of current climate and geographic parameters with global climate and geographic data. We demonstrated that the diversity of the dominant soil bacteria was influenced globally, not only by the aridity index (dryness) and pH but also by warming velocity from the Last Glacial Maximum (21,000 years ago) to the present, showing significant increases. The increase in bacterial diversity with warming velocity was particularly significant in forests and grasslands. An effect of human activity was also observed, but it was secondary to warming velocity. These findings provide robust evidence and advance our understanding of the effects of environmental changes (particularly global warming) on soil bacterial diversity at the global scale.
1. Introduction
Understanding the global biogeography of bacteria in soils is a significant challenge. Soil bacteria play important roles in carbon and nutrient cycling, agriculture, animal (and also human) health, and food webs [1,2,3]. Soil bacterial diversity in particular has been investigated in this context. It is likely related to multiple ecosystem functions and services (i.e., multifunctionality); in particular, it underlies the role of soil in maintaining a healthy global ecosystem [3,4,5,6]. Previous work [1] investigating the global biogeography of soil bacteria found that only 2% of bacterial taxa account for almost half of the soil bacterial communities sampled globally; specifically, 511 dominant soil bacteria phylotypes have been determined and include Alphaproteobacteria, Betaproteobacteria, Actinobacteria, Acidobacteria, and Planctomycetes. These dominant soil bacteria phylotypes are observed worldwide; moreover, they are useful for estimating entire bacterial communities as they are not only dominant but are also associated with subdominant soil bacteria phylotypes [1]. Dominant phylotypes enhance our understanding of global soil bacterial diversity and distribution by narrowing down the number of phylotypes used for investigation from tens of thousands to a few hundred; in particular, they are likely critical drivers, or indicators, of key soil processes worldwide [1].
Given the global importance of soil bacterial diversity, understanding its associations with the surrounding environment is important. Determining the effects of environmental changes (e.g., warming and human impact) on soil biodiversity is of particular interest [2,7,8]. Historical climate change, i.e., warming velocity from the Last Glacial Maximum (LGM; 21,000 years ago) to the present, has been shown to decrease animal endemic diversity [9]; in particular, strong climatic shifts that have occurred since the LGM have affected geographical patterns of species diversity. This indicates that species diversity is more sensitive to environmental changes in areas that have experienced these climatic shifts. In addition to this, human activities and their effects on the climate and environment are causing animal and plant extinctions globally [10,11,12], affecting ecosystem structures [13,14]. These results suggest that environmental changes can affect soil bacterial diversity. Compared to plants and animals, soil bacteria have been less discussed in the context of environmental changes because of the difficulties inherent in their observation. However, the remarkable development of high-throughput sequencing techniques—e.g., 16S ribosomal RNA gene sequencing and metagenomics—has allowed researchers to obtain snapshots of taxonomic compositions of bacterial communities across diverse ecosystems [15]. Using these techniques, several previous studies have reported the effects of environmental changes on species diversity; however, microbes appear to show different responses to environmental changes to those of plants and animals. For example, observed positive associations between bacterial diversity and annual mean temperatures suggest that global warming increases diversity [16,17]; moreover, experimental climate warming increases grassland soil bacterial diversity [18] and accelerates its temporal scaling [19]. Some human activities (e.g., land use) are known to increase bacterial diversity at local [20,21] and regional scales (e.g., across Europe [22]), although other types of land use changes [23] and other human activities (e.g., urbanization [24] and tillage [25]) may reduce soil bacterial diversity.
More focused investigations are required to understand the associations between environmental changes and bacterial diversity. Previous studies have mainly investigated continental-scale bacterial diversity, and evaluations of spatial autocorrelations between sites and environmental variables have been rarely conducted, despite the known importance of these factors [13,14,26]. More importantly, the effects of environmental changes on bacterial diversity are still debatable because previous studies have focused on current temperatures. In particular, many evaluations have been based on the differences in current temperatures between sites rather than temperature changes over time within sites. This issue demonstrates the need for evaluating the effects of warming and human activities at the global scale using spatial analysis. Given the effects of historical climate change (i.e., warming velocity) and human activities on animal diversity, these environmental changes also need to be considered for soil bacterial diversity. This is now possible because of the development of measurement technologies and improvements in database infrastructure that have increased the availability of global datasets of warming velocity [9] and human impact [27].
Controlling for potentially confounding effects of other environmental factors is also important. Many environmental factors are associated with soil bacteria diversity [23]. For example, it is well established that bacterial diversity is related to pH and dryness (e.g., as measured using an aridity index calculated from mean annual precipitation and evapotranspiration) [1,3,16,28]. Precipitation seasonality [29], plant productivity [30,31], and potentially ultraviolet (UV) radiation [32] all affect soil bacterial biodiversity. Climate change is known to influence these factors and global warming may increase precipitation seasonality, plant productivity, and UV [33,34,35]. Soil pH transitions from alkaline to acid when the mean annual precipitation begins to exceed the mean annual potential evapotranspiration [36]. Therefore, there is a need to break down the complex effects of different environmental factors on soil bacterial diversity. Although some previous studies have considered these confounding effects (e.g., [16]), limitations in environmental parameter data availability have resulted in a poor understanding generally.
In this study, we aimed to investigate whether environmental changes (i.e., warming velocity and human impact) affect soil bacterial diversity at the global scale. The dominant soil bacteria considered here were chosen because they are useful for global-scale analyses of soil bacteria [1]. Specifically, consideration of the dominant soil bacteria allows us to evaluate the relationship between soil bacterial diversity and its environment while avoiding regional specificity of the occurrence of soil bacteria (i.e., the effect of subdominant soil bacteria); moreover, it is believed to be useful for forecasting the ecological consequences of ongoing global environmental change [1]. Using a global dataset of dominant bacterial phylotype compositions (constructed in [1]) and databases of environmental parameters, we comprehensively investigated how environmental changes contribute to bacterial diversity at the global scale while statistically controlling for potential confounding effects using spatial analysis.
2. Materials and Methods
2.1. Dataset
We used a global dataset of the compositions of 511 dominant bacterial phylotypes (operational taxonomic units; OTUs) identified from soils collected from 237 locations across 6 continents [1] (see also figshare.com/s/82a2d3f5d38ace925492, accessed on 30 May 2019). The phylotypes were identified at the ≥97% identity level using an algorithm that divides a set of sequences into clusters (see also the Supplementary Materials in [1]). To measure bacterial diversity, we computed the richness, Simpson index, Shannon index, and species evenness (see [37] for the definitions) at the OTU level using R statistical software (version 3.5.0; www.r-project.org, accessed on 25 April 2018) and the package vegan (version 2.5.6).
From the dataset in [1], we also extracted the aridity index (precipitation/evapotranspiration), mean diurnal temperature range (MDR; °C), net primary plant productivity (NPP; normalized difference vegetation index: NDVI [38]), precipitation seasonality (PSEA; coefficient of variation), pH, UV radiation index (unitless), ecosystem type (forest/grassland/shrubland), and latitude and longitude at each observation site. The dataset included 114 forest, 82 grassland, and 41 shrubland data that were analyzed as ecosystem-specific datasets.
Following the procedures mentioned in our previous studies [13,14], we obtained additional climate parameters at each observation site based on their coordinates (i.e., latitude and longitude). Annual mean temperature (AMT; °C) and temperature seasonality (TS; standard deviation) with 2.5-min spatial resolution were obtained from the WorldClim database [27] (version 2.0, release 1; www.worldclim.org, accessed on 6 June 2019). To evaluate the effect of human activities (human impact), we obtained human footprint (HF) scores, which have a spatial resolution of 1-km grid cells, from the Last of the Wild Project [39] (version 3). The HF scores are defined based on human population density, human land use and infrastructure, and human access. Warming velocity (WV) also was computed. As in [9,40], we defined velocity as the temporal AMT gradient divided by the spatial AMT gradient. The temporal gradient is defined as the difference between the current and past AMT. The past AMT was the CCSM3 model-based LGM AMT. We obtained LGM AMT from the WorldClim database (www.worldclim.org/past, acceesed on 6 June 2019). The spatial gradient was the local slope of the current climate surface at the observation site. The WV index represents the instantaneous local velocity along Earth’s surface needed to maintain constant temperatures [41]. We obtained the slope using the function terrain (with the option neighbors = 4) in the R package raster (version 2.9.5).
These data and parameters are available in the Supplementary Materials, Dataset S1.
2.2. Data Analyses
The data analyses were based on the procedures described in our previous publications [13,14]. A brief description is as follows. We performed regression analysis using R to investigate the contribution of each variable to the diversity index. We considered both ordinary least-squares (OLS) regression and the spatial analysis approach (Code S1).
For the OLS regression, after constructing full models encompassing all explanatory variables (AMT, aridity index, HF, MDR, NPP, pH, PSEA, TS, UV, and WV), we selected the best model to obtain the simplest model and to simultaneously avoid multicollinearity in the full model. The best model was selected using the R package MuMIn (version 1.43.6) based on the sample-size-corrected version of the Akaike information criterion (AICc) values. To avoid model selection bias (i.e., the overestimation and underestimation of certain variables in the best model), we adopted a model-averaging approach using MuMIn; in particular, the averaged models were computed using the top 95% confidence set of models. We performed a global Moran’s test to evaluate spatial autocorrelation in the regression residuals using the function lm.morantest.exact in the R package spdep [42] (version 0.6.13).
As in [14,40,43], the richness and WV were log-transformed. The aridity index, PSAE, and NPP were also log-transformed for normality. The variables were standardized to the same scale, with a mean of 0 and a standard deviation of 1, using the scale function in R before analysis.
We considered a spatial eigenvector mapping (SEVM) modeling approach [26,44] to remove spatial autocorrelation in the regression residuals; in particular, the Moran eigenvector approach was adopted using the function SpatialFiltering in the R package spatialreg [42] (version 1.1.5). We selected the best model based on AICc values after constructing full models, as in the case of the OLS regression analysis. We fixed the spatial filter in the model selection procedures [44]. The averaged models were also obtained.
The contribution of each explanatory variable (i.e., environmental parameters) to bacterial diversity was determined significant when the associated p-value was < 0.05. The residuals of the explanatory variables and bacterial diversity were computed using the best models based on the SEVM modeling approach.
3. Results
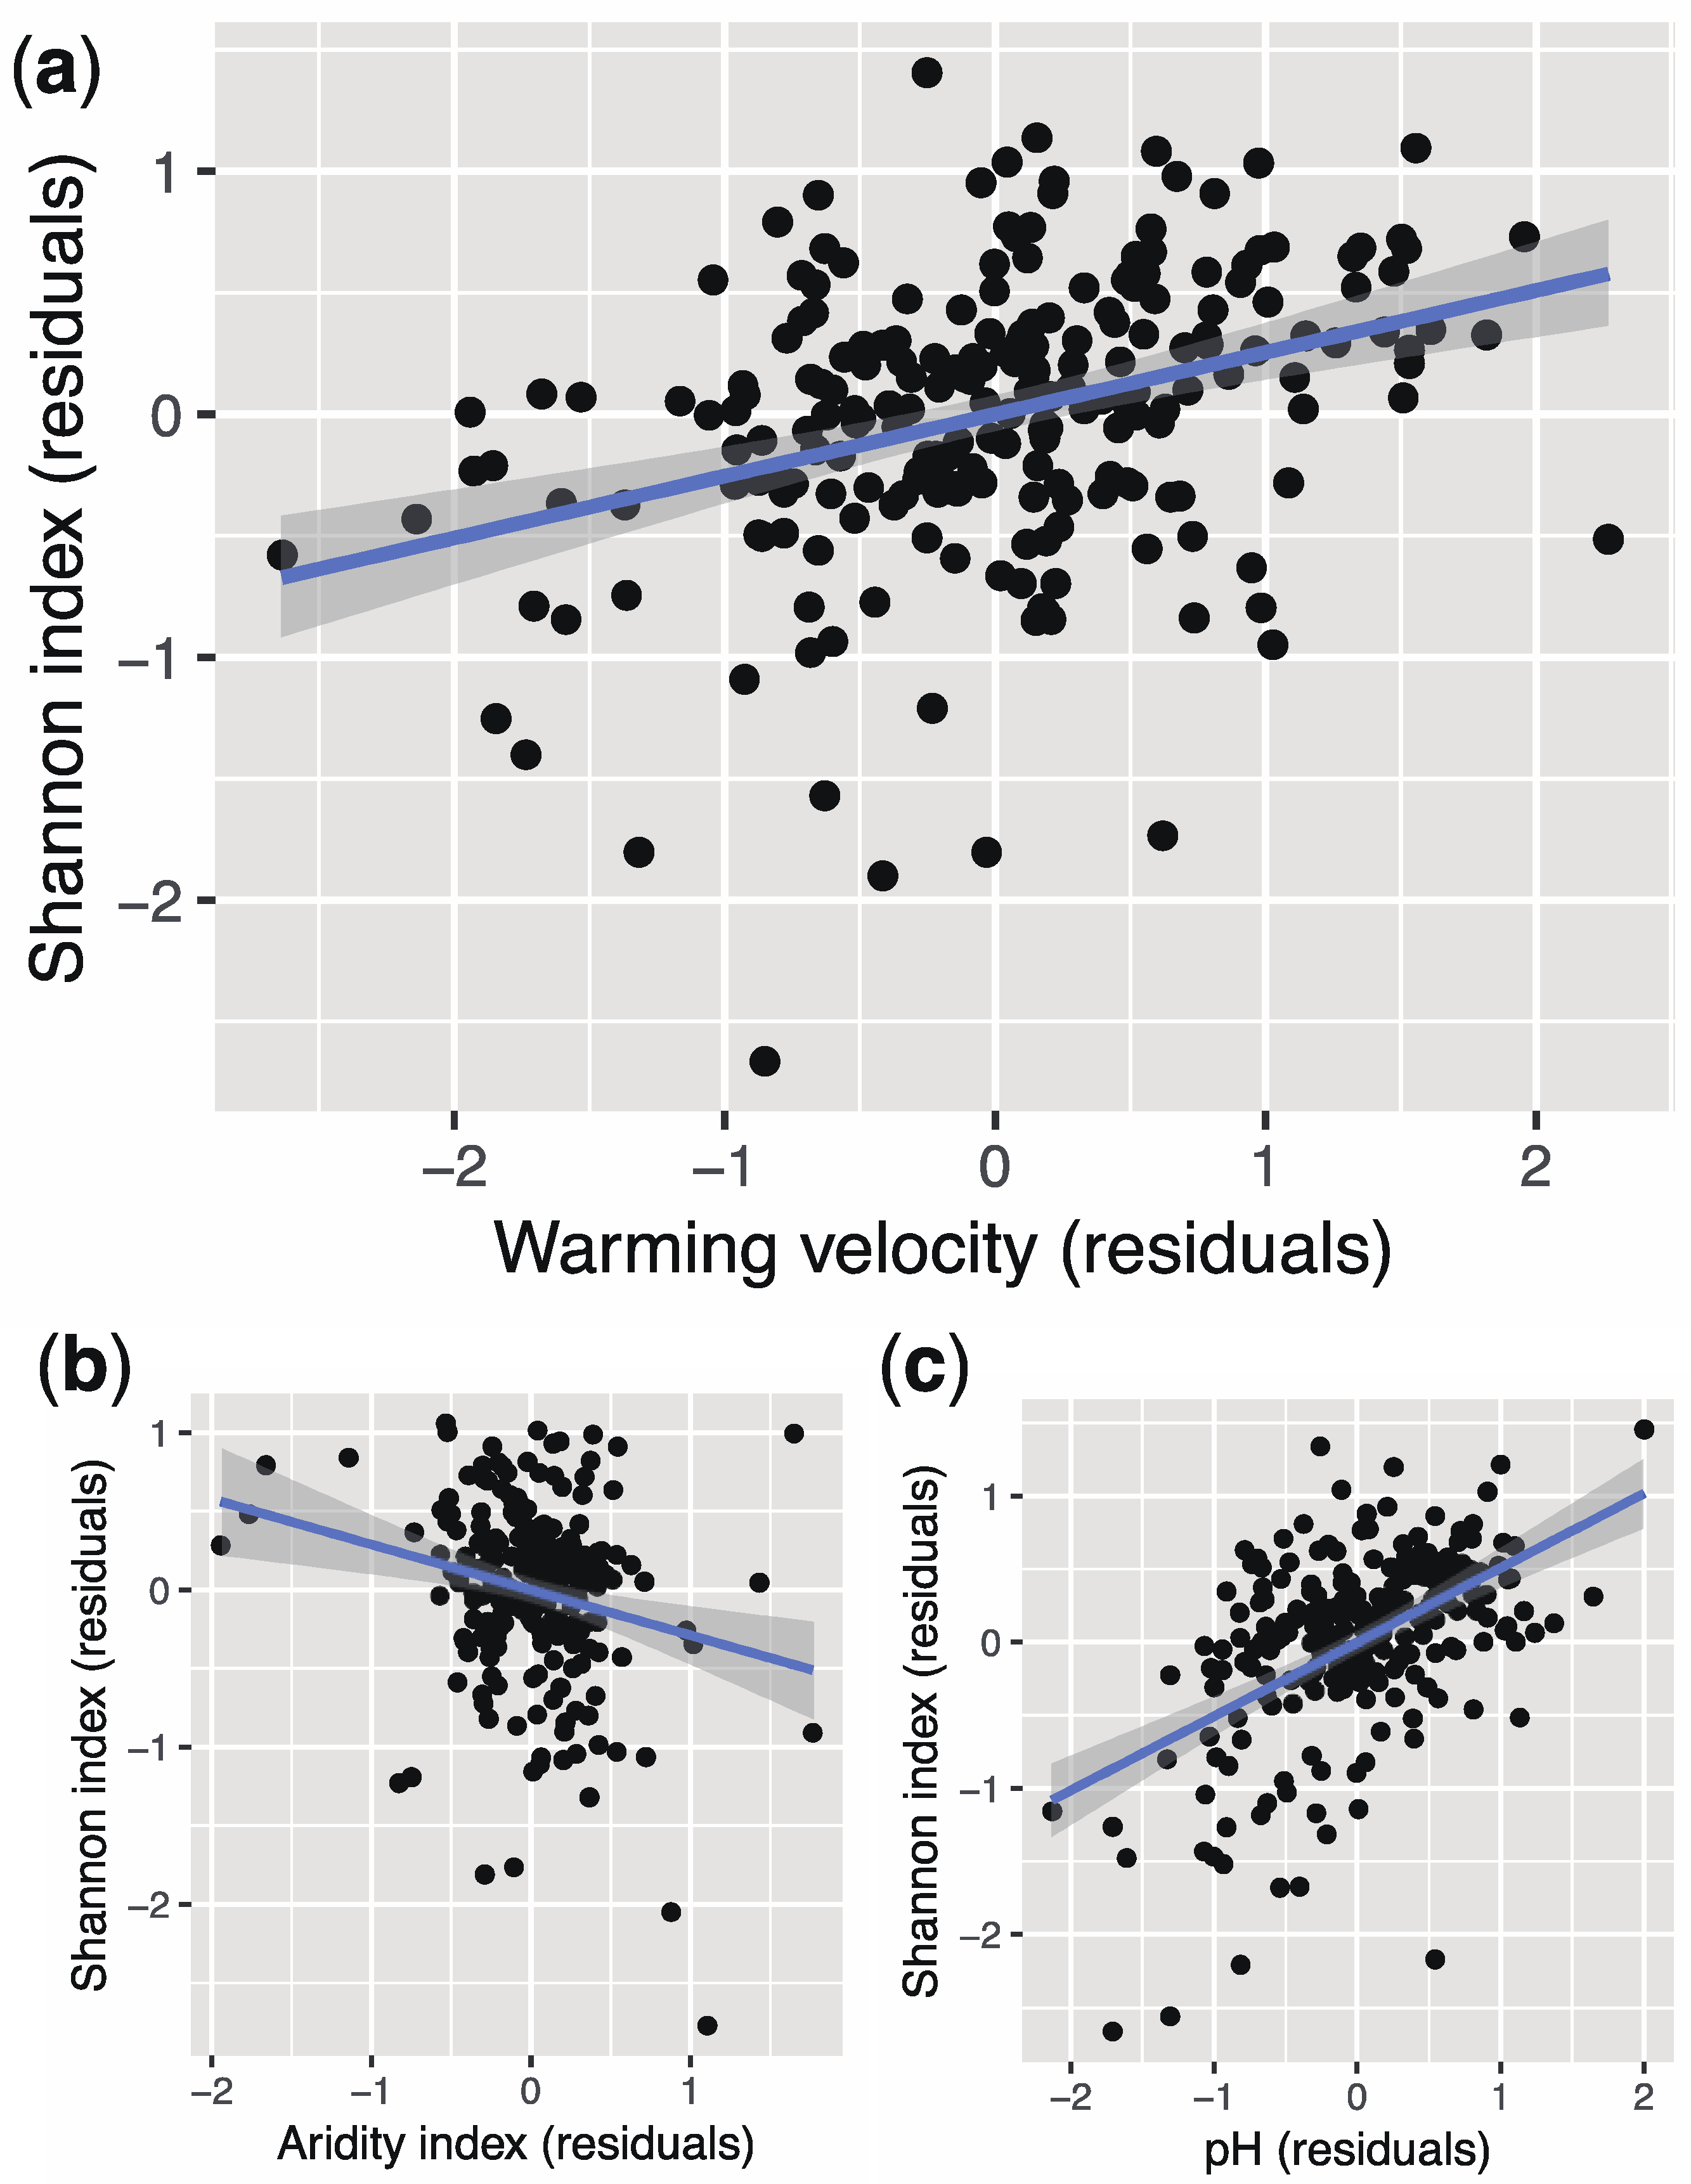
We confirmed the effects of the environmental changes (warming velocity and human impact) on bacterial diversity. To avoid redundancy, only the results of the Shannon index are presented in the main text (Table 1). The rest of the results are available in the electronic Supplementary Materials (Tables A–O in File S1). Specifically, the Shannon index increased with warming velocity (Figure 1a) and HF score (human impact). However, the effects of warming velocity and human impact on bacterial diversity were weak compared to the aridity index and pH according to the estimates (i.e., the standardized partial regression coefficients; Table 1). The Shannon index reduced with the aridity index (i.e., dryness; Figure 1b) and increased with pH (Figure 1c).
Similar tendencies were observed for the other diversity indices (Tables A–C in File S1). For these indices, we also confirmed that bacterial diversity increased with warming velocity (estimate or standardized partial regression coefficient in the SEVM averaged model = 0.203, p = 3.1e−4 for richness; 0.260, p = 9.0e−7 for the Simpson index; 0.280, p = 3.2e−5 for evenness). However, the effect of warming velocity was also weaker compared to the aridity index and pH according to the estimates. In particular, these indices reduced with the aridity index (estimate in the SEVM averaged model = −0.374 and p = 2.0e−5 for richness, −0.367 and p = 1.0e−6 for the Simpson index, −0.511 and p = 2.0e−16 for evenness), while they increased with pH (estimate in the SEVM averaged model = 0.418, p = 2.0e−16 for richness; 0.391, p = 2.0e−16 for the Simpson index; 0.412, p = 2.0e−16 for evenness). The effects of these environmental factors on bacterial diversity hardly depend on diversity indices. Nonetheless, the effect of human impact on bacterial diversity depended on diversity indices; in particular, the contribution of human impact to the Shannon diversity index was statistically significant (Table 1), but not that to these diversity indices (Tables A–C in File S1).
The contributions of the other environmental parameters on bacterial diversity were limited. Evenness reduced with UV radiation (estimate in the SEVM averaged model = −0.224 and p = 0.02) and increased with plant productivity (0.285 and p = 2.8e−3) (Table C in File S1); however, the other indices showed no correlation with these environmental parameters (Table 1 and Tables A–C in File S1). Annual mean temperature, mean diurnal temperature range, temperature seasonality, and precipitation seasonality showed no correlations with any diversity indices.
We also investigated the associations between environmental changes and bacterial diversity according to ecosystem type (forest, grassland, and shrubland). We found that the positive effects of warming velocity on bacterial diversity were particularly significant in forests and grasslands. In particular, all diversity indices increased with warming velocity in forests (estimate in the SEVM averaged model = 0.326, p = 3.8e−5 for the Shannon index; 0.358, p < 1.3e−5 for richness; 0.354, p = 2.2e−5 for the Simpson index; 0.313, p = 5.7e−5 for evenness; Tables D–G in File S1) and grasslands (estimate in the SEVM averaged model = 0.287, p = 3.3e−3 for the Shannon index; 0.284, p = 3.7e−3 for richness; 0.282, p = 8.0e−3 for the Simpson index; 0.280, p = 7.8e−3 for evenness; Tables H–K in File S1) but warming velocity had no association with any diversity indices in shrublands (Tables L–O in File S1). The effect of human impact was less robustly confirmed. Human impact only had a weak positive effect with the Shannon index (estimate in the SEVM averaged model = 0.125, p = 0.02; Table D in File S1) and richness (0.129, p = 0.02; Table E in File S1) in forests.
The effects of pH and the aridity index on bacterial diversity were also investigated. An increase in bacterial diversity with pH was observed without respect to ecosystem type or diversity index (Tables D–O in File S1). The effect of the aridity index was particularly significant in forests; in particular, it was negatively associated with all diversity indices in forests (estimate in the SEVM averaged model = −0.398, p = 3.2e−3 for the Shannon index; −0.506, p = 3.2e−4 for richness; −0.258, p = 0.03 for the Simpson index; −0.277, p = 0.02 for evenness; Tables D–G in File S1).
The effects of the other environmental parameters were ambiguous; specifically, they strongly depended on ecosystem type and diversity index. Mean diurnal temperature range showed a negative association with evenness in shrublands (estimate in the SEVM averaged model = −0.457, p = 9.6e−3; Table O in File S1) and a positive association with the Simpson index (0.357, p = 3.8e−3; Table F in File S1) and evenness (0.317, p = 1.9e−3; Table G in File S1) in forests. Precipitation seasonality was positively associated with the Shannon index (estimate in the SEVM averaged model = 0.223, p = 0.02; Table H in File S1) and richness (0.269, p = 6.7e−3; Table I in File S1) in grasslands. Temperature seasonality showed a negative association with richness in forests (estimate in the SEVM averaged model = −0.429, p = 1.0e−4; Table E in File S1). Annual mean temperature, plant productivity, and UV radiation showed no correlation with any diversity indices when considering ecosystem type (Tables D–O in File S1).
4. Discussion
Inspired by the attention given to the effects of environmental changes on soil biodiversity [2,7,8], we evaluated how environmental changes (warming velocity and human impact) influence the diversity of the dominant soil bacteria at the global scale while controlling for potential confounding effects using spatial analysis. Our analyses confirmed that environmental changes affect bacterial diversity. Specifically, we found that soil bacterial diversity increases with warming velocity and that this relationship is predominantly observed in forests and grasslands. This phenomenon was observed in multiple diversity indices; thus, we conclude that there is strong evidence for the observed relationship between warming velocity and soil bacterial diversity. However, dryness (based on the aridity index results) and pH also appear to affect soil bacterial diversity. Their effects were stronger compared to the effect of warming velocity (Table 1). The effect of warming velocity may be significant but secondary compared to the effects of dryness and pH. In addition, our findings that the aridity index and pH had negative and positive correlations with bacterial diversity, respectively, are consistent with those of a number of previous studies [1,3,16,28]. This suggests that the evidence for these effects is robust.
Our results are generally consistent with previous studies [16,17,18,19] that have concluded that warming results in increased soil bacterial diversity; however, our study provides complementary insights into these effects. Specifically, we emphasize the importance of warming velocity in this regard [9]. Previous studies [16,17] have primarily shown the effects of annual mean temperature; however, our analysis (Table 1) did not find any association between annual mean temperature and soil bacterial diversity. This discrepancy might be because of differences in the datasets and methods for data analysis used in our work and those of previous studies. Our focus on global-scale bacterial diversity and the incorporation of a control for the effects of multiple environmental factors addressed the aforementioned limitations of previous work (see Section 1). When performing simple pairwise correlation analysis, a positive correlation between soil bacterial diversity (the Shannon index) and annual mean temperature was also observed (Spearman’s rank correlation coefficient rs = 0.26, p = 5.8e−05) in our dataset, which is consistent with the results of previous studies. Therefore, our analysis calls into question the previously observed association between annual mean temperature and soil bacterial diversity and instead highlights the importance of warming velocity along with other environmental factors.
Previous studies [18,19] reporting that soil bacterial diversity increases with experimental climate warming have focused on local scales. Our results indicate that the positive effects of warming on soil bacterial diversity occur at the global scale and are obtained from real-world data. However, the effects are limited to data from historical climate change (warming velocity), while previous studies [18,19] focused on current human-driven climate change. In this study, the warming velocity was considered in order to investigate the effect of climate change because global data on current climate change were unavailable. Given that the warming velocity was based on the difference between the current and past (LGM) annual mean temperature, the timescale of the velocity may be excessively long compared to that of microbial community assemblages. Nonetheless, bacterial diversity responded to warming velocity. This may be because bacterial compositions are more sensitive to environmental changes in areas that have experienced strong climatic shifts that have occurred since the LGM. In particular, factors driving shifts in soil bacterial communities can reflect the historic climate because soil properties change slowly over time [45].
Positive associations between warming and soil bacterial diversity are often explained by the metabolic theory of ecology [46,47]. Metabolic rate (oxygen consumption and energy demand) is an important physiological parameter in (microbial) ecology [48] because it can be used to estimate, and therefore understand, energy metabolism [49], population growth rate [50], genetic mutation rate [51,52], and species diversity [53,54]. Importantly, increases in temperature accelerate the metabolic rate [55], although this effect might reach a saturation point [56,57]. Thus, the theory predicts that climate warming will increase the rates of ecological and evolutionary processes [16,19], including the rates of genetic mutation, speciation, and interactions. In fact, community-level respiration of prokaryotic microbes may rise with global warming [58]. However, our results (Table 1) indicate that soil bacterial diversity is influenced by warming velocity rather than only by environmental temperature. We believe that the theory can explain the positive association between warming velocity and soil bacterial diversity because the velocity is based on the difference between current and past annual mean temperatures. However, the theory (specifically, the equation used in [16]) may need to be modified to consider warming velocity.
Our results (Table 1) also indicate that human impact can positively affect soil bacterial diversity at the global scale, corroborating findings at local [20,21] and regional scales [22]. Human movement may facilitate the invasion of diverse (soil) bacteria from one area to another, and increases in the number of habitat patches driven by human land use may increase soil bacterial diversity. It has been shown that soil bacterial diversity is positively associated with human population [59]. However, the effect of human impact was very weak compared to the effects of the aridity index, pH, and warming velocity (Table 1) and depended on the types of diversity indices and ecosystem types investigated (Tables D–O in File S1). This may be because human impact (e.g., land use, urbanization, and tillage) may have a positive effect [20,21,22] or negative effect [23,24,25] on soil bacterial diversity. The effects of human impact are currently ambiguous. The effects of the other environmental factors (UV radiation, plant productivity, temperature seasonality, and precipitation seasonality) at the global scale may also still be uncertain because they were influenced by the types of diversity indices and ecosystem types included in the analyses.
The present analysis has several limitations. For example, our data are limited to the dominant soil bacteria, which we focused on because of their global importance [1]. However, this limitation may not pose a significant problem because similar tendencies between dominant bacterial taxa and all taxa generally have been observed [1] (e.g., a diversity index of all taxa was strongly correlated with that of the dominant taxa). Additionally, our study did not evaluate the relationships between specific phylotypes (e.g., genus and class) and environmental factors. This was because the main aim of this study was to investigate bacterial diversity; however, it was also owing to the difficulty in data analysis. The bacterial compositional data were highly dimensional (511) compared to the sample size (235), and statistical analyses may not be applicable to compositional data generally because the assumption of independent variables may not be satisfied owing to the constant sum constraint [60,61]. More importantly, spatial autocorrelation also needs to be considered. No appropriate method for high-dimensional, spatial, and compositional data was available. To avoid these limitations, we simply focused on diversity indices, a compressed expression of bacterial compositions.
In addition, our results are limited by available datasets, as are many other geographic studies on soil bacteria. Global-scale datasets are now available owing to remarkable development in high-throughput sequencing techniques; however, the current amount of available data may still be insufficient to produce a definitive picture. Significant gaps in soil biodiversity data remain across northern latitudes, including most of Russia and Canada [62], and data are lacking from much of Central Asia and Central Africa, as well as many tropical regions. More environmental parameters are also needed. Many factors determine soil bacteria diversity [23]. For example, soil microbial diversity increases with nutrient availability and organic matter [63]. Soil temperature may need to be used rather than annual mean temperature to more accurately investigate the relationship between temperature and soil bacterial diversity. However, we did not consider such detailed parameters on soil environments because of the primary limitation of databases (the amount of data was not sufficient for data analysis). To account for these limitations, a global-scale dataset on soil bacteria and environmental parameters should be constructed in the future. In this context, the Earth Microbiome Project [64] is significant, and data-sharing generally [65] will be particularly important for future studies.
5. Conclusions
The diversity of the dominant soil bacteria increased with warming velocity, and this effect was independent of a number of potentially confounding variables (particularly dryness and pH). Despite the limitations in our data analyses, our findings enhance our understanding of the effects of environmental changes (particularly global warming) on soil bacterial diversity.
Supplementary Materials
The following are available online at https://0-www-mdpi-com.brum.beds.ac.uk/1424-2818/13/3/120/s1, Dataset S1: Data on the diversity of the dominant soil bacteria and environmental parameters that were used for the analyses in this study, Code S1: R code used in our data analyses, File S1: Supporting tables (Tables A–O).
Author Contributions
Conceptualization, K.T.; methodology, K.T.; software, Y.K. and K.T.; validation, Y.K. and K.T.; formal analysis, Y.K. and K.T.; investigation, Y.K. and K.T.; resources, Y.K.; data curation, Y.K.; writing—original draft preparation, K.T.; writing—review and editing, Y.K. and K.T.; visualization, K.T.; supervision, K.T.; project administration, K.T.; funding acquisition, K.T. All authors have read and agreed to the published version of the manuscript.
Funding
This research was funded by JSPS KAKENHI, grant number JP17H04703. The APC was funded by JP17H04703.
Institutional Review Board Statement
Not applicable.
Informed Consent Statement
Not applicable.
Data Availability Statement
The datasets supporting this article have been uploaded as supplementary material.
Conflicts of Interest
The authors declare no conflict of interest. The funders had no role in the design of the study; in the collection, analyses, or interpretation of data; in the writing of the manuscript, or in the decision to publish the results.
References
- Delgado-Baquerizo, M.; Oliverio, A.M.; Brewer, T.E.; Benavent-González, A.; Eldridge, D.J.; Bardgett, R.D.; Maestre, F.T.; Singh, B.K.; Fierer, N. A global atlas of the dominant bacteria found in soil. Science 2018, 359, 320–325. [Google Scholar] [CrossRef] [Green Version]
- Cavicchioli, R.; Ripple, W.J.; Timmis, K.N.; Azam, F.; Bakken, L.R.; Baylis, M.; Behrenfeld, M.J.; Boetius, A.; Boyd, P.W.; Classen, A.T.; et al. Scientists’ warning to humanity: Microorganisms and climate change. Nat. Rev. Microbiol. 2019, 17, 569–586. [Google Scholar] [CrossRef] [Green Version]
- Bickel, S.; Chen, X.; Papritz, A.; Or, D. A hierarchy of environmental covariates control the global biogeography of soil bacterial richness. Sci. Rep. 2019, 9, 12129. [Google Scholar] [CrossRef]
- Delgado-Baquerizo, M.; Maestre, F.T.; Reich, P.B.; Jeffries, T.C.; Gaitan, J.J.; Encinar, D.; Berdugo, M.; Campbell, C.D.; Singh, B.K. Microbial diversity drives multifunctionality in terrestrial ecosystems. Nat. Commun. 2016, 7, 10541. [Google Scholar] [CrossRef] [Green Version]
- Miki, T.; Yokokawa, T.; Matsui, K. Biodiversity and multifunctionality in a microbial community: A novel theoretical approach to quantify functional redundancy. Proc. Biol. Sci. 2014, 281, 20132498. [Google Scholar] [CrossRef] [Green Version]
- Shoemaker, W.R.; Locey, K.J.; Lennon, J.T. A macroecological theory of microbial biodiversity. Nat. Ecol. Evol. 2017, 1, 0107. [Google Scholar] [CrossRef]
- Jansson, J.K.; Hofmockel, K.S. Soil microbiomes and climate change. Nat. Rev. Microbiol. 2020, 18, 35–46. [Google Scholar] [CrossRef] [PubMed]
- Geisen, S.; Wall, D.H.; van der Putten, W.H. Challenges and opportunities for soil biodiversity in the Anthropocene. Curr. Biol. 2019, 29, R1036–R1044. [Google Scholar] [CrossRef]
- Sandel, B.; Arge, L.; Dalsgaard, B.; Davies, R.G.; Gaston, K.J.; Sutherland, W.J.; Svenning, J.-C. The influence of late Quaternary climate-change velocity on species endemism. Science 2011, 334, 660–664. [Google Scholar] [CrossRef] [Green Version]
- Bascompte, J. Structure and dynamics of ecological networks. Science 2010, 329, 765–766. [Google Scholar] [CrossRef] [Green Version]
- Thompson, R.M.; Brose, U.; Dunne, J.A.; Hall, R.O.; Hladyz, S.; Kitching, R.L.; Martinez, N.D.; Rantala, H.; Romanuk, T.N.; Stouffer, D.B.; et al. Food webs: Reconciling the structure and function of biodiversity. Trends Ecol. Evol. 2012, 27, 689–697. [Google Scholar] [CrossRef] [PubMed] [Green Version]
- Johnson, C.N.; Balmford, A.; Brook, B.W.; Buettel, J.C.; Galetti, M.; Guangchun, L.; Wilmshurst, J.M. Biodiversity losses and conservation responses in the Anthropocene. Science 2017, 356, 270–275. [Google Scholar] [CrossRef] [PubMed]
- Takemoto, K.; Kajihara, K. Human impacts and climate change influence nestedness and modularity in food-web and mutualistic networks. PLoS ONE 2016, 11, e0157929. [Google Scholar] [CrossRef] [PubMed]
- Nagaishi, E.; Takemoto, K. Network resilience of mutualistic ecosystems and environmental changes: An empirical study. R. Soc. Open Sci. 2018, 5, 180706. [Google Scholar] [CrossRef] [PubMed] [Green Version]
- Quince, C.; Walker, A.W.; Simpson, J.T.; Loman, N.J.; Segata, N. Shotgun metagenomics, from sampling to analysis. Nat. Biotechnol. 2017, 35, 833–844. [Google Scholar] [CrossRef] [Green Version]
- Zhou, J.; Deng, Y.; Shen, L.; Wen, C.; Yan, Q.; Ning, D.; Qin, Y.; Xue, K.; Wu, L.; He, Z.; et al. Temperature mediates continental-scale diversity of microbes in forest soils. Nat. Commun. 2016, 7, 12083. [Google Scholar] [CrossRef] [PubMed] [Green Version]
- Dennis, P.G.; Newsham, K.K.; Rushton, S.P.; O’Donnell, A.G.; Hopkins, D.W. Soil bacterial diversity is positively associated with air temperature in the maritime Antarctic. Sci. Rep. 2019, 9, 2686. [Google Scholar] [CrossRef] [Green Version]
- Sheik, C.S.; Beasley, W.H.; Elshahed, M.S.; Zhou, X.; Luo, Y.; Krumholz, L.R. Effect of warming and drought on grassland microbial communities. ISME J. 2011, 5, 1692–1700. [Google Scholar] [CrossRef] [Green Version]
- Guo, X.; Zhou, X.; Hale, L.; Yuan, M.; Ning, D.; Feng, J.; Shi, Z.; Li, Z.; Feng, B.; Gao, Q.; et al. Climate warming accelerates temporal scaling of grassland soil microbial biodiversity. Nat. Ecol. Evol. 2019, 3, 612–619. [Google Scholar] [CrossRef] [Green Version]
- Sui, X.; Zhang, R.; Frey, B.; Yang, L.; Li, M.-H.; Ni, H. Land use change effects on diversity of soil bacterial, Acidobacterial and fungal communities in wetlands of the Sanjiang Plain, northeastern China. Sci. Rep. 2019, 9, 18535. [Google Scholar] [CrossRef] [PubMed]
- Ding, G.-C.; Piceno, Y.M.; Heuer, H.; Weinert, N.; Dohrmann, A.B.; Carrillo, A.; Andersen, G.L.; Castellanos, T.; Tebbe, C.C.; Smalla, K. Changes of soil bacterial diversity as a consequence of agricultural land use in a semi-arid ecosystem. PLoS ONE 2013, 8, e59497. [Google Scholar] [CrossRef] [Green Version]
- Szoboszlay, M.; Dohrmann, A.B.; Poeplau, C.; Don, A.; Tebbe, C.C. Impact of land-use change and soil organic carbon quality on microbial diversity in soils across Europe. FEMS Microbiol. Ecol. 2017, 93, fix146. [Google Scholar] [CrossRef] [PubMed]
- Delgado-Baquerizo, M.; Reich, P.B.; Khachane, A.N.; Campbell, C.D.; Thomas, N.; Freitag, T.E.; Abu Al-Soud, W.; Sørensen, S.; Bardgett, R.D.; Singh, B.K. It is elemental: Soil nutrient stoichiometry drives bacterial diversity. Environ. Microbiol. 2017, 19, 1176–1188. [Google Scholar] [CrossRef] [PubMed]
- Parajuli, A.; Grönroos, M.; Siter, N.; Puhakka, R.; Vari, H.K.; Roslund, M.I.; Jumpponen, A.; Nurminen, N.; Laitinen, O.H.; Hyöty, H.; et al. Urbanization reduces transfer of diverse environmental microbiota indoors. Front. Microbiol. 2018, 9. [Google Scholar] [CrossRef] [PubMed] [Green Version]
- Lupwayi, N.; Arshad, M.; Rice, W.; Clayton, G. Bacterial diversity in water-stable aggregates of soils under conventional and zero tillage management. Appl. Soil Ecol. 2001, 16, 251–261. [Google Scholar] [CrossRef]
- Dormann, C.F.; McPherson, J.M.; Araújo, M.B.; Bivand, R.; Bolliger, J.; Carl, G.; Davies, R.G.; Hirzel, A.; Jetz, W.; Daniel Kissling, W.; et al. Methods to account for spatial autocorrelation in the analysis of species distributional data: A review. Ecography 2007, 30, 609–628. [Google Scholar] [CrossRef] [Green Version]
- Hijmans, R.J.; Cameron, S.E.; Parra, J.L.; Jones, P.G.; Jarvis, A. Very high resolution interpolated climate surfaces for global land areas. Int. J. Climatol. 2005, 25, 1965–1978. [Google Scholar] [CrossRef]
- Zhalnina, K.; Dias, R.; de Quadros, P.D.; Davis-Richardson, A.; Camargo, F.A.O.; Clark, I.M.; McGrath, S.P.; Hirsch, P.R.; Triplett, E.W. Soil pH determines microbial diversity and composition in the park grass experiment. Microb. Ecol. 2015, 69, 395–406. [Google Scholar] [CrossRef]
- Pajares, S.; Campo, J.; Bohannan, B.J.M.; Etchevers, J.D. Environmental controls on soil microbial communities in a seasonally dry tropical forest. Appl. Environ. Microbiol. 2018, 84, 84. [Google Scholar] [CrossRef] [PubMed] [Green Version]
- Chen, C.; Chen, H.Y.H.; Chen, X.; Huang, Z. Meta-analysis shows positive effects of plant diversity on microbial biomass and respiration. Nat. Commun. 2019, 10, 1332. [Google Scholar] [CrossRef] [Green Version]
- Schnitzer, S.A.; Klironomos, J.N.; Hillerislambers, J.; Kinkel, L.L.; Reich, P.B.; Xiao, K.; Rillig, M.C.; Sikes, B.A.; Callaway, R.M.; Mangan, S.A.; et al. Soil microbes drive the classic plant diversity-productivity pattern. Ecology 2011, 92, 296–303. [Google Scholar] [CrossRef] [PubMed]
- Kadivar, H.; Stapleton, A.E. Ultraviolet radiation alters maize phyllosphere bacterial diversity. Microb. Ecol. 2003, 45, 353–361. [Google Scholar] [CrossRef]
- Wentz, F.J.; Ricciardulli, L.; Hilburn, K.; Mears, C. How much more rain will global warming bring? Science 2007, 317, 233–235. [Google Scholar] [CrossRef]
- Williamson, C.E.; Zepp, R.G.; Lucas, R.M.; Madronich, S.; Austin, A.T.; Ballaré, C.L.; Norval, M.; Sulzberger, B.; Bais, A.F.; McKenzie, R.L.; et al. Solar ultraviolet radiation in a changing climate. Nat. Clim. Chang. 2014, 4, 434–441. [Google Scholar] [CrossRef]
- Wu, Z.; Dijkstra, P.; Koch, G.W.; Hungate, B.A. Biogeochemical and ecological feedbacks in grassland responses to warming. Nat. Clim. Chang. 2012, 2, 458–461. [Google Scholar] [CrossRef]
- Slessarev, E.W.; Lin, Y.; Bingham, N.L.; Johnson, J.E.; Dai, Y.; Schimel, J.P.; Chadwick, O.A. Water balance creates a threshold in soil pH at the global scale. Nature 2016, 540, 567–569. [Google Scholar] [CrossRef] [PubMed]
- Oksanen, J. Vegan: Ecological diversity. R Proj. 2019, 256, 1–12. [Google Scholar]
- Pettorelli, N.; Vik, J.O.; Mysterud, A.; Gaillard, J.M.; Tucker, C.J.; Stenseth, N.C. Using the satellite-derived NDVI to assess ecological responses to environmental change. Trends Ecol. Evol. 2005, 20, 503–510. [Google Scholar] [CrossRef]
- Sanderson, E.W.; Jaiteh, M.; Levy, M.A.; Redford, K.H.; Wannebo, A.V.; Woolmer, G. The human footprint and the last of the wild. Bioscience 2002, 52, 891–904. [Google Scholar] [CrossRef]
- Sebastián-González, E.; Dalsgaard, B.; Sandel, B.; Guimarães, P.R. Macroecological trends in nestedness and modularity of seed-dispersal networks: Human impact matters. Glob. Ecol. Biogeogr. 2015, 24, 293–303. [Google Scholar] [CrossRef]
- Loarie, S.R.; Duffy, P.B.; Hamilton, H.; Asner, G.P.; Field, C.B.; Ackerly, D.D. The velocity of climate change. Nature 2009, 462, 1052–1055. [Google Scholar] [CrossRef]
- Bivand, R.S.; Pebesma, E.; Gomez-Rubio, V. Applied Spatial Data Analysis with R, 2nd ed.; Springer: New York, NY, USA, 2013. [Google Scholar]
- Dalsgaard, B.; Trøjelsgaard, K.; Martín González, A.M.; Nogués-Bravo, D.; Ollerton, J.; Petanidou, T.; Sandel, B.; Schleuning, M.; Wang, Z.; Rahbek, C.; et al. Historical climate-change influences modularity and nestedness of pollination networks. Ecography 2013, 36, 1331–1340. [Google Scholar] [CrossRef] [Green Version]
- Diniz-filho, J.A.F.; Rangel, T.F.L.V.B.; Bini, L.M. Model selection and information theory in geographical ecology. Glob. Ecol. Biogeogr. 2008, 17, 479–488. [Google Scholar] [CrossRef]
- Ladau, J.; Shi, Y.; Jing, X.; He, J.-S.; Chen, L.; Lin, X.; Fierer, N.; Gilbert, J.A.; Pollard, K.S.; Chu, H. Existing climate change will lead to pronounced shifts in the diversity of soil prokaryotes. mSystems 2018, 3, e00167-18. [Google Scholar] [CrossRef] [PubMed] [Green Version]
- West, G.B.; Woodruff, W.H.; Brown, J.H. Allometric scaling of metabolic rate from molecules and mitochondria to cells and mammals. Proc. Natl. Acad. Sci. USA 2002, 99, 2473–2478. [Google Scholar] [CrossRef] [PubMed] [Green Version]
- Brown, J.H.; Gillooly, J.F.; Allen, A.P.; Savage, V.M.; West, G.B. Toward a metabolic theory of ecology. Ecology 2004, 85, 1771–1789. [Google Scholar] [CrossRef]
- Price, C.A.; Weitz, J.S.; Savage, V.M.; Stegen, J.; Clarke, A.; Coomes, D.A.; Dodds, P.S.; Etienne, R.S.; Kerkhoff, A.J.; McCulloh, K.; et al. Testing the metabolic theory of ecology. Ecol. Lett. 2012, 15, 1465–1474. [Google Scholar] [CrossRef] [PubMed]
- Speakman, J.R. Body size, energy metabolism and lifespan. J. Exp. Biol. 2005, 208, 1717–1730. [Google Scholar] [CrossRef] [Green Version]
- Kempes, C.P.; Dutkiewicz, S.; Follows, M.J. Growth, metabolic partitioning, and the size of microorganisms. Proc. Natl. Acad. Sci. USA 2011, 2011. [Google Scholar] [CrossRef] [PubMed] [Green Version]
- Gillooly, J.F.; McCoy, M.W.; Allen, A.P. Effects of metabolic rate on protein evolution. Biol. Lett. 2007, 3, 655–659. [Google Scholar] [CrossRef] [Green Version]
- Gillooly, J.F.; Allen, A.P.; West, G.B.; Brown, J.H. The rate of DNA evolution: Effects of body size and temperature on the molecular clock. Proc. Natl. Acad. Sci. USA 2005, 102, 140–145. [Google Scholar] [CrossRef] [PubMed] [Green Version]
- Brown, J.H. Why are there so many species in the tropics? J. Biogeogr. 2014, 41, 8–22. [Google Scholar] [CrossRef] [Green Version]
- Allen, A.P.; Brown, J.H.; Gillooly, J.F. Global biodiversity, biochemical kinetics, and the energetic-equivalence rule. Science 2002, 297, 1545–1548. [Google Scholar] [CrossRef] [PubMed]
- Gillooly, J.F.; Brown, J.H.; West, G.B.; Savage, V.M.; Charnov, E.L. Effects of size and temperature on metabolic rate. Science 2001, 293, 2248–2251. [Google Scholar] [CrossRef] [PubMed] [Green Version]
- Issartel, J.; Hervant, F.; Voituron, Y.; Renault, D.; Vernon, P. Behavioural, ventilatory and respiratory responses of epigean and hypogean crustaceans to different temperatures. Comp. Biochem. Physiol. Part A Mol. Integr. Physiol. 2005, 141, 1–7. [Google Scholar] [CrossRef]
- Knies, J.L.; Kingsolver, J.G. Erroneous Arrhenius: Modified Arrhenius Model Best Explains the Temperature Dependence of Ectotherm Fitness. Am. Nat. 2010, 176, 227–233. [Google Scholar] [CrossRef] [Green Version]
- Smith, T.P.; Thomas, T.J.H.; García-Carreras, B.; Sal, S.; Yvon-Durocher, G.; Bell, T.; Pawar, S. Community-level respiration of prokaryotic microbes may rise with global warming. Nat. Commun. 2019, 10, 5124. [Google Scholar] [CrossRef] [Green Version]
- Wang, H.; Cheng, M.; Dsouza, M.; Weisenhorn, P.; Zheng, T.; Gilbert, J.A. Soil bacterial diversity is associated with human population density in urban greenspaces. Environ. Sci. Technol. 2018, 52, 5115–5124. [Google Scholar] [CrossRef] [PubMed] [Green Version]
- Aitchison, J. A new approach to null correlations of proportions. J. Int. Assoc. Math. Geol. 1981, 13, 175–189. [Google Scholar] [CrossRef]
- Hirano, H.; Takemoto, K. Difficulty in inferring microbial community structure based on co-occurrence network approaches. BMC Bioinforma. 2019, 20, 329. [Google Scholar] [CrossRef]
- Cameron, E.K.; Martins, I.S.; Lavelle, P.; Mathieu, J.; Tedersoo, L.; Gottschall, F.; Guerra, C.A.; Hines, J.; Patoine, G.; Siebert, J.; et al. Global gaps in soil biodiversity data. Nat. Ecol. Evol. 2018, 2, 1042–1043. [Google Scholar] [CrossRef] [PubMed]
- Maron, P.-A.; Sarr, A.; Kaisermann, A.; Lévêque, J.; Mathieu, O.; Guigue, J.; Karimi, B.; Bernard, L.; Dequiedt, S.; Terrat, S.; et al. High microbial diversity promotes soil ecosystem functioning. Appl. Environ. Microbiol. 2018, 84, 84. [Google Scholar] [CrossRef] [Green Version]
- Gilbert, J.A.; Jansson, J.K.; Knight, R. The Earth Microbiome project: Successes and aspirations. BMC Biol. 2014, 12, 69. [Google Scholar] [CrossRef] [PubMed] [Green Version]
- Parr, C.; Cummings, M. Data sharing in ecology and evolution. Trends Ecol. Evol. 2005, 20, 362–363. [Google Scholar] [CrossRef] [PubMed]
Figure 1.
Scatter plots of the diversity (Shannon index) of soil dominant bacteria (residuals) versus environmental parameters (residuals). (a) Shannon index versus warming velocity. (b) Shannon index versus aridity index. (c) Shannon index versus pH. The shaded gray area indicates the 95% confidence intervals around the regression lines.


Table 1.
Influence of explanatory variables on the diversity (Shannon index) of soil dominant bacteria at the global scale.
Table 1.
Influence of explanatory variables on the diversity (Shannon index) of soil dominant bacteria at the global scale.
| Variable | OLS | SEVM | ||||
|---|---|---|---|---|---|---|
| Estimate (Full) | Estimate (Best) | Estimate (Average) | Estimate (Full) | Estimate (Best) | Estimate (Average) | |
| AMT | −0.028 (0.77) | 0.046 (0.47) | −0.136 (0.15) | −0.094 (0.09) | −0.120 (0.13) | |
| Aridity index | −0.406 (1.1e−5) | −0.353 (4.5e−9) | −0.375 (1.0e−7) | −0.431 (2.1e−6) | −0.439 (4.0e−7) | −0.398 (3.6e−5) |
| HF | 0.051 (0.30) | 0.050 (0.29) | 0.103 (0.03) | 0.101 (0.03) | 0.098 (0.04) | |
| MDR | 0.060 (0.42) | 0.021 (0.72) | 0.117 (0.11) | 0.094 (0.08) | 0.109 (0.07) | |
| NPP | 0.058 (0.54) | 0.057 (0.48) | 0.147 (0.12) | 0.154 (0.05) | 0.148 (0.09) | |
| pH | 0.430 (1.2e−10) | 0.429 (2.2e−12) | 0.429 (2.0e−16) | 0.481 (1.3e−12) | 0.467 (6.7e−13) | 0.466 (2.0e−16) |
| PSEA | 0.035 (0.60) | 0.005 (0.92) | 0.052 (0.45) | 0.035 (0.59) | ||
| TS | −0.071 (0.43) | −0.010 (0.88) | −0.083 (0.36) | −0.051 (0.59) | ||
| UV | −0.089 (0.40) | −0.049 (0.42) | 0.002 (0.98) | 0.034 (0.74) | ||
| WV | 0.292 (2.6e−6) | 0.303 (3.0e−11) | 0.295 (2.0e−16) | 0.273 (8.6e−6) | 0.233 (1.6e−6) | 0.261 (1.7e−6) |
| Moran’s I | 0.148 (1.3e−3) | 0.162 (2.3e−3) | −0.088 (0.51) | −0.073 (0.49) | ||
| R2 | 0.571 (< 2.2e−16) | 0.564 (< 2.2e−16) | 0.661 (< 2.2e−16) | 0.658 (< 2.2e−16) | ||
AMT, annual mean temperature; MDR, mean diurnal temperature range; TS, temperature seasonality; PSEA, precipitation seasonality; NPP, normalized difference vegetation index; UV, UV radiation index; HF, human footprint score; and WV, warming velocity. The estimates in the full, best, and averaged models based on the ordinary least squared (OLS) regression and spatial eigenvector mapping (SEVM) modeling approach correspond to the standardized partial regression coefficients in the models. R2 corresponds to the coefficient of determination. Values in brackets are the associated p-values. Bold values denote statistical significance.
Publisher’s Note: MDPI stays neutral with regard to jurisdictional claims in published maps and institutional affiliations. |
© 2021 by the authors. Licensee MDPI, Basel, Switzerland. This article is an open access article distributed under the terms and conditions of the Creative Commons Attribution (CC BY) license (http://creativecommons.org/licenses/by/4.0/).
Share and Cite
MDPI and ACS Style
Kanzaki, Y.; Takemoto, K. Diversity of Dominant Soil Bacteria Increases with Warming Velocity at the Global Scale. Diversity 2021, 13, 120. https://0-doi-org.brum.beds.ac.uk/10.3390/d13030120
AMA Style
Kanzaki Y, Takemoto K. Diversity of Dominant Soil Bacteria Increases with Warming Velocity at the Global Scale. Diversity. 2021; 13(3):120. https://0-doi-org.brum.beds.ac.uk/10.3390/d13030120
Chicago/Turabian StyleKanzaki, Yoshiaki, and Kazuhiro Takemoto. 2021. "Diversity of Dominant Soil Bacteria Increases with Warming Velocity at the Global Scale" Diversity 13, no. 3: 120. https://0-doi-org.brum.beds.ac.uk/10.3390/d13030120
Note that from the first issue of 2016, this journal uses article numbers instead of page numbers. See further details here.