
Effect of Different Salinity Levels on Population Dynamics and Growth of the Cyclopoid Copepod Oithona nana


 ,
,  and
and 
Abstract
:1. Introduction
2. Materials and Methods
2.1. Isolation and Stock Culture of Copepods
2.2. Experimental Design
2.3. Tested Parameters
2.3.1. Population dynamics
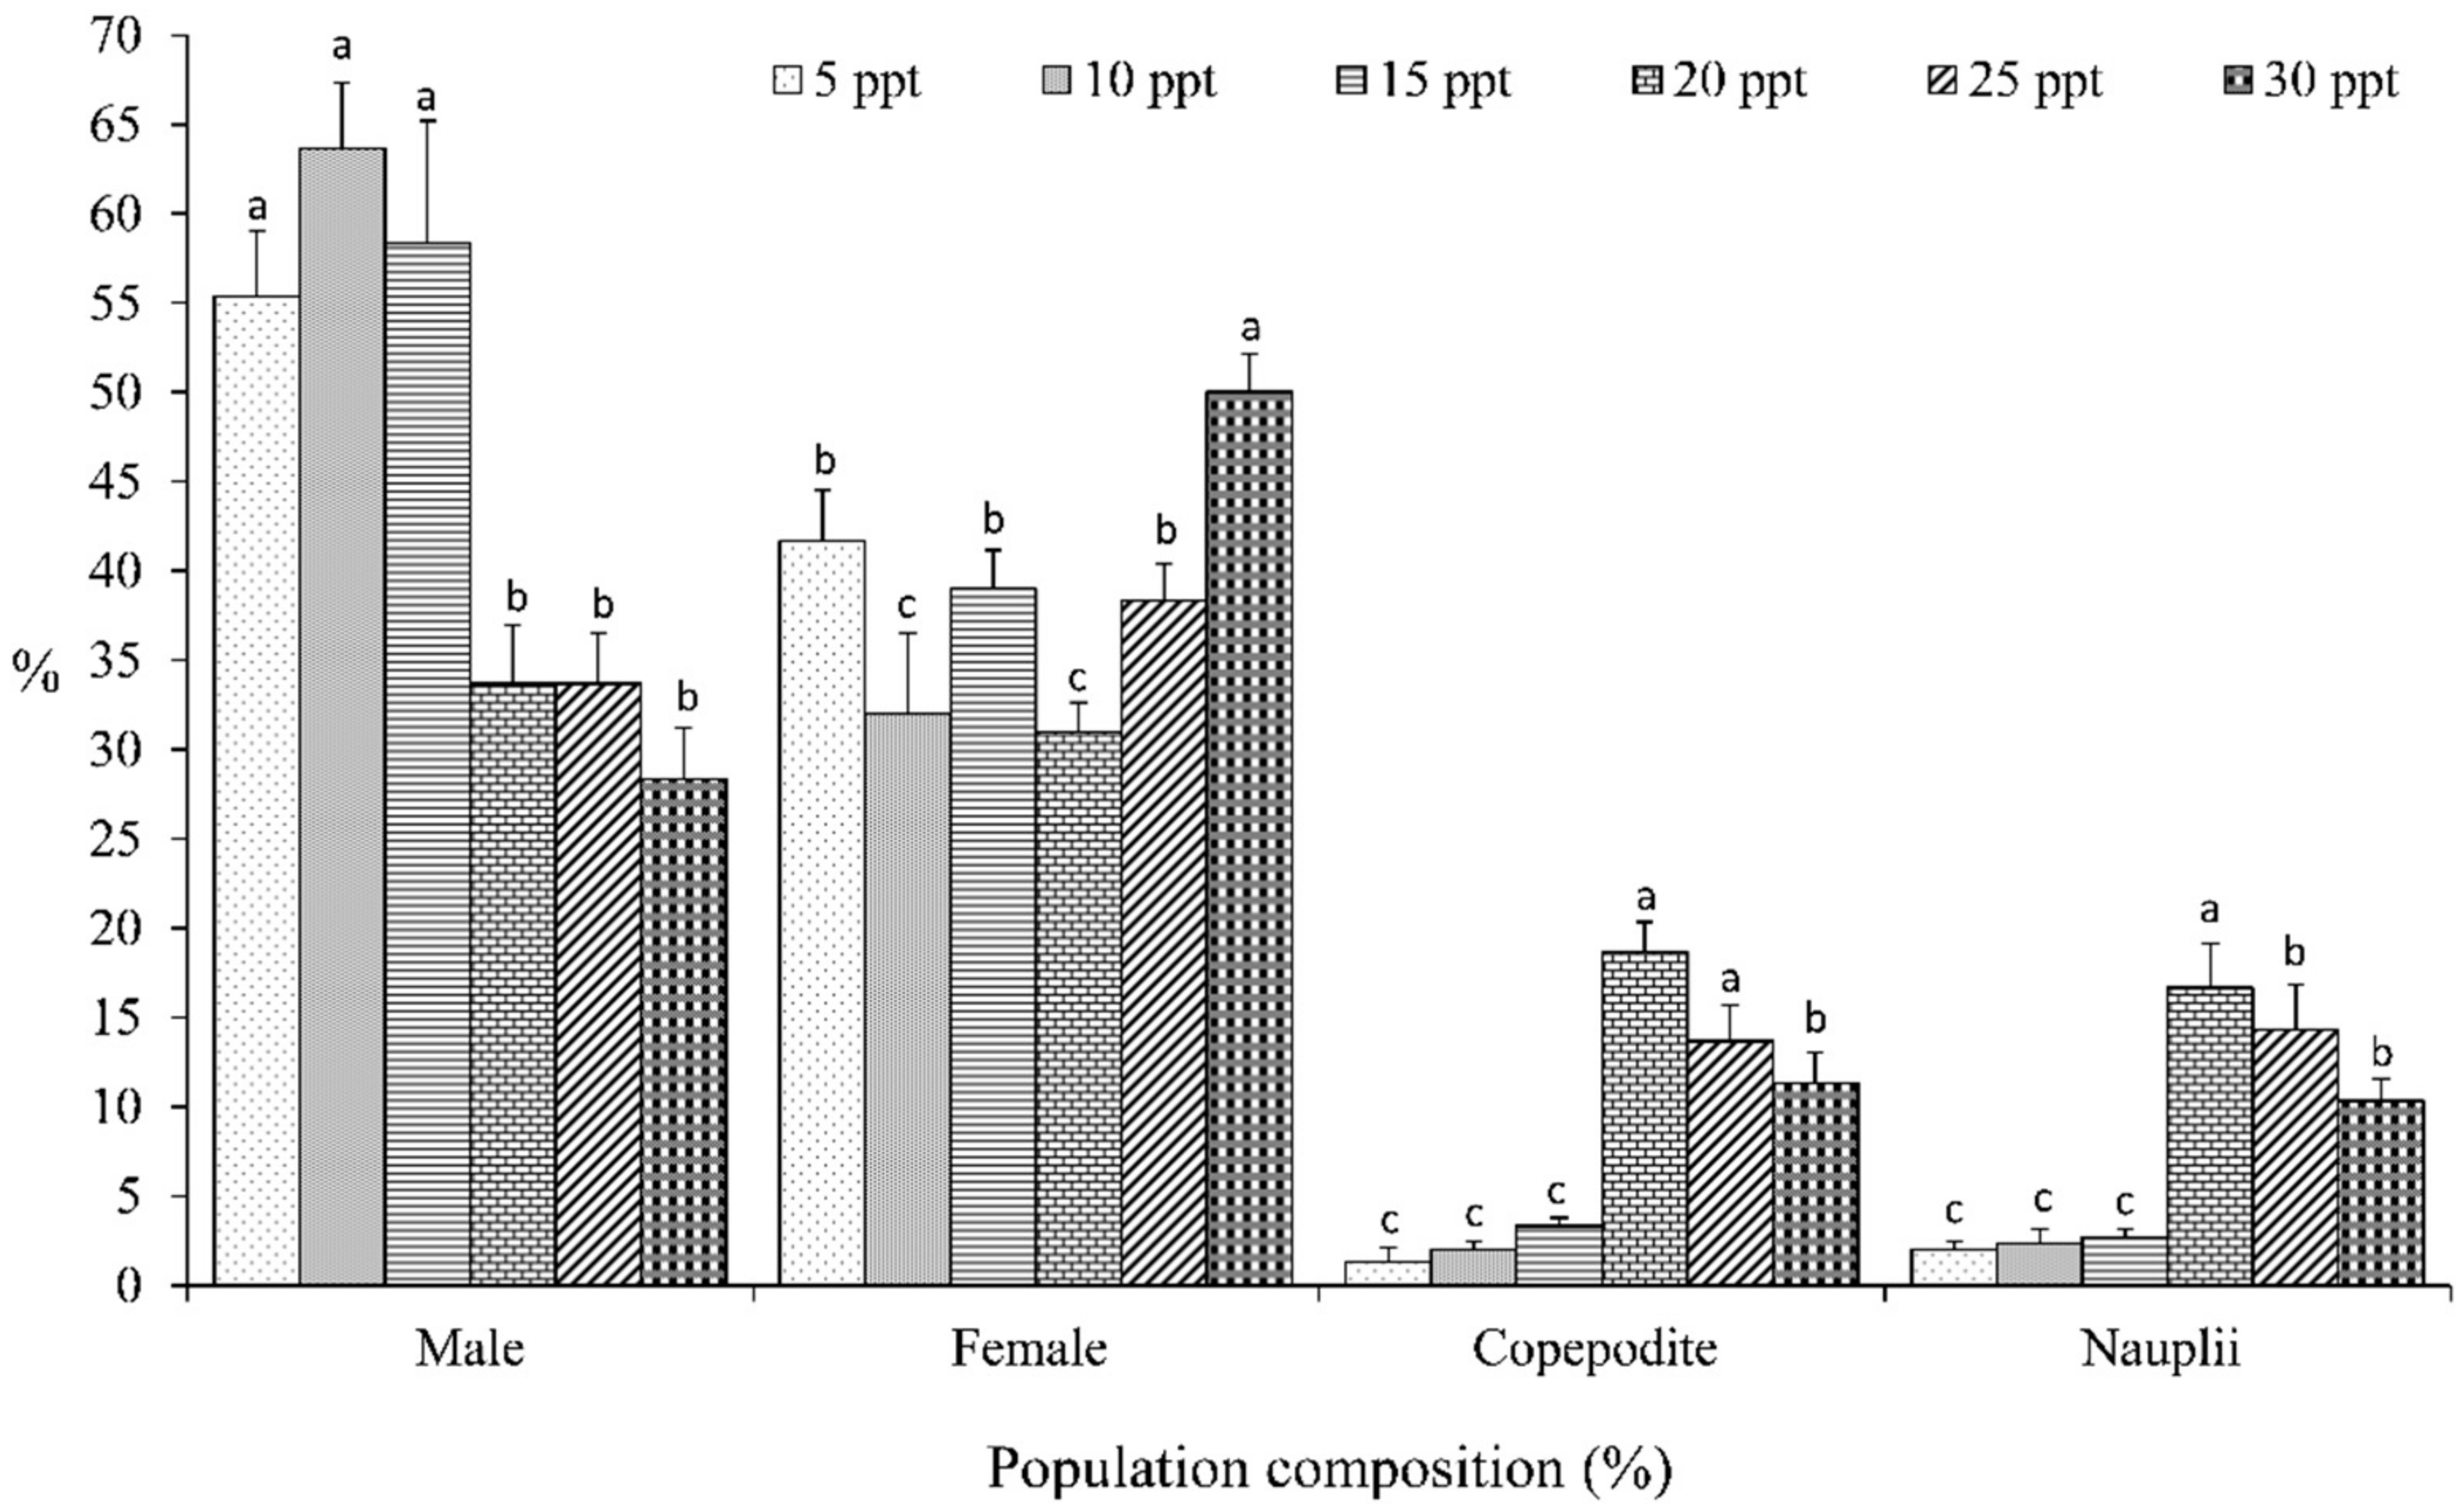
2.3.2. Population Composition
2.4. Data Analysis
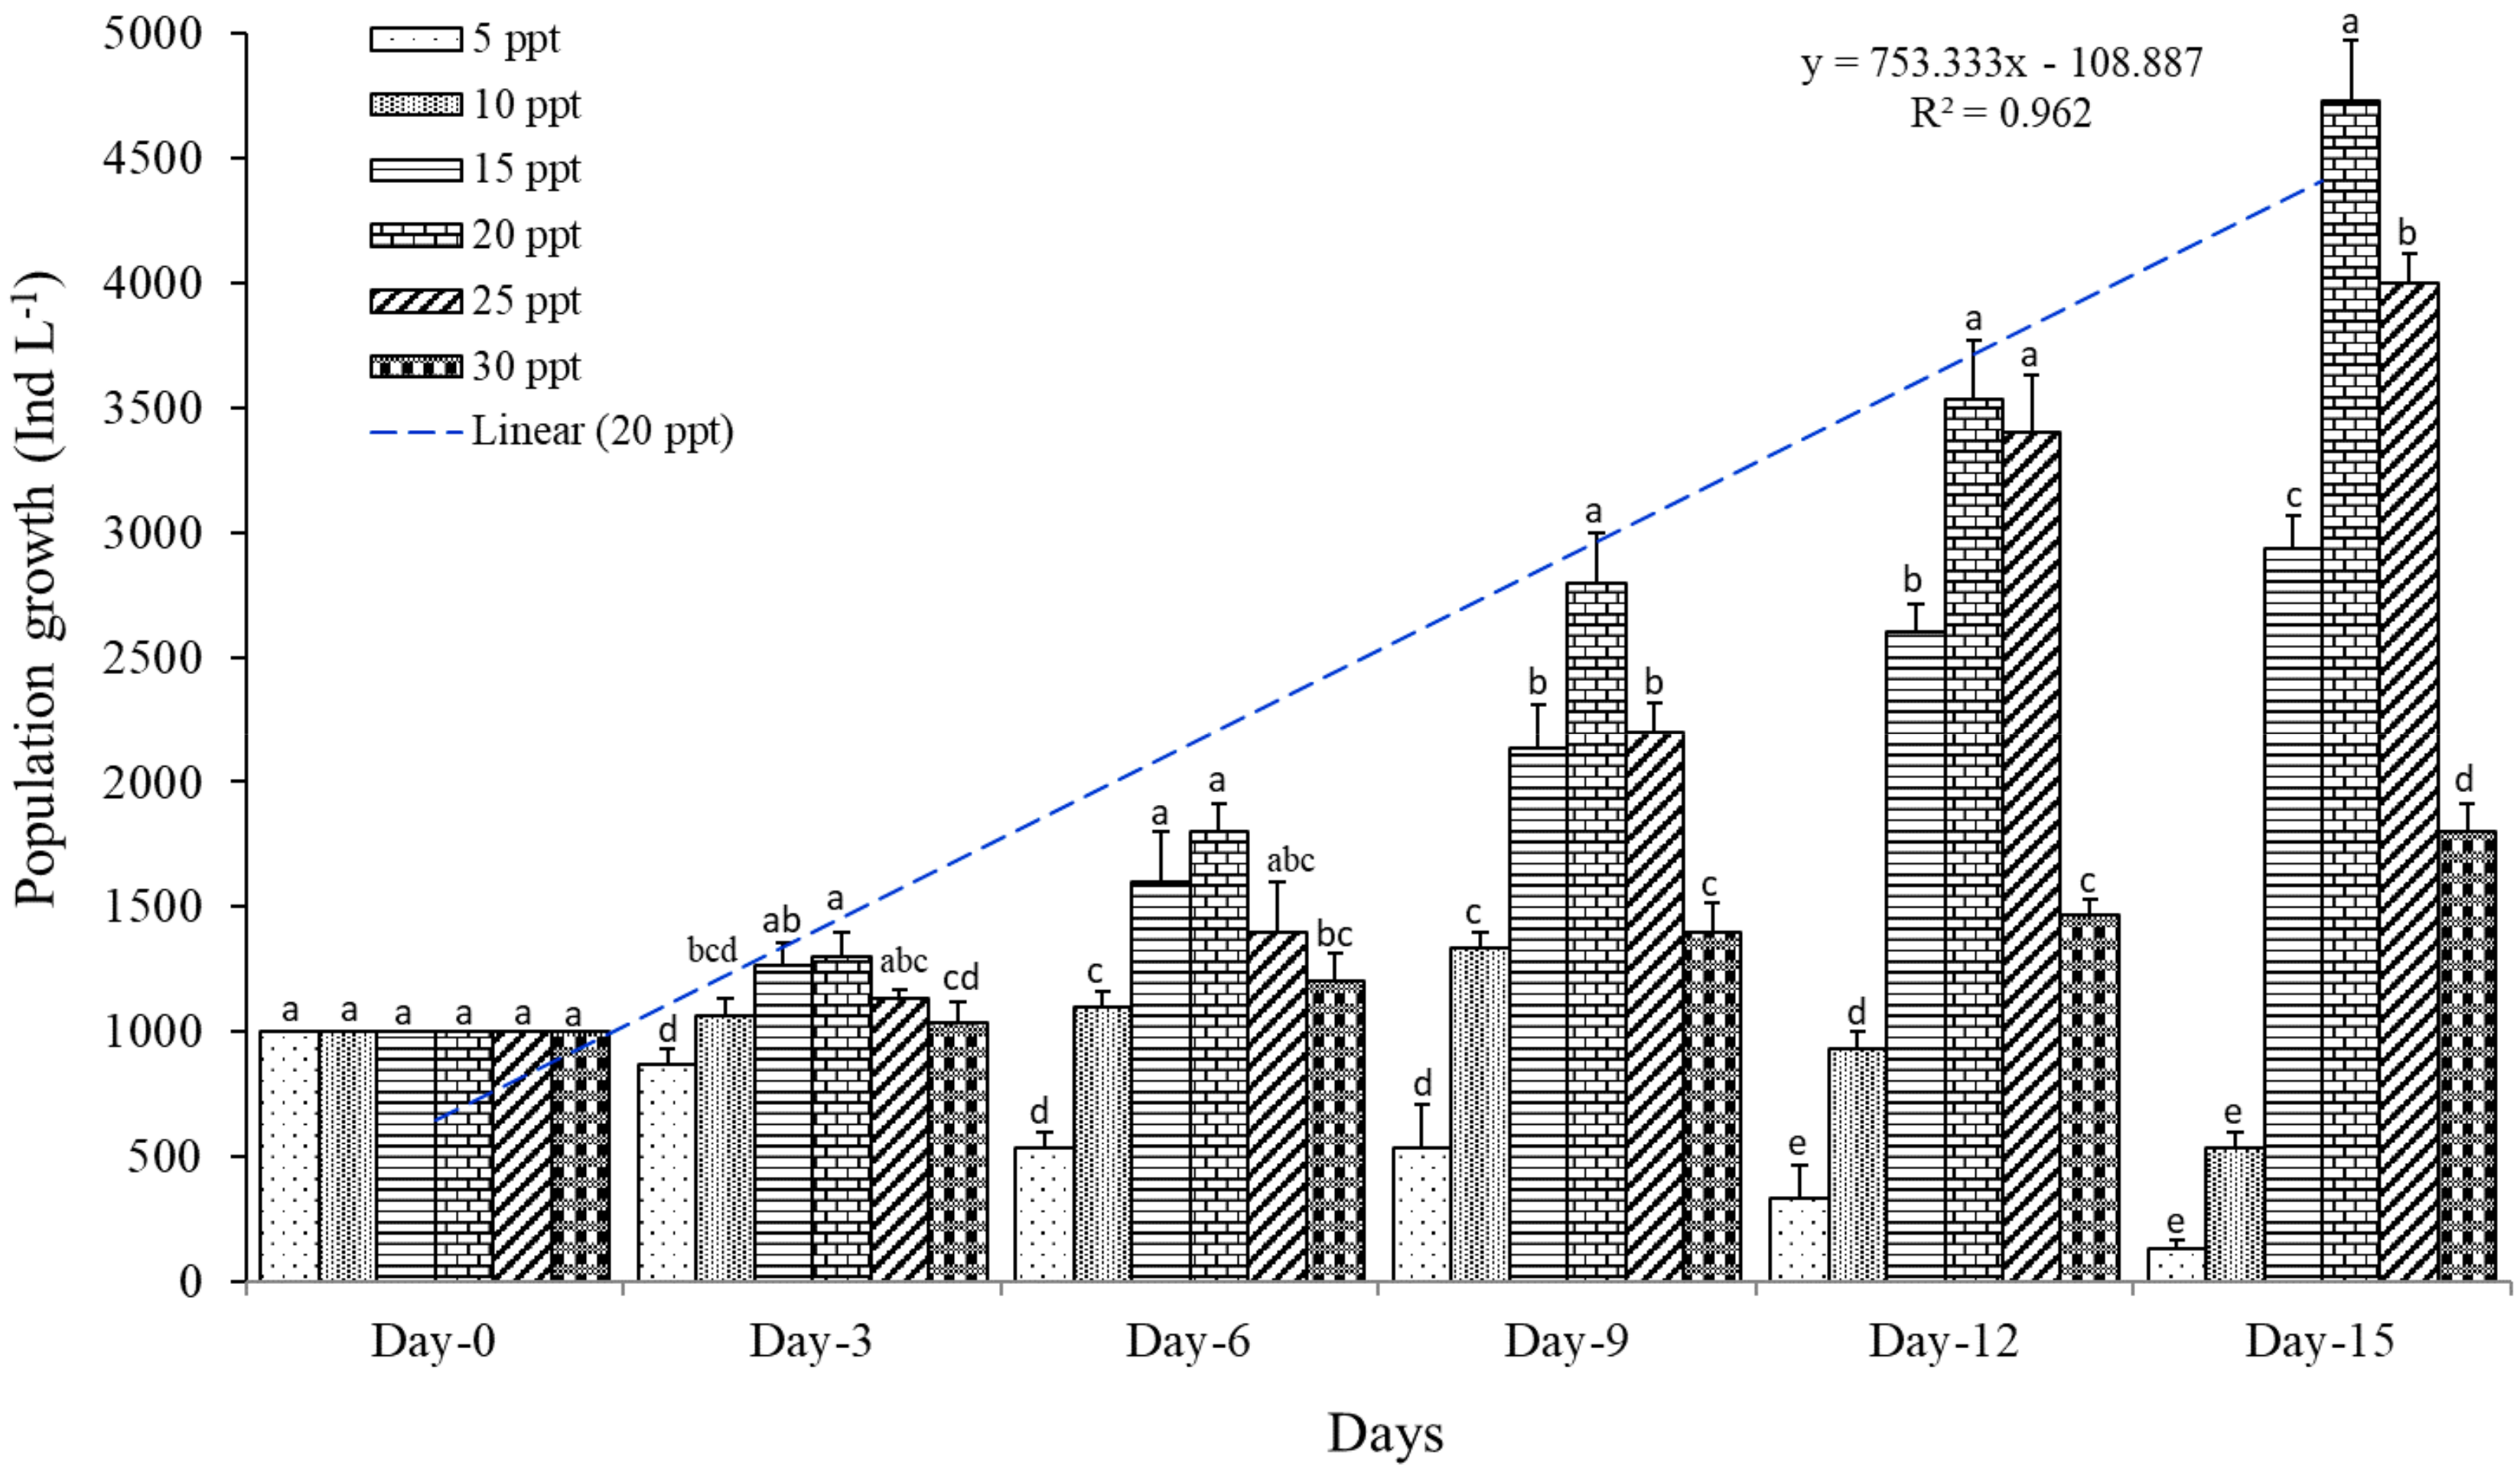
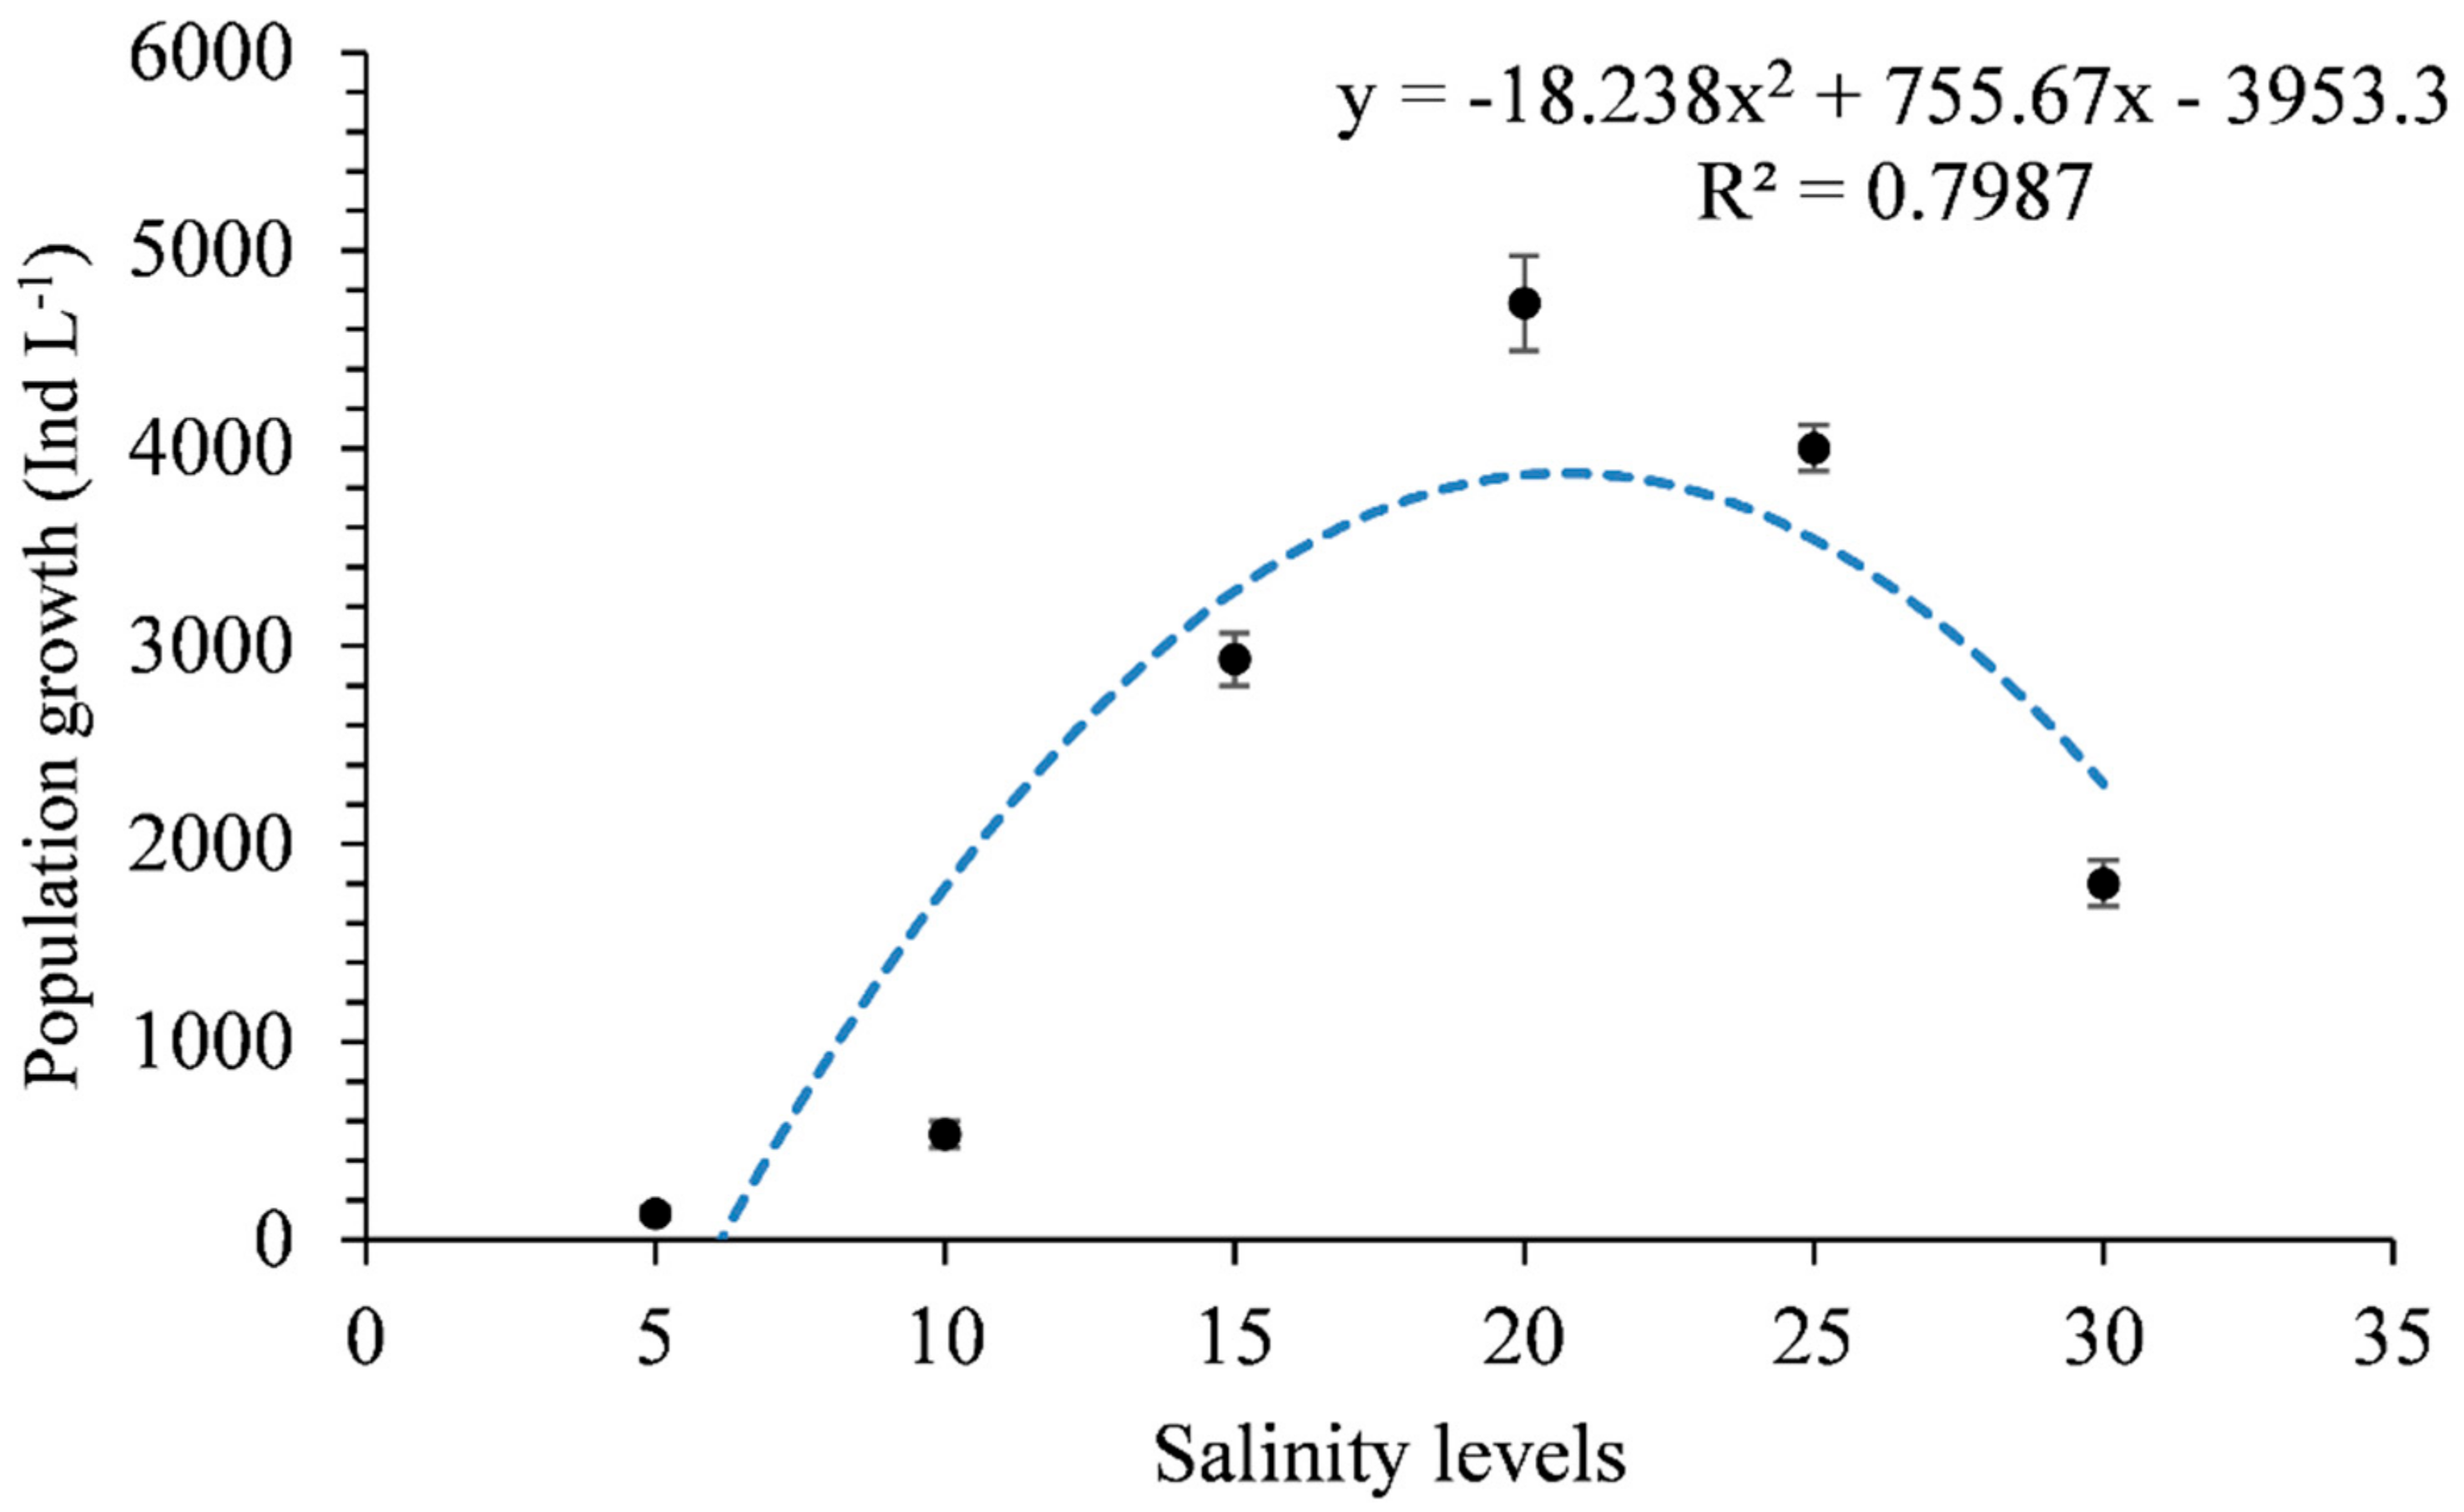
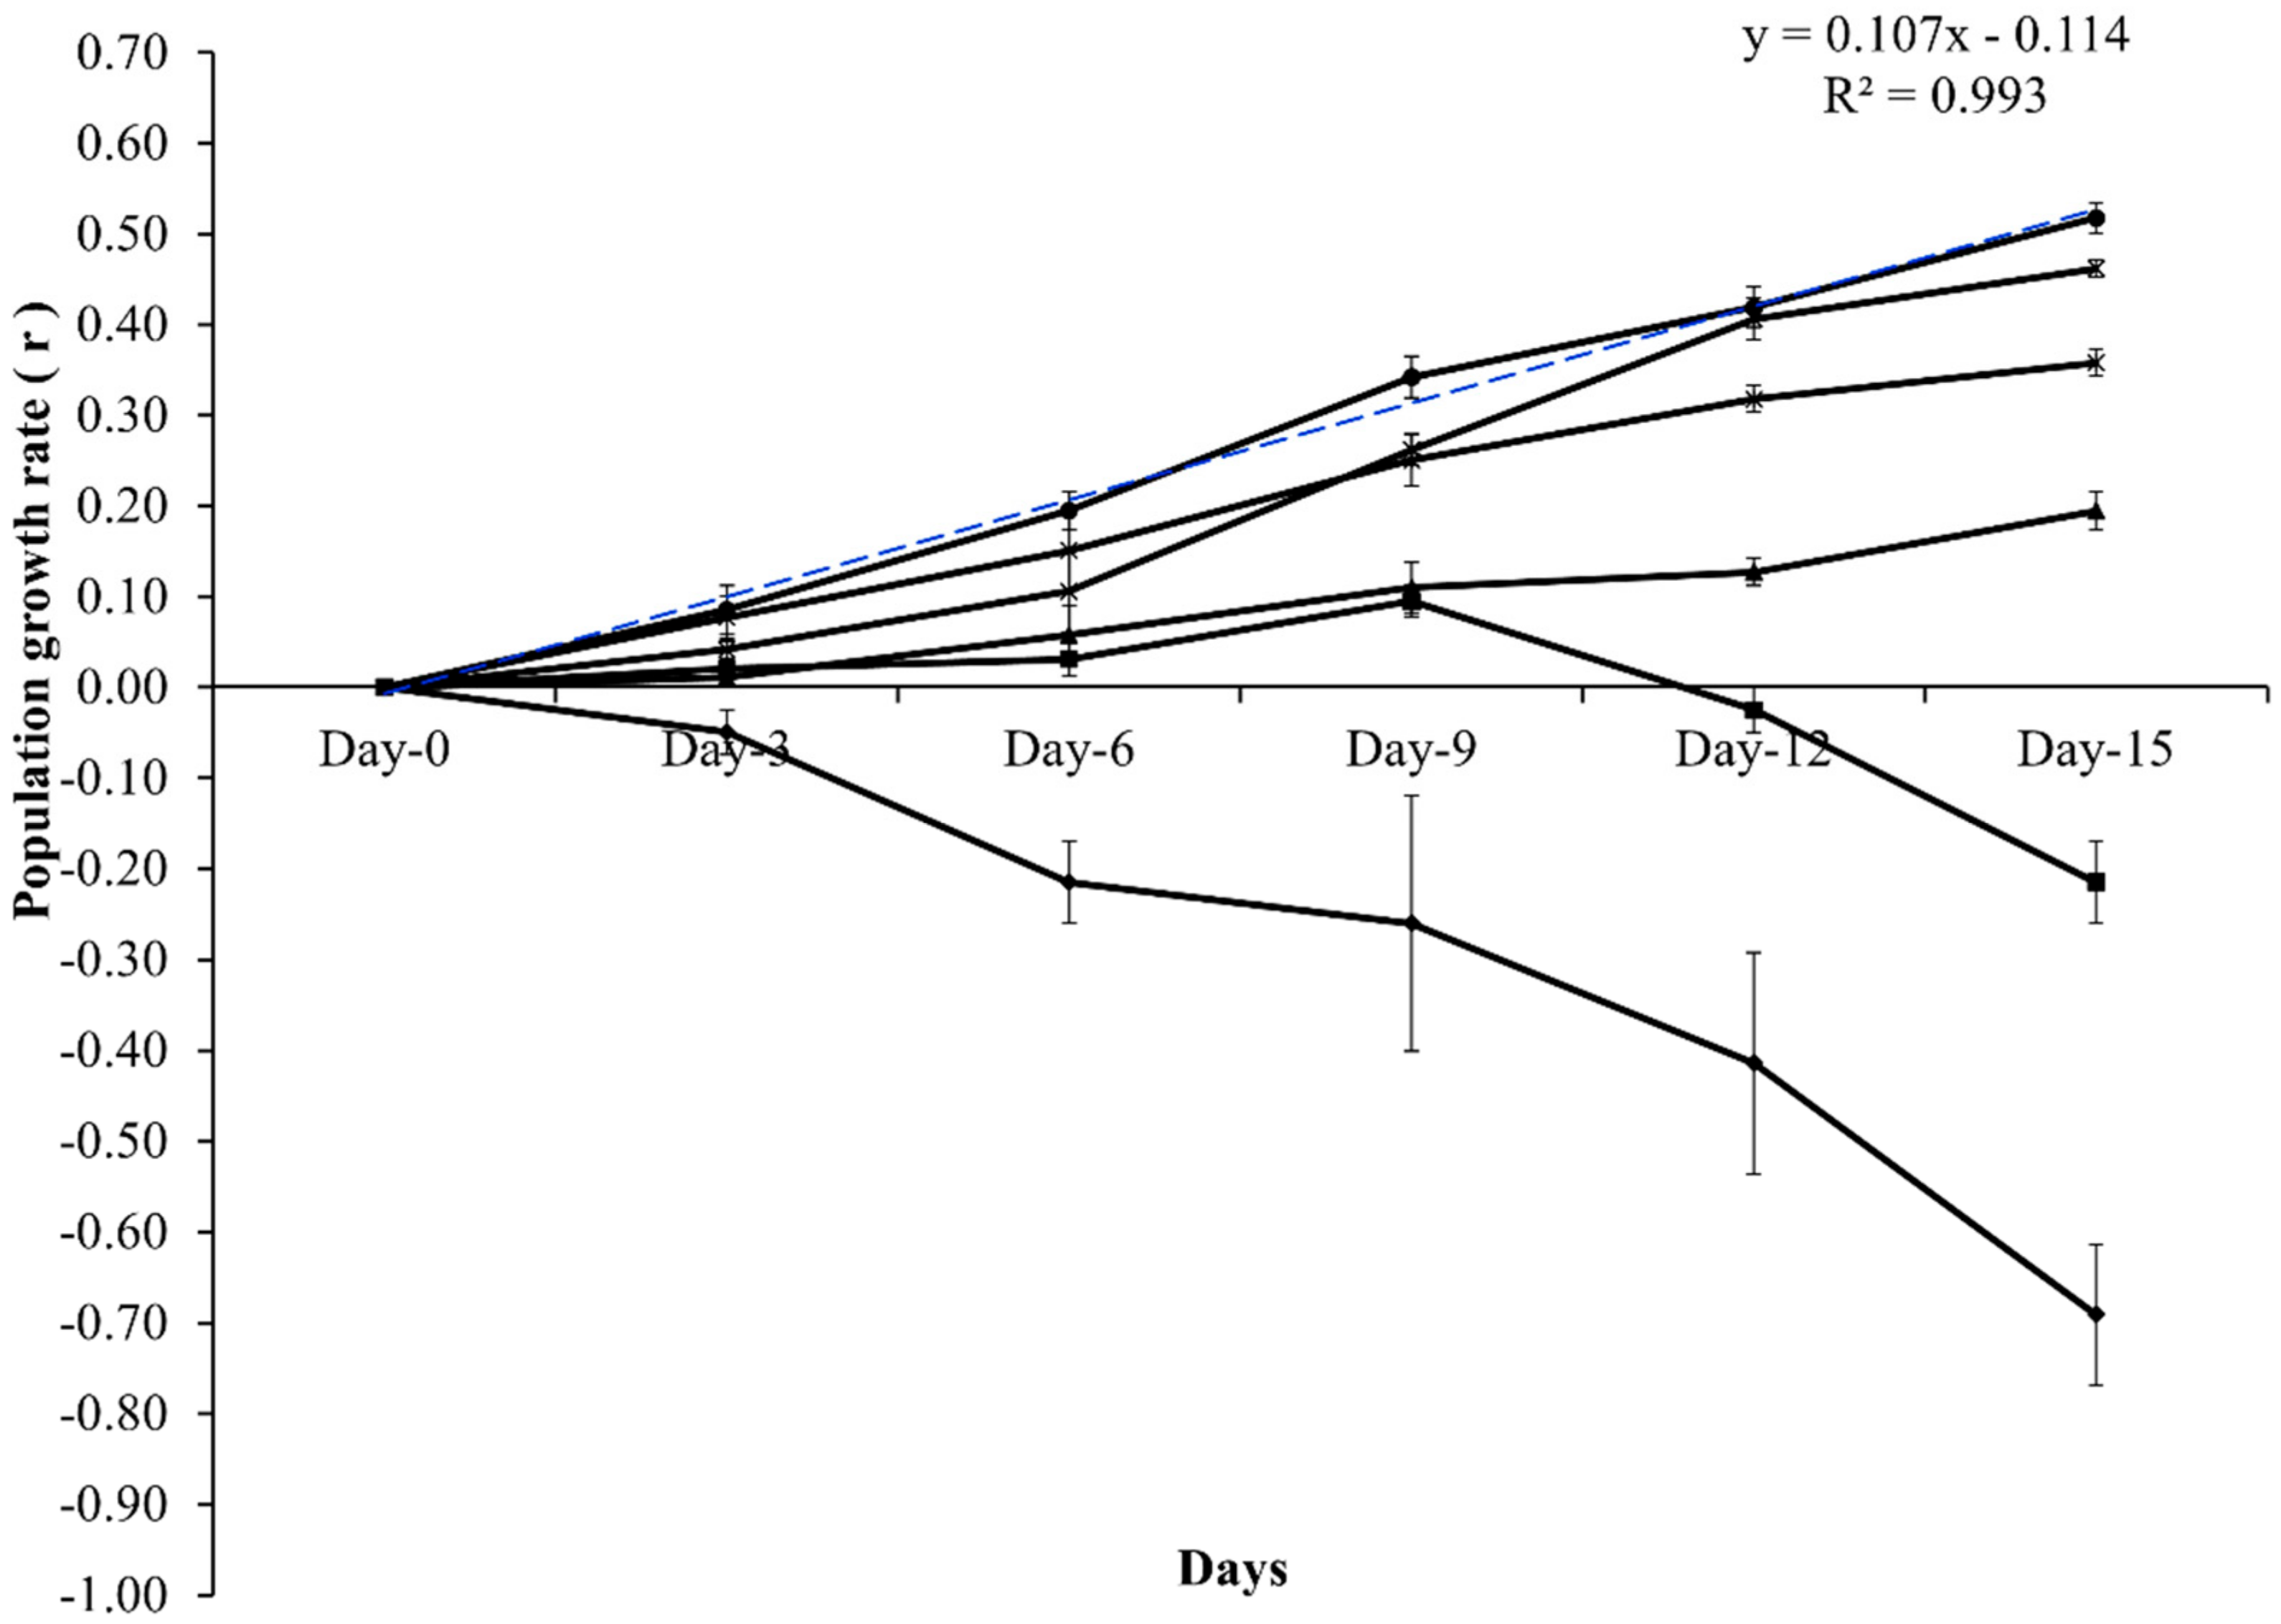
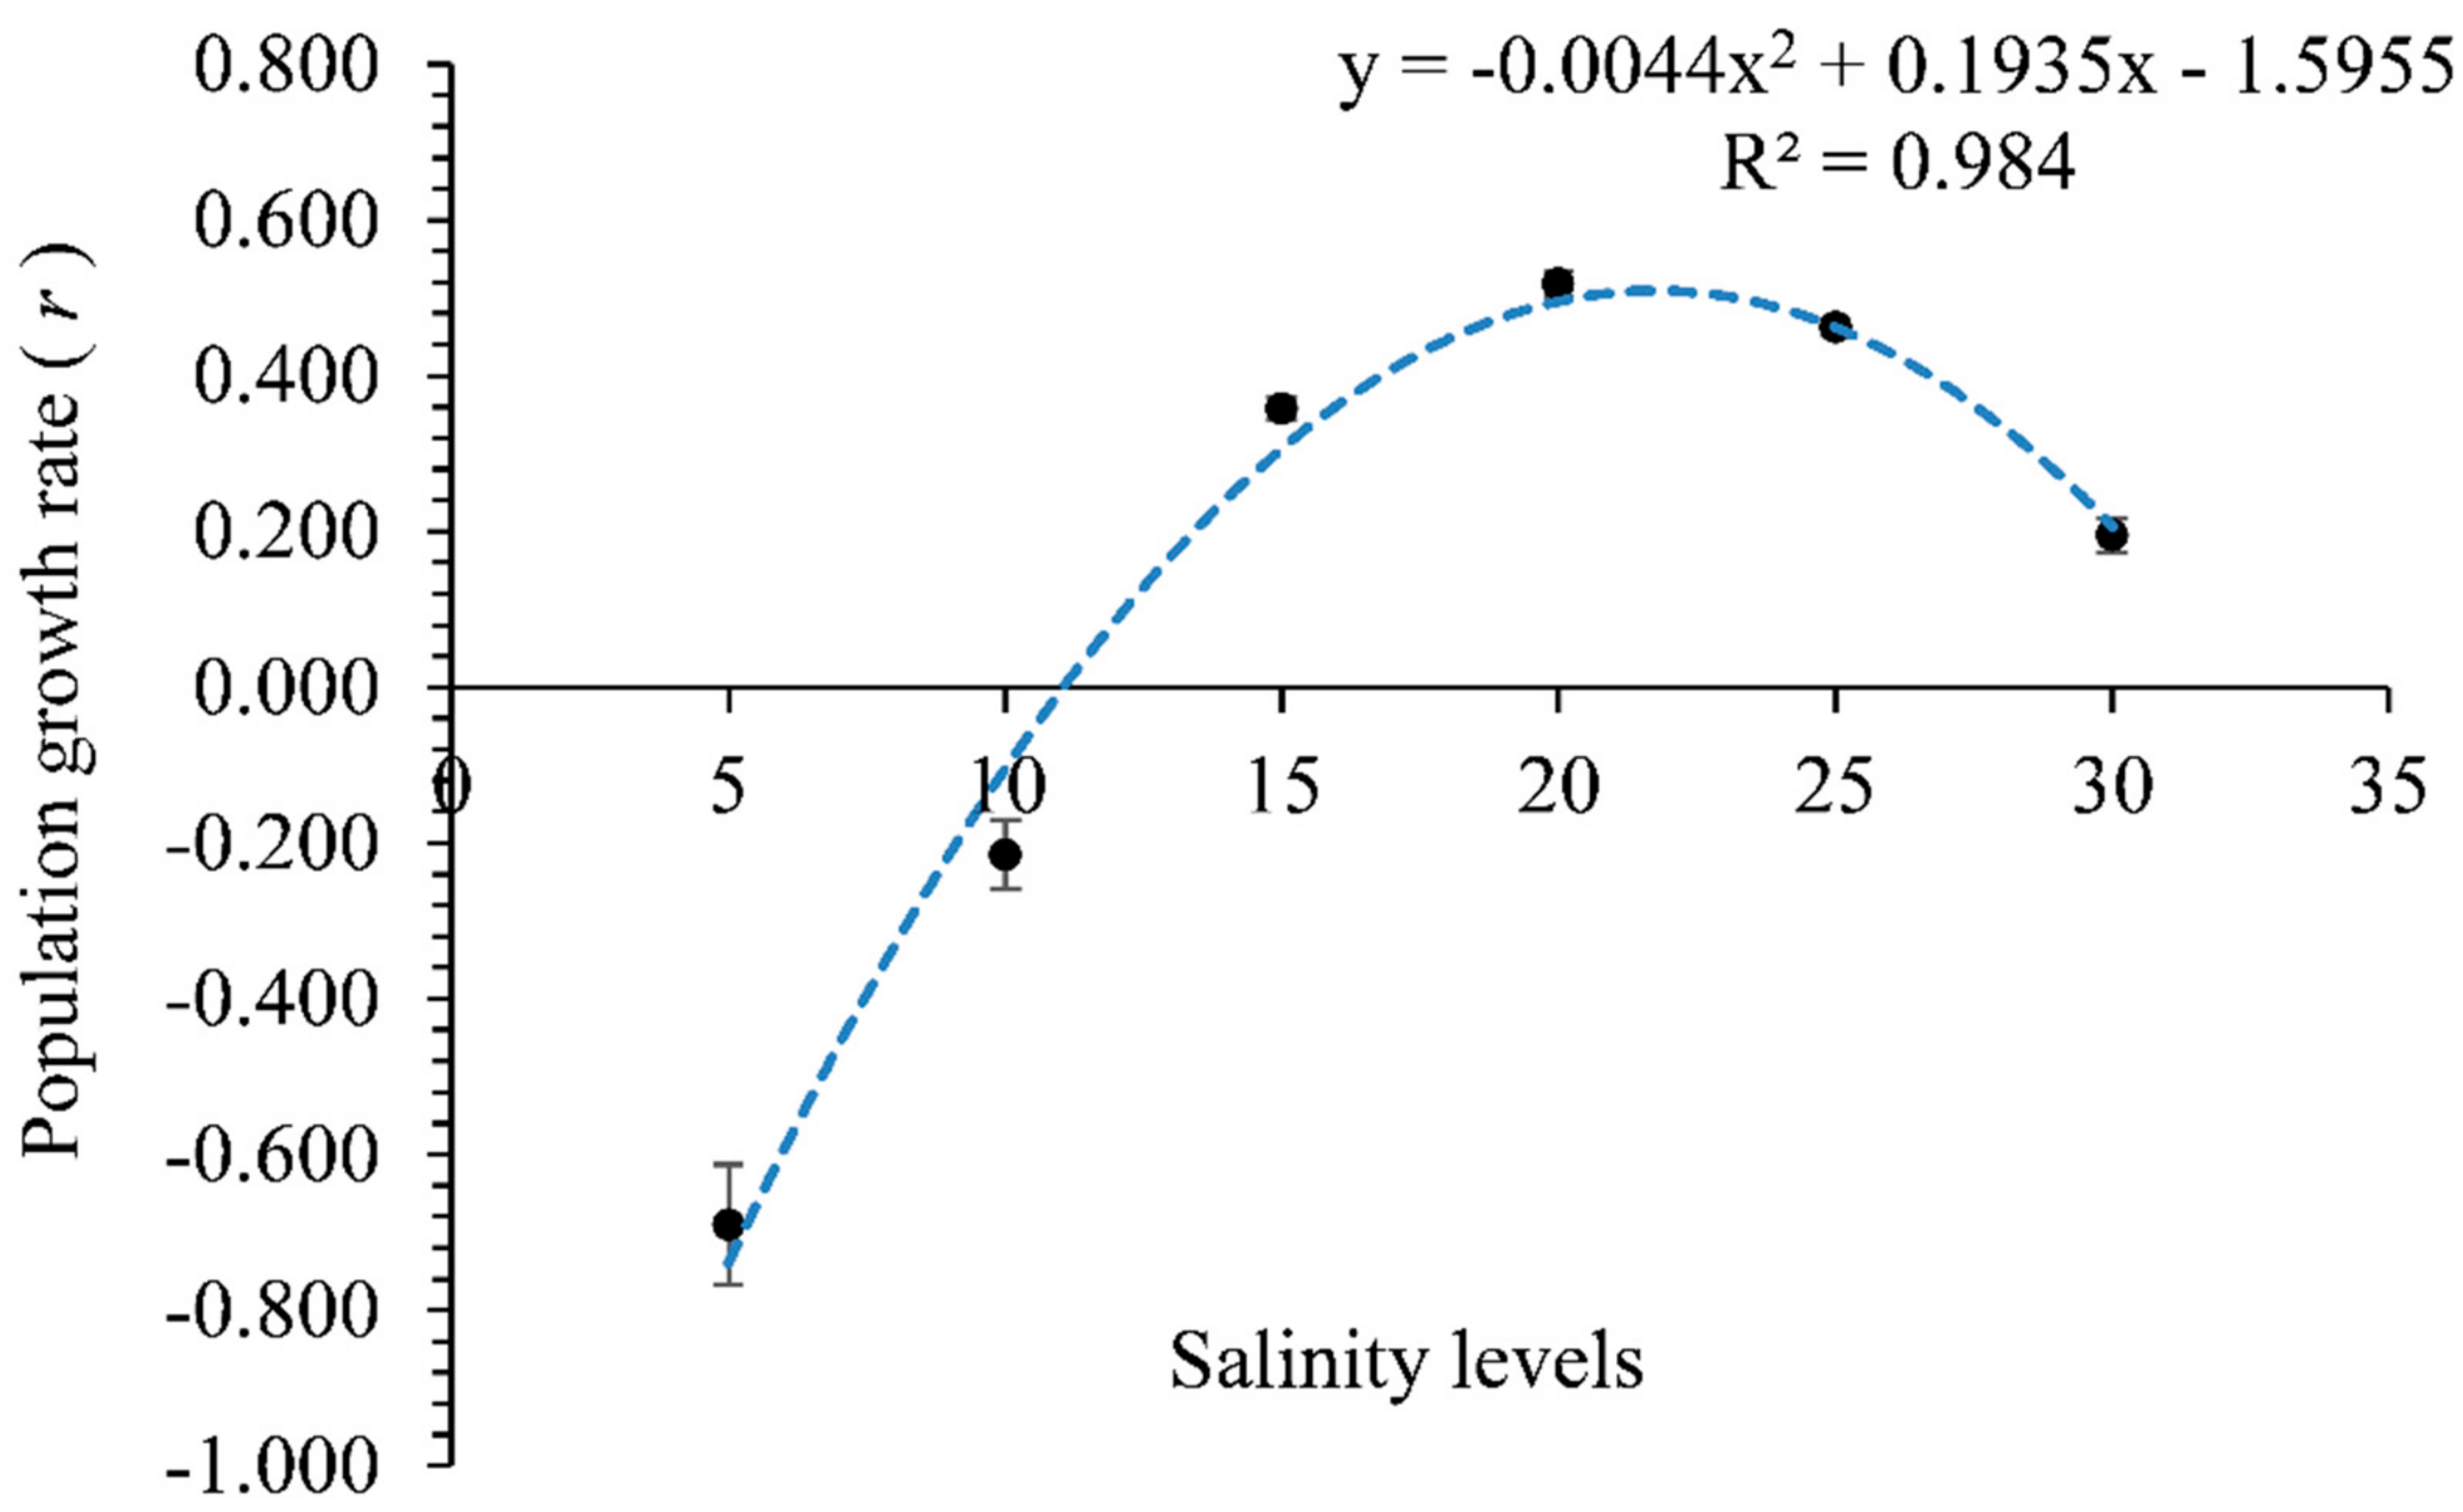
3. Results
4. Discussion
5. Conclusions
Author Contributions
Funding
Institutional Review Board Statement
Informed Consent Statement
Data Availability Statement
Acknowledgments
Conflicts of Interest
References
- El-Sayed, A.-F.M. Tilapia Culture, 2nd ed.; Elsevier: Amsterdam, The Netherlands; Academic Press: London, UK, 2019. [Google Scholar]
- Abbas, E.M.; Ali, F.S.; Desouky, M.G.; Ashour, M.; El-Shafei, A.; Maaty, M.M.; Sharawy, Z.Z. Novel Comprehensive Molecular and Ecological Study Introducing Coastal Mud Shrimp (Solenocera Crassicornis) Recorded at the Gulf of Suez, Egypt. J. Mar. Sci. Eng. 2020, 9, 9. [Google Scholar] [CrossRef]
- Støttrup, J. The elusive copepods: Their production and suitability in marine aquaculture. Aquac. Res. 2000, 31, 703–711. [Google Scholar] [CrossRef]
- Olivotto, I.; Tokle, N.; Nozzi, V.; Cossignani, L.; Carnevali, O. Preserved copepods as a new technology for the marine ornamental fish aquaculture: A feeding study. Aquaculture 2010, 308, 124–131. [Google Scholar] [CrossRef]
- Abate, T.G.; Nielsen, R.; Nielsen, M.; Jepsen, P.M.; Hansen, B.W. A cost-effectiveness analysis of live feeds in juvenile turbot Scophthalmus maximus (Linnaeus, 1758) farming: Copepods versus A rtemia. Aquac. Nutr. 2016, 22, 899–910. [Google Scholar] [CrossRef]
- Sharawy, Z.Z.; Ashour, M.; Abbas, E.; Ashry, O.; Helal, M.; Nazmi, H.; Kelany, M.; Kamel, A.; Hassaan, M.; Rossi, W., Jr.; et al. Effects of dietary marine microalgae, Tetraselmis suecica, on production, gene expression, protein markers and bacterial count of Pacific white shrimp Litopenaeus vannamei. Aquac. Res. 2020, 51, 2216–2228. [Google Scholar] [CrossRef]
- Zaki, M.A.; Ashour, M.; Heneash, A.M.; Mabrouk, M.M.; Alprol, A.E.; Khairy, H.M.; Nour, A.M.; Mansour, A.T.; Hassanien, H.A.; Gaber, A.; et al. Potential Applications of Native Cyanobacterium Isolate (Arthrospira platensis NIOF17/003) for Biodiesel Production and Utilization of Its Byproduct in Marine Rotifer (Brachionus plicatilis) Production. Sustainability 2021, 13, 1769. [Google Scholar] [CrossRef]
- Abdel Rahman, H.; Abdel Razek, A.; AbouZeid, A.; Ashour, M. Optimum growth conditions of three isolated diatoms species Skeletonema costatum, Chaetoceros calcitrans and Detonula confervacea and their utilization as feed for marine penaeid shrimp larvae. Egypt. J. Aquat. Res. 2010, 36, 161–183. [Google Scholar]
- Abo-Taleb, H.; Ashour, M.; El-Shafei, A.; Alataway, A.; Maaty, M.M.; Abo-Taleb, H. Biodiversity of Calanoida Copepoda in Different Habitats of the North-Western Red Sea (Hurghada Shelf). Water 2020, 12, 656. [Google Scholar] [CrossRef] [Green Version]
- Abo-Taleb, H.A.; Zeina, A.F.; Ashour, M.; Mabrouk, M.M.; Sallam, A.E.; El-Feky, M.M.M. Isolation and cultivation of the freshwater amphipod Gammarus pulex (Linnaeus, 1758), with an evaluation of its chemical and nutritional content. Egypt. J. Aquat. Biol. Fish. 2020, 24, 69–82. [Google Scholar] [CrossRef] [Green Version]
- Ajiboye, O.O.; Yakubu, A.F.; Adams, T.E.; Olaji, E.D.; Nwogu, N.A. A review of the use of copepods in marine fish larviculture. Rev. Fish Biol. Fish. 2010, 21, 225–246. [Google Scholar] [CrossRef]
- Ashour, M.; Abo-Taleb, H.; Abou-Mahmoud, M.; El-Feky, M. Effect of the integration between plankton natural productivity and environmental assessment of irrigation water, El-Mahmoudia Canal, on aquaculture potential of Oreochromis niloticus. Turk. J. Fish. Aquat. Sci. 2018, 18, 1163–1175. [Google Scholar] [CrossRef]
- Ashour, M.; Elshobary, M.E.; El-Shenody, R.; Kamil, A.-W.; Abomohra, A.E.-F. Evaluation of a native oleaginous marine microalga Nannochloropsis oceanica for dual use in biodiesel production and aquaculture feed. Biomass Bioenergy 2019, 120, 439–447. [Google Scholar] [CrossRef]
- Sorgeloos, P.; Baeza-Mesa, M.; Bossuyt, E.; Bruggeman, E.; Dobbeleir, J.; Versichele, D.; Laviña, E.; Bernardino, A. Culture of Artemia on rice bran: The conversion of a waste-product into highly nutritive animal protein. Aquaculture 1980, 21, 393–396. [Google Scholar] [CrossRef]
- Elshobary, M.E.; El-Shenody, R.A.; Ashour, M.; Zabed, H.M.; Qi, X. Antimicrobial and antioxidant characterization of bioactive components from Chlorococcum minutum. Food Biosci. 2020, 35, 100567. [Google Scholar] [CrossRef]
- El-Gamal, M.M.; Othman, S.I.; Abdel-Rahim, M.M.; Mansour, A.T.; Alsaqufi, A.S.; El Atafy, M.M.; Mona, M.H.; Allam, A.A. Palaemon and artemia supplemented diet enhances sea bass, Dicentrarchus labrax, broodstock reproductive performance and egg quality. Aquac. Rep. 2020, 16, 100290. [Google Scholar] [CrossRef]
- Abdel-Rahim, M.M.; Mansour, A.T.; Mona, M.H.; El-Gamal, M.M.; El Atafy, M.M. To what extent can maternal inherited immunity acquired from a crustacean-enhanced diet improve the performance and vitality of the offspring and enhance profitability of European Sea bass (Dicentrarchus labrax)? J. World Aquac. Soc. 2019, 50, 550–574. [Google Scholar] [CrossRef]
- Yamaguchi, A.; Matsuno, K.; Homma, T. Spatial changes in the vertical distribution of calanoid copepods down to great depths in the North Pacific. Zool. Stud. 2015, 54, e13. [Google Scholar] [CrossRef] [Green Version]
- Heneash, A.; Ashour, M.; Matar, M. Effect of Un-live Microalgal diet, Nannochloropsis oculata and Arthrospira (Spirulina) platensis, Comparing to Yeast on Population of Rotifer, Brachionus plicatilis. Mediterr. Aquac. J. 2015, 7, 48–54. [Google Scholar] [CrossRef]
- Temperoni, B.; Diovisalvi, N.; Negri, R.; Viñas, M. Seasonal production of Oithona nana Giesbrecht, 1893 (Copepoda: Cyclopoida) in temperate coastal waters off Argentina. J. Plankton Res. 2010, 33, 729–740. [Google Scholar] [CrossRef] [Green Version]
- Inshida, S. Taxonomy and distribution of the family Oithonidae (Copepoda, Cyclopoida) in the Pacific and Indian Oceans. Bull. Ocean Res. Inst. Univ. Tokyo 1985, 20, 1–167. [Google Scholar]
- Lampitt, R.S.; Gamble, J.C. Diet and respiration of the small planktonic marine copepod Oithona nana. Mar. Biol. 1982, 66, 185–190. [Google Scholar] [CrossRef]
- Williams, J.A.; Muxagata, E. The seasonal abundance and production of Oithona nana (Copepoda:Cyclopoida) in Southampton Water. J. Plankton Res. 2006, 28, 1055–1065. [Google Scholar] [CrossRef] [Green Version]
- Miyashita, L.K.; Júnior, M.D.M.; Lopes, R.M. Estuarine and oceanic influences on copepod abundance and production of a subtropical coastal area. J. Plankton Res. 2009, 31, 815–826. [Google Scholar] [CrossRef]
- Farhadian, O.; Md Yusoff, F.; Arshad, A. Effects of salinity, temperature, light intensity and light regimes on production, growth and reproductive parameters of Apocyclops dengizicus. Iran. J. Fish. Sci. 2014, 13, 30–46. [Google Scholar]
- Morehead, D. Copepod culture workshop in Hawaii. Austasia Aquac. 2004, 18, 46–49. [Google Scholar]
- Ashour, M.; Kamel, A. Enhance growth and biochemical composition of Nannochloropsis oceanica cultured under nutrient limitation using commercial agricultural fertilizers. J. Mar. Sci. Res. Dev. 2017, 7, 233. [Google Scholar]
- Molejón, O.H.; Alvarez-Lajonchère, L. Culture experiments with Oithona oculata Farran, 1913 (Copepoda: Cyclopoida), and its advantages as food for marine fish larvae. Aquaculture 2003, 219, 471–483. [Google Scholar] [CrossRef]
- Santhanam, P.; Perumal, P. Effect of temperature, salinity and algal food concentration on population density, growth and survival of marine copepod Oithona rigida Giesbrecht. Indian J. Geo-Mar. Sci. 2012, 41, 369–376. [Google Scholar]
- Isla, J.A.; Perissinotto, R. Effects of temperature, salinity and sex on the basal metabolic rate of the estuarine copepod Pseudodiaptomus hessei. J. Plankton Res. 2004, 26, 579–583. [Google Scholar] [CrossRef]
- Souza-Santos, L.P.; Pastor, J.M.; Ferreira, N.G.; Costa, W.M.; Araújo-Castro, C.M.; Santos, P.J. Developing the harpacticoid copepod Tisbe biminiensis culture: Testing for salinity tolerance, ration levels, presence of sediment and density dependent analyses. Aquac. Res. 2006, 37, 1516–1523. [Google Scholar] [CrossRef]
- Peck, M.A.; Holste, L. Effects of salinity, photoperiod and adult stocking density on egg production and egg hatching success in Acartia tonsa (Calanoida: Copepoda): Optimizing intensive cultures. Aquaculture 2006, 255, 341–350. [Google Scholar] [CrossRef]
- Holste, L.; Peck, M.A. The effects of temperature and salinity on egg production and hatching success of Baltic Acartia tonsa (Copepoda: Calanoida): A laboratory investigation. Mar. Biol. 2006, 148, 1061–1070. [Google Scholar] [CrossRef]
- Chen, Q.; Sheng, J.; Lin, Q.; Gao, Y.; Lv, J. Effect of salinity on reproduction and survival of the copepod Pseudodiaptomus annandalei Sewell, 1919. Aquaculture 2006, 258, 575–582. [Google Scholar] [CrossRef]
- Sullivan, B.K.; Costello, J.H.; Van Keuren, D. Seasonality of the copepods Acartia hudsonica and Acartia tonsa in Narragansett Bay, RI, USA during a period of climate change. Estuar. Coast. Shelf Sci. 2007, 73, 259–267. [Google Scholar] [CrossRef]
- Milione, M.; Zeng, C. The effects of temperature and salinity on population growth and egg hatching success of the tropical calanoid copepod, Acartia sinjiensis. Aquaculture 2008, 275, 116–123. [Google Scholar] [CrossRef]
- Sun, X.; Sun, S.; Li, C.; Zhang, G. Seasonal and spatial variation in abundance and egg production of Paracalanus parvus (Copepoda: Calanoida) in/out Jiaozhou Bay, China. Estuar. Coast. Shelf Sci. 2008, 79, 637–643. [Google Scholar] [CrossRef]
- Ohs, C.L.; Rhyne, A.L.; Grabe, S.W.; DiMaggio, M.A.; Stenn, E. Effects of salinity on reproduction and survival of the calanoid copepod Pseudodiaptomus pelagicus. Aquaculture 2010, 307, 219–224. [Google Scholar] [CrossRef] [Green Version]
- Pan, Y.-J.; Souissi, A.; Souissi, S.; Hwang, J.-S. Effects of salinity on the reproductive performance of Apocyclops royi (Copepoda, Cyclopoida). J. Exp. Mar. Biol. Ecol. 2016, 475, 108–113. [Google Scholar] [CrossRef]
- Jean, J.J.; Lincy, A.; Lipton, A.; Chandran, A. Developmental Stages Observed During Experimental Culture of the Egg Bearing Cyclopoid Copepod Oithona Similis (Claus, 1866); NISCAIR-CSIR: New Delhi, India, 2016. [Google Scholar]
- Tseng, L.-C.; Dahms, H.-U.; Chen, Q.-C.; Hwang, J.-S. Copepod feeding study in the upper layer of the tropical South China Sea. Helgol. Mar. Res. 2009, 63, 327–337. [Google Scholar] [CrossRef] [Green Version]
- El-Khodary, G.M.; Mona, M.M.; El-Sayed, H.S.; Ghoneim, A.Z. Phylogenetic identification and assessment of the nutritional value of different diets for a copepod species isolated from Eastern Harbor coastal region. Egypt. J. Aquat. Res. 2020, 46, 173–180. [Google Scholar] [CrossRef]
- Magouz, F.I.; Essa, M.A.; Matter, M.; Mansour, A.T.; Alkafafy, M.; Ashour, M. Population dynamics, fecundity and fatty acid composition of Oithona nana (Cyclopoida, Copepoda), fed on different diets. Animals 2021, 11, 1188. [Google Scholar] [CrossRef]
- Yin, X.W.; Min, W.W.; Lin, H.J.; Chen, W. Population dynamics, protein content, and lipid composition of Brachionus plicatilis fed artificial macroalgal detritus and Nannochloropsis sp. diets. Aquaculture 2013, 380-383, 62–69. [Google Scholar] [CrossRef]
- Paffenhöfer, G.-A.; Mazzocchi, M. On some aspects of the behaviour of Oithona plumifera (Copepoda: Cyclopoida). J. Plankton Res. 2002, 24, 129–135. [Google Scholar] [CrossRef] [Green Version]
- Cornils, A.; Wend-Heckmann, B. First report of the planktonic copepod Oithona davisae in the northern Wadden Sea (North Sea): Evidence for recent invasion? Helgol. Mar. Res. 2015, 69, 243–248. [Google Scholar] [CrossRef] [Green Version]
- Chilmawati, D. The Effect of Different Diet of Phytoplankton Cells on Growth Performance of Copepod, Oithona sp. in Semi-mass Culture. Aquat. Procedia 2016, 7, 39–45. [Google Scholar] [CrossRef]
- Magouz, F.I.M.; Essa, M.A.; El-Shafei, A.; Mansour, A.T.; Mahmoud, S.m.; Ashour, M. Effect of extended feeding with live copepods, Oithona nana, and Artemia franciscana on the growth performance, intestine histology, and economic viability of european seabass (Dicentrarchus labrax) postlarvae. Fresenius Environ. Bull. 2021, 30, 7106–7116. [Google Scholar]
- El-Shenody, R.A.; Ashour, M.; Ghobara, M.M.E. Evaluating the chemical composition and antioxidant activity of three Egyptian seaweeds: Dictyota dichotoma, Turbinaria decurrens, and Laurencia obtusa. Braz. J. Food Technol. 2019, 22, 2018203. [Google Scholar] [CrossRef] [Green Version]
- Ashour, M.; Mabrouk, M.M.; Ayoub, H.F.; El-Feky, M.M.; Zaki, S.Z.; Hoseinifar, S.H.; Rossi, W.; Van Doan, H.; El-Haroun, E.; Goda, A.M.-S. Effect of dietary seaweed extract supplementation on growth, feed utilization, hematological indices, and non-specific immunity of Nile Tilapia, Oreochromis niloticus challenged with Aeromonas hydrophila. Environ. Boil. Fishes 2020, 32, 1–13. [Google Scholar] [CrossRef]
- Allam, B.W.; Khalil, H.S.; Mansour, A.T.; Srour, T.M.; Omar, E.A.; Nour, A.A.M. Impact of substitution of fish meal by high protein distillers dried grains on growth performance, plasma protein and economic benefit of striped catfish (Pangasianodon hypophthalmus). Aquaculture 2020, 517, 734792. [Google Scholar] [CrossRef]
- Devreker, D.; Souissi, S.; Winkler, G.; Forget-Leray, J.; Leboulenger, F. Effects of salinity, temperature and individual variability on the reproduction of Eurytemora affinis (Copepoda; Calanoida) from the Seine estuary: A laboratory study. J. Exp. Mar. Biol. Ecol. 2009, 368, 113–123. [Google Scholar] [CrossRef]
- Jepsen, P.M.; Thoisen, C.V.; Carron-Cabaret, T.; Pinyol-Gallemí, A.; Nielsen, S.L.; Hansen, B.W. Effects of salinity, commercial salts, and water type on cultivation of the cryptophyte microalgae Rhodomonas salina and the calanoid copepod Acartia tonsa. J. World Aquac. Soc. 2019, 50, 104–118. [Google Scholar] [CrossRef] [Green Version]
- Payne, M.; Rippingale, R. Effects of salinity, cold storage and enrichment on the calanoid copepod Gladioferens imparipes. Aquaculture 2001, 201, 251–262. [Google Scholar] [CrossRef]


Publisher’s Note: MDPI stays neutral with regard to jurisdictional claims in published maps and institutional affiliations. |
© 2021 by the authors. Licensee MDPI, Basel, Switzerland. This article is an open access article distributed under the terms and conditions of the Creative Commons Attribution (CC BY) license (https://creativecommons.org/licenses/by/4.0/).
Share and Cite
Magouz, F.I.; Essa, M.A.; Matter, M.; Mansour, A.T.; Gaber, A.; Ashour, M. Effect of Different Salinity Levels on Population Dynamics and Growth of the Cyclopoid Copepod Oithona nana. Diversity 2021, 13, 190. https://0-doi-org.brum.beds.ac.uk/10.3390/d13050190
Magouz FI, Essa MA, Matter M, Mansour AT, Gaber A, Ashour M. Effect of Different Salinity Levels on Population Dynamics and Growth of the Cyclopoid Copepod Oithona nana. Diversity. 2021; 13(5):190. https://0-doi-org.brum.beds.ac.uk/10.3390/d13050190
Chicago/Turabian StyleMagouz, Fawzy I., Mohamed A. Essa, Mustafa Matter, Abdallah Tageldein Mansour, Ahmed Gaber, and Mohamed Ashour. 2021. "Effect of Different Salinity Levels on Population Dynamics and Growth of the Cyclopoid Copepod Oithona nana" Diversity 13, no. 5: 190. https://0-doi-org.brum.beds.ac.uk/10.3390/d13050190