Article

Biodiversity Evaluation: From Endorsed Indexes to Inclusion of a Pollinator Indicator

1
CREA Research Centre for Agriculture and Environment, Via di Corticella 133, 40128 Bologna, Italy
2
Independent Researcher, Via di Corticella 85, 40128 Bologna, Italy
3
Deptartment of Biological, Geological and Environmental Sciences, University of Bologna, Via Irnerio 42, 40126 Bologna, Italy
*
Author to whom correspondence should be addressed.
Submission received: 9 August 2021 / Revised: 21 September 2021 / Accepted: 25 September 2021 / Published: 29 September 2021

Abstract

:
There is increasing interest in evaluating biodiversity to preserve ecosystem services. Researchers can sustain policymakers by providing tools, such as indexes and indicators, that need constant implementation to become accepted standards. Implementation may vary from re-evaluation of existing indicators to introduction of new ones based on emerging threats to biodiversity. With the aim of contributing to the compelling need to estimate and counterbalance pollinator loss, we screened existing bioindicators. We first selected indexes/indicators applied to agricultural contexts and concurrently endorsed by a regulatory agency. We then extended our analysis to indexes/indicators based on arthropod taxa and formally recognized at least by national bodies. Our procedure identified a combination of surveys of various animal taxa and remote landscape analyses (e.g., using a GIS and other cartographic tools). When the animals are arthropods, most indexes/indicators can only address confined environments (e.g., grasslands, riversides). Indicator strength was improved by the simultaneous inclusion of biotic and abiotic components. Pollinator sensitivity to changes at micro-habitat level is widely appreciated and may help distinguish agricultural practices. A biodiversity index based on pollinators, including a wide monitoring scheme supplemented by citizen science, is currently fostered at the European level. The results obtained using such an index may finally enable focusing of strategic funding. Our analysis will help to reach this goal.

1. Introduction

The biodiversity of the agroecosystems is becoming crucial in European legislation as a key to tackle food security, human and environmental health and climate change. Biodiversity conservation has been introduced among the specific objectives of the European Common Agriculture Policy (CAP). The full title, maintained in the current version of the CAP, is “Contribute to the protection of biodiversity, enhance ecosystem services and preserve habitats and landscape” [1,2]. A complex system of indicators (of context, impact, result and output) has been implemented in subsequent CAP schemes. These indicators are basic tools for addressing EU achievements, especially those linked to rural development programs (RDPs). When biodiversity is no longer just a matter of scientific enquiry, it is necessary to discriminate between existing tools and/or promote development of new ones tailored to policy. These tools need to have a scientific background, but they also need to adjust to widely accepted economic and political criteria. They therefore need to be endorsed (i.e., tested by a scientific regulatory agency) and/or officially recognized (i.e., included in an existing regulation). Endorsement and/or official recognition can vary from one country to another, and information in the grey literature and national languages may be difficult to collect. At the European level, a superimposed list of tools may need to be included in national regulations.
For example, measuring biodiversity in agricultural systems has been tackled by previous versions of CAP through the Farmland Bird Index (FBI—impact indicator I.08 for CAP 2014–2020) and High Nature Value farming (HNV—impact indicator I.09 for CAP 2014–2020) [3]. FBI has been a pioneer among indexes, addressing farmland birds as elements of the quality of farmed environments. Birds are considered optimal subjects because they are near the top of the food chain. They have therefore been monitored and trends identified over the course of time through on-site bird surveys. The concept of HNV farming was established in the early 1990s [4,5,6] and refers to farming systems that favor biodiversity by traditional agricultural practices applied to wide areas. Rural development measures to preserve and develop HNV farming were fostered, and an impact indicator, mostly based on land cover and farming criteria, was applied. Depending on its employment, the index components may vary [7]. These indexes did not prove to be perfectly suited to the aims of CAP when it came to evaluating individual farm performance and RDPs. HNV farming will not be included in CAP post-2020 [8]. Furthermore, although FBI proved satisfactory at regional/national level, it was less relevant to local rural development measures [9]. Bird biology, based on areas usually larger than target farms, could be unsuitable for understanding the biodiversity of small–medium enterprise (SME) properties. With the specific objective mentioned above, CAP post-2020 establishes three indexes for biodiversity protection. FBI (now impact indicator I.18) will be retrieved as a proxy with a view to increasing farmland bird populations. Another indicator that will be employed is I.19, “Percentage of species and habitats of Community interest related to agriculture with stable or increasing trends”, which assesses the trends of habitats and species listed in the relevant Habitats Directive annexes, on the basis of a strong connection between the presence and persistence of such species and habitats, and the sustainability and good environmental quality of a given agricultural ecosystem. The third indicator is I.20, “Agricultural land with landscape features”, that estimates the area of landscape features of farmland (as a percentage of shared Utilized Agricultural Area—UAA). Landscape features that support biodiversity and ecosystem services, such as hedgerows, patches of trees, woodland, ponds, water bodies, streams and moderately managed areas like field margins, may be included. The unit of measurement, based almost entirely on cartographic information, has yet to be defined, but will hopefully remedy the lack of acknowledgement of farm-level RDPs for biodiversity improvement. I.19 and I.20 are not fully defined but will certainly be implemented through national/transnational debate. Despite intensive research, not all the indicators for evaluating the resulting impact of RDPs have yet been identified.
In recent decades, the relevance of other groups of animals, grouped under the term pollinators, acquired eminence when discussing biodiversity loss. In temperate areas, pollinators are mainly insects belonging to the orders Hymenoptera (especially bees), Diptera (especially hoverflies) and Lepidoptera (especially butterflies). Other insect groups (moths, beetles) and birds are also included. Merging with the above, an index on pollinators may soon be included in the list of indicators related to biodiversity. The Intergovernmental Science-Policy Platform on Biodiversity and Ecosystem Services (IPBES) released an assessment [10] intended to underline how closely pollinators are linked to agricultural productivity and food production. The assessment also fosters national pollinator strategies and action plans, since despite their importance, pollinators constantly bear the brunt of human activity. Since pollinators are a fundamental component of ecosystems, pressure on them needs to be monitored and quantified. The EU Pollinators Initiative began in 2018 and focused on the loss of wild pollinators and the possible consequences of losing wildflower species linked to them. It also focuses on the fact that a large part of annual agricultural production depends directly on insect pollinators. Some of the actions in the report [11] are particularly consistent with the context of our work: Action 1—Support monitoring and assessment; Action 5—Improve pollinator habitats on and around farmland. Accordingly, the EU Biodiversity Strategy for 2030 focuses on reversing the decline of pollinators [12], and the European Parliament has asked for a pollinator index to be included in CAP post-2020 [13]. The term pollinators includes many animal species and groups, all of which are insects at temperate latitudes. For specific insect groups that are also pollinators, e.g., butterflies [14] and syrphid flies [15], indexes/indicators already exist. However, there is not yet an index/indicator comprehensive for all pollinator species. The “Proposal for an EU Pollinator Monitoring Scheme” (EU-PoMS; [16]) intends to implement a cost-effective core scheme to foster EU national monitoring of all essential pollinators (wild bees, butterflies, hoverflies, moths, rare and threatened pollinator species) by standardized methods, to create a sound scientific base for “a general EU indicator of the status and trends of pollinators and a CAP-specific indicator to evaluate the impacts of Common Agricultural Policy on pollinators and pollination” [16]. This proposal will soon be tested in the field in a pilot study.
At the Italian level, the 2019 Directive on the conservation of biodiversity of the Ministry for Environment, Land and Sea Protection [17] provided funding and enhanced research on pollinator populations in Italian National Parks, with special acknowledgement of threats driven by agricultural practices. ISPRA (Istituto Superiore per la Protezione e la Ricerca Ambientale—the Italian institute for environmental protection and research) highlights the complexity of using pollinators as indicators of environmental health and proposes an approach involving in situ sampling followed by simplified identification of samples, without reaching the rank of species [18]. Other projects focusing on pollinator diversity have been funded in Italy, and our research group is involved in two of them: the European LIFE 4 POLLINATORS (LIFE18 GIE/IT000755), led by the University of Bologna, and the national BeeNet, led by CREA (Research Centre for Agriculture and Environment). One of the objectives of the former is to define the protocol of a new biodiversity indicator for assessing rural development plans [19] through pollinator monitoring and direct involvement of farmers in the Emilia-Romagna region. The main objective of the latter is to extend a large regional monitoring scheme for honeybees and wild bees to the whole of Italy. These projects will help to fill gaps in our understanding of pollinator ecology, especially that of bees (Apoidea, [16]), since we are lacking much information on species-specific requirements. This is in line with the European situation described in the European Red List, where about 56% of pollinator species are “data deficient” [20].
Since our long-term goal is to define an indicator based on pollinators and since we are directly involved in national and European projects, we decided to investigate existing indicators and their characteristics. We considered their scientific status and current political–legal acceptance. We started with indicators already used to investigate biodiversity and continued with those focused on arthropods, assuming a similarity of these animals with pollinators active in temperate areas.

2. Materials and Methods

We conducted a search of the literature on official websites of the regulatory agencies: scientific agencies responsible for the development and endorsement of indicators and political agencies responsible for the recognition of biodiversity indicators in regional, national and European legislation. We surveyed webpages and reports of the European Environment Agency (EEA), the ETC on Biological Diversity (ETC/BD), the Directorate General for Environment and Directorate General for Agriculture and Rural Development (European Commission), identifying the main indicators related to our goal. At the national level, we included the indexes and/or indicators mentioned in the Italian “Testo Unico Ambientale” [21], a text adopting numerous European directives on environmental issues; we surveyed protocols drawn up by ISPRA. We also perused any scientific literature directly linked to the indexes/indicators.

2.1. Definitions and Criteria

During our search, it emerged that the terms index/indicator are employed differently depending on the context (ecological, political, etc.), especially the term indicator, usage of which can vary widely [22]. For our purposes, we define the terms as follows:
  • “Index” is an instrument that sets a value to describe a measurable phenomenon (e.g., the value of a sampled population in relation to the expected value).
  • “Indicator” is a more complex and often composite tool for evaluating a phenomenon that cannot be measured directly.
Since our goal was to weigh information included in indexes/indicators used to evaluate the efficacy of biodiversity and national funding in agricultural contexts, and with a view to developing a pollinator indicator, we selected indexes/indicators based on two criteria:
  • Their present or past potential to reflect biodiversity in agroecosystems;
  • Their proximity to arthropod lifestyles.
To select indexes/indicators reflecting the first point, we surveyed official documents at the European and national level because whatever a new pollinator indicator might include, it must be suitable for future applications in fields that are not purely scientific. Since Italy is a European member state, European legislation and its indicators had to be considered. In some cases, however, they are applied flexibly, and national documents may explain how. Regarding the second criterion, we selected indexes/indicators already included in Italian national/regional regulation on arthropods or already considered to be bio-indicator organisms, at least by Italian government agencies. This second criterion refers to the fact that in temperate latitudes, pollination is mainly carried out by insects [16]. Bees, hoverflies and butterflies are constant visitors to flowers, where they forage for resources such as pollen and nectar. Like other insects, pollinator ranges of activity may be limited spatially and strongly influenced by vegetation/landscape characteristics. Some indicators referring to spatial context were therefore also considered here.

2.2. Parameters

We analyzed the indexes/indicators on the basis of:
  • Taxonomic groups: We indicated the taxa of the study species and their ecological/biological similarity with pollinator lifestyles.
  • Monitoring type: Monitoring can be ongoing at regular intervals so that data for the indicator flows from the monitoring dataset itself, or it can be spot data collection for specific needs and comparison with existing information on the subject.
  • Spatial and habitat context: We defined the spatial scale (regional, local, codified habitats, portions of habitats) and the parameters used to define it (arbitrary or ecological, i.e., application of a rigid sampling scheme, adaptation of the sampling scheme to land characteristics, individual case studies).
  • Background: We evaluated the amount of ecological/biological knowledge on the study species, (i.e., is there an expected population/list of species typical of a given habitat in the absence of disturbance?).
  • Sampling effort and level of taxonomic identification: We identified the type of sampling protocol and subsequent taxonomic effort, the taxonomic level of identification and the skills required for these activities.
  • Final output: We underlined how outputs are reported (i.e., descriptive, ratio or class/category).

3. Results

3.1. Selected Indicators

Here we describe the nine indexes/indicators we selected, providing with information regarding their position in the European/national context (Figure 1):
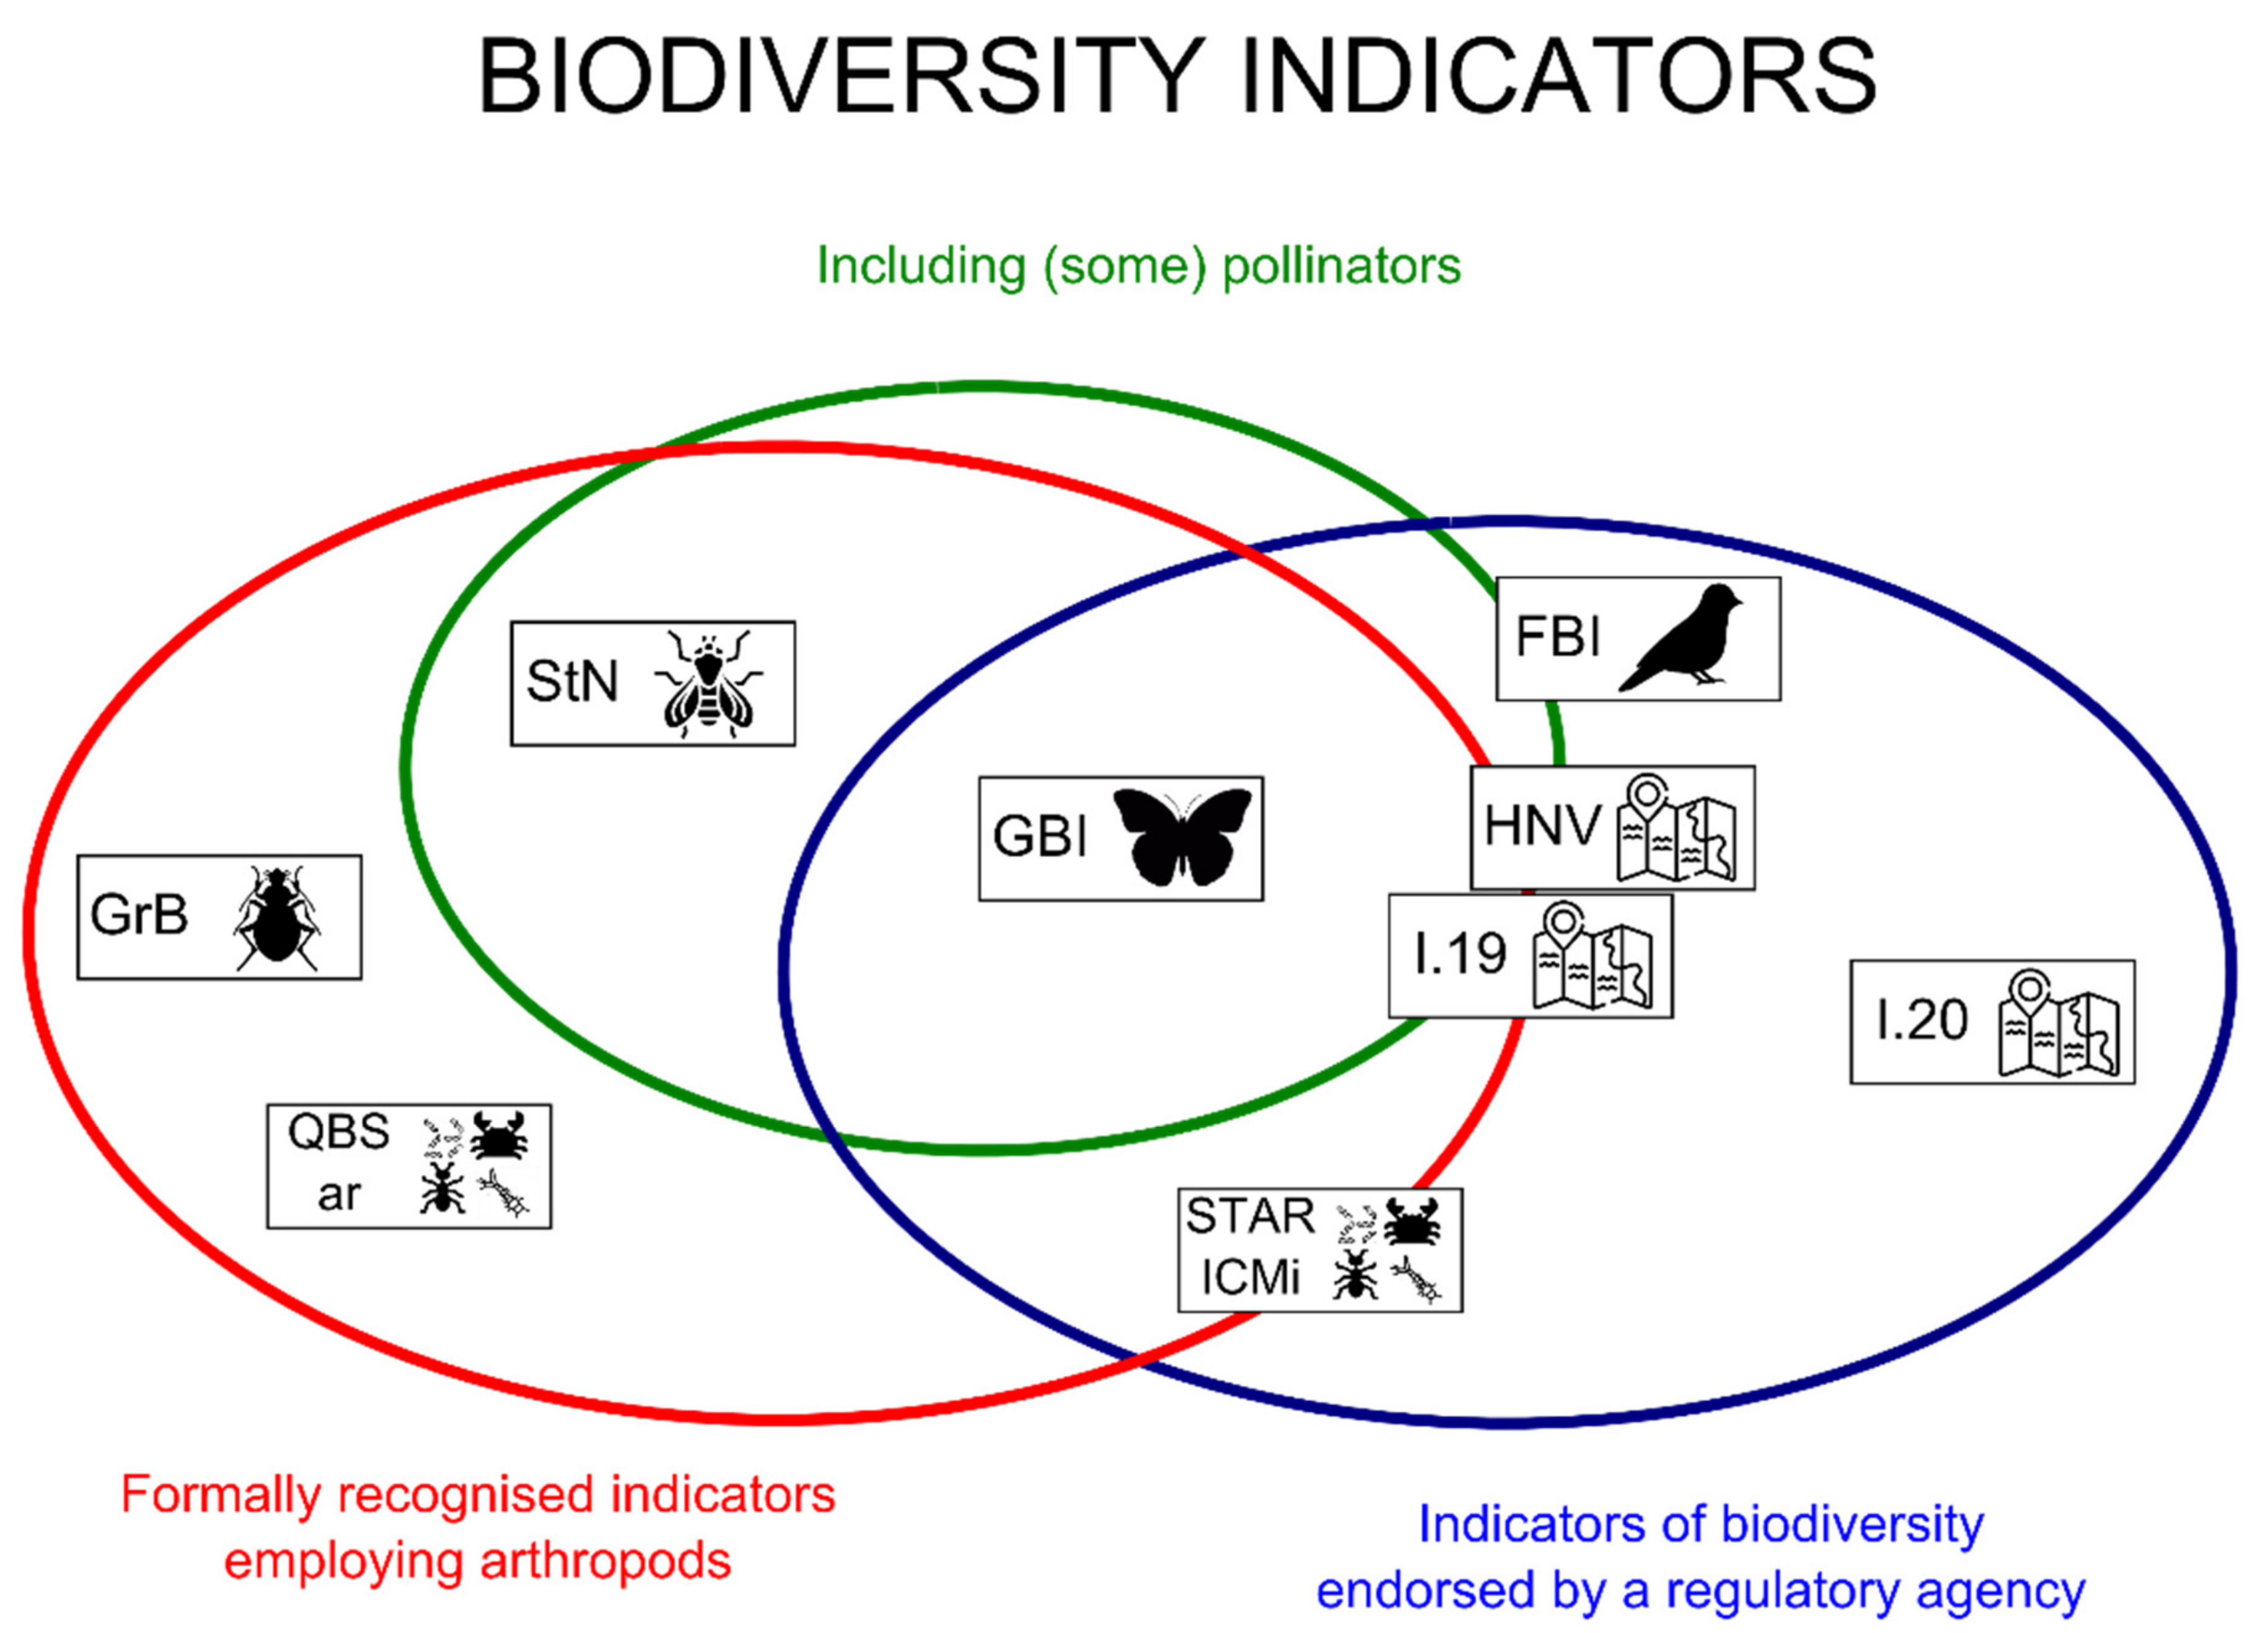
  • Farmland Bird Index (FBI) originates from widespread European monitoring of birds and targets common species more closely connected with agricultural environments. It has been widely used at the European level [23] and applied differently in various CAP proposals, until the recent CAP post-2020 [1,2]. In CAP 2014–2020 [3], it was incorporated as an impact indicator (I.08) and as a context indicator (C.35). In proposed CAP post-2020 [1,2] it is retained as an impact indicator (I.18). At the Italian level, data begins from the period 2000–2005 with a report linked to national rural development plans 2007–2013 [23].
  • High Nature Value Farming (HNV) is related to the concept that European low intensity farming systems contribute more to the preservation of biodiversity. However, development of an indicator proved difficult, since HNV applies to totally different landscapes in different countries, and the results were contradictory. HNV was applied until CAP 2014–2020 [3]. Like FBI, it was incorporated as an impact indicator (I.09) and as a context indicator (C.37) in CAP 2014–2020 but will be discontinued.
  • CAP post-2020 I.19 (I.19) is a newly introduced indicator [1,2], expected to enhance biodiversity protection. It is based on species and habitats and their trends. No technical information is yet available.
  • CAP post-2020 I.20 (I.20) is a newly introduced indicator [1,2], expected to enhance provision of ecosystem services. It refers to the share of UAA with given landscape features. No technical information is yet available.
  • Grassland Butterfly Index (GBI) is based on European species trends and, when applied at the European level, on supranational species trends [24]. Different European countries started monitoring in a random way, some in just a few regions/areas, the oldest data being collected in the UK in 1976. Italy started monitoring recently as part of the pilot project ABLE (Assessing Butterflies in Europe; [25]) and the data collected are still preliminary. GBI is mentioned in the Strategic Plan 2020–2024 of the DG Environment as an indicator of result (2.2; [26]).
  • Freshwater macrobenthos index (STAR ICMi) has a complex name because it is the product of the transnational project, STAR (Standardisation of river classifications: Framework method for calibrating different biological survey results against ecological quality classifications to be developed for the Water Framework Directive; [27]). It includes multimetric indexes (normalized and weighted metrics) concerning the fresh water macrobenthos. In Italy, this indicator has been studied by ISPRA that prepared a technical handbook [28]. Italian legislation started by incorporating some water monitoring parameters [21] but now also includes this indicator [29].
  • Soil Macrobenthos Index (QBS-ar) is based on the functional traits of all organisms that have developed morphofunctional structures to live in soil. Convergence of characters is therefore expected and is the point of focus. The environment is soil, and the organisms are various arthropods in their adult and larval stages. This indicator is applied at the regional level in Italy and has been described in detail by ARPA Piedmont (Agenzia Regionale per la Protezione Ambientale; [30]). To our knowledge, it has not yet been included in European monitoring or indicators.
  • “Syrph the Net” (StN) is a large database proposed to evaluate ecosystems on the basis of the presence of syrphid flies in relation to what is to be expected in a given environment (based on CORINE and EUNIS systems). Martin Speight has been the promoter of the site and the system. Syrphids are potentially very good bioindicators due to their many species and adaptations, relatively easy identification and stable taxonomy. In Italy, ISPRA prepared a manual [15] with indications on how to collect and evaluate data.
  • “Ground Beetle Index” (GrB): Carabids are frequently used to indicate habitat alterations, since the species are expected to react to disturbance according to whether they have generalist or specialist lifestyles. Carabid beetles are well known taxonomically and ecologically and have been used widely in different studies. Their use has also been criticized (reviewed in [31]). In Italy, they are employed for regional biodiversity assessment, especially by national environment protection agencies who have also prepared a technical handbook [32].

3.2. Selected Indicators: Details

Details of our analysis of the indicator parameters follow and are summarized in Table 1.
1. Taxonomic groups. Among the nine indexes/indicators, we found almost all taxa of pollinators active at temperate latitudes. We considered the taxa of pollinators included in the recent EU guidelines on pollinator monitoring [16]: e.g., bees, butterflies, flies and beetles. GBI, HNV and I.19 focus on butterflies; StN and I.19 include hoverflies (the full list has not yet been completed; [33]) and I.19 also includes bees. Only a few species of beetles are recognized as pollinators, and they are currently not considered in any indicator (GrB focuses on ground-living species). Pollinators are rarely included, and not all groups are considered in the same indicator or at the same taxonomic level. The only exception could be I.19, though it only includes threatened species. The indicators incorporating butterflies and hoverflies include all species at the species level since knowledge of these groups is good.
Birds are the only vertebrates that emerged among existing indicators. We have already mentioned their role in agroecosystems. At temperate latitudes, few cases of ornithophilous pollination have been documented [34]. There have been occasional reports of birds feeding on flower nectar [35]. The ecological importance of bird–flower visitation in Europe is still uncertain, especially for plant reproductive output; however, effective pollination has been confirmed for several native and exotic plant species [36,37].
2. Monitoring type. Monitoring can be: (a) based on international monitoring (FBI, STAR-ICMi and GBI), (b) based on cartographic analysis, especially the Geographical Information System—GIS (HNV, I.19, I.20), or (c) the output of local sampling (QBS-ar, StN, GrB).
FBI, GBI and STAR-ICMi are based on monitoring programs defined by the European Bird Census Council (EBCC), the European Butterfly Monitoring Scheme (eBMS) and Directive 2000/60/EC, respectively. These schemes are supervised by European agencies but carried out directly and independently by each European country. They occur at constant intervals, yearly for FBI and GBI and every 5 years for STAR ICMi (which includes repetition over the course of the year). FBI and GBI collect information on any available species, but few are used to discuss trends. Instead, STAR ICMi considers the macroinvertebrate population of given stretches of river. FBI monitoring uses specific 50 km2 grids, where trained observers report all records of visual recognition or birdsong; in the absence of major impediments, monitoring will be replicated at the same site in future years. The Italian regulation for the application of STAR ICMi includes all water stands, while for GBI there is no predefined grid to follow and not all grasslands are monitored. Other indicators are based on local sampling in relation to similar situations from the literature (QBS-ar, StN, GrB). In some cases, such as StN, the data of all studies using the same methods are constantly updated, thus increasing the efficacy of comparison with an expected population. The database is not linked to any national agency and does not require external funds. Contributions to the database are voluntary, and no study is funded by StN. However, even without funding, the abundance of data contributed by volunteers helps to complete the overall geographic or habitat information. QBS-ar values are interpreted on the basis of available literature concerning a given pollutant, but no dataset including the entire literature is available as in the case of StN. In Italy, CREA, ISPRA, University of Parma and the private agency Timesis s.r.l. set up a permanent working group on soil science [32]. An aim is to improve application of the index through definition of local values. Finally, GrB can only count on the technical reports of ISPRA that standardize monitoring methods but allow free interpretation of results by external experts.
Table 2 contains examples of various past and current monitoring schemes in Italy.
3. Spatial and habitat context. The spatial context is not usually part of the indicator itself but is included in the process of site selection. The most common cartographic system employed is that of the CORINE Land Cover Project (CLC). GBI and GrB use CLC to identify the areas to monitor, and likewise StN applies the CORINE European Habitat Classification System (for macrohabitats) and the EU Habitats Directive, further describing the microhabitats where syrphid larvae develop. FBI prefers a regular spatial distribution of the sampling sites, geolocated and later classified on the basis of land use and bird classes. STAR ICMi and QBS-ar use different cartographic systems, including CLC and regional ones. STAR ICMi identifies regions characterized by water/climate/rocky features. QBS-ar is especially linked to soil and pedoclimatic features: a level of detail (fourth level of CLC) would ideally be necessary, but it is not available for all areas. In a few cases or for certain studies (HNV and I.20), other cartographic systems are used, such as those of protected areas (Natura2000) or areas of special interest for certain butterfly or bird species or the threatened species cartography (I.19).
4. Background. Knowing the ecology and biology of target species is very important. I.19 will consider extinction risk, while STAR-ICMi and QBS-ar evaluate morphological adaptations to individual microhabitats. QBS-ar will add adaptation to soil characteristics and sensitivity to pollutants, scored from 0 to 20 (eco-morphological index). StN associates species with their ecological status, assigning a code (blank-3, depending on non-preferred habitat); code 1 allows species association with a habitat when that habitat is linked to another. Syrphid flies, like butterflies, are linked to certain habitats, especially during their larval stage (not mobile), which makes prediction of species assemblages easier. Ground beetles are defined as generalist or specialist (GrB): Detailed knowledge of their diet and mobility can help define habitat alterations. Extensive knowledge of the ecological needs of different species allows selection of flag species that may provide information about the characteristics of an environment and the content of other more common species linked to it. An example is GBI, based on 10 generalist and seven specialist species that provide clues to the potential presence of about another 100 butterflies.
5. Sampling effort and taxonomic identification. Sampling effort is established by monitoring protocols, while taxonomic identification can be carried out in the field or in the laboratory. EBCC monitoring plans include a different pool of bird species in each country (233 nesting species in Italy, although we only have enough information for the indicator in the case of 99 species). eBMS investigates 435 European butterfly species, identified at the species level directly in the field. Both are coordinated and supervised by regulatory agencies through the work of thousands of trained professional and volunteer workers. An opposite situation is that of samplings that require microscope identification in the laboratory: STAR-ICMi at family level, QBS-ar at order level and StN and GrB at the species level. QBS-ar not only identifies the order but creates 29 morpho-functional groups that couple different orders or distinguish adult and larval stages. The implementation of the citizen science (the involvement of the public/volunteers—citizen scientists—in scientific surveys) is emerging as a key to successful monitoring programs [38], which develop support materials often translated into different languages and adapted to local/regional fauna. However, this may influence the level of identification that can be reached, depending on the complexity provided by the different target organisms.
Finally, another parameter that may vary is the type of data collected: abundance (FBI, GBI, STAR-ICMi), or presence/absence (occupancy) (StN, HNV, I.19, I.20, GrB, QBS-ar).
6. Final output. Indexes usually compare a value with a reference. GBI and FBI apply a population trend (the latter since 1980 in some European countries, since 2000 in Italy). For HNV, I.19 and I.20, the reference is the entire area covered by the administration grid or the farm. It may also be a given local population (StN, STAR ICMi, GrB, FBI). Ideally, the value of the index indicates the disturbance suffered by the environment and recorded by the sampled population. FBI and GBI consider few species, as already mentioned, while StN and GrB consider all species sampled. In some cases, expert opinion is needed to interpret rough data and estimate disturbance (GrB). In other cases, indexes transform the data into a well-defined qualitative scale (STAR-ICMi), or a set of user-friendly values, so that even non-experts can compare results on a national/European basis (QBS-ar and StN).
Some indicators are better employed in association with others that describe the habitat/environment. For example, STAR ICMi helps describe the environment when considered in association with other indicators based on algae, plants and fish; chemical and physical parameters (water, pollutants) or geomorphological features. Physical/chemical parameters are also employed for QBS-ar. FBI can be coupled with the Woodland Bird Index (WBI, evaluating 18 species), All Common Species Index (CSI, 99 species) or birds especially sensitive to phytochemicals (15 widespread species and another six in specific environments). eBMS is working to define indicators for agro-environments and forests, to be coupled with GBI currently available only for grasslands.

4. Discussion

With a view to a future pollinator indicator that could integrate existing ones to survey biodiversity and to direct RDP actions, we assessed past and recent indexes/indicators used for biodiversity assessments. Indicators have become a common tool to evaluate goals, especially at government level [22]. The choice and targeting of indicators are constantly revised. Good examples are the past and current indicators used to monitor biodiversity at the European level (CAP 2014–2020 and CAP post-2020), where FBI has been retained and HNV discarded. While overall international pressure can drive the selection of some indicators, others may be employed at the national level, according to national laws or national mitigation measures to be evaluated. We therefore decided to target nine indexes/indicators applied (developed and endorsed) at the European level, at the national level (Italy) and involving other invertebrates.
Our analysis considered some index/indicator characteristics related to biological and environmental contexts, as well as their practical use. The taxonomic groups considered by the indicator, for example, may span in the entire animal kingdom. However, the indicator must consider the dimension of the employed variable: e.g., insects can be expected to interact with the environment very differently from birds. When considering pollinators, we found that some of them are included in past (HNV) or current (GBI, StN) indicators, or predicted in indicators yet to be defined (I.19). However, not all pollinators’ groups are considered at once. Our goal was restricted to verifying how biodiversity is tackled and to what extent pollinator groups are currently included. We intentionally did not discuss here the complexity of pollinator, the ecosystem service they provide (pollination) and the interplay among these variables and the environmental characteristics (in natural or agricultural systems). For an interested reader, how published literature addresses the topic is clearly reviewed in a very recent paper [39]. The authors underlined the importance of clarifying definitions, the pollination studies’ context and the focus element of the pollination system and concluded by highlighting the need for developing comparable indicators and standardized methods.
Some efforts in the direction of standardization have been made especially concerning cartography. Martin and colleagues [40] synthesized results from 49 studies to investigate how the spatial arrangement of crop fields and associated landscape features (e.g., field margins) impacts arthropods and their functions. Advances in landscape analysis make it possible to optimize descriptions of land/soil use, albeit at different levels of detail, depending on the database used. Proper identification of landscape can no longer be excluded from monitoring plans [41], and this is also currently supported by the number of indicators that include cartographic information (Table 1 and Table 2). Similarly, standardization is important to monitoring. Concerning pollinators, the EU Pollinator Monitoring Scheme [16] is addressing the issue with the contribution of experts in different pollinator groups and from different countries, placing special emphasis on the monitoring plan and procedure through the pilot project SPRING. In Italy, the national BeeNet project replicates a fixed protocol that includes concurrent monitoring of wild bees and plants in 24 agro-environments. Sites were selected in intensive or seminatural ecosystems by landscape analysis using first the standard CLC and then checking on-site actual conditions.
Our analysis highlights two critical points: the background knowledge on the target and the efforts related to sampling and taxonomic identification. For pollinators, the situation is evolving fast. Public interest has increased sharply in recent decades: society is alarmed by pollinator decrease and interested in initiatives to understand the current situation and to sustain pollinator conservation [42]. Our research team participates in the LIFE 4 POLLINATORS project, which applies some specific actions aimed at data collection on pollinators (bees, wasps, hoverflies, beeflies, beetles, butterflies and moths) in various environments. Direct involvement of citizens, students and farmers includes using a web-tool platform for uploading photos of pollinators visiting flowers, participation at “mini-Bioblitzes” in natural parks and application of specific observation protocols in schools, botanical gardens and farms.
Possibly the most interesting result of our survey is the inclusion of citizen science in data collection. Citizen science brings important added value that makes it possible to implement datasets for establishing trends and baselines useful for indexes/indicators of species. Some successful monitoring programs and indicators rely largely on volunteer citizen-science activity, which consists of involving the public (citizen scientists) in scientific surveys [38]. Citizen science is used widely in various fields of natural science, where the data collected are used to monitor species, trace populations, design distribution maps and define conservation and management plans [43]. As mentioned, Hymenoptera are a very complex taxonomic group and their identification may be even more difficult for citizens, due to their small size, many similar species and the lack of easy-to-use identification tools. To overcome this problem, some bee citizen-science projects focus on a single species in relation to the plant pollinated by it. An example is squash bee (Eucera (Peponapis) pruinosa (Say, 1867)) monitoring on cucurbit flowers for impacts of farm management on bee nesting [44]. Other projects rely on a single plant, which is the selected “site” for observations quantifying the pollinator service [45]. Likewise, projects may focus on a single kind of nesting site, such as nest boxes, to limit the number of insects observed to cavity-nesting species [46]. Low taxonomic data quality is generally considered a main limitation to volunteer biodiversity monitoring. However, such data can be highly informative too, if methods and protocols are developed to allow for the inaccuracy of data provided by volunteers in place of experts [47]. Kremen et al. [48] compared the data collected on pollinators at the rank of order and superfamily by citizen scientists and bee specialists, respectively, in 17 sites; a positive correlation was found between the two datasets with regard to the difference in abundance and richness of pollinator groups between sites. The result was consistent, although citizen scientists observed only half the bee groups detected by professional scientists. The few existing citizen-science projects that monitor pollinator biodiversity in a given natural, urban or agronomic ecosystem train citizens to identify bees at a higher taxonomic rank than species, and often pool pollinator species into few easily identifiable groups [48,49]. A way to reduce errors due to misidentification is to employ a “verified method”, in which all observations collected or sent by citizens are verified by experts to increase the accuracy of the data collected [50].
Difficulties in species identification are not the same for all pollinators. Identification of syrphid flies and butterflies is very advanced, as demonstrated by the success of the indicators StN and GBI. Bees are in fact the largest group of pollinators and are also the most difficult to identify [51], due to the large number of species with very different characteristics [51,52] and difficult identification with wide variations in different countries: e.g., in Europe more species live in the Mediterranean area. Regarding identification, some help may soon come from metabarcoding techniques [53]. DNA analyses may enable us to avoid training experts in all taxa, although the support of morphological taxonomy will undoubtedly still be prominent for many years [54].
To conclude, a future pollinator indicator should include: (1) elements that deal with the reduced mobility of pollinators and thus read the landscape; (2) implementation of data collection through citizen science, thus supporting data verification and (3) spot distribution of RDP funding, considering national levels. Actual tools that incorporate information on land use into indicators need to be sharpened to include greater detail. We should also pay attention to the relationship between environmental parameters and the target taxa of pollinators. To overcome the many large gaps in our knowledge of the pollinator biology and ecology of certain species, we suggest broadening the environmental parameters, possibly by building a complex indicator based on several indexes. Among them, those more strictly linked to pollinators should be included (e.g., vegetation type, crops, agricultural practices, climatic context, etc.). In some cases, a reduced number of species could be selected. For example, species sensitive to pesticides can be the main target, or those reacting differently to certain agricultural practices. The ideal approach could be to incorporate information on the abundance and occupancy of sampled species, widening the range of endorsed methodologies.

Author Contributions

Conceptualization, S.A., E.M., M.G. (Manuela Giovanetti); methodology, S.A., E.M., M.G. (Manuela Giovanetti); literature analysis, S.A., E.M., S.F., E.L.Z., M.G. (Marta Galloni); resources M.G. (Marta Galloni), L.B., M.Q.; writing—original draft preparation, S.A., E.M., L.B., M.G. (Marta Galloni), M.G. (Manuela Giovanetti), M.Q.; writing—review and editing, M.G. (Manuela Giovanetti), L.B.; visualization, S.A., E.M., M.G. (Manuela Giovanetti); supervision, M.G. (Manuela Giovanetti), L.B. funding acquisition, L.B., M.Q. All authors have read and agreed to the published version of the manuscript.

Funding

This research was funded by MIPAAF (Ministry for Environment, Land and Sea Protection grants to CREA “Research Centre for Agriculture and Environment) through the project BeeNet 2019–2023 (Italian National Funds under FEASR 2014–2020).

Institutional Review Board Statement

Not applicable.

Data Availability Statement

Not applicable.

Acknowledgments

We are indebted to Antonella Trisorio (CREA “Agricultural Policies and Bioeconomy”) who provided updated information and important material. We also thank the project “LIFE 4 POLLINATORS” (LIFE18 GIE/IT/000755) for support. We finally thanks Helen Ampt, who kindly revised the English spelling and grammar, and four anonymous reviewers for the interesting points they raised and discussed with us.

Conflicts of Interest

The authors have no conflict of interest, and the funders had no role in the design of the study; in the collection, analysis or interpretation of data; in the writing of the manuscript or in the decision to publish the results.

References

  1. European Commission. COM/2018/392 Final. In Proposal for a Regulation of the European Parliament and of the Council Establishing Rules on Support for Strategic Plans to Be Drawn up by Member States under the Common Agricultural Policy (CAP Strategic Plans); European Commission: Brussels, Belgium, 2018; Available online: https://eur-lex.europa.eu/legal-content/EN/TXT/?uri=COM%3A2018%3A392%3AFIN (accessed on 29 July 2021).
  2. European Commission. COM/2018/392 Final—2018/0216 Annexes to the Proposal for a Regulation of the European Parliament and of the Council; European Commission: Brussels, Belgium, 2018. [Google Scholar]
  3. DG Agriculture and Rural Development. Technical Handbook on the Monitoring and Evaluation Framework of CAP 2014–2020; European Commission: Brussels, Belgium, 2017. [Google Scholar]
  4. Keenleyside, C.; Beaufoy, G.; Tucker, G.; Jones, G. High Nature Value Farming throughout EU-27 and Its Financial Support under the CAP; Institute for European Environmental Policy: London, UK, 2014; ISBN 978-92-79-37958-1. [Google Scholar]
  5. Beaufoy, G.; Baldock, D.; Dark, J. The Nature of Farming: Low Intensity Farming Systems in Nine European Countries; Institute for European Environmental Policy: London, UK, 1994; ISBN 1-873906-01-3. [Google Scholar]
  6. Bignal, E.M.; McCracken, D.I. The nature conservation value of European traditional farming systems. Environ. Rev. 2000, 8, 149–171. [Google Scholar] [CrossRef]
  7. Paracchini, M.L.; Petersen, J.E.; Hoogeveen, Y.; Bamps, C.; Burfield, I.; van Swaay, C. High Nature Value Farmland in Europe: An Estimate of the Distribution Patterns on the Basis of Land Cover and Biodiversity Data; EC Joint Research Centre, Institute for Environment and Sustainability: Luxembourg, 2008; ISBN 978-92-79-09568-9. [Google Scholar]
  8. DG Agriculture and Rural Development. The Post-2020 Common Agricultural Policy: Environmental Benefits and Simplification; European Commission: Brussels, Belgium, 2019. [Google Scholar]
  9. Calvi, G.; Campedelli, T.; Tellini Florenzano, G.; Rossi, P. Evaluating the benefits of agri-environment schemes on farmland bird communities through a common species monitoring programme. A case study in northern Italy. Agric. Syst. 2018, 160, 60–69. [Google Scholar] [CrossRef]
  10. Intergovernmental Science-Policy Platform on Biodiversity and Ecosystem Services (IPBES). The Assessment Report of the Intergovernmental Science-Policy Platform on Biodiversity and Ecosystem Services on Pollinators, Pollination and Food Production; Potts, S.G., Imperatriz-Fonseca, V.L., Ngo, H.T., Eds.; Secretariat of the IPBES: Bonn, Germany, 2016; ISBN 978-92-807-3567-3. [Google Scholar]
  11. European Commission. COM/2021/261 final. In Progress in the Implementation of the EU Pollinators Initiative; European Commission: Brussels, Belgium, 2021. [Google Scholar]
  12. European Commission. COM/2020/380 final. In EU Biodiversity Strategy for 2030 Bringing Nature back into Our Lives; European Commission: Brussels, Belgium, 2020. [Google Scholar]
  13. European Parliament. European Parliament Resolution on the EU Pollinators Initiative 2019/2803(RSP); European Parliament: Strasbourg, France, 2019; Available online: https://eur-lex.europa.eu/legal-content/EN/TXT/?uri=CELEX%3A52019IP0104 (accessed on 29 July 2021).
  14. van Swaay, C.A.M.; Dennis, E.B.; Schmucki, R.; Sevilleja, C.G.; Balalaikins, M.; Botham, M.; Bourn, N.; Brereton, T.; Cancela, J.P.; Carlisle, B.; et al. In The EU Butterfly Indicator for Grassland Species: 1990–2017: Technical Report; Butterfly Conservation Europe. 2019; ABLE/eBMS; Available online: www.butterfly-monitoring.net (accessed on 29 July 2021).
  15. Burgio, G.; Sommaggio, D.; Birtele, D. I Sirfidi (Ditteri): Biodiversità e Conservazione; ISPRA, Manuali e Linee Guida 128/2015; ISPRA: Roma, Italy, 2015; ISBN 978-88-448-0743-6.
  16. Potts, S.; Dauber, J.; Hochkirch, A.; Oteman, B.; Roy, D.; Ahnre, K.; Biesmeijer, K.; Breeze, T.; Carvell, C.; Ferreira, C.; et al. Proposal for an EU Pollinator Monitoring Scheme; EUR 30416 EN; Publications Office of the European Union: Luxembourg, 2020; ISBN 978-92-76-23859-1. [Google Scholar]
  17. Ministero dell’Ambiente. Decreto Ministeriale n. 43 del 26 febbraio 2019. In Direttiva Generale Contenente le Priorità Politiche e l’indirizzo per lo Svolgimento Dell’azione Amministrativa e per la Gestione del Ministero dell’Ambiente per l’anno 2019; Ministero dell’Ambiente: Roma, Italy, 2019. [Google Scholar]
  18. ISPRA. Metodi di Campionamento Proposti per L’attuazione dei Progetti per il Monitoraggio e la Tutela Degli Impollinatori nei Parchi Nazionali. Direttiva del Ministero dell’Ambiente 2019; ISPRA, Ministero dell’Ambiente: Roma, Italy, 2019.
  19. LIFE 4 Pollinators—Involving People to Protect Wild Bees and Other Pollinators in the Mediterranean. Available online: https://www.life4pollinators.eu (accessed on 19 September 2021).
  20. Nieto, A.; Roberts, S.P.M.; Kemp, J.; Rasmont, P.; Kuhlmann, M.; García Criado, M.; Biesmeijer, J.C.; Bogusch, P.; Dathe, H.H.; De la Rúa, P.; et al. European Red List of Bees; Publication Office of the European Union: Luxembourg, 2014; ISBN 978-92-79-44512-5. [Google Scholar]
  21. Ministero dell’Ambiente. Decreto Legislativo n. 152 del 3 Aprile 2006; Norme in Materia Ambientale. GU Serie Generale n.88 del 14-04-2006—Suppl. Ordinario n. 96; Ministero Dell’Ambiente: Roma, Italy, 2006.
  22. Wieck, C.; Hausmann, I. Indicators everywhere: The new accountability of agricultural policy? In Proceedings of the 172nd EAAE Seminar “Agricultural Policy for the Environment or Environmental Policy for Agriculture?”, Brussel, Belgium, 28–29 May 2019. [Google Scholar] [CrossRef]
  23. de Carli, E.; Gustin, M.; Rossi, P.; Trisorio, A. Analisi del Farmland Bird Index nel Periodo 2000–2005 e Individuazione dei Fattori Positivi e Negativi per la Specie Agricole Contenuti nei Piani di Sviluppo Rurale 2007–2013; INEA: Roma, Italy, 2009; Available online: http://dspace.inea.it/handle/inea/707 (accessed on 29 July 2021).
  24. European Environment Agency. The European Grassland Butterfly Indicator: 1990–2011; Publications Office of the European Union: Luxembourg, 2013; ISBN 978-92-9213-402-0. [Google Scholar]
  25. Roy, D.B.; Bourn, N.; Collins, S.; Dennis, E.B.; Schmucki, R.; Settele, J.; Sevilleja, C.G.; Van Swaay, C.A.M.; Wynhoff, I. Assessing Butterflies in Europe: Executive Summary; Butterfly Conservation Europe: Wageningen, The Netherlands, 2020. [Google Scholar]
  26. DG Environment. Strategic Plan 2020–2024; European Commission: Brussels, Belgium, 2020; Available online: https://ec.europa.eu/info/publications/strategic-plan-2020-2024-environment_en (accessed on 29 July 2021).
  27. Szoszkiewicz, K.; Zbierska, J.; Staniszewski, R.; Jusik, S.; Zgoła, T.; Kupiec, J. Standardisation of River Classifications: Framework Method for Calibrating Different Biological Survey Results against Ecological Quality Classifications to be Developed for the Water Framework Directive; Deliverable under the STAR project of the 5th Framework Programme Energy, Environment and Sustainable Development, Contract No: EVK1-CT 2001-00089. 2005. Available online: http://www.eu-star.at/ (accessed on 29 July 2021). [CrossRef]
  28. Buffagni, A.; Erba, S.; Archi, F.; Bussettini, M.; Piva, F. Linee Guida per la Valutazione Della Componente Macrobentonica Fluviale ai Sensi del DM 260/2010; ISPRA: Roma, Italy, 2014; ISBN 978-88-448-0645-3. [Google Scholar]
  29. Ministero dell’Ambiente. Decreto n. 260, Dell’ 8 Novembre 2010,; Regolamento Recante i Criteri Tecnici Per la Classificazione Dello Stato dei Corpi Idrici Superficiali, Per la Modifica Delle Norme Tecniche del Decreto Legislativo 3 Aprile 2006, n. 152, Recante Norme in Materia Ambientale, Predisposto ai Sensi Dell’Articolo 75, Comma 3, del Medesimo Decreto Legislativo. Gazzetta Ufficiale Serie Generale n.30 del 07-02-2011—Suppl. Ordinario n. 31; Ministero Dell’Ambiente: Roma, Italy, 2010.
  30. Angelini, P.; Fenoglio, S.; Isaia, M.; Jacomini, C.; Migliorini, M.; Morisi, A. Tecniche di Biomonitoraggio Della Qualità del Suolo; ARPA Piemonte: Torino, Italy, 2002; ISBN 88-7479-003-1. [Google Scholar]
  31. Rainio, J.; Niemelä, J. Ground beetles (Coleoptera: Carabidae) as bioindicators. Biodivers. Conserv. 2003, 12, 487–506. [Google Scholar] [CrossRef]
  32. Brandmayr, P.; Zetto, T.; Pizzolotto, R. I Coleotteri Carabidi per la Valutazione Ambientale e la Conservazione Della Biodiversità; APAT: Roma, Italy, 2005; ISBN 88-448-0152-3. [Google Scholar]
  33. European Red List of Hoverflies. Available online: https://www.iucn.org/regions/europe/our-work/biodiversity-conservation/european-red-list-threatened-species/european-red-list-hoverflies (accessed on 19 September 2021).
  34. Ortega-Olivencia, A.; Rodríguez-Riaño, T.; Valtueña, F.J.; López, J.; Devesa, J.A. First confirmation of a native bird-pollinated plant in Europe. Oikos 2005, 110, 578–590. [Google Scholar] [CrossRef]
  35. Schwilch, R.; Mantovani, R.; Spina, F.; Jenni, L. Nectar consumption of warblers after long-distance flights during spring migration. Ibis 2008, 143, 24–32. [Google Scholar] [CrossRef]
  36. da Silva, L.P.; Ramos, J.A.; Olesen, J.M.; Traveset, A.; Heleno, R.H. Flower visitation by birds in Europe. Oikos 2014, 123, 1377–1383. [Google Scholar] [CrossRef]
  37. Jaca, J.; Nogales, M.; Traveset, A. Reproductive success of the Canarian Echium simplex (Boraginaceae) mediated by vertebrates and insects. Plant Biol. 2019, 21, 216–226. [Google Scholar] [CrossRef]
  38. Kullenberg, C.; Kasperowski, D. What Is Citizen Science?—A Scientometric Meta-Analysis. PLoS ONE 2016, 11, e0147152. [Google Scholar] [CrossRef] [Green Version]
  39. Bartholomée, O.; Lavorel, S. Disentangling the diversity of definitions for the pollination ecosystem service and associated estimation methods. Ecol. Indic. 2019, 107, 105576. [Google Scholar] [CrossRef]
  40. Martin, E.A.; Dainese, M.; Clough, Y.; Báldi, A.; Bommarco, R.; Gagic, V.; Garratt, M.P.D.; Holzschuh, A.; Kleijn, D.; Kovács-Hostyánszki, A.; et al. The interplay of landscape composition and configuration: New pathways to manage functional biodiversity and agroecosystem services across Europe. Ecol. Lett. 2019, 22, 1083–1084. [Google Scholar] [CrossRef] [Green Version]
  41. Giovanetti, M.; Albertazzi, S.; Flaminio, S.; Ranalli, R.; Bortolotti, L.; Quaranta, M. Pollination in Agroecosystems: A Review of the Conceptual Framework with a View to Sound Monitoring. Land 2021, 10, 540. [Google Scholar] [CrossRef]
  42. Schatz, B.; Maxime, D.; Mickael, H.; Benoît, G.; Fabrice, A.; Colette, S.; Maxence, G.; Michez, D. Pollinator conservation in the context of global changes with a focus on France and Belgium. Acta Oecol. 2021, 112, 103765. [Google Scholar] [CrossRef]
  43. Frigerio, D.; Richter, A.; Per, E.; Pruse, B.; Vohland, K. Citizen Science in the Natural Sciences. In The Science of Citizen Science; Vohland, K., Land-zandstra, A., Ceccaroni, L., Lemmens, R., Perelló, J., Ponti, M., Samson, R., Wagenknecht, K., Eds.; Springer: Cham, Switzerland, 2021; ISBN 978-3-030-58277-7. [Google Scholar] [CrossRef]
  44. Appenfeller, L.R.; Lloyd, S.; Szendrei, Z. Citizen science improves our understanding of the impact of soil management on wild pollinator abundance in agroecosystems. PLoS ONE 2020, 15, e0230007. [Google Scholar] [CrossRef] [PubMed] [Green Version]
  45. Birkin, L.; Goulson, D. Using citizen science to monitor pollination services. Ecol. Entomol. 2015, 40, 3–11. [Google Scholar] [CrossRef] [Green Version]
  46. Bloom, E.H.; Crowder, D.W. Promoting data collection in pollinator citizen science projects. CSTP 2020, 5, 1–12. [Google Scholar] [CrossRef] [Green Version]
  47. Schmeller, D.S.; Henry, P.-Y.; Julliard, R.; Gruber, B.; Clobert, J.; Dziock, F.; Lengyel, S.; Nowicki, P.; Déri, E.; Budrys, E.; et al. Advantages of volunteer-based biodiversity monitoring in Europe. Conserv. Biol. 2009, 23, 307–316. [Google Scholar] [CrossRef]
  48. Kremen, C.; Ullman, K.S.; Thorp, R.W. Evaluating the quality of citizen-scientist data on pollinator communities. Conserv. Biol. 2011, 25, 607–617. [Google Scholar] [CrossRef]
  49. Ullman, K.M.; Vaughan, M.; Kremen, C.; Shih, T.; Shepherd, M. California Pollinator Project: Citizen Scientist Pollinator Monitoring Guide; The Xerces Society for Invertebrate Conservation: Portland, OR, USA, 2010. [Google Scholar]
  50. Gardiner, M.M.; Allee, L.L.; Brown, P.M.; Losey, J.E.; Roy, H.E.; Smyth, R.R. Lessons from lady beetles: Accuracy of monitoring data from US and UK citizen-science programs. Front. Ecol. Environ. 2012, 10, 471–476. [Google Scholar] [CrossRef] [Green Version]
  51. Zurbuchen, A.; Landert, L.; Klaiber, J.; Müller, A.; Hein, S.; Dorn, S. Maximum foraging ranges in solitary bees: Only few individuals have the capability to cover long foraging distances. Biol. Conserv. 2010, 143, 669–676. [Google Scholar] [CrossRef]
  52. De Palma, A.; Kuhlmann, M.; Roberts, S.P.M.; Potts, S.G.; Börger, L.; Hudson, L.N.; Lysenko, I.; Newbold, T.; Purvis, A. Ecological traits affect the sensitivity of bees to land-use pressures in European agricultural landscapes. J. Appl. Ecol. 2015, 52, 1567–1577. [Google Scholar] [CrossRef] [Green Version]
  53. Ratnasingham, S.; Hebert, P.D. BOLD: The Barcode of Life Data System (http://www.barcodinglife.org). Mol. Ecol. Notes 2007, 7. [Google Scholar] [CrossRef] [Green Version]
  54. Wägele, H.; Klussmann-Kolb, A.; Kuhlmann, M.; Haszprunar, G.; Lindberg, D.; Koch, A.; Wägele, J.W. The taxonomist—An endangered race. A practical proposal for its survival. Front. Zool. 2011, 8, 25. [Google Scholar] [CrossRef] [PubMed] [Green Version]
Figure 1. Relative position of selected indicators when considering their recognition and/or endorsement in current legislations (national and/or international). In the green circle fall those indicators including (at least some) groups of pollinators. This image has been designed using resources from Flaticon.com (authors of icons: Freepik, Eucalyp, Darius Dan, surang, geotatah).
Diversity 13 00477 g001
Table 1. Main characteristics of the nine indicators. For STAR ICMi, various indicates Anellida, Arthropoda, Bryozoa, Cnidaria, Mollusca, Nematoda, Nemertea, Porifera, Rotatoria, Platyhelminthes; for QBS-ar, various indicates Arachnida, Chilopoda, Diplopoda, Insecta, Malacostraca, Pauropoda, Symphyla.
Index/IndicatorTaxonomic GroupsMonitoring TypeSpatial/Habitat ContextFinal Output
TaxaPollinators Included?FrequencyOngoing Monitoring Plans Type of DataType of Output
FBIAvesnot in temperate areasregular (annual schedule)yes,
European
regionalspecies abundanceratio
HNVAves, Insectayes,
butterflies
regular (but depending on cartographic system updates)depending on cartography employedregional/local% arearatio
I.19any endangered living speciesyes,
butterflies, syrphid flies, Apoidea
regular (but depending on cartographic system updates)depending on cartography employedregional/local% arearatio
I.20 noregular (but depending on cartographic system updates)depending on cartography employedregional/local% arearatio
STAR ICMivariousnoregular (every 5 years, with 3–4 replicates during the year of monitoring)yes,
European
portion of habitatsabundance or presence/absenceclasses
GBIInsecta (Lepidoptera)yes,
butterflies
regular (annual schedule)yes,
European
codified habitatsabundanceratio
QBS-arvariousnospot (local sampling)nolocalpresence/absenceratio/classes
StNSyrphidaeyes,
syrphid flies
spot (local sampling)nolocalpresence/absenceratio
GrBCarabidaenospot (local sampling)nolocalabundancedescriptive
Table 2. Past and ongoing monitoring in Italy; distribution maps obtained from different sources as reported.
Diversity 13 00477 i001 Diversity 13 00477 i002 Diversity 13 00477 i003
Example of distribution of monitoring sites for birds in Italy. Each dot indicates an agroecosystem site (10 × 10 km) where records have been taken for more (red) or less (yellow dots) than 11 years. The image (slightly modified) can be found in a national report under various authors (professional and volunteer) who collaborated with Lega Italiana per la Protezione degli Uccelli (LIPU) on the project MITO2000. The report is freely available at https://www.reterurale.it/flex/cm/pages/ServeBLOB.php/L/IT/IDPagina/22311 (accessed on 29 July 2021). Reference: Rete Rurale Nazionale & LIPU (2021) Farmland Bird Index nazionale e andamenti di popolazione delle specie in Italia nel periodo 2000–2020. p. 11Example of distribution of monitoring sites for butterflies in Italy. The image can be found at https://butterfly-monitoring.net/it/mydata (accessed on 29 July 2021) (base map and data from OpenStreetMap and OpenStreetMap Foundation) and is regularly updated. The version shown was downloaded on 29 July 2021. Each dot represents a transect set up by professional or volunteer workers; data are transferred to the site and corresponding database by Butterfly Conservation Europe and the Centre for Ecology & Hydrology.Example of distribution of monitoring sites for wild bees in Italy. Site selection was by the ongoing project BeeNet, in which the authors are directly involved. The sites are situated in agroecosystems, intensive and seminatural, monitored once a month by experts in 11 Italian regions.
Publisher’s Note: MDPI stays neutral with regard to jurisdictional claims in published maps and institutional affiliations.

