
The Influence of Climate Change on Three Dominant Alpine Species under Different Scenarios on the Qinghai–Tibetan Plateau


1
College of Geosciences, Qinghai Normal University, Xining 810008, China
2
Key Laboratory of Remote Sensing of Gansu Province, Northwest Institute of Eco-Environment and Resources, Chinese Academy of Sciences, Lanzhou 730000, China
3
College of Life Sciences, Qinghai Normal University, Xining 810008, China
4
Chengdu Institute of Biology, Chinese Academy of Sciences, Chengdu 610041, China
5
Earth Sciences College, Chengdu University of Technology, Chengdu 610059, China
*
Authors to whom correspondence should be addressed.
Diversity 2021, 13(12), 682; https://0-doi-org.brum.beds.ac.uk/10.3390/d13120682
Submission received: 1 December 2021
/
Revised: 13 December 2021
/
Accepted: 14 December 2021
/
Published: 19 December 2021
(This article belongs to the Special Issue Mountain Biodiversity, Ecosystem Functioning and Services)
Abstract
:The Qinghai–Tibetan Plateau (QTP) with high altitude and low temperature is one of the most sensitive areas to climate change and has recently experienced continuous warming. The species distribution on the QTP has undergone significant changes especially an upward shift with global warming in the past decades. In this study, two dominant trees (Picea crassifolia Kom and Sabina przewalskii Kom) and one dominant shrub (Potentilla parvifolia Fisch) were selected and their potential distributions using the MaxEnt model during three periods (current, the 2050s and the 2070s) were predicted. The predictions were based on four shared socio-economic pathway (SSPs) scenarios, namely, SSP2.6, SSP4.5, SSP7.0, SSP8.5. The predicted current potential distribution of three species was basically located in the northeastern of QTP, and the distribution of three species was most impacted by aspect, elevation, temperature seasonality, annual precipitation, precipitation of driest month, Subsoil CEC (clay), Subsoil bulk density and Subsoil CEC (soil). There were significant differences in the potential distribution of three species under four climate scenarios in the 2050s and 2070s including expanding, shifting, and shrinking. The total suitable habitat for Picea crassifolia shrank under SSP2.6, SSP4.5, SSP7.0 and enlarged under SSP8.5 in the 2070s. On the contrary, the total suitable habitat for Sabina przewalskii enlarged under SSP2.6, SSP4.5, SSP7.0 and shrank under SSP8.5 in the 2070s. The total suitable habitat for Potentilla parvifolia continued to increase with SSP2.6 to SSP8.5 in the 2070s. The average elevation in potentially suitable habitat for Potentilla parvifolia all increased except under SSP8.5 in the 2050s. Our study provides an important reference for the conservation of Picea crassifolia, Sabina przewalskii, Potentilla parvifolia and other dominant plant species on the QTP under future climate change.
1. Introduction
Climate change is considered to be one of the most important driving factors of species distribution [1,2,3] According to the report of the sixth Coupled Model Intercomparison Project (CMIP6), the global temperature will continue to increase by the end of the 21st century [4]. The Qinghai–Tibetan Plateau (QTP), famous as the “third pole” in the world with high altitude and low temperature, is one of the most sensitive regions to climate change [5]. With global warming, many species shift their suitable habitats especially upward in altitude in order to adapt to changes in environmental conditions [6,7].
However, it remains unclear what influences climate change will have on alpine species at large regional scales and whether alpine species respond uniformly on the QTP. Two dominant and representative alpine trees (Picea crassifolia Kom, Sabina przewalskii Kom) and one dominant and representative alpine shrub (Potentilla parvifolia Fisch) on the QTP were used in this study, Picea crassifolia favors shady slopes, semi-shady slopes and humid valleys in the mountains with an altitude of 1750–3100 m (a.s.l), is endemic to China, and is distributed in the Qilian Mountains, Qinghai, Gansu, Ningxia, Inner Mongolia. Sabina przewalskii grows on sunny slopes of 2600–4000 m (a.s.l), is endemic to China, and is distributed in Qinghai, Gansu Hexi Corridor, and the north of Sichuan. Potentilla parvifolia favors dry hillside, rock crack, forest edge and forest with an altitude of 900–5000 m (a.s.l), and it is distributed in Heilongjiang, Inner Mongolia, Gansu, Qinghai, Sichuan and Tibet in China. Species on shady slopes are more sensitive to the magnitude of temperature fluctuations, and species on sunny slopes can tolerate larger temperature fluctuations [8]. The previous study was conducted on potential distribution for Picea crassifolia, Sabina przewalskii and Potentilla parvifolia, but they only focused on the potential distribution under different climate scenarios without considering the influence of geographical factors [9].
Species distribution models are popular methods in modeling the potential distributions of species in response to climate change in the past few decades [10]. Many species distribution models are used to predict potential distributions, such as maximum entropy (MaxEnt) [11]), random forests (RFs) [12], CLIMEX, and genetic algorithm for rule set production (GARP) [13]. Among them, MaxEnt is widely selected because it performs excellently with a small number of sample records compared to other models [14]. This research used MaxEnt to predict potential distribution for three species under different shared socio-economic pathways (SSPs) scenarios.
SSPs can be selected to predict greenhouse gas emission scenarios under different climate conditions [15]. SSPs consider the effects of land use and socio-economic with the development of regional climate change and are different from representative concentration pathways (RCPs) [16]. SSPs have a higher beginning point than RCP and the result of prediction is near to the true value [17]). SSP2.6 (Low forced scenario), SSP4.5 (Medium forced scenario), SSP7.0 (Medium-high forced scenario), SSP8.5 (High forced scenario) were selected to predict the potential distribution of three species during the period of the 2050s and 2070s in this study.
The aims of this research are: (1) to predict the potential distribution of three species under different climate scenarios; (2) to assess the key environment variables affecting the distribution of three species; (3) to analyze the area and elevation changes of the suitable habitat of three species in the future climate change. The results of this study will provide an important reference for the conservation of Picea crassifolia, Sabina przewalskii, Potentilla parvifolia and other dominant plant species on the QTP under climate change.
2. Materials and Methods
2.1. Study Area
The Qinghai–Tibetan Plateau (QTP), located in western China, is famous as the “Roof of the World” with the highest and one of the most extensive plateaus on earth [18], It lies between 26° N to 39° N and 73° E to 104° E, and covers a total area of approximately 2.5 million km2 with an average elevation above 4000 m (a.s.l). Alpine desert ecosystems, alpine meadow, alpine grassland, shrub and forest are distributed from the southwestern to the northeastern of QTP, which is characterized by low annual temperature differences, high daily temperature differences, low air temperature and strong solar radiation [19]). Climate change probably affect species on the QTP more than those in other regions with the same latitude [20,21]).
2.2. Occurrence Data
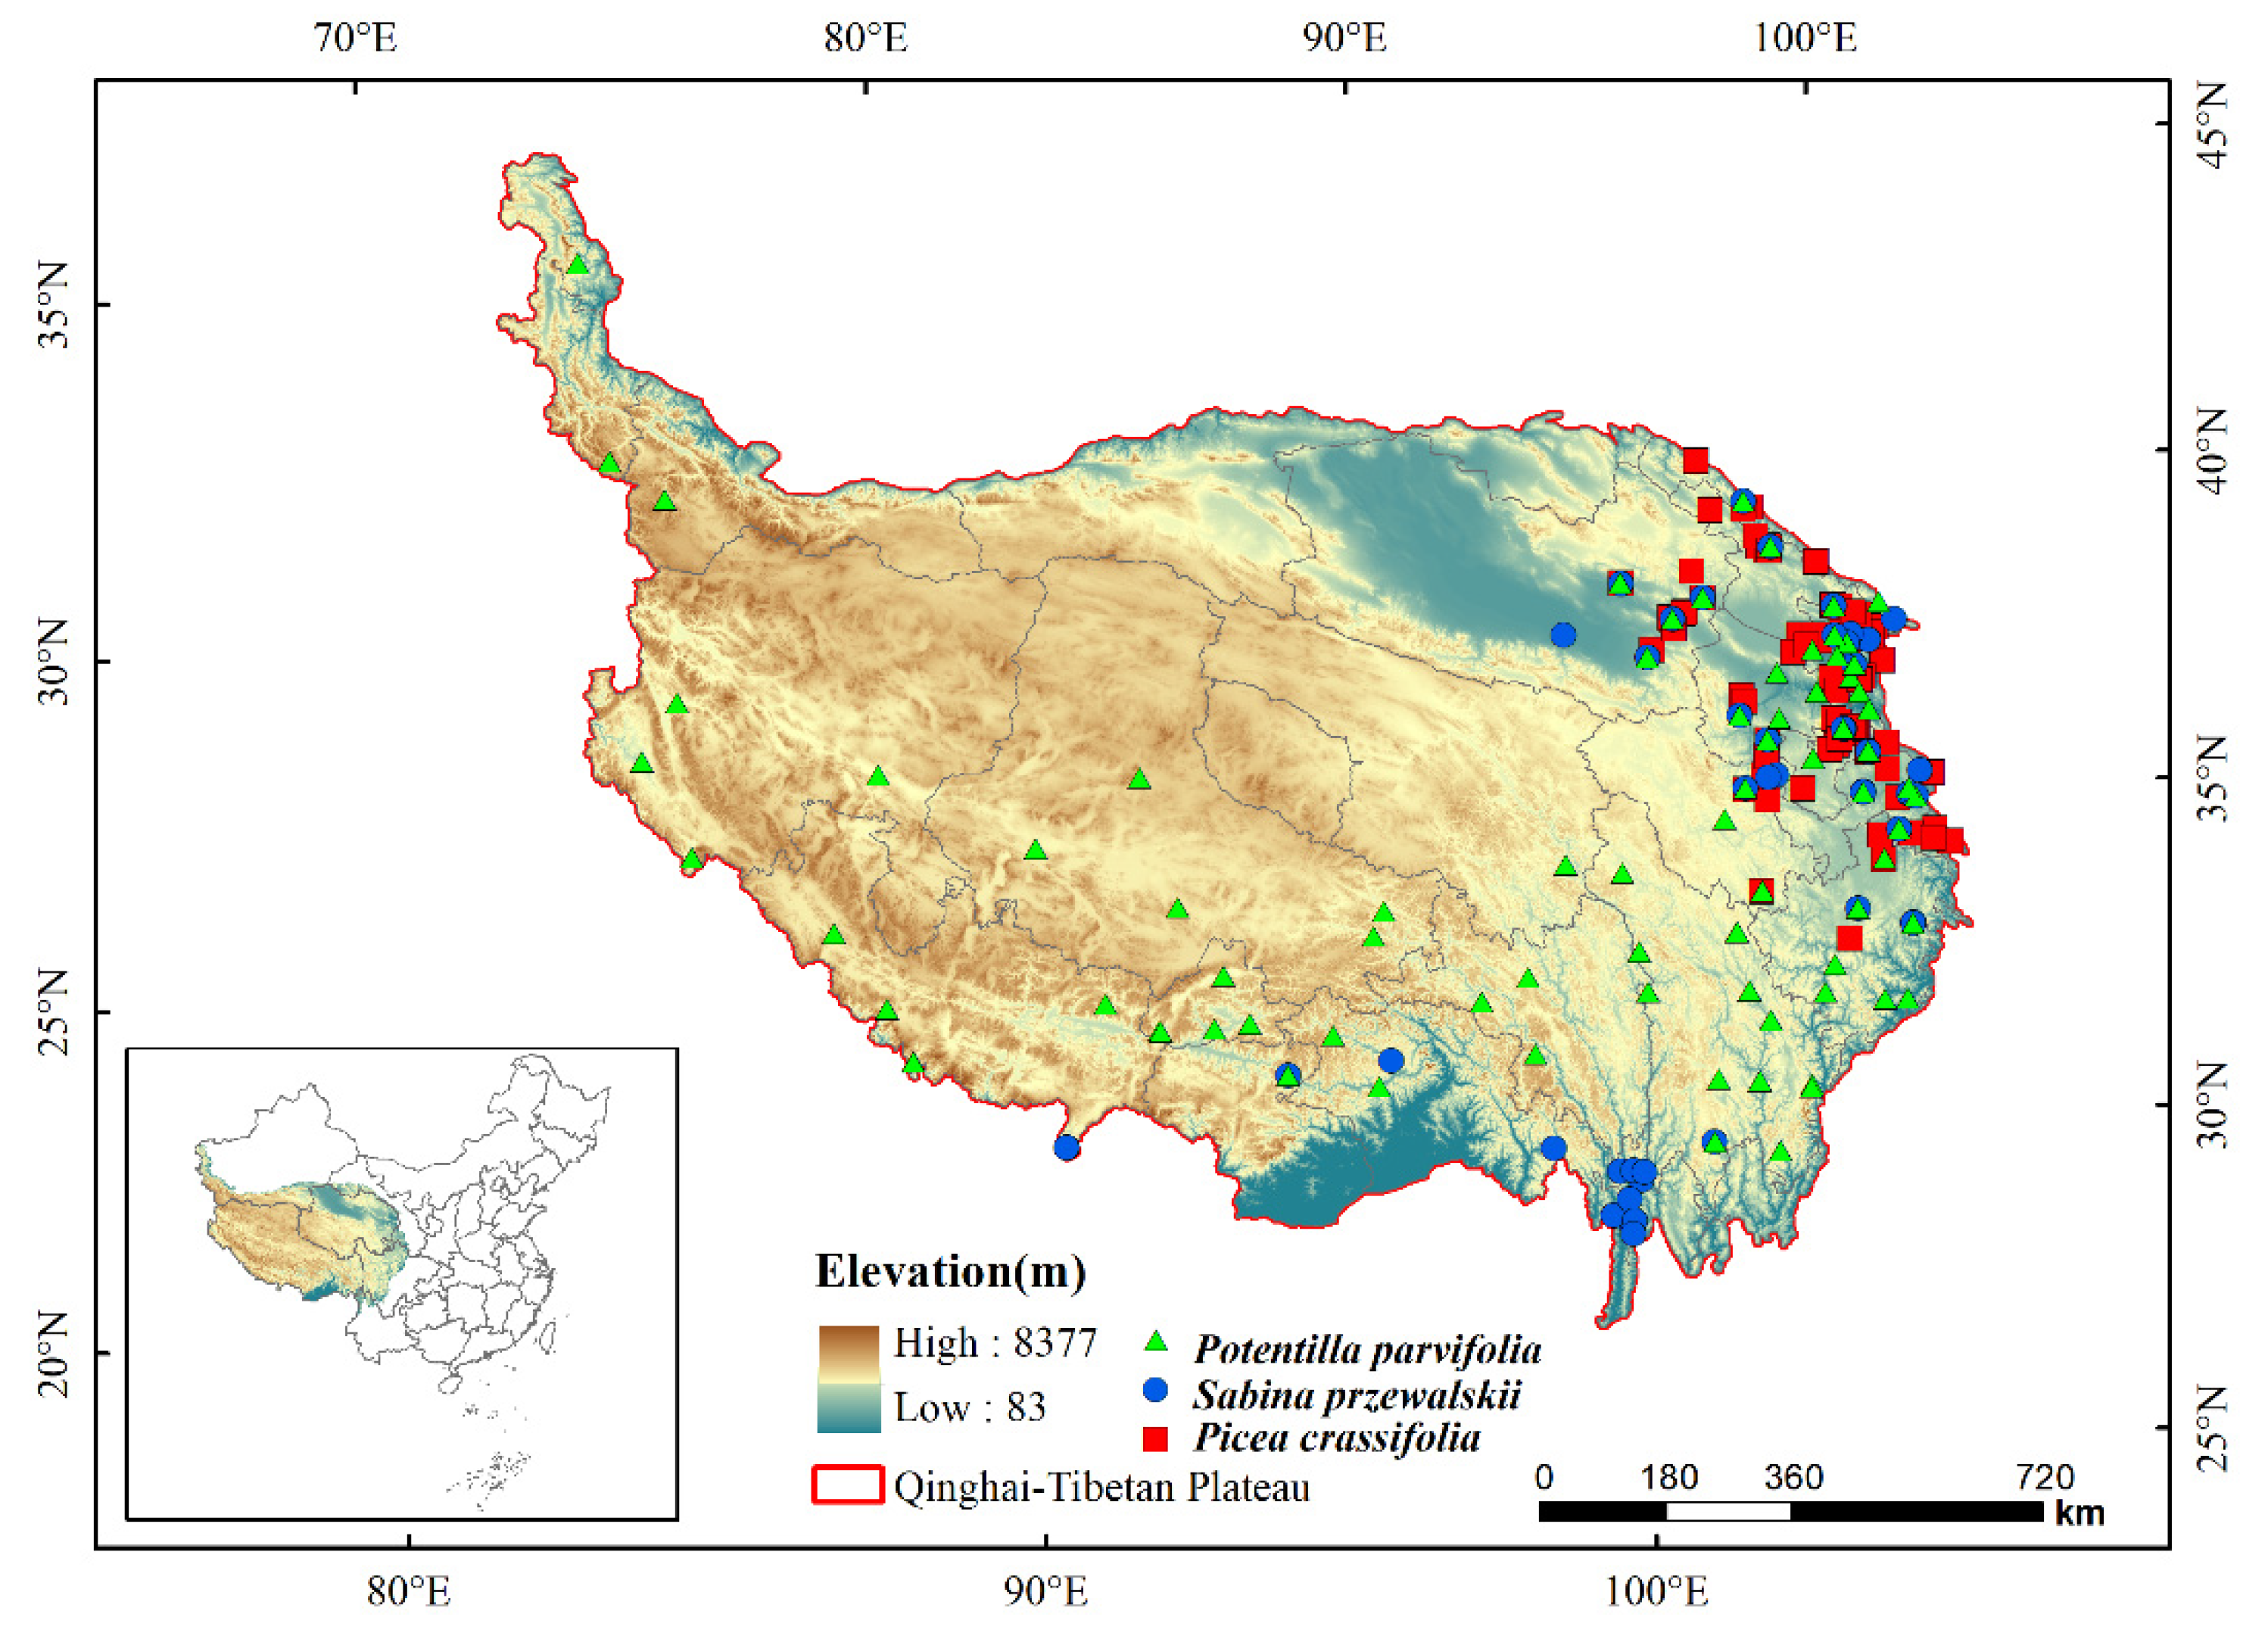
As the accurate location information of species distribution is the basis of high precision simulation and prediction, the geographical distribution information of Picea crassifolia, Sabina przewalskii and Potentilla parvifolia were obtained from: (1) Chinese Virtual Herbarium (CVH, https://www.cvh.ac.cn/, accessed on 23 September 2021); (2) Global Biodiversity Information Facility (GBIF, http://www.gbif.org/, accessed on 24 September 2021); (3) Relevant literature reports (CNKI, Web of Science, https://www.cnki.net/ https://0-apps-webofknowledge-com.brum.beds.ac.uk/, accessed on 15 November 2021). Google Earth (http://ditu.google.cn/, accessed on 22 November 2021) was used to proofread specimen distribution information and the duplicate records were removed [22]. Finally, the 172 records of Picea crassifolia distribution data, 69 records of Sabina przewalskii distribution data and 146 records of Potentilla parvifolia distribution data were used (Figure 1). The longitude and latitude of the distribution data and the species name were entered into Excel and converted to csv format for modeling.
2.3. Environment Variables
2.3.1. Climate Data
The data used for climate assessment were downloaded from the WorldClim global climate database [23] (http://www.worldclim.org, accessed on 15 November 2021).
Current climate data included 19 Bioclimatic variables with 30” spatial resolution during 1970–2000 [24], which reflect temperature and precipitation.
Future Bioclimatic data were obtained from BCC_CSM1.1 (Beijing Climate Center, China Meteorological Administration, Beijing, China) global circulation model) [8]), which is available for predicting the global climate response to increasing greenhouse gas concentration [22]). Bioclimatic data (at 2.5′ spatial resolution) for four scenarios of Shared Socioeconomic Pathways (SSPs) provided by the sixth Coupled Model Intercomparison Project (CMIP6) were used for modeling [25]). Each SSP includes scenarios of SSP2.6, SSP4.5, SSP7.0, SSP8.5, and analyses the spatial and temporal changes of the annual temperature and precipitation during 2021–2100 [26]). The future climate variables were resampled to the same spatial resolution with current data using ArcGIS 10.7 [27]).
2.3.2. Topographic Data
The DEM data with a cell size of 90 m × 90 m were downloaded from the WIST geodatabase of NASA (http://srtm.csi.cgiar.org/, accessed on 15 November 2021). The variables of slope, aspect and elevation were derived from DEM using ArcGIS 10.7.
2.3.3. Soil Property Data
Soil data used in this study were collected from Harmonized World Soil Database (HWSD, http://www.fao.org/soils-portal, accessed on 15 November 2021).
2.3.4. Processing and Selection of Environment Variables
All environment variables were resampled to 30” spatial resolution and were processed to the same geographic bounds. In the modeling process, high correlation variables and environment variables that contribute less to the model were removed to improve the accuracy of the model [28,29]. The correlation coefficient was calculated to account for the influence of collinearity on the model accuracy. The variables with r below 0.8 were selected [30]. The 16 variables with low correlation coefficients and high contribution rates were selected for distribution modeling (Table 1).
2.4. Distribution Modeling
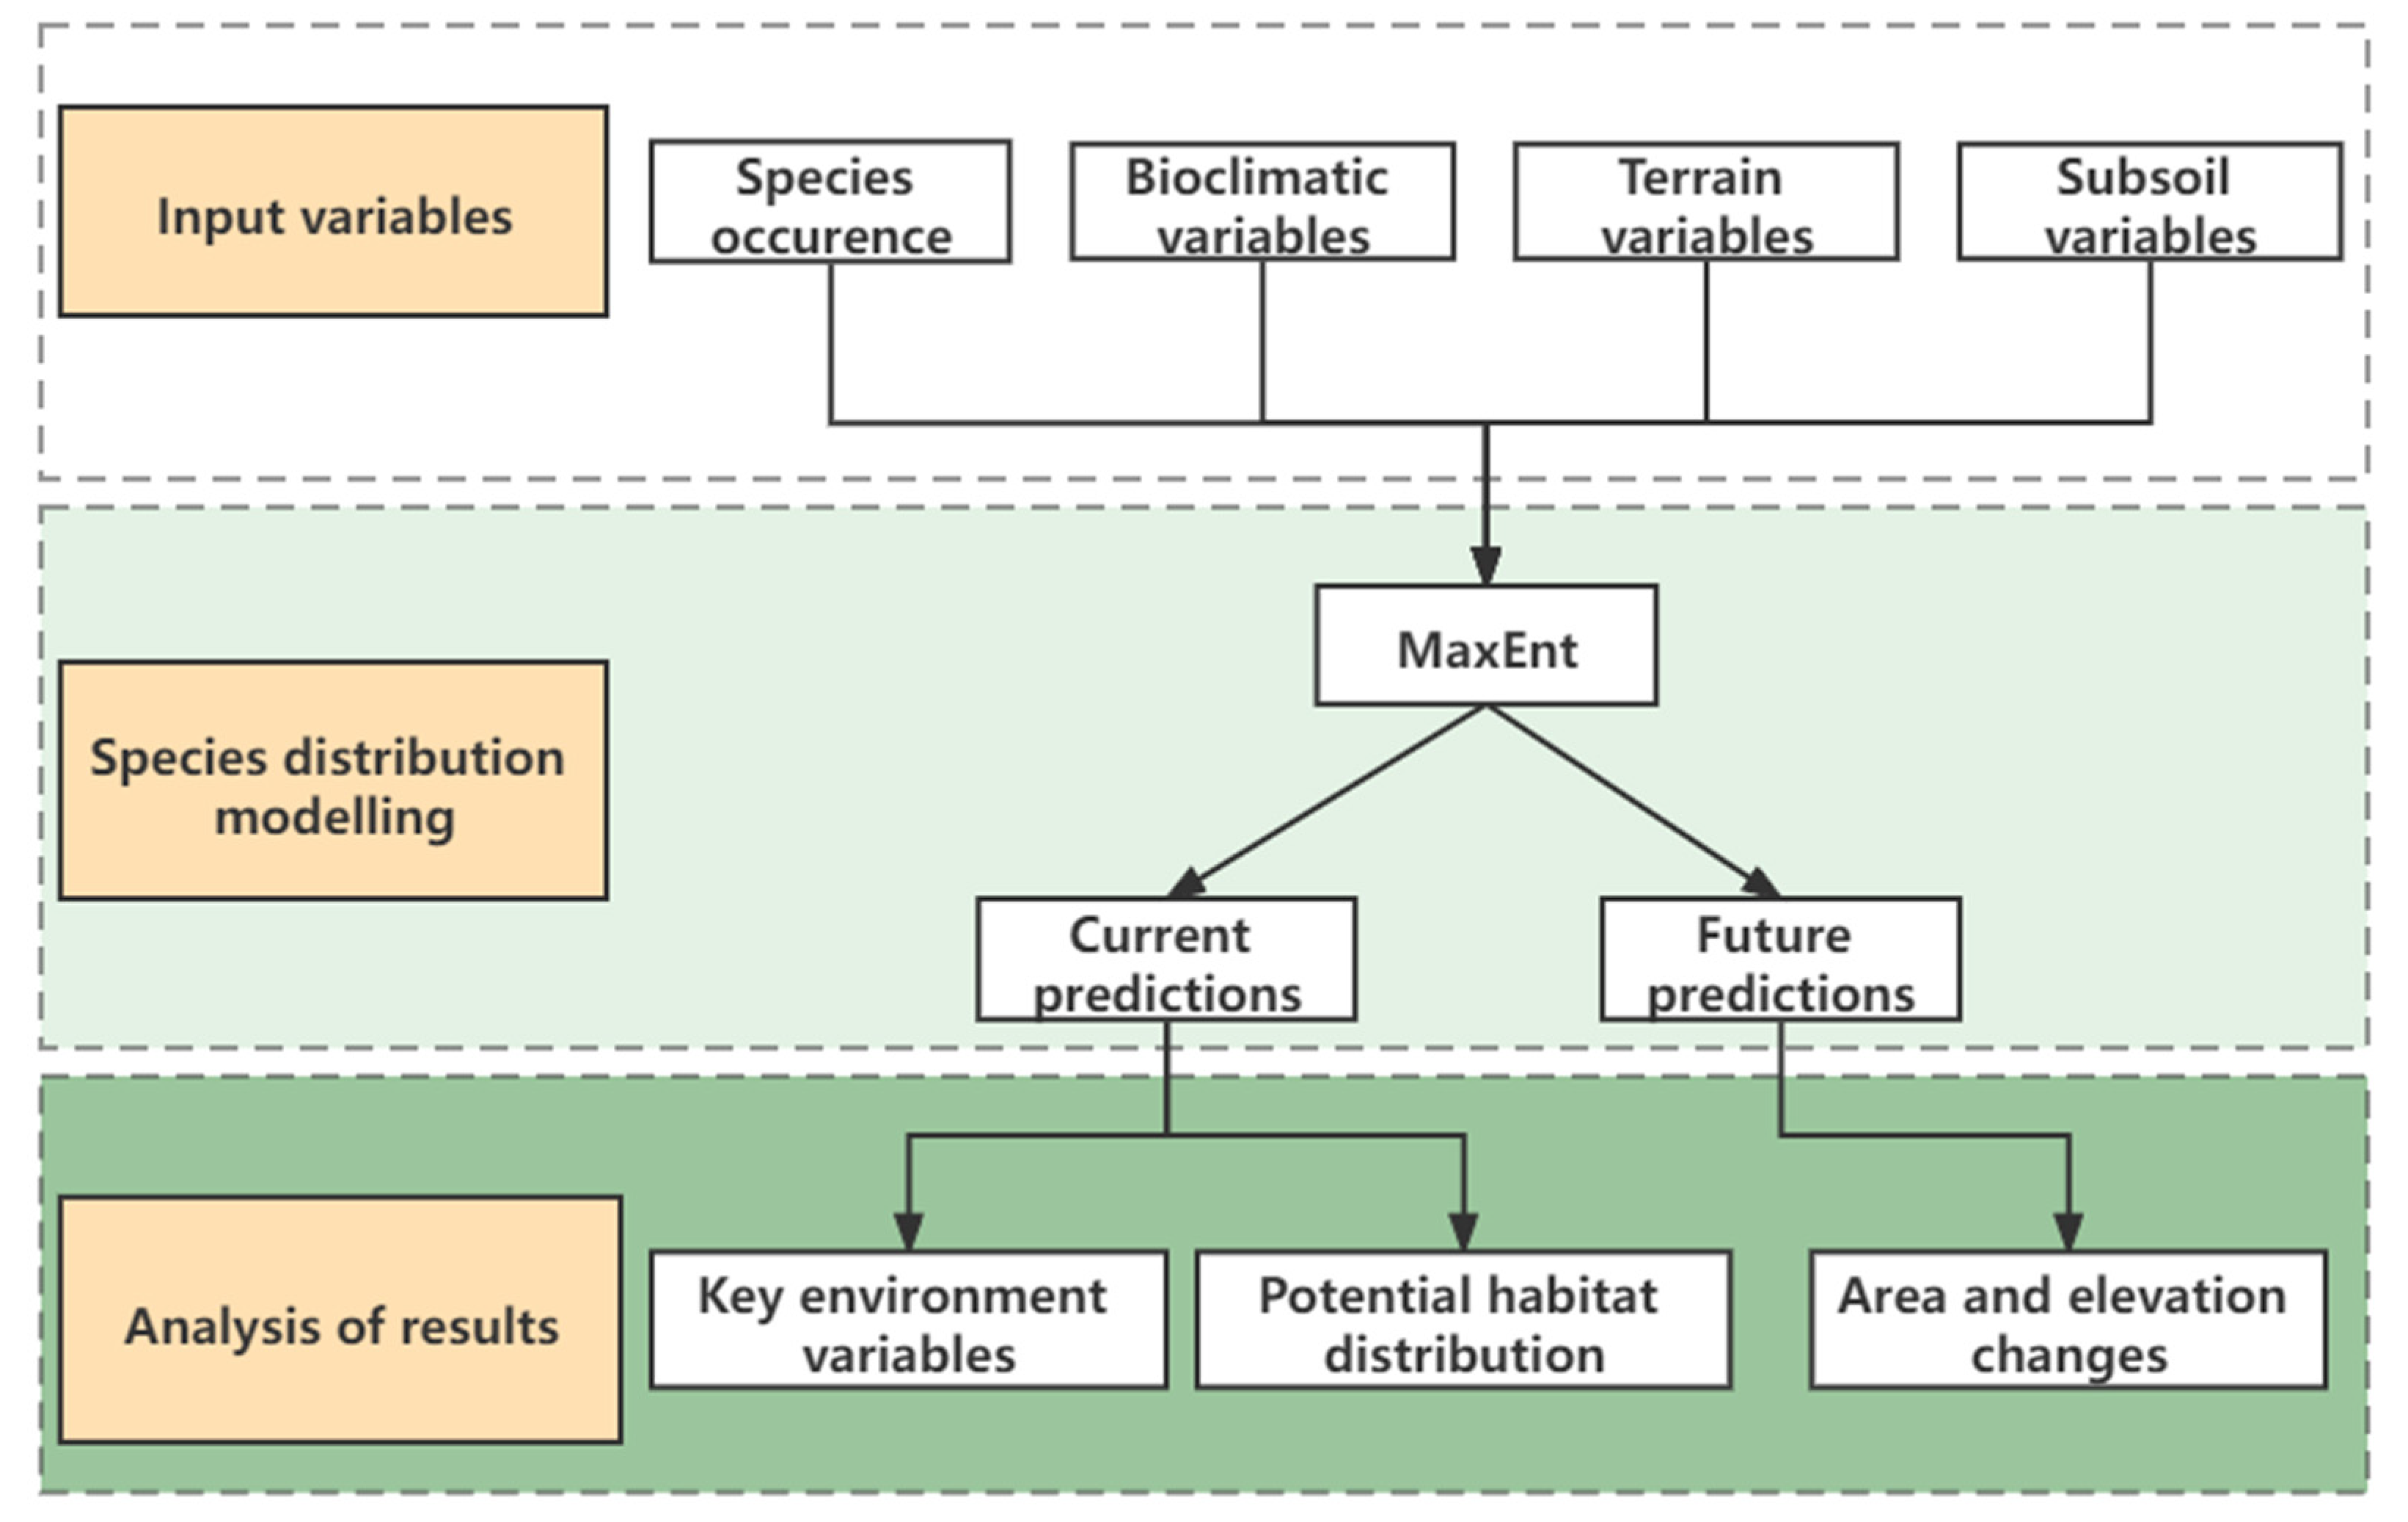
MaxEnt with advantages in performance and stability was used to predict the potential distribution of three species (Figure 2) [11,31]. In addition, MaxEnt has the advantage of utilizing continuous and classified data and integrating the interaction between variables [14]. MaxEnt software version 3.4.4k was used to identify the species potential habitat distribution. The MaxEnt was set to run 500 iterations with a maximum of 10,000 background points, a convergence threshold (0.00001), a regularization multiplier of 1, a logistic output grid format, and the algorithm parameters set to “auto feature”. The other parameter values were kept in the default settings [32]. A total of 70% of the distribution point data were selected for training, and the rest were used for testing [33]. The Jackknife was used for testing the importance of environmental variables in a model with a small amount of the distribution point records [34].
2.4.1. Accuracy Assessment
The value of the area under the receiver operating characteristic curve (AUC) was selected to assess model accuracy [11]). Model performance can be regarded as fail when it is between 0.5 and 0.6, poor when it is between 0.6 and 0.7, fair when it is between 0.7 and 0.8, good when it is between 0.8 and 0.9; and excellent when it is between 0.9 and 1 [35].
2.4.2. The Area and Elevation Changes of the Habitat Suitability
SDMtoolbox of ArcGIS 10.7 was used to convert the current and future results. The asc format files in the model result were converted to the raster format and reclassified into four suitable habitats, and we calculated the area and average altitude of potential distribution by zonal statistic tool [36]. The area and average altitude changes in the suitable habitat for species distribution were used as an indicator to evaluate the impact of climate change on the distribution of species [8]. The intersection distributions of the three species were obtained through the raster calculator and extracted by attributes tools.
3. Results
3.1. Model Assessment and Key Environmental Variables
The mean AUC of three species in training and testing all exceeded 0.9 in current and future modeling. The model for the geographic distribution prediction performed excellently and had high accuracy.
We selected the variables whose contribution rate for three species is more than 0.1 for analysis. The internal jackknife test of the MaxEnt model for environmental variables’ importance showed that aspect was the most critical factor determining the distribution of the three species. Aspect contributed 33.9% to model output for Picea crassifolia, 51.7% for Sabina przewalskii and 56.1% for Potentilla parvifolia (Table 2). In addition, elevation contributed 20.2% to model output for Picea crassifolia, 26% for Sabina przewalskii and 15.9% for Potentilla parvifolia. The following factors were precipitation of driest month (Bio14: 23.1% for Picea crassifolia, 3.4% for Sabina przewalskii and 3.5% for Potentilla parvifolia), annual precipitation (Bio12: 10.7% for Picea crassifolia, 4.9% for Potentilla parvifolia) and temperature seasonality (Bio4: 6% for Picea crassifolia). The total contributions of three subsoil variables (S_CEC_CLAY, S_BULK_DEN, S_CEC_SOIL) did not exceed 3% (Table 2). The results indicated that subsoil conditions had very limited impacts on the potential distribution of Picea crassifolia, Sabina przewalskii and Potentilla parvifolia. The cumulative percentage of aspect, elevation, Bio14, Bio12, Bio4, S_CEC_CLAY, S_BULK_DEN, and S_CEC_SOIL was 95.6% for Picea crassifolia, 82.5% for Sabina przewalskii and 83.5% for Potentilla parvifolia, respectively.
3.2. Potential Distribution of Three Species at Current Climate Scenarios
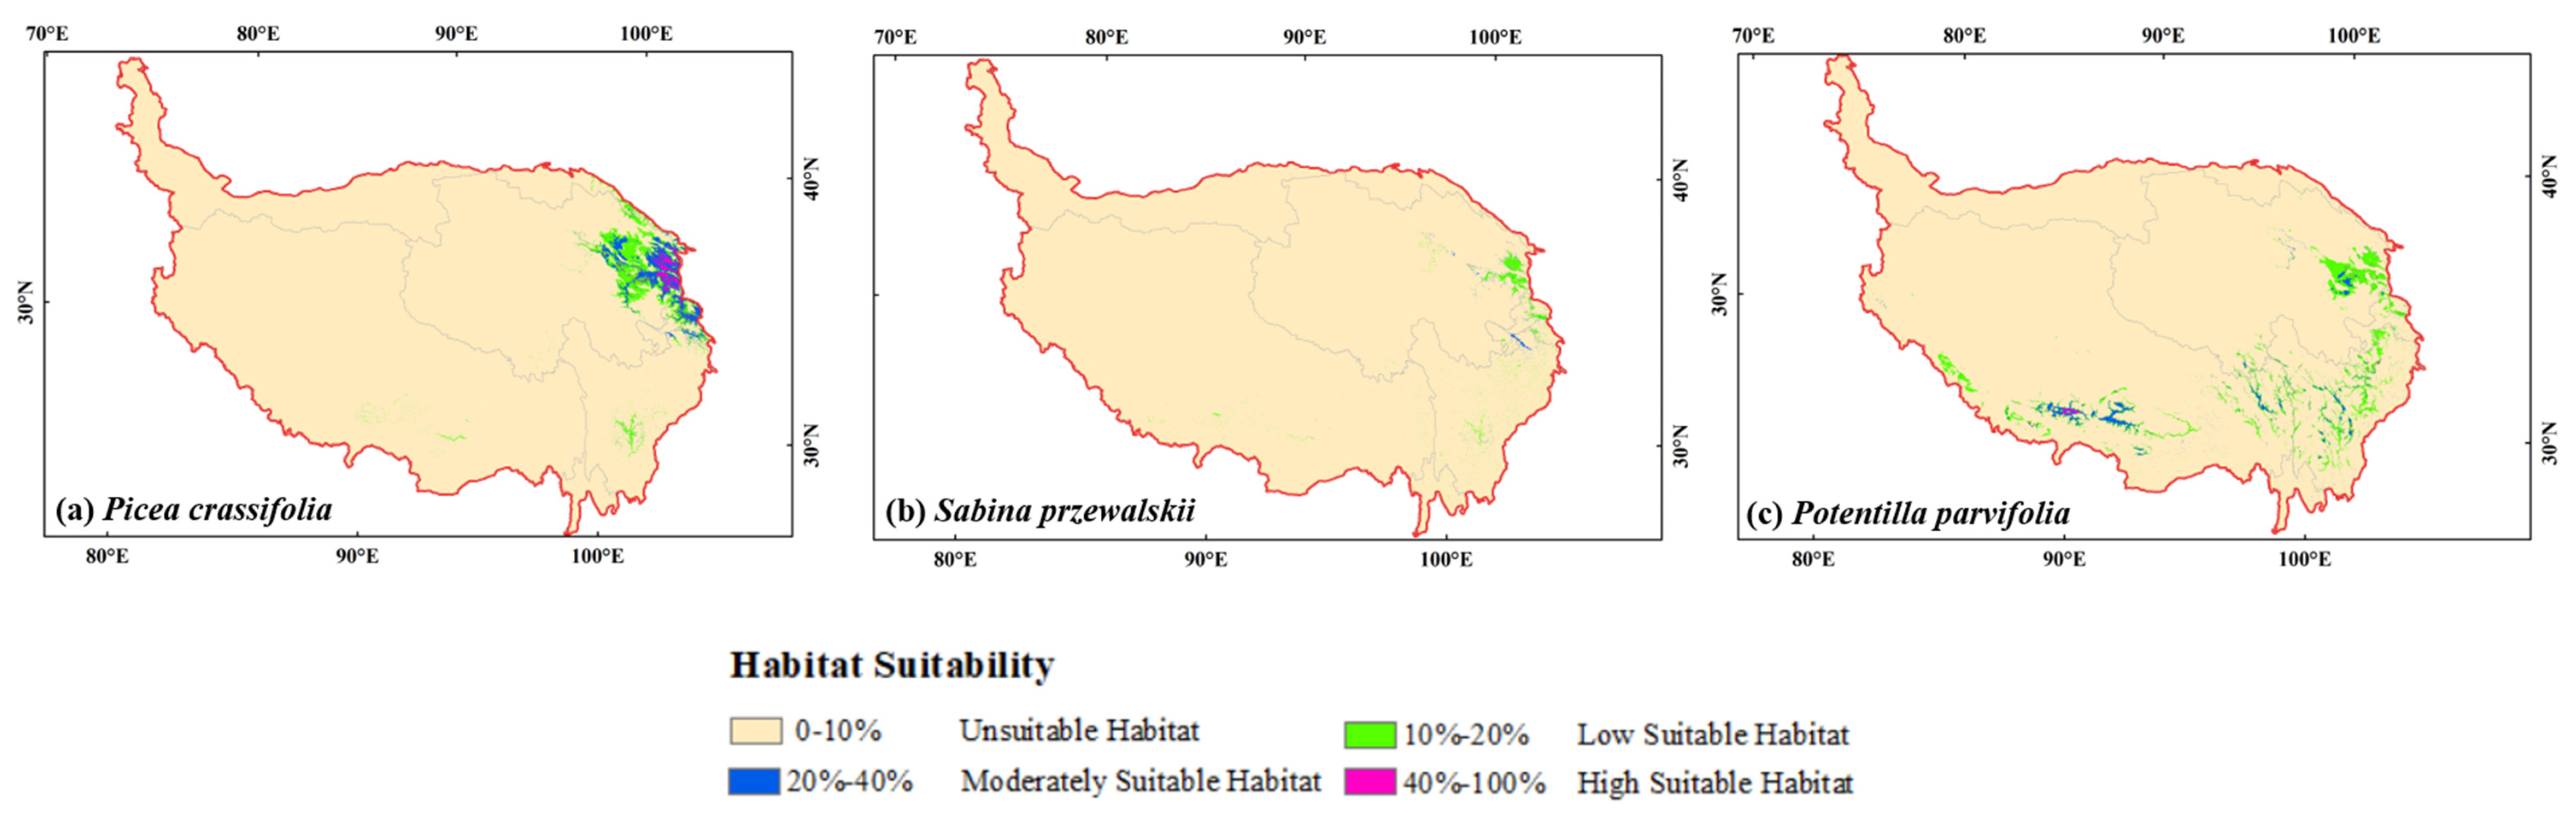
The total suitable habitat area for Picea crassifolia was 99,203.04 km2 (account for 3.86% of QTP), and was mainly concentrated in the northeastern of QTP. The total suitable habitat area for Potentilla parvifolia was 102,179.35 km2 (account for 3.98% of QTP) and was mainly distributed in the southern and northeastern of QTP. While the total suitable habitat area (21,283.4 km2) for Sabina przewalskii was much lower than Picea crassifolia and Potentilla parvifolia (only account for 0.82% of QTP) (Table 3, Figure 3).
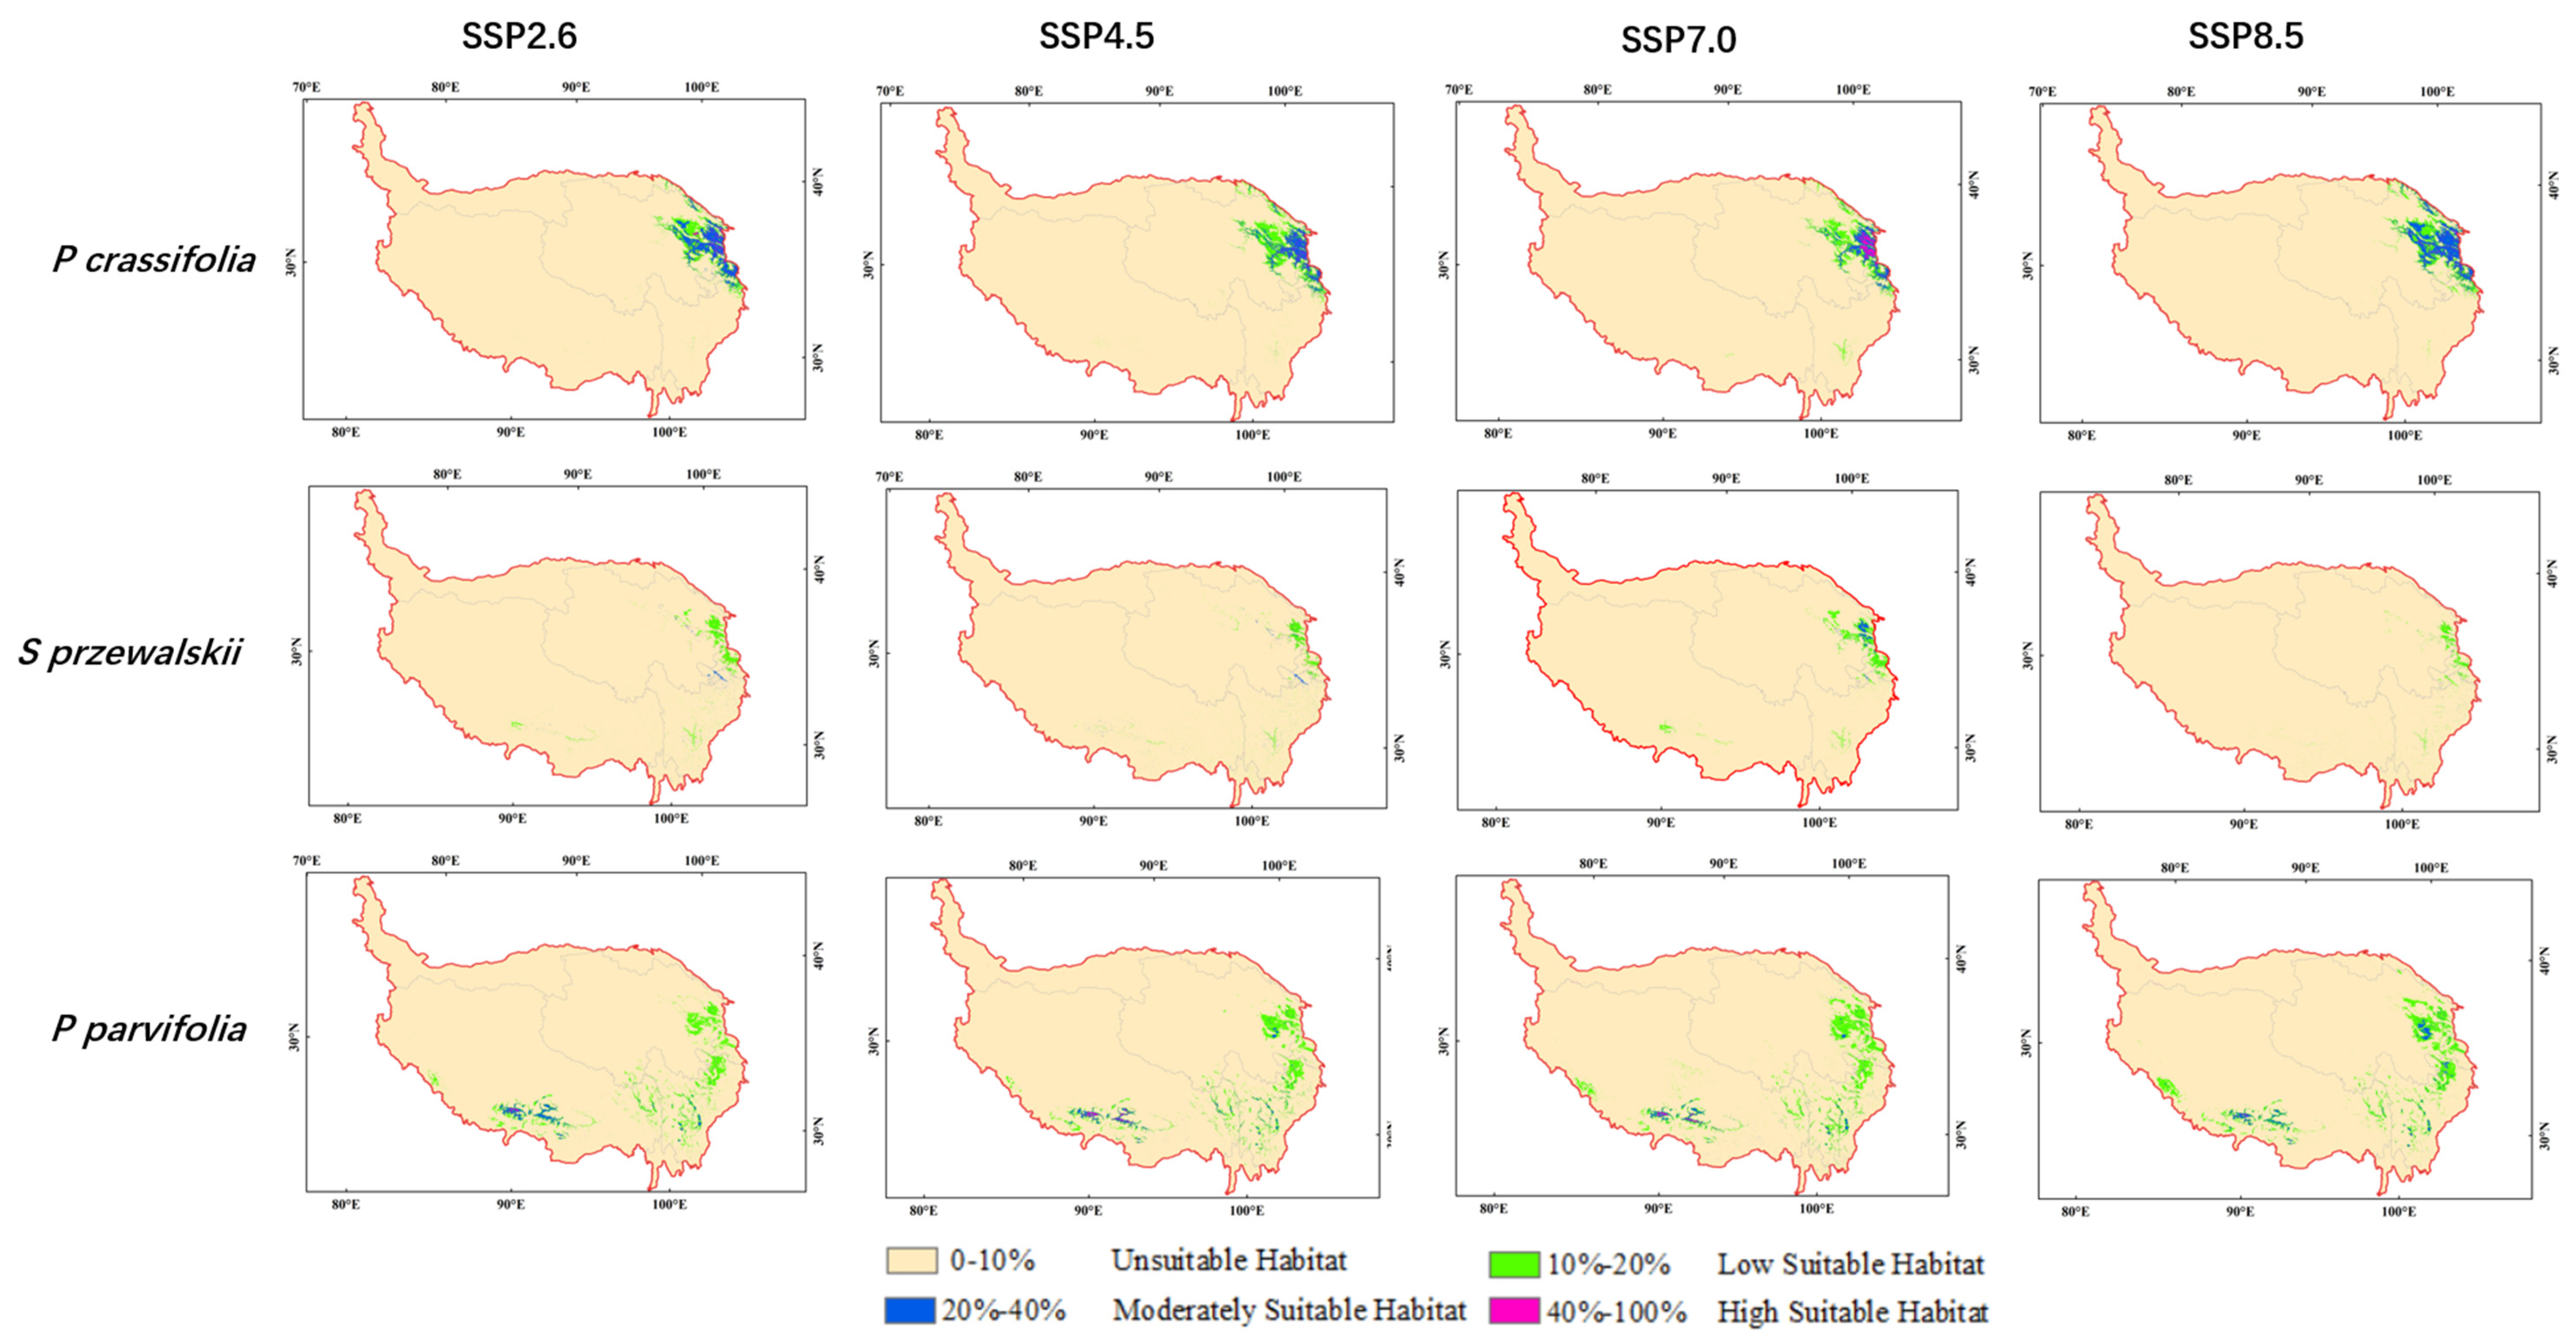
3.3. Potential Distribution of Three Species under Future Climate Scenarios
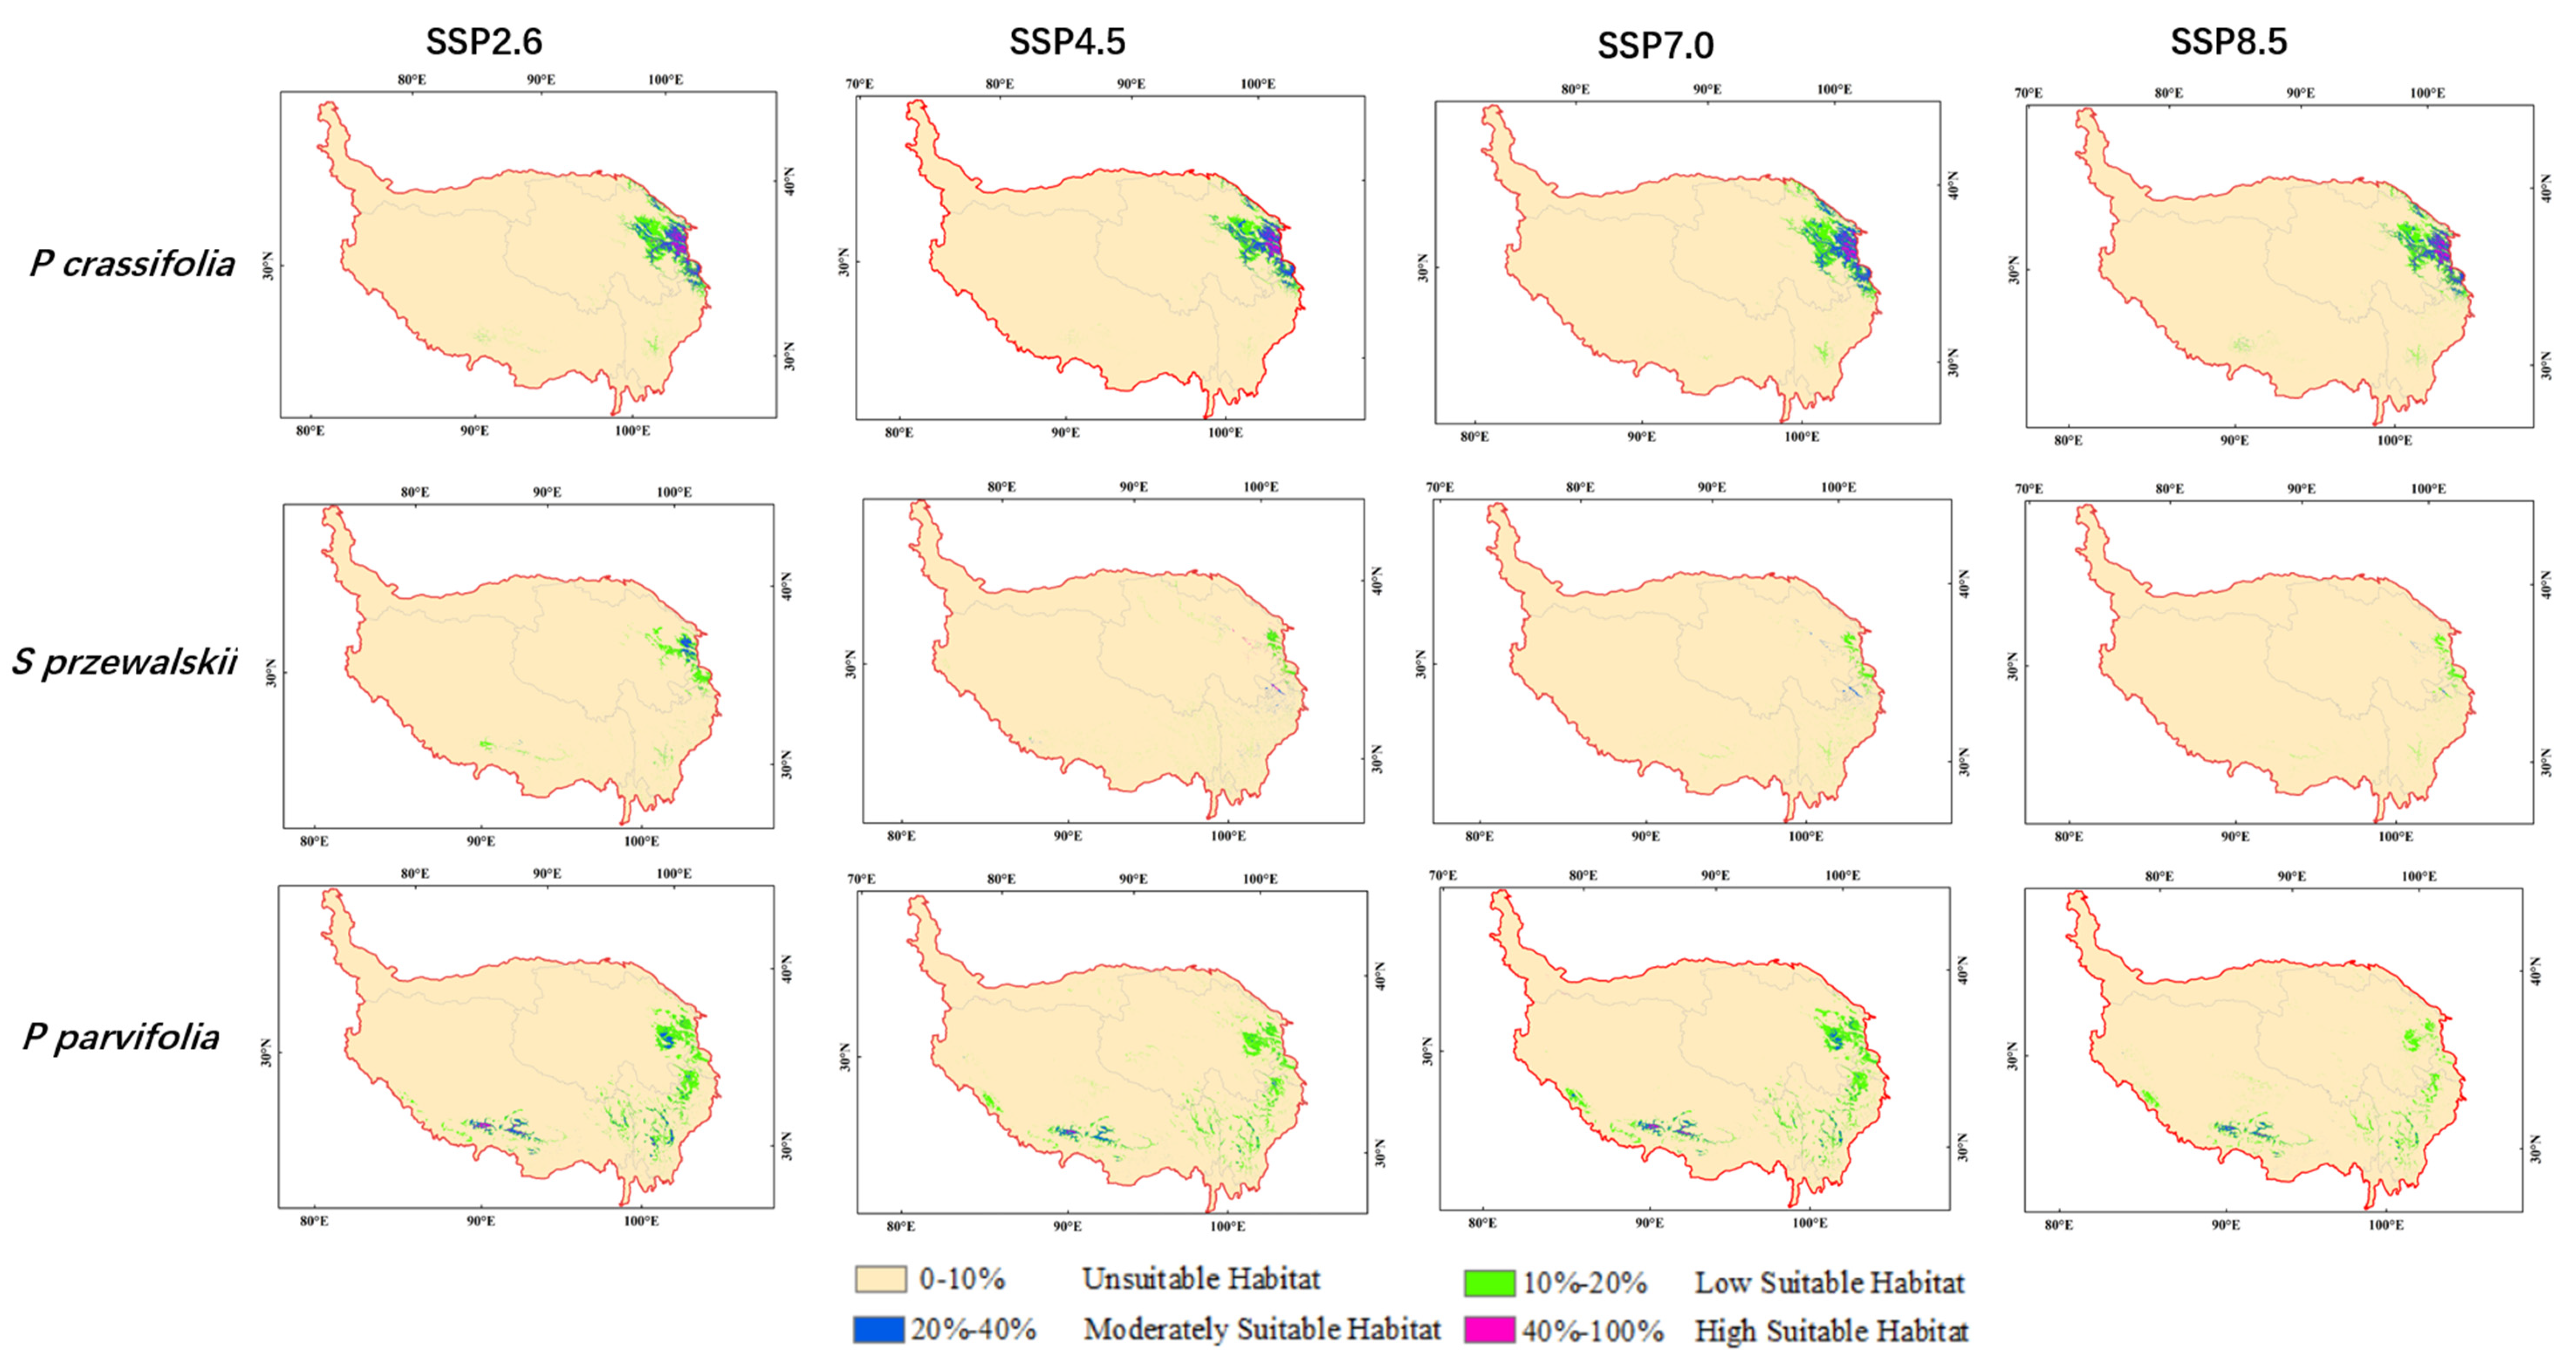
There were significant differences in the distribution area of low suitable habitat, moderately suitable habitat and high suitable habitat under future climate scenarios as compared to current. The high suitable habitat for Picea crassifolia decreased under SSP2.6, SSP4.5 and SSP8.5 in the 2070s. Especially, the high suitable habitat for Sabina przewalskii declined to zero under SSP8.5 in the 2050s. The total suitable habitat for three species all decreased under SSP8.5 in the 2050s (Figure 4). The total suitable habitat for Picea crassifolia shrank under SSP2.6, SSP4.5 and SSP7.0 and enlarged under SSP8.5 in the 2070s. On the contrary, the total suitable habitat for Sabina przewalskii enlarged under SSP2.6, SSP4.5 and SSP7.0 and shrank under SSP8.5 in the 2070s. The total suitable habitat for Potentilla parvifolia continued increasing from SSP2.6 to SSP8.5 in the 2070s (Table 3, Figure 5)).
The average elevation in potentially suitable habitat for three species showed a slight upward shift under many climate scenarios in the 2050s and 2070s as compared to the average elevation of their potential distribution at current. For instance, the average elevation in potentially suitable habitat for Potentilla parvifolia all increased except under SSP8.5 (3552 m) in the 2050s. The average elevation of high suitable habitat for Picea crassifolia was 2758 m at current. However, the average elevation of highly suitable habitat for Picea crassifolia varied from 2773 m (SSP2.6) to 2849 m (SSP8.5) in the 2050s and increased to 2961 m (SSP2.6), 2891 m (SSP4.5) and 3043 m (SSP8.5) in the 2070s. The average elevation of highly suitable habitat, medium suitable habitat and low suitable habitat for Sabina przewalskii was 2951 m, 3175 m and 3083 m, respectively, at current. However, the average elevation of potentially suitable habitat for Sabina przewalskii varied from 2597 m to 3487 m in future climate scenarios. The changes of the average elevation in potentially suitable habitat for Picea crassifolia and Sabina przewalskii under different climate scenarios were not obvious, while the mean elevation in potentially suitable habitat for Potentilla parvifolia basically rose from the current period to the 2070s (Table 4).
3.4. The Changes of the Intersection Distribution of Three Species
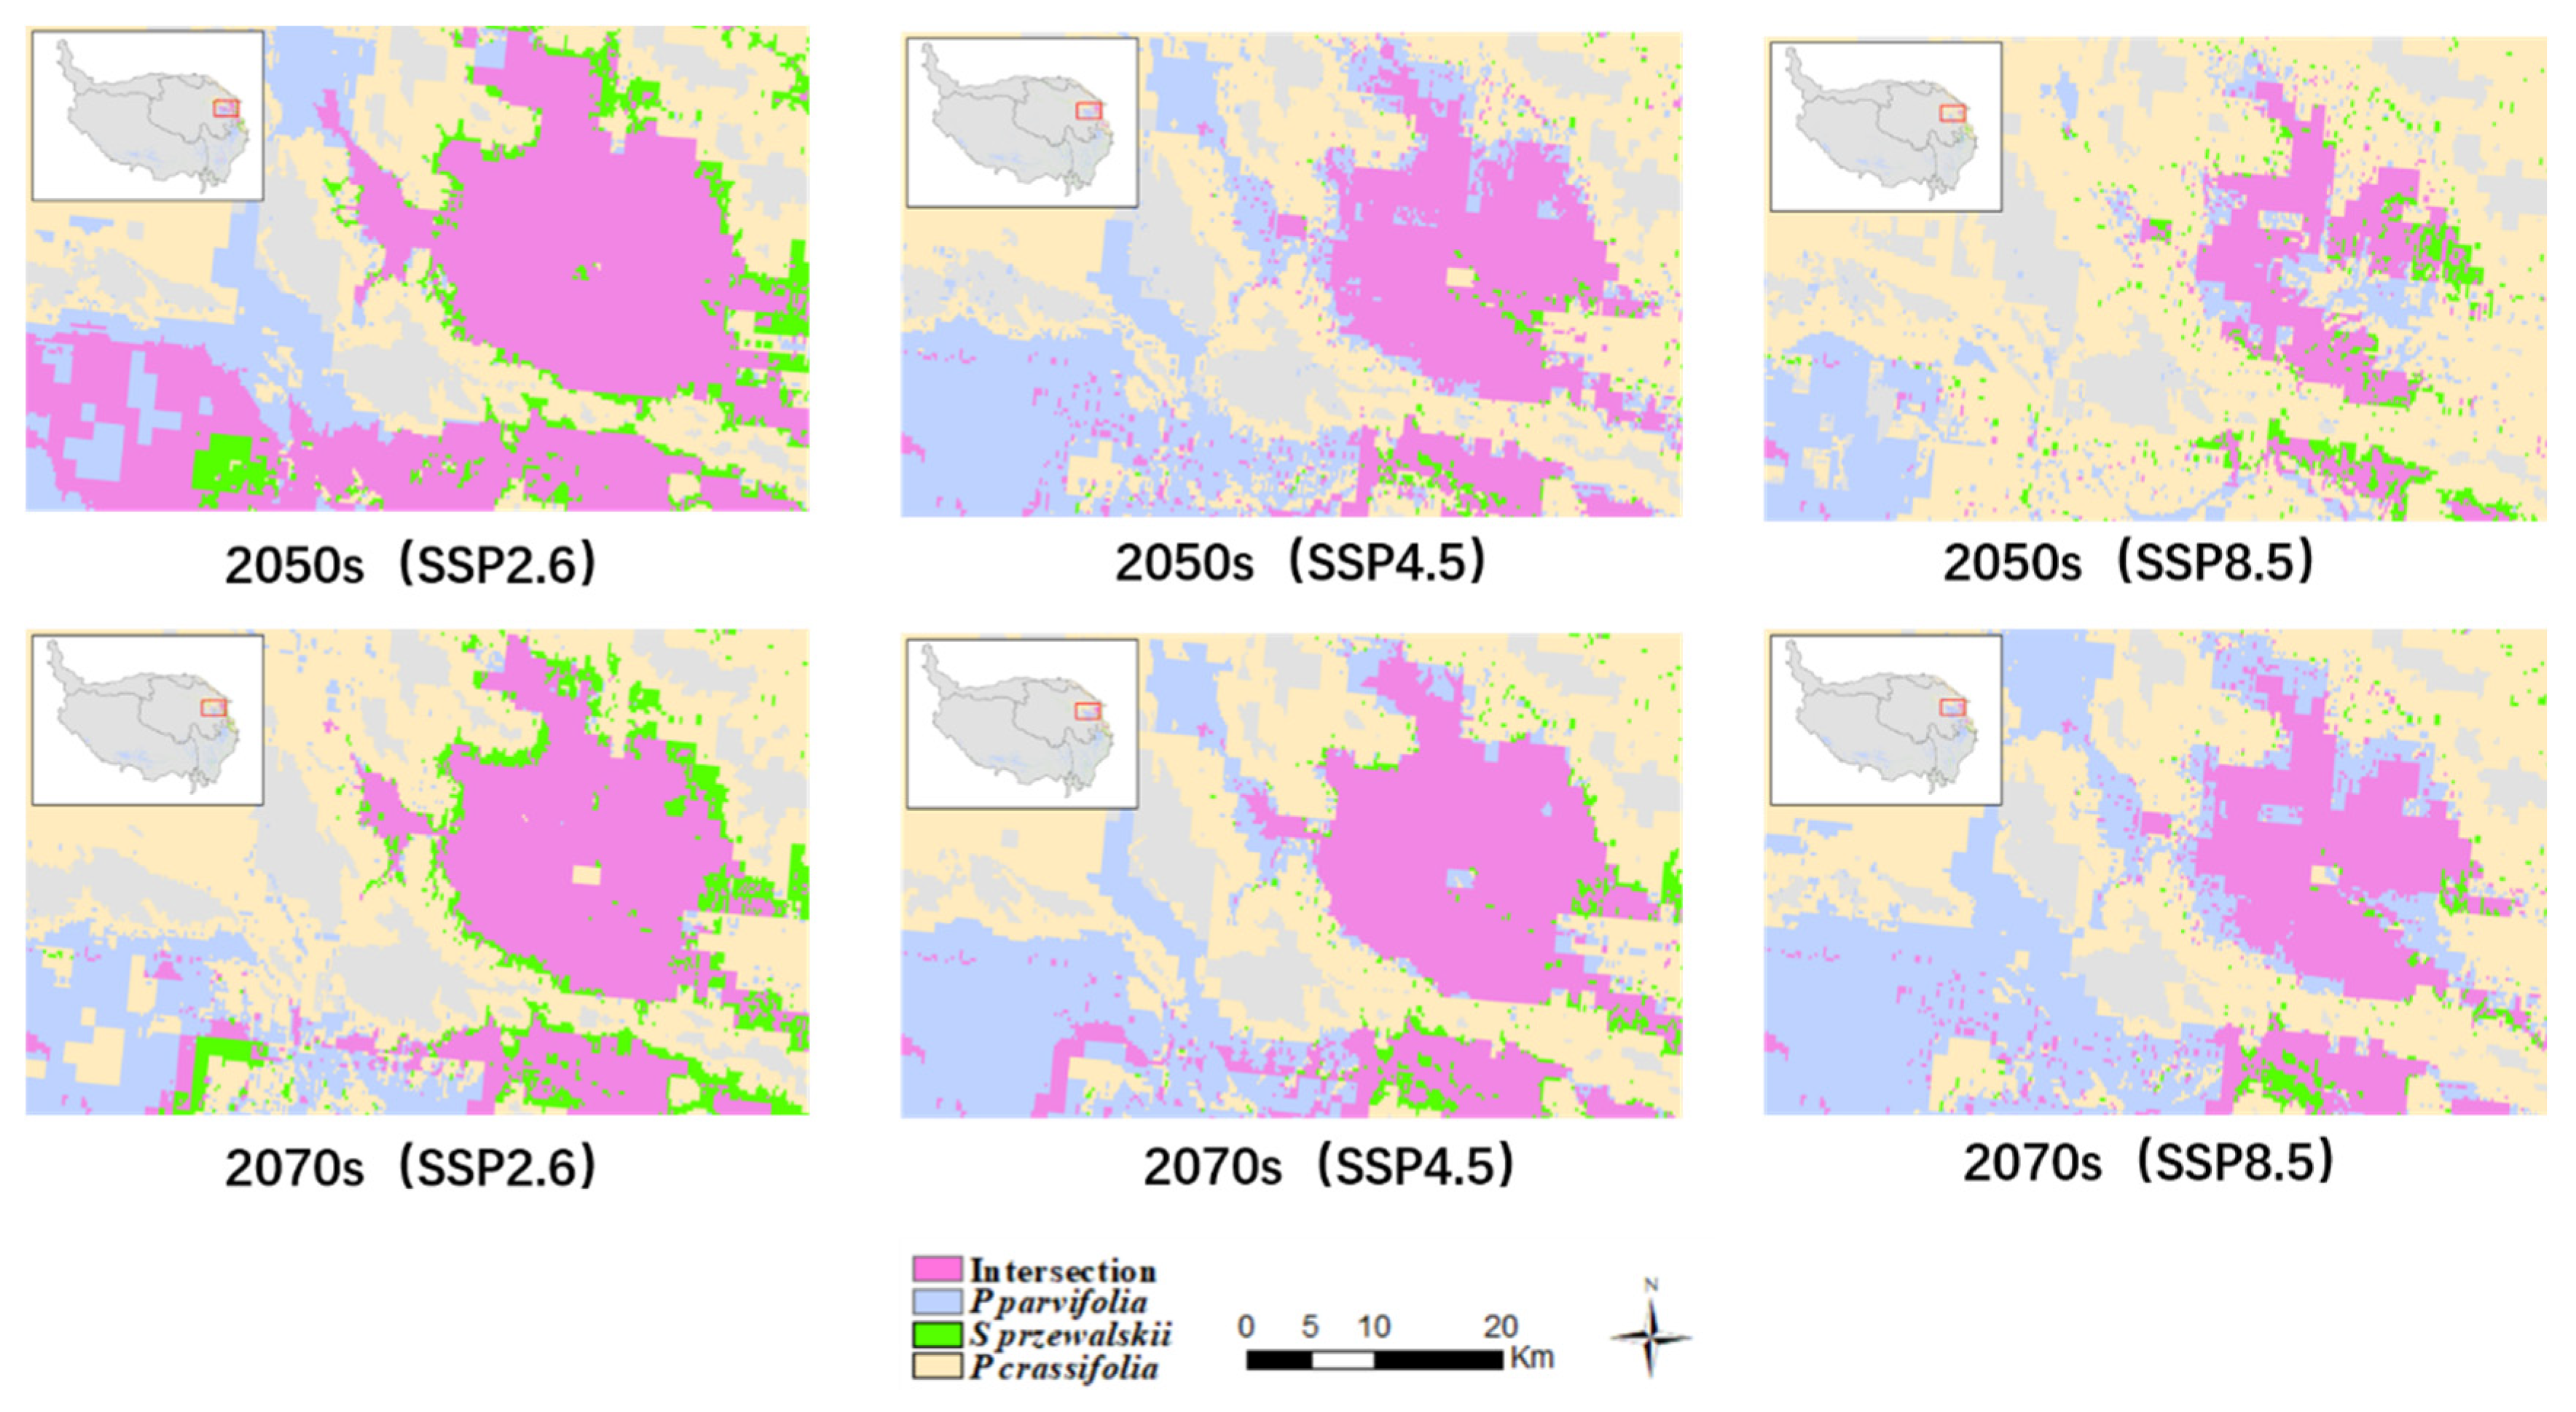
Due to the large distribution area in the northeastern of QTP for three species, we analyzed the changes of intersection distributions for three species under future climate scenarios. Figure 6 showed the modeled vegetation fractional cover and spatial distribution of suitable habitat under future climate scenarios in the 2050s and 2070s in the northeastern of QTP. There was a decreasing trend for the intersection distribution area of three species (34,745 km2 for SSP2.6, 15,441 km2 for SSP4.5 and 7822 km2 for SSP8.5 in the 2050s; 18,584 km2 for SSP2.6, 17,060 km2 for SSP4.5 and 15,440 km2 for SSP8.5 in 2070s), which expanded their distribution area to the northeast. Under SSP8.5, the distribution for Potentilla parvifolia enlarged but the distribution for Picea crassifolia and Sabina przewalskii contracted. The total suitable habitat area for Potentilla parvifolia in the QTP would increase from 97,353.72 km2 under SSP2.6 to 119,069.06 km2 under SSP8.5 in the 2070s. However, the total suitable habitat area for Sabina przewalskii in the QTP would shrink from 31,205.97 km2 under SSP2.6 to 20,496.67 km2 under SSP8.5 in the 2070s.
4. Discussion
4.1. Influence of Environmental Variables on the Potential Distribution of Three Species
It is widely known that the species distributions are not only determined by climatic factors but also impacted by local topography, human activities and species interactions [37]. Terrain characteristics, i.e., slope, altitude, and aspect are key environmental variables for shaping the vegetation distribution by changing moisture and heat especially for alpine trees [38,39]. In this study, analyses of environmental variables showed that aspect and elevation are critical factors restricting the distribution of the three species. The three species live in different aspects and their suitable habitats so they have their own ecological characteristics. Species distribution is primarily affected by elevation and aspect in alpine forest ecosystems [40]. According to the results of this study, Picea crassifolia is distributed between 2691 and 3375 m. The mean elevation of the highest habitat Suitability of Picea crassifolia under SSP8.5 in the 2050s is about 2849 m, which is similar to the previous study [41].
Temperature and precipitation are two major climate factors affecting the species distribution, especially growth-season temperatures, cold tolerance and the available water supply for alpine trees [42]. The results showed that precipitation of driest month (Bio14), annual precipitation (Bio12), temperature seasonality (Bio4) are major climatic factors that influence the distribution of Picea crassifolia, Sabina przewalskii and Potentilla parvifolia. Higher precipitation of the driest month and annual precipitation have a positive impact on species distribution. Temperature and precipitation are the key factors influencing species distribution in the drier upper sites. However, species distribution is more restricted by precipitation than the temperature in the wetter upper sites [37]). Temperature seasonality is positively related to elevation and strong seasonal variation in temperature may inhibit the growth of trees [43].
Soil provides the necessary space and nutrients for species to survive and limits their distributions [44]. The soil thickness at different sites is the reason for the spatial difference of species distribution [45]. Soil thickness ≥40 cm can store enough available water to allow trees to survive during drought periods [40]. In this study, we used physical and chemical characteristics of subsoil (30–100 cm) variables to further evaluate the suitable distribution of three species. We found subsoil CEC (clay), subsoil bulk density and subsoil CEC (soil) have a little influence on species distributions the QTP.
4.2. Average Elevation Changes of Potential Suitable Habitat for Three Model Species
The average elevation in potentially suitable habitat for three species showed a slight upward shift under many climate scenarios in the 2050s and 2070s as compared to the average elevation of their potential distribution at current. Especially the average elevation in potentially suitable habitat for Potentilla parvifolia all increased except under SSP8.5 (3552 m) in the 2050s. These results are similar to other studies, which show plant species shift to higher elevation and cooler habitats responding to climate warming [46,47]. In order to adapt to climate change at local, regional, and global scales, alpine species shape the mechanism of shifting suitable climatic niches to relatively cooler habitats [48]. For three species in this study, the modeled predictions indicate species would shift to a higher elevation to occupy the current climate niche by the 2070s.
The changes of the average elevation in potentially suitable habitat for trees (Picea crassifolia and Sabina przewalskii) under different climate scenarios were not obvious, while the mean elevation in potentially suitable habitat for shrub (Potentilla parvifolia) had a basically rising from current to 2070s. The modeling results suggested there would be a competitive relationship between shrubs and trees. The existence of shrubs restricts the growth of trees to higher altitudes, so the average altitude of Picea crassifolia and Sabina przewalskii did not increase further with climate warming. The previous study found the changes in the mean elevation could be influenced by other factors rather than climate alone [49].
4.3. Influence of Other Factors on the Potential Distribution of Three Species
The vegetation is currently growing to a higher altitude [50,51], and this expansion will probably go on in the future. It is mainly responsible for climate change due to temperature or water availability [52,53]. In this study, we found that the positive interaction between shrubs and trees can promote the upward movement of vegetation. These interactions occur at slightly higher altitudes [54,55]. Shrubs are expected to expand to a higher elevation than trees with the same critical survival temperature. The snow cover is the protection of shrubs because it alleviates the influence of the temperature on shrubs [56]. The interaction between shrubs and trees may become more and more important to explain changes in the species composition and structure on the QTP. The expansion of shrubs could be discontinuous spatially and temporally which actually covers up tree expansion.
In addition, the two Ips species (Ips nitidus Eggers and Ips shangrila Cognato and Sun) are the most destructive secondary bark beetles on Picea crassifolia and always cause mortality of trees by their cooperation [57]. Increasing human interventions, such as harvesting, grazing and mining, may also result in distribution changes of the three species. The human population on the QTP has expanded dramatically in the past decades. Some suitable habitats for alpine species were converted to other land uses, such as pastures or settlements [40].
5. Conclusions
In this study, we explored the influence of climate change on two dominant alpine trees (Picea crassifolia Kom and Sabina przewalskii Kom) and one dominant alpine shrub (Potentilla parvifolia Fisch) under different climate scenarios on the Qinghai–Tibetan Plateau. The predicted current potential distribution of three species was basically located in the northeastern of Qinghai–Tibetan Plateau, and the distribution of three species was most impacted by aspect, elevation, temperature seasonality, annual precipitation, precipitation of driest month, Subsoil CEC (clay), Subsoil bulk density and Subsoil CEC (soil). There were significant differences in the potential distribution of the three species under four climate scenarios in the 2050s and 2070s including expanding, shifting, and shrinking. The mean elevation in potentially suitable habitat for Potentilla parvifolia basically rose from the current period to the 2070s. Our study provides an important reference for the conservation of Picea crassifolia, Sabina przewalskii, Potentilla parvifolia and other dominant plant species under climate change. However, our research only used the friendly MaxEnt model without considering other models. In future studies, we will select the ensemble model which can improve the reliability and accuracy of forecast results to further predict species distribution.
Author Contributions
H.H. carried out the main data search, processing, and paper writing work; Y.W. proposed the paper ideas and carried out the paper revision work; W.W. gave valuable comments in the paper writing and helped to collect and check the data; C.W. carried out the paper revision work. All authors have read and agreed to the published version of the manuscript.
Funding
This research was funded by [the Strategic Priority Research Program of Chinese Academy of Sciences] grant number [XDA19040500]; [the Second Tibetan Plateau Scientific Expedition and Research (STEP) Program] grant number [2019QZKK0502]; [the 2020 Joint Research Project of Three-River National Park of the Chinese Academy of Sciences and the People’s Government of Qinghai Province] grant number [LHZX-2020-08]; [the Qinghai Province Research Project] grant number [2019-ZJ-913].
Institutional Review Board Statement
Not applicable.
Data Availability Statement
All environmental variables used in the manuscript are already publicly accessible, and we provided the download address in the manuscript; relevant sampling site information can be found in the online version.
Acknowledgments
Our deepest gratitude goes to the anonymous reviewers for their careful work and thoughtful suggestions that have helped improve this paper substantially. This research was jointly supported by the Strategic Priority Research Program of the Chinese Academy of Sciences (grant no. XDA19040500), the Second Tibetan Plateau Scientific Expedition and Research (STEP) Program (2019QZKK0502); the 2020 Joint Research Project of Three-River National Park of the Chinese Academy of Sciences and the People’s Government of Qinghai Province (LHZX-2020-08) and the Qinghai Province Research Project (2019-ZJ-913). We are very grateful for their generous funding.
Conflicts of Interest
The authors declare no conflict of interest.
References
- Araújo, M.B.; Rahbek, C. How Does Climate Change Affect Biodiversity? Science 2006, 313, 1396–1397. [Google Scholar] [CrossRef]
- Beaumont, L.J.; Pitm, A.J.; Poulsen, M.; Hughes, L. Where will species go? Incorporating new advances in climate modelling into projections of species distributions. Glob. Chang. Biol. 2007, 13, 1368–1385. [Google Scholar] [CrossRef]
- Lenoir, J.; Gegout, J.C.; Marquet, P.A.; de Ruffray, P.; Brisse, H. A significant upward shift in plant species optimum elevation during the 20th century. Science 2008, 320, 1768–1771. [Google Scholar] [CrossRef] [PubMed]
- Xin, X.G.; Wu, T.W.; Zhang, J.; Yao, J.C.; Fang, Y.J. Comparison of CMIP6 and CMIP5 simulations of precipitation in China and the East Asian summer monsoon. Int. J. Climatol. 2020, 40, 6423–6440. [Google Scholar] [CrossRef] [Green Version]
- Liu, X.D.; Chen, B.D. Climatic warming in the Tibetan Plateau during recent decades. Int. J. Climatol. 2000, 20, 1729–1742. [Google Scholar] [CrossRef]
- Hickling, R.; Roy, D.B.; Hill, J.K.; Fox, R.; Thomas, C.D. The distributions of a wide range of taxonomic groups are expanding polewards. Glob. Chang. Biol. 2006, 12, 450–455. [Google Scholar] [CrossRef]
- Pecl, G.T.; Araújo, M.B.; Bell, J.D.; Blanchard, J.; Bonebrake, T.C.; Chen, I.-C.; Clark, T.D.; Colwell, R.K.; Danielsen, F.; Evengård, B.; et al. Biodiversity redistribution under climate change: Impacts on ecosystems and human well-being. Science 2017, 355. [Google Scholar] [CrossRef] [PubMed]
- Naudiyal, N.; Wang, J.; Ning, W.; Gaire, N.P.; Peili, S.; Yanqiang, W.; Jiali, H.; Ning, S. Potential distribution of Abies, Picea, and Juniperus species in the sub-alpine forest of Minjiang headwater region under current and future climate scenarios and its implications on ecosystem services supply. Ecol. Indic. 2021, 121, 107131. [Google Scholar] [CrossRef]
- Xu, Z.; Zhao, C.; Feng, Z.; Peng, H.; Chao, W. The impact of climate change on potential distribution of species in semi-arid region: A case study of Qinghai spruce (Picea crassifolia) in Qilian Mountain, Gansu province, China. In Proceedings of the 2009 IEEE International Geoscience and Remote Sensing Symposium, Cape Town, South Africa, 12–17 July 2009. [Google Scholar]
- Kearney, M.R.; Wintle, B.A.; Porter, W.P. Correlative and mechanistic models of species distribution provide congruent forecasts under climate change. Conserv. Lett. 2010, 3, 203–213. [Google Scholar] [CrossRef]
- Phillips, S.J.; Anderson, R.P.; Schapire, R.E. Maximum entropy modeling of species geographic distributions. Ecol. Model. 2006, 190, 231–259. [Google Scholar] [CrossRef] [Green Version]
- Bradter, U.; Kunin, W.E.; Altringham, J.D.; Thom, T.J.; Benton, T.G. Identifying appropriate spatial scales of predictors in species distribution models with the random forest algorithm. Methods Ecol. Evol. 2013, 4, 167–174. [Google Scholar] [CrossRef]
- Stockwell, D.; Peters, D. The GARP modelling system: Problems and solutions to automated spatial prediction. Int. J. Geogr. Inf. Sci. 1999, 13, 143–158. [Google Scholar] [CrossRef]
- Phillips, S.J.; Dudik, M. Modeling of species distributions with Maxent: New extensions and a comprehensive evaluation. Ecography 2008, 31, 161–175. [Google Scholar] [CrossRef]
- Eyring, V.; Bony, S.; Meehl, G.A.; Senior, C.A.; Stevens, B.; Stouffer, R.J.; Taylor, K.E. Overview of the Coupled Model Intercomparison Project Phase 6 (CMIP6) experimental design and organization. Geosci. Model Dev. 2016, 9, 1937–1958. [Google Scholar] [CrossRef] [Green Version]
- Zhang, L.; Chen, X.; Xin, X. Short commentary on CMIP6 Scenario Model Intercomparison Project (ScenarioMIP). Progress. Inquisitiones De Mutat. Clim. 2019, 15, 519–525. [Google Scholar] [CrossRef]
- Riahi, K.; van Vuuren, D.P.; Kriegler, E.; Edmonds, J.; O’Neill, B.C.; Fujimori, S.; Bauer, N.; Calvin, K.; Dellink, R.; Fricko, O.; et al. The Shared Socioeconomic Pathways and their energy, land use, and greenhouse gas emissions implications: An overview. Glob. Environ. Chang. Hum. Policy Dimens. 2017, 42, 153–168. [Google Scholar] [CrossRef] [Green Version]
- Liu, J.; Milne, R.I.; Cadotte, M.W.; Wu, Z.-Y.; Provan, J.; Zhu, G.-F.; Gao, L.-M.; Li, D.-Z. Protect Third Pole’s fragile ecosystem. Science 2018, 362, 1368. [Google Scholar] [CrossRef] [PubMed]
- Xia, M.; Jia, K.; Zhao, W.W.; Liu, S.L.; Wei, X.Q.; Wang, B. Spatio-temporal changes of ecological vulnerability across the Qinghai-Tibetan Plateau. Ecol. Indic. 2021, 123, 107274. [Google Scholar] [CrossRef]
- Liu, J.Q.; Sun, Y.S.; Ge, X.J.; Gao, L.M.; Qiu, Y.X. Phylogeographic studies of plants in China: Advances in the past and directions in the future. J. Syst. Evol. 2012, 50, 267–275. [Google Scholar] [CrossRef]
- Qiu, Y.X.; Fu, C.X.; Comes, H.P. Plant molecular phylogeography in China and adjacent regions: Tracing the genetic imprints of Quaternary climate and environmental change in the world’s most diverse temperate flora. Mol. Phylogenetics Evol. 2011, 59, 225–244. [Google Scholar] [CrossRef]
- Zhang, K.L.; Yao, L.J.; Meng, J.S.; Tao, J. Maxent modeling for predicting the potential geographical distribution of two peony species under climate change. Sci. Total Environ. 2018, 634, 1326–1334. [Google Scholar] [CrossRef] [PubMed]
- Hijmans, R.J.; Cameron, S.E.; Parra, J.L.; Jones, P.G.; Jarvis, A. Very high resolution interpolated climate surfaces for global land areas. Int. J. Climatol. 2005, 25, 1965–1978. [Google Scholar] [CrossRef]
- Fick, S.E.; Hijmans, R.J. WorldClim 2: New 1-km spatial resolution climate surfaces for global land areas. Int. J. Climatol. 2017, 37, 4302–4315. [Google Scholar] [CrossRef]
- Kebede, A.S.; Nicholls, R.; Allan, A.; Arto, I.; Cazcarro, I.; Fernandes, J.A.; Hill, C.T.; Hutton, C.; Kay, S.; Lázár, A.N.; et al. Applying the global RCP-SSP-SPA scenario framework at sub-national scale: A multi-scale and participatory scenario approach. Sci. Total Environ. 2018, 635, 659–672. [Google Scholar] [CrossRef]
- Wu, T.; Lu, Y.; Fang, Y.; Xin, X.; Li, L.; Li, W.; Jie, W.; Zhang, J.; Liu, Y.; Zhang, L.; et al. The Beijing Climate Center Climate System Model (BCC-CSM): The main progress from CMIP5 to CMIP6. Geosci. Model Dev. 2019, 12, 1573–1600. [Google Scholar] [CrossRef] [Green Version]
- Booth, T.H. Why understanding the pioneering and continuing contributions of BIOCLIM to species distribution modelling is important. Austral Ecol. 2018, 43, 852–860. [Google Scholar] [CrossRef] [Green Version]
- Jiang, F.; Li, G.; Qin, W.; Zhang, J.; Lin, G.; Cai, Z.; Gao, H.; Zhang, T. Setting priority conservation areas of wild Tibetan gazelle (Procapra picticaudata) in China’s first national park. Glob. Ecol. Conserv. 2019, 20, e00725. [Google Scholar] [CrossRef]
- Zeng, Y.; Low, B.W.; Yeo, D.C.J. Novel methods to select environmental variables in MaxEnt: A case study using invasive crayfish. Ecol. Model. 2016, 341, 5–13. [Google Scholar] [CrossRef]
- Yan, H.; Feng, L.; Zhao, Y.; Feng, L.; Zhu, C.; Qu, Y.; Wang, H. Predicting the potential distribution of an invasive species, Erigeron canadensis L., in China with a maximum entropy model. Glob. Ecol. Conserv. 2020, 21, e00822. [Google Scholar] [CrossRef]
- Wisz, M.S.; Hijmans, R.J.; Li, J.; Peterson, A.T.; Graham, C.H.; Guisan, A. Effects of sample size on the performance of species distribution models. Divers. Distrib. 2008, 14, 763–773. [Google Scholar] [CrossRef]
- Elith, J.; Phillips, S.J.; Hastie, T.; Dudík, M.; Chee, Y.E.; Yates, C.J. A statistical explanation of MaxEnt for ecologists. Divers. Distrib. 2011, 17, 43–57. [Google Scholar] [CrossRef]
- Jose, S.; Nameer, P.O. The expanding distribution of the Indian Peafowl (Pavo cristatus) as an indicator of changing climate in Kerala, southern India: A modelling study using MaxEnt. Ecol. Indic. 2020, 110, 105930. [Google Scholar] [CrossRef]
- Pearson, R.G.; Raxworthy, C.J.; Nakamura, M.; Peterson, A.T. Predicting species distributions from small numbers of occurrence records: A test case using cryptic geckos in Madagascar. J. Biogeogr. 2007, 34, 102–117. [Google Scholar] [CrossRef]
- Fourcade, Y.; Engler, J.O.; Rodder, D.; Secondi, J. Mapping Species Distributions with MAXENT Using a Geographically Biased Sample of Presence Data: A Performance Assessment of Methods for Correcting Sampling Bias. PLoS ONE 2014, 9, e97122. [Google Scholar] [CrossRef] [Green Version]
- Brown, J.L. SDMtoolbox: A python-based GIS toolkit for landscape genetic, biogeographic and species distribution model analyses. Methods Ecol. Evol. 2014, 5, 694–700. [Google Scholar] [CrossRef]
- Peng, J.; Gou, X.; Chen, F.; Li, J.; Liu, P.; Zhang, Y.; Fang, K. Difference in tree growth responses to climate at the upper treeline: Qilian Juniper in the Anyemaqen Mountains. J. Integr. Plant Biol. 2008, 50, 982–990. [Google Scholar] [CrossRef] [PubMed]
- Wang, J.; Wang, Y.; Feng, J.; Chen, C.; Chen, J.; Long, T.; Li, J.; Zang, R.; Li, J. Differential Responses to Climate and Land-Use Changes in Threatened Chinese Taxus Species. Forests 2019, 10, 766. [Google Scholar] [CrossRef] [Green Version]
- Zhao, Z.; Guo, Y.; Wei, H.; Ran, Q.; Liu, J.; Zhang, Q.; Gu, W. Potential distribution of Notopterygium incisum Ting ex H. T. Chang and its predicted responses to climate change based on a comprehensive habitat suitability model. Ecol. Evol. 2020, 10, 3004–3016. [Google Scholar] [CrossRef] [PubMed]
- Yang, W.J.; Wang, Y.H.; Webb, A.A.; Li, Z.Y.; Tian, X.; Han, Z.T.; Wang, S.; Yu, P. Influence of climatic and geographic factors on the spatial distribution of Qinghai spruce forests in the dryland Qilian Mountains of Northwest China. Sci. Total Environ. 2018, 612, 1007–1017. [Google Scholar] [CrossRef]
- Zhang, L.; Yu, P.; Wang, Y.; Wang, S.; Liu, X. Biomass Change of Middle Aged Forest of Qinghai Spruce along an Altitudinal Gradient on the North Slope of Qilian Mountains. Sci. Silvae Sin. 2015, 51, 4–10. [Google Scholar] [CrossRef]
- Zhong, L.; Ma, Y.; Salama, M.S.; Su, Z. Assessment of vegetation dynamics and their response to variations in precipitation and temperature in the Tibetan Plateau. Clim. Chang. 2010, 103, 519–535. [Google Scholar] [CrossRef]
- Jianmeng, F. Spatial patterns of species diversity of seed plants in China and their climatic explanation. Biodivers. Sci. 2008, 16, 470–476. [Google Scholar] [CrossRef]
- Liu, J.; Yang, Y.; Wei, H.; Zhang, Q.; Zhang, X.; Gu, W. Assessing Habitat Suitability of Parasitic Plant Cistanche deserticola in Northwest China under Future Climate Scenarios. Forests 2019, 10, 823. [Google Scholar] [CrossRef] [Green Version]
- Tromp-van Meerveld, H.J.; McDonnell, J.J. On the interrelations between topography, soil depth, soil moisture, transpiration rates and species distribution at the hillslope scale. Adv. Water Resour. 2006, 29, 293–310. [Google Scholar] [CrossRef]
- Feeley, K.J. Distributional migrations, expansions, and contractions of tropical plant species as revealed in dated herbarium records. Glob. Chang. Biol. 2012, 18, 1335–1341. [Google Scholar] [CrossRef]
- Wolf, A.; Zimmerman, N.B.; Anderegg, W.R.L.; Busby, P.E.; Christensen, J. Altitudinal shifts of the native and introduced flora of California in the context of 20th-century warming. Glob. Ecol. Biogeogr. 2016, 25, 418–429. [Google Scholar] [CrossRef]
- He, X.; Burgess, K.S.; Yang, X.F.; Ahrends, A.; Gao, L.M.; Li, D.Z. Upward elevation and northwest range shifts for alpine Meconopsis species in the Himalaya-Hengduan Mountains region. Ecol. Evol. 2019, 9, 4055–4064. [Google Scholar] [CrossRef] [Green Version]
- Turnbull, L.A.; Crawley, M.J.; Rees, M. Are plant populations seed-limited? A review of seed sowing experiments. Oikos 2000, 88, 225–238. [Google Scholar] [CrossRef] [Green Version]
- Frost, G.V.; Epstein, H.E. Tall shrub and tree expansion in Siberian tundra ecotones since the 1960s. Glob. Chang. Biol. 2014, 20, 1264–1277. [Google Scholar] [CrossRef] [PubMed]
- Zhu, Z.C.; Piao, S.L.; Myneni, R.B.; Huang, M.T.; Zeng, Z.Z.; Canadell, J.G.; Ciais, P.; Sitch, S.; Friedlingstein, P.; Arneth, A.; et al. Greening of the Earth and its drivers. Nat. Clim. Chang. 2016, 6, 791. [Google Scholar] [CrossRef]
- Jiang, Y.; Zhuang, Q.; Schaphoff, S.; Sitch, S.; Sokolov, A.; Kicklighter, D.; Melillo, J. Uncertainty analysis of vegetation distribution in the northern high latitudes during the 21st century with a dynamic vegetation model. Ecol. Evol. 2012, 2, 593–614. [Google Scholar] [CrossRef] [PubMed] [Green Version]
- Zhang, W.X.; Miller, P.A.; Smith, B.; Wania, R.; Koenigk, T.; Doscher, R. Tundra shrubification and tree-line advance amplify arctic climate warming: Results from an individual-based dynamic vegetation model. Environ. Res. Lett. 2013, 8, 034023. [Google Scholar] [CrossRef] [Green Version]
- Druel, A.; Ciais, P.; Krinner, G.; Peylin, P. Modeling the Vegetation Dynamics of Northern Shrubs and Mosses in the ORCHIDEE Land Surface Model. J. Adv. Model. Earth Syst. 2019, 11, 2020–2035. [Google Scholar] [CrossRef]
- Holmgren, M.; Lin, C.-Y.; Murillo, J.E.; Nieuwenhuis, A.; Penninkhof, J.; Sanders, N.; Van Bart, T.; Van Veen, H.; Vasander, H.; Vollebregt, M.E.; et al. Positive shrub-tree interactions facilitate woody encroachment in boreal peatlands. J. Ecol. 2015, 103, 58–66. [Google Scholar] [CrossRef]
- Druel, A.; Peylin, P.; Krinner, G.; Ciais, P.; Viovy, N.; Peregon, A.; Bastrikov, V.; Kosykh, N.; Mironycheva-Tokareva, N. Towards a more detailed representation of high-latitude vegetation in the global land surface model ORCHIDEE (ORC-HL-VEGv1.0). Geosci. Model Dev. 2017, 10, 4693–4722. [Google Scholar] [CrossRef] [Green Version]
- Liu, L.; Wu, J.; Luo, Y.-Q.; Li, Z.-Y.; Wang, G.-C.; Han, F.-Z. Morphological and biological investigation of two pioneer Ips bark beetles in natural spruce forests in Qinghai Province, northwest China. For. Stud. China 2008, 10, 19–22. [Google Scholar] [CrossRef]
Figure 1.
Locations of three species on the Qinghai–Tibetan Plateau.

Figure 2.
Flow diagram of methodology adopted.

Figure 3.
The current potential geographical distribution of the three species.

Figure 4.
Prediction results of potential geographical distribution of three species in 2050s.

Figure 5.
Prediction results of potential geographical distribution of three species in 2070s.

Figure 6.
Intersection for Picea crassifolia, Sabina przewalskii and Potentilla parvifolia under SSP2.6, SSP4.5 and SSP8.5 scenarios.
Figure 6.
Intersection for Picea crassifolia, Sabina przewalskii and Potentilla parvifolia under SSP2.6, SSP4.5 and SSP8.5 scenarios.


Table 1.
The selection of environmental variables used in this study.
| Data Source | Symbol | Variables | Unit | Important Variables for Modelling |
|---|---|---|---|---|
| WorldClim | Bio1 | Annual mean temperature | °C | |
| Bio2 | Mean diurnal range | °C | ||
| Bio3 | Isothermality (BIO2/BIO7) (×100) | % | ||
| Bio4 | Temperature seasonality (standard deviation ×100) | °C | √ | |
| Bio5 | Max temperature of warmest month | °C | ||
| Bio6 | Min temperature of coldest month | °C | ||
| Bio7 | Temperature annual range (BIO5-BIO6) | °C | √ | |
| Bio8 | Mean temperature of wettest quarter | °C | ||
| Bio9 | Mean temperature of driest quarter | °C | ||
| Bio10 | Mean temperature of warmest quarter | °C | ||
| Bio11 | Mean temperature of coldest quarter | °C | ||
| Bio12 | Annual precipitation | mm | √ | |
| Bio13 | Precipitation of wettest month | mm | ||
| Bio14 | Precipitation of driest month | mm | √ | |
| Bio15 | Precipitation seasonality (coefficient of variation) | 1 | √ | |
| Bio16 | Precipitation of wettest quarter | mm | ||
| Bio17 | Precipitation of driest quarter | mm | ||
| Bio18 | Precipitation of warmest quarter | mm | √ | |
| Bio19 | Precipitation of coldest quarter | mm | √ | |
| DEM | ASL | Elevation | m | √ |
| SLOP | Slope | ° | √ | |
| ASPE | Aspect | ° | √ | |
| HWSD | S_GRAVEL | Subsoil gravel content | %vol | |
| S_SAND | Subsoil sand fraction | %wt | ||
| S_SILT | Subsoil silt fraction | %wt | ||
| S_CLAY | Subsoil clay fraction | %wt | √ | |
| S_USDA_TEX_CLASS | Subsoil USDA texture classification | name | ||
| S_REF_BULK_DENSITY | Subsoil reference bulk density | kg/dm3 | ||
| S_ BULK_DENSITY | Subsoil bulk density | kg/dm3 | √ | |
| S_OC | Subsoil organic carbon | % weight | ||
| S_PH_H2O | Subsoil pH (H2O) | −log(H+) | ||
| S_CEC_CLAY | Subsoil CEC (clay) | cmol/kg | √ | |
| S_CEC_SOIL | Subsoil CEC (soil) | cmol/kg | √ | |
| S_BS | Subsoil base saturation | % | √ | |
| S_TEB | Subsoil TEB | cmol/kg | ||
| S_CACO3 | Subsoil calcium carbonate | % weight | ||
| S_CASO4 | Subsoil gypsum | % weight | √ | |
| S_ESP | Subsoil sodicity (ESP) | % | ||
| S_ECE | Subsoil salinity (Elco) | dS/m |
Table 2.
The contribution and cumulative percentage of key environmental variables.
| Symbol | Variables | Picea crassifolia | Sabina przewalskii | Potentilla parvifolia | |||
|---|---|---|---|---|---|---|---|
| Contribution (%) | Cumulative Percentage (%) | Contribution (%) | Cumulative Percentage (%) | Contribution (%) | Cumulative Percentage (%) | ||
| ASPE | Aspect | 33.9 | 33.9 | 51.7 | 51.7 | 56.1 | 56.1 |
| Bio14 | Precipitation of driest month | 23.1 | 57.0 | 3.4 | 55.1 | 3.5 | 59.6 |
| ASL | Elevation | 20.2 | 77.2 | 26.0 | 81.1 | 15.9 | 75.5 |
| Bio12 | Annual precipitation | 10.7 | 87.9 | 0.0 | 81.1 | 4.9 | 80.4 |
| Bio4 | Temperature seasonality | 6.0 | 93.9 | 0.0 | 81.1 | 0.2 | 80.6 |
| S_CEC_CLAY | Subsoil CEC (clay) | 1.2 | 95.1 | 0.4 | 81.5 | 0.5 | 81.1 |
| S_BULK_DEN | Subsoil bulk density | 0.3 | 95.4 | 0.9 | 82.4 | 2.3 | 83.4 |
| S_CEC_SOIL | Subsoil CEC (soil) | 0.2 | 95.6 | 0.1 | 82.5 | 0.1 | 83.5 |
Table 3.
The area of suitable habitat for three species under different climate scenarios.
| Suitable Habitat | The Area of Potential Suitable Habitat for Three Species (km2) | The Area at Current (km2) | ||||||||
|---|---|---|---|---|---|---|---|---|---|---|
| 2050s | 2070s | |||||||||
| SSP2.6 | SSP4.5 | SSP7.0 | SSP8.5 | SSP2.6 | SSP4.5 | SSP7.0 | SSP8.5 | |||
| P. crassifolia | High | 10,271.02 | 10,171.20 | 8483.41 | 10,813.65 | 6294.73 | 4882.79 | 9386.29 | 4767.55 | 8830.95 |
| Moderately | 33,347.47 | 34,940.89 | 42,712.89 | 30,644.28 | 4143.71 | 34,927.27 | 26,032.80 | 54,663.53 | 32,876.52 | |
| Low | 55,668.94 | 47,247.23 | 57,771.42 | 53,073.74 | 43,502.34 | 58,147.09 | 48,217.26 | 48,614.71 | 57,495.57 | |
| Total | 99,287.43 | 92,359.32 | 108,967.72 | 94,531.67 | 53,940.78 | 97,957.15 | 83,636.35 | 108,045.79 | 99,203.04 | |
| S. przewalskii | High | 625.21 | 1883.79 | 361.15 | 0 | 774.02 | 1046.25 | 232.30 | 120.69 | 194.19 |
| Moderately | 7243.89 | 4968.09 | 3235.84 | 1260.40 | 3468.14 | 4416.38 | 6272.95 | 1838.42 | 3327.49 | |
| Low | 32,359.29 | 18,678.21 | 16,681.90 | 13,747.32 | 26,963.81 | 22,868.65 | 31,810.31 | 18,537.56 | 17,761.72 | |
| Total | 40,228.39 | 25,530.09 | 20,278.89 | 15,007.72 | 31,205.97 | 28,331.28 | 38,315.56 | 20,496.67 | 21,283.40 | |
| P. parvifolia | High | 3047.10 | 991.80 | 2301.20 | 1096.16 | 1153.32 | 3744.90 | 2755.82 | 915.58 | 3167.78 |
| Moderately | 20,949.47 | 13,109.41 | 18,451.36 | 9,434.38 | 14,813.53 | 15,636.56 | 13,672.01 | 19,009.42 | 21,045.65 | |
| Low | 86,588.17 | 83,692.61 | 92,607.04 | 59,658.84 | 81,386.87 | 80,101.97 | 99,566.01 | 99,144.06 | 77,965.92 | |
| Total | 110,584.74 | 97,793.82 | 113,359.60 | 70,189.38 | 97,353.72 | 99,483.43 | 115,993.84 | 119,069.06 | 102,179.35 | |
Table 4.
The average elevation of suitable habitat for three species under different climate scenarios.
Table 4.
The average elevation of suitable habitat for three species under different climate scenarios.
| Suitable Habitat | The Average Elevation under Different Climate Scenario (m) | Average Elevation at Current (m) | ||||||||
|---|---|---|---|---|---|---|---|---|---|---|
| 2050s | 2070s | |||||||||
| SSP2.6 | SSP4.5 | SSP7.0 | SSP8.5 | SSP2.6 | SSP4.5 | SSP7.0 | SSP8.5 | |||
| P. crassifolia | High | 2773 | 2834 | 2790 | 2849 | 2961 | 2891 | 2691 | 3043 | 2758 |
| Moderately | 3033 | 3000 | 3124 | 3022 | 2972 | 2964 | 2987 | 3077 | 3031 | |
| Low | 3353 | 3333 | 3374 | 3383 | 3298 | 3335 | 3077 | 3375 | 3359 | |
| S. przewalskii | High | 2597 | 3093 | 3103 | —— | 3090 | 2894 | 2764 | 2649 | 2951 |
| Moderately | 2765 | 3487 | 3305 | 3149 | 3334 | 3224 | 2775 | 2878 | 3175 | |
| Low | 3079 | 3312 | 3130 | 3049 | 3066 | 3081 | 3090 | 2996 | 3083 | |
| P. parvifolia | High | 3712 | 3987 | 3795 | 3552 | 3831 | 3728 | 3640 | 4220 | 3617 |
| Moderately | 3578 | 3597 | 3537 | 3717 | 3822 | 3605 | 3625 | 3586 | 2636 | |
| Low | 3499 | 3539 | 3502 | 3711 | 3587 | 3482 | 3520 | 3629 | 3475 | |
Publisher’s Note: MDPI stays neutral with regard to jurisdictional claims in published maps and institutional affiliations. |
© 2021 by the authors. Licensee MDPI, Basel, Switzerland. This article is an open access article distributed under the terms and conditions of the Creative Commons Attribution (CC BY) license (https://creativecommons.org/licenses/by/4.0/).
Share and Cite
MDPI and ACS Style
Hu, H.; Wei, Y.; Wang, W.; Wang, C. The Influence of Climate Change on Three Dominant Alpine Species under Different Scenarios on the Qinghai–Tibetan Plateau. Diversity 2021, 13, 682. https://0-doi-org.brum.beds.ac.uk/10.3390/d13120682
AMA Style
Hu H, Wei Y, Wang W, Wang C. The Influence of Climate Change on Three Dominant Alpine Species under Different Scenarios on the Qinghai–Tibetan Plateau. Diversity. 2021; 13(12):682. https://0-doi-org.brum.beds.ac.uk/10.3390/d13120682
Chicago/Turabian StyleHu, Huawei, Yanqiang Wei, Wenying Wang, and Chunya Wang. 2021. "The Influence of Climate Change on Three Dominant Alpine Species under Different Scenarios on the Qinghai–Tibetan Plateau" Diversity 13, no. 12: 682. https://0-doi-org.brum.beds.ac.uk/10.3390/d13120682
Note that from the first issue of 2016, this journal uses article numbers instead of page numbers. See further details here.