Article

The Role of Administrative and Secondary Data in Estimating the Costs and Effects of School and Workplace Closures due to the COVID-19 Pandemic

by
Auliya A. Suwantika
1,2,3,*,
Neily Zakiyah
1,2,
Ajeng Diantini
1,2,
Rizky Abdulah
1,2 and
Maarten J. Postma
2,4,5,6
1
Department of Pharmacology and Clinical Pharmacy, Faculty of Pharmacy, Universitas Padjadjaran, Bandung 40132, Indonesia
2
Center of Excellence in Higher Education for Pharmaceutical Care Innovation, Universitas Padjadjaran, Bandung 40132, Indonesia
3
Center for Health Technology Assessment, Universitas Padjadjaran, Bandung 40132, Indonesia
4
Unit of Global Health, Department of Health Sciences, University Medical Center Groningen (UMCG), University of Groningen, 9713 AV Groningen, The Netherlands
5
Department of Economics, Econometrics and Finance, Faculty of Economics and Business, University of Groningen, 9747 AE Groningen, The Netherlands
6
Unit of Pharmaco-Therapy, Epidemiology and Economics (PTE2), Department of Pharmacy, University of Groningen, 9713 AV Groningen, The Netherlands
*
Author to whom correspondence should be addressed.
Submission received: 14 September 2020 / Revised: 10 October 2020 / Accepted: 13 October 2020 / Published: 18 October 2020
(This article belongs to the Special Issue Challenges in Business Intelligence)

Abstract

:
As a part of mitigation strategies during a COVID-19 pandemic, the WHO currently recommends social distancing measures through school closures (SC) and work closures (WC) to control the infection spread and reduce the illness attack rate. Focusing on the use of administrative and secondary data, this study aimed to estimate the costs and effects of alternative strategies for mitigating the COVID-19 pandemic in Jakarta, Indonesia, by comparing the baseline (no intervention) with SC + WC for 2, 4, and 8 weeks as respective scenarios. A modified Susceptible-Exposed-Infected-Recovered (SEIR) compartmental model accounting for the spread of infection during the latent period was applied by taking into account a 1-year time horizon. To estimate the total pandemic cost of all scenarios, we took into account the cost of healthcare, SC, and productivity loss due to WC and illness. Next to costs, averted deaths were considered as the effect measure. In comparison with the baseline, the result showed that total savings in scenarios of SC + WC for 2, 4, and 8 weeks would be approximately $24 billion, $25 billion, and $34 billion, respectively. In addition, increasing the duration of SC and WC would increase the number of averted deaths. Scenarios of SC + WC for 2, 4, and 8 weeks would result in approximately 159,075, 173,963, and 250,842 averted deaths, respectively. A sensitivity analysis showed that the wage per day, infectious period, basic reproduction number, incubation period, and case fatality rate were found to be the most influential parameters affecting the savings and number of averted deaths. It can be concluded that all the mitigation scenarios were considered to be cost-saving, and increasing the duration of SC and WC would increase both the savings and the number of averted deaths.

1. Introduction

Since the World Health Organization (WHO) upgraded the status of the novel coronavirus disease 2019 (COVID-19) outbreak from epidemic to pandemic on 11 March 2020, the threat of this disease has been a major public health concern all over the world [1]. As a part of the mitigation strategies used during the COVID-19 pandemic, the WHO currently recommends that social distancing through school closures (SC) and workplace closures (WC) are considered as frontline pandemic mitigation strategies to control infection spread and reduce the illness attack rate [2].
As the most populous country in Southeast Asia, Indonesia has reported a steep jump in the number of deaths from COVID-19. The highest number of fatal cases was reported to be in Jakarta, the capital of Indonesia [3]. Following the WHO’s recommendations, the Jakarta administration decided to close all schools in the region from 15 March 2020. To support this policy, several institutions and companies have conducted a trial period of remote work for their employees. These policies would be reviewed at the end of the second week of implementation, depending on the development of the COVID-19 situation. However, it would be difficult for the stakeholders to conduct a comprehensive review of these policies, as the impact of such closures remains unclear [4]. Despite the fact that non-pharmacological interventions could reduce the attack rate, lower the peak mortality, and have lower costs upfront, these interventions were considered to have higher non-medical costs (e.g., productivity loss) compared with pharmacological interventions [5].
Focusing on the use of administrative and secondary data, this study aimed to estimate the costs and effects of alternative strategies for mitigating the COVID-19 pandemic in Jakarta by evaluating the health outcomes (e.g., the deaths prevented and costs) of SC + WC for 2, 4, and 8 weeks as respective scenarios, which would be compared with the baseline (no intervention). A compartmental model was developed by gathering best available data, extending the results of previous studies, and including the potential of social distancing through SC and WC for reducing the illness attack rate [6].

2. Methods

2.1. Model

We followed the approach of Goh et al. [7] and modified a Susceptible-Exposed-Infected-Recovered (SEIR) compartmental model accounting for the spread of COVID-19 infection during the latent period. Applying a 1-year time horizon analysis, the model considered 4 compartments: S, E, I, and R for the number of susceptible, exposed, infected, and recovered individuals, respectively. Individuals who are exposed (E) have had contact with an infected person but are not infectious. The dynamics of this model were characterized by a set of 4 different equations that correspond to the stage of the disease’s progression:
d S d t = R t T i n f · I S
d E d t = R t T i n f · I S E T i n c
d I d t = E T i n c I T i n f
d R d t = I T i n f
where Rt is the time varying basic reproduction number, Tinf is the infectious period, and Tinc is the incubation period [7].
At the baseline, we assumed that the outbreak would still have exponential growth and would then decline naturally once all susceptible people had developed the disease. Approximately 10.5 million of the total population in Jakarta were used to simulate the impact of the illness attack rate of SC + WC for 2, 4, and 8 weeks as the mitigation strategies of a COVID-19 pandemic in the context of health economics [8]. The transmission of infection between infectious and susceptible individuals who came into infective contact was applied stochastically in the model. Additionally, we assumed that births and natural deaths would be constant due to the rapid disease spread.
The selected parameters were derived from the literature, while also specific data on the mitigation strategy so far were applied in the model (see Figure 1). The total savings for the pandemic cost (US dollars in 2020 price level) and the number of averted deaths were determined by comparing the three aforementioned mitigation strategies with the baseline. Furthermore, sensitivity analyses were conducted to investigate the effects of different input parameters on the savings and the number of averted deaths.

2.2. Epidemiological Parameters

To estimate the number of secondary infections that each infected individual may produce, we applied the basic reproduction number (R0) at 2.2 (95% CI; 1.4–3.9) as the measure of contagiousness, according to a study in Wuhan, China [9]. We considered that the lengths of the incubation period (Tinc) and the infectious period (Tinf) would be 5.2 days (95% CI; 4.1–7.0 days) and 2.3 days (95% CI; 0–14.9 days), respectively [9]. The case fatality and hospitalization rates were estimated to be 3.7% (95% CI; 3.6–3.8%) and 18.4% (95% CI; 11.0–37.6%), respectively [10]. We applied the recovery time for mild cases, time to hospitalization, and time from the end of incubation to death at 24.7 days (95% CI; 22.9–28.1 days) [10], 7 days (95% CI; 4–9 days), and 21 days (95% CI; 17–25 days), respectively [11]. In addition, the time to hospitalization was estimated to be 7 days (95% CI; 4–9 days) [11]. To estimate the number of ICU admission, we took data into account that related to the rate of hospitalization cases requiring critical care from a previous study on the impact of non-pharmaceutical interventions to reduce COVID-19 mortality [12]. Furthermore, the reduction in the illness attack rate of SC + WC for 2 weeks (42%) was applied from a previous study that included the potential of SC and WC for reducing the illness attack rate related to a H1N1 influenza pandemic in Australia [6]. To calculate the illness attack rate of SC + WC for 4 and 8 weeks, we considered the elevated percentage of the reduction in the illness attack rate of SC only from 2 to 4 and 8 weeks from the same study [6].

2.3. Cost Parameters
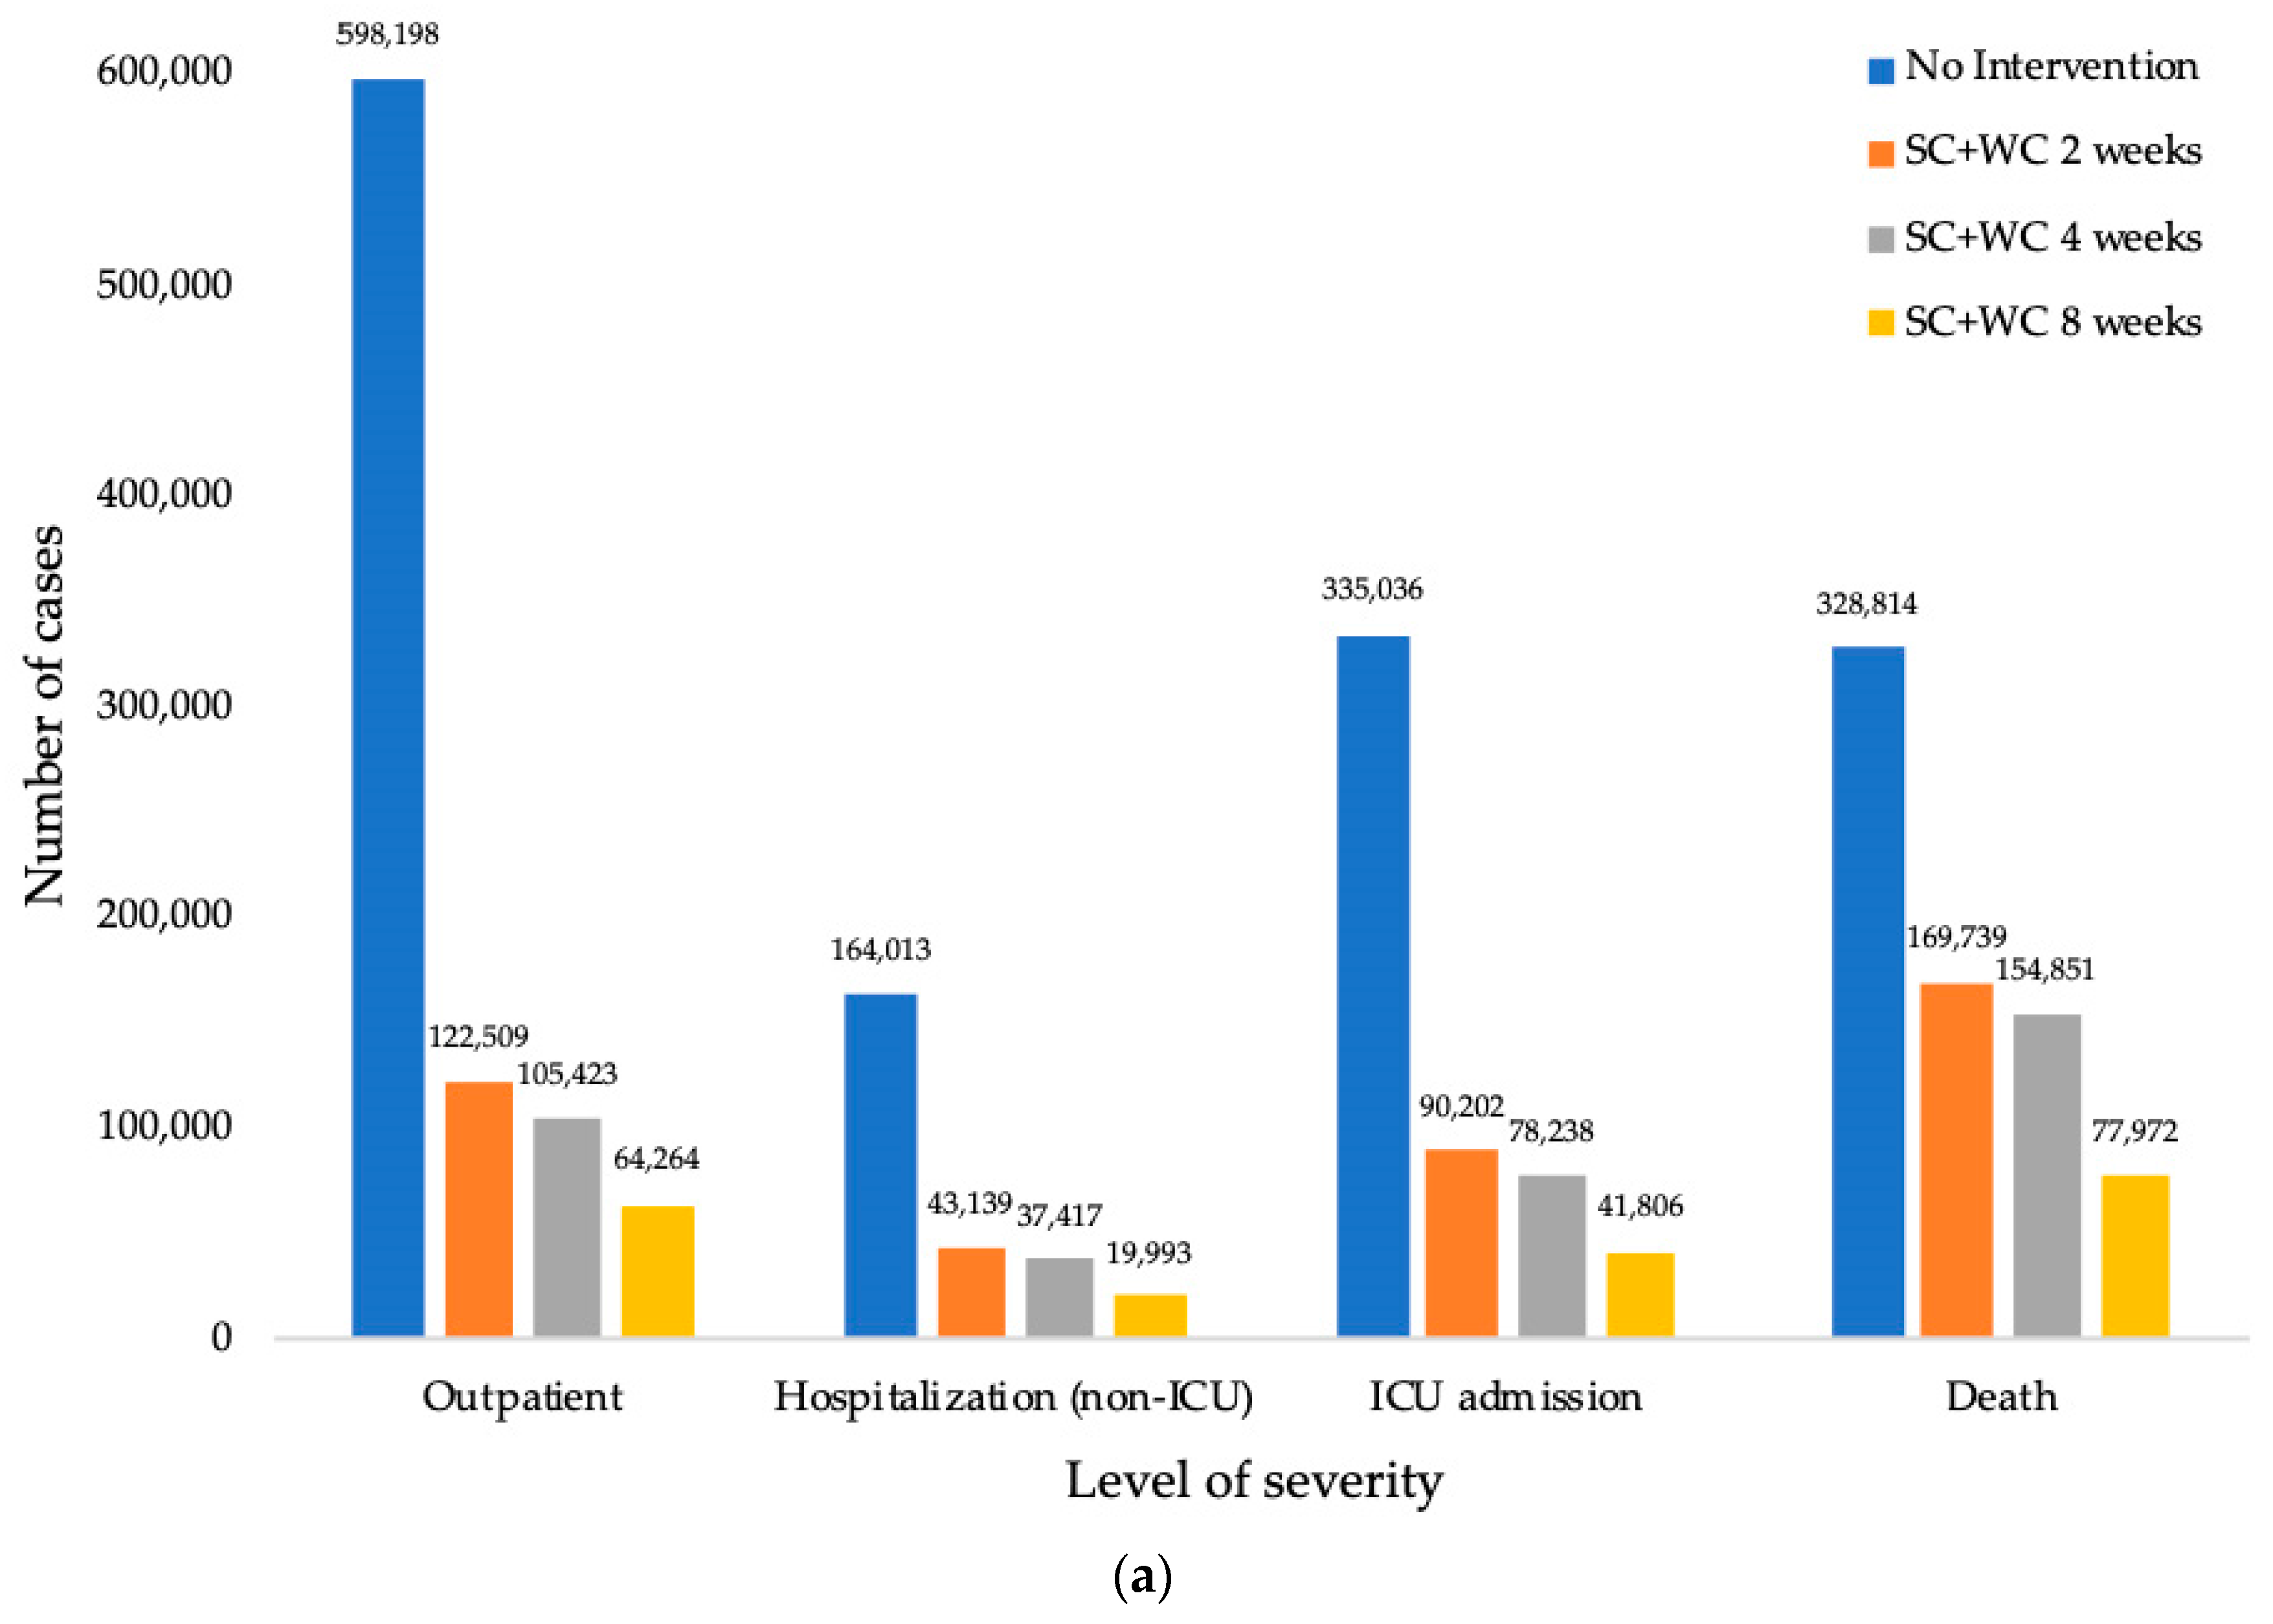
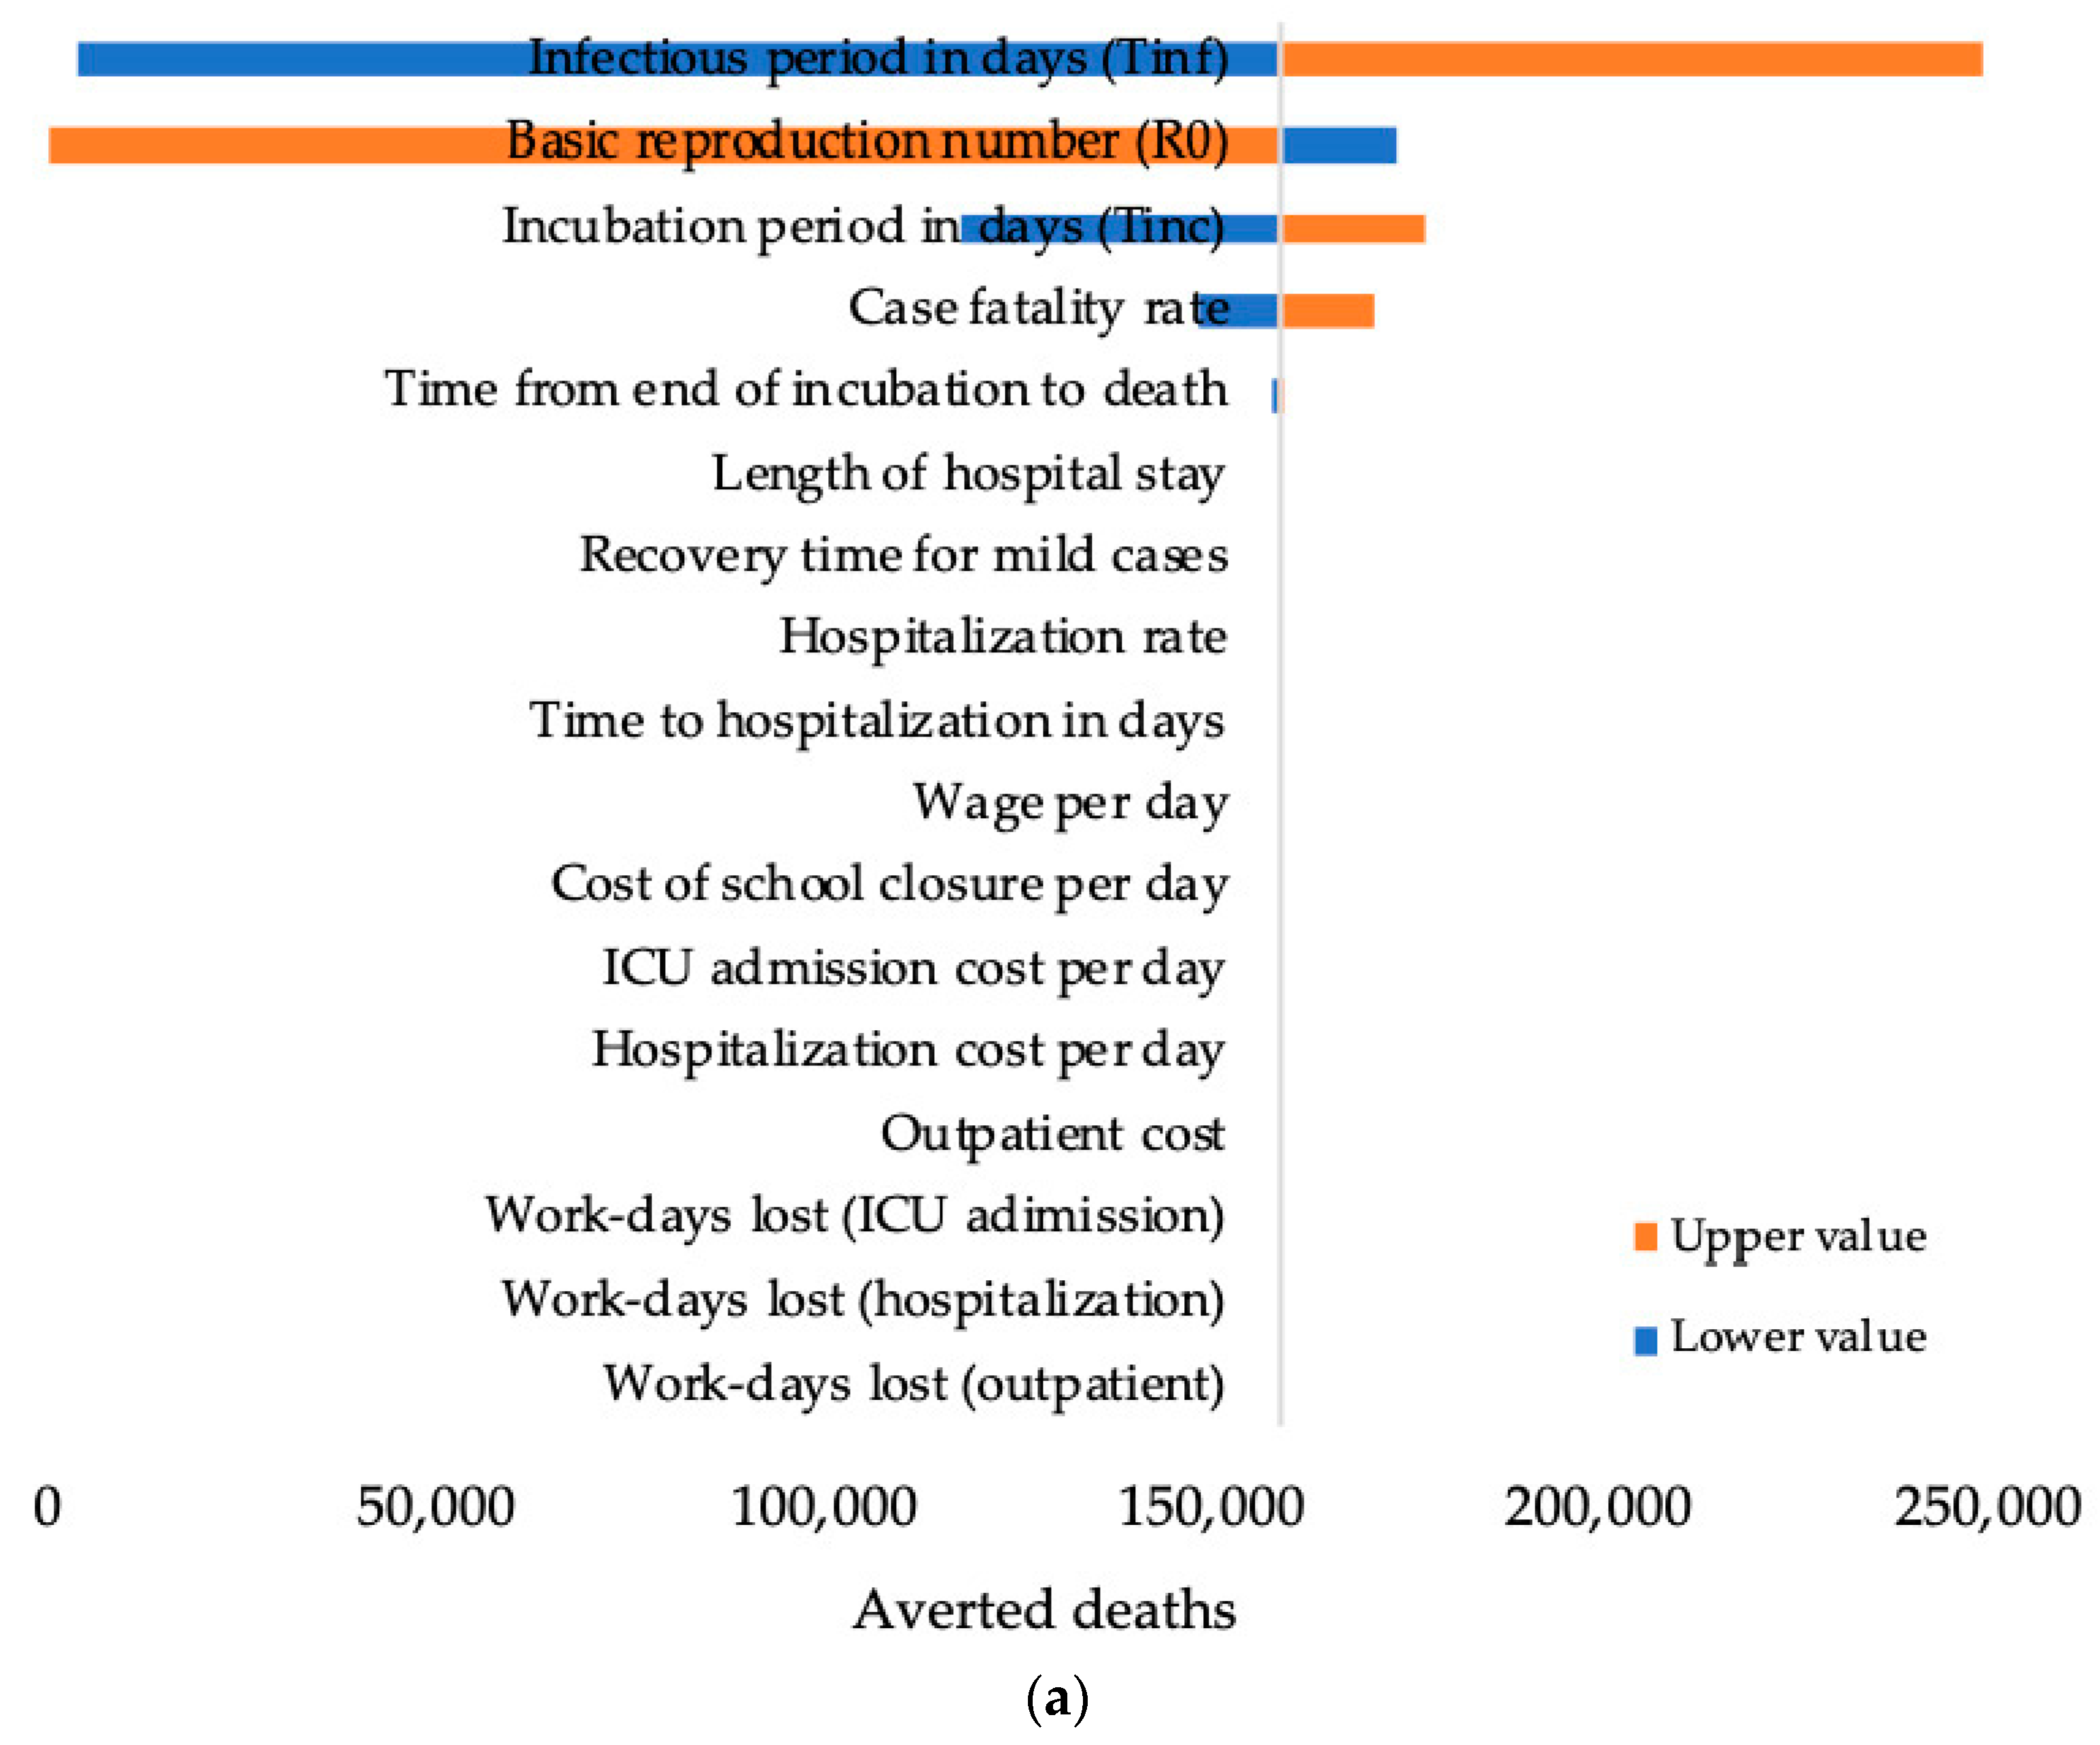
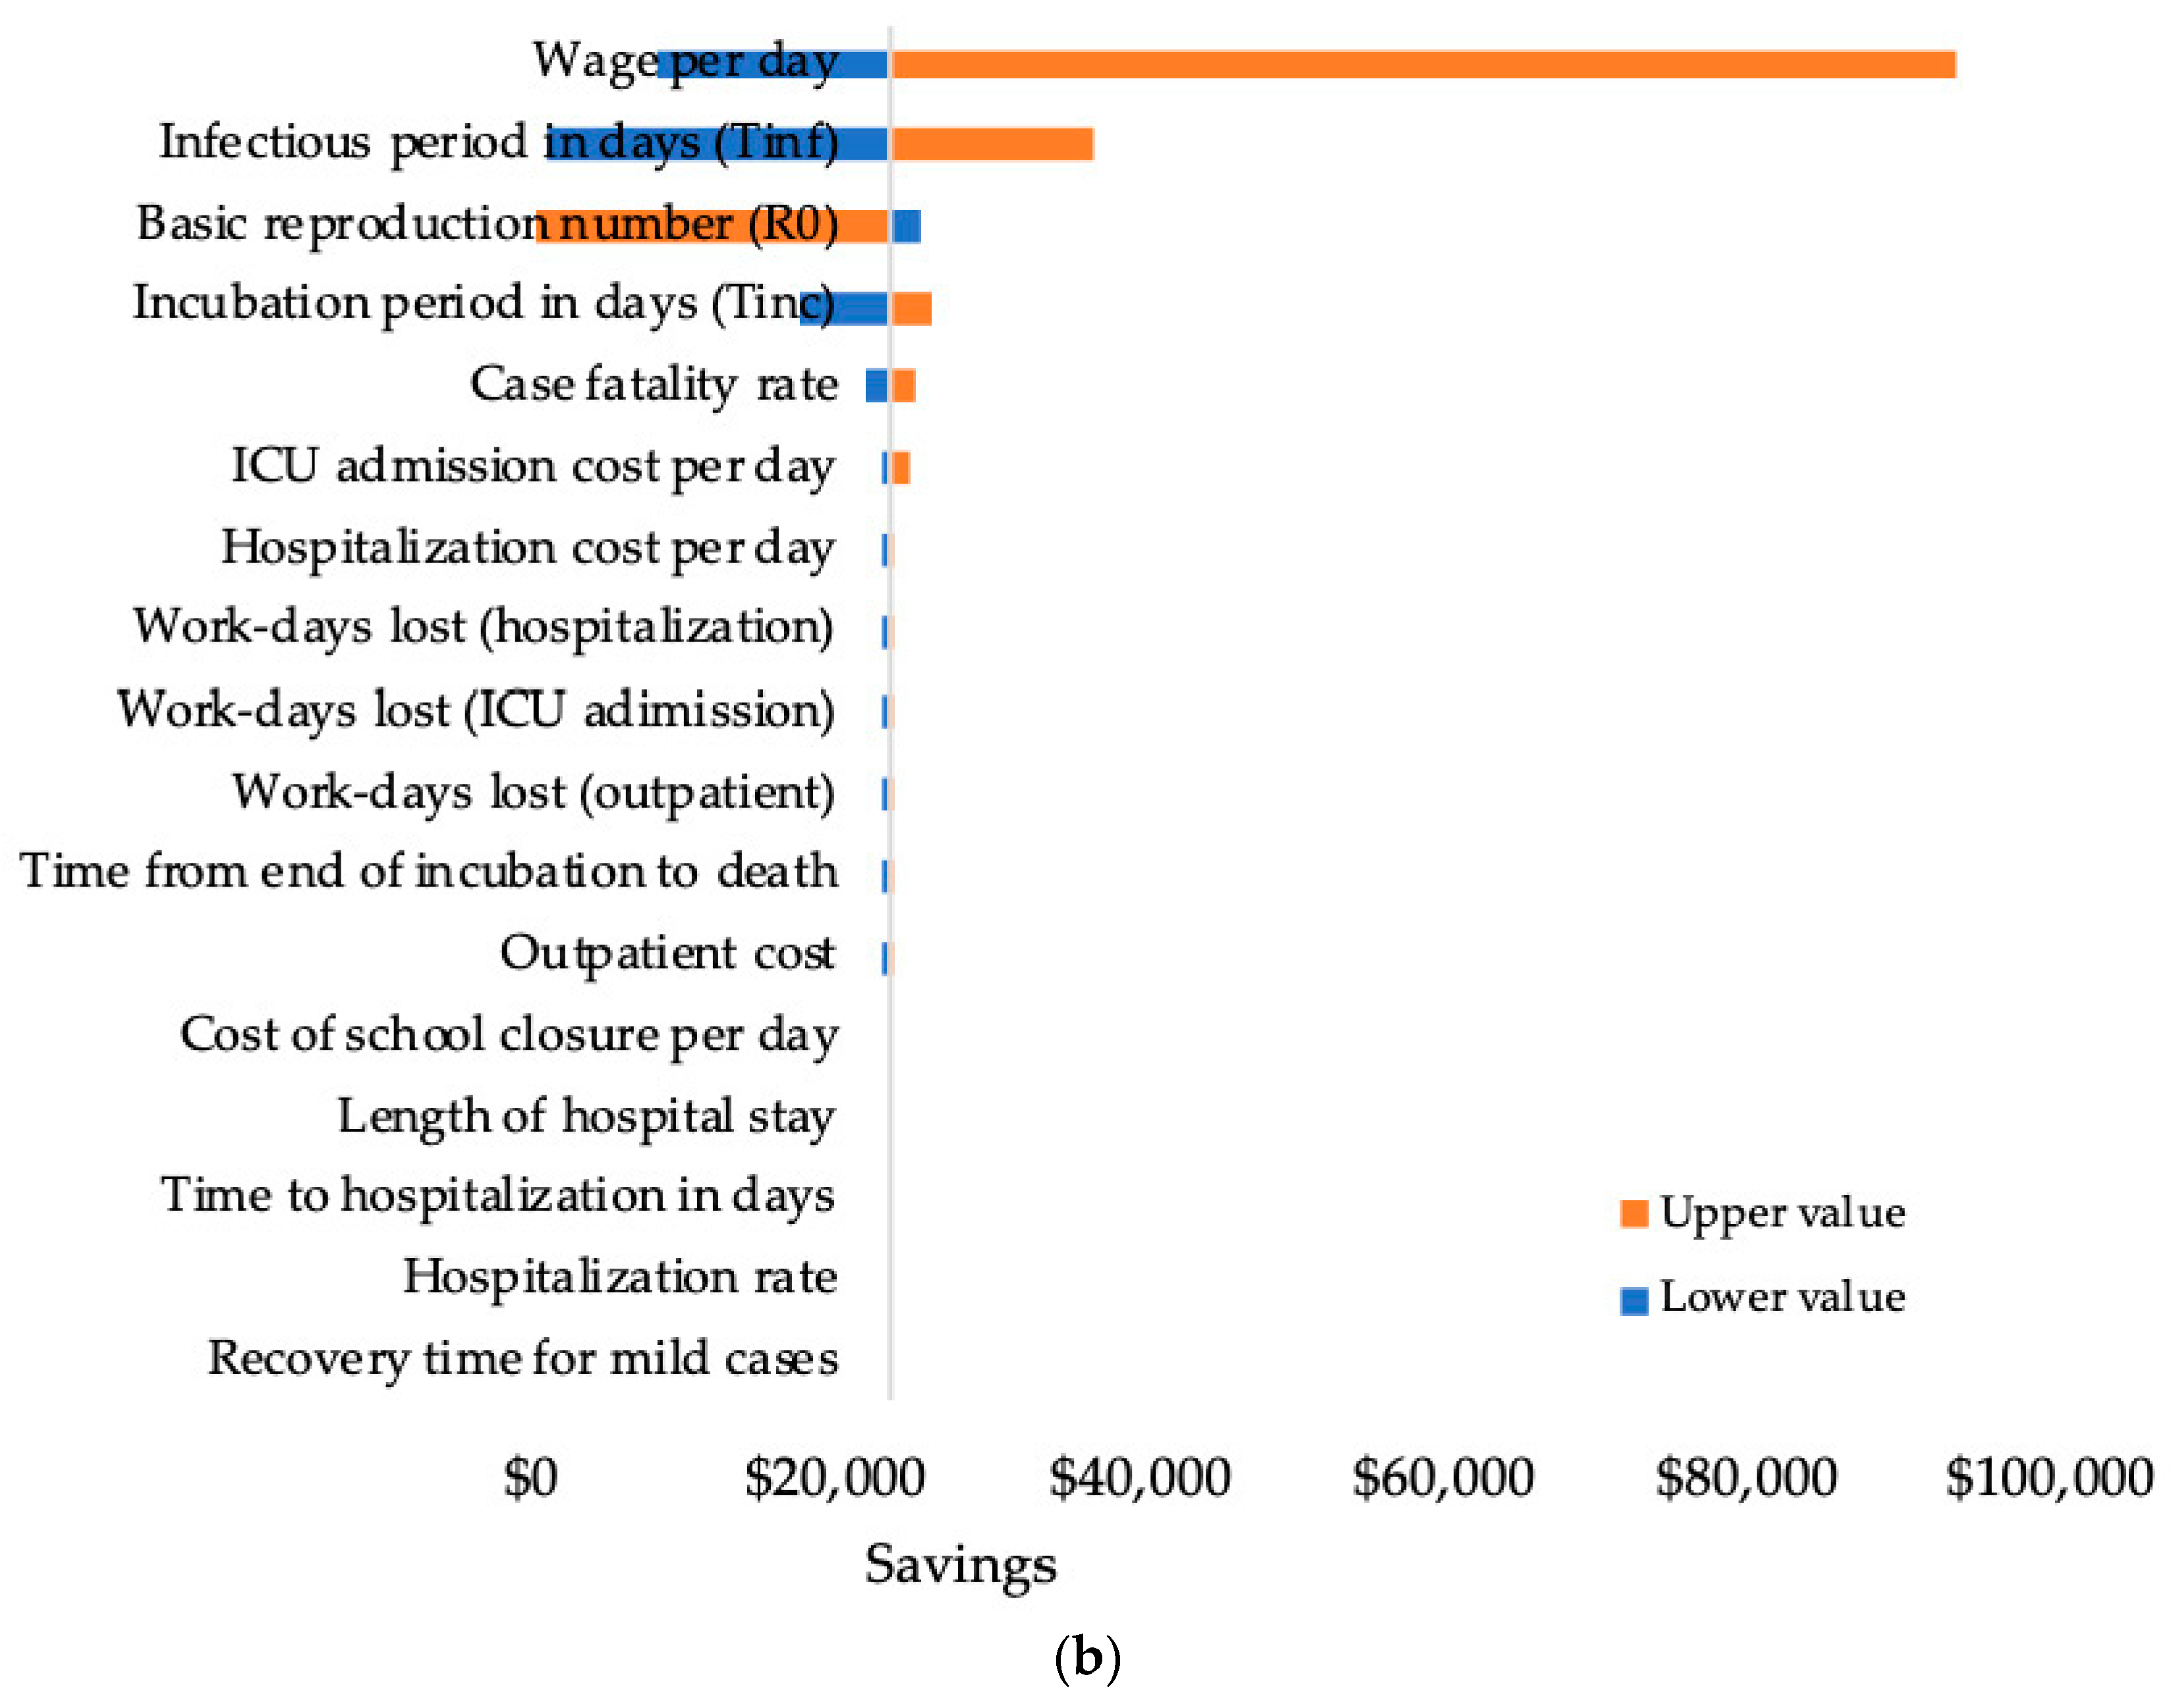
We focused on calculating the total economic cost during the COVID-19 pandemic in Jakarta from a societal perspective. The total cost considered both direct healthcare costs (e.g., the cost of medical attention due to outpatient, non-ICU hospitalization, and ICU admission) and indirect costs (e.g., productivity loss due to illness and death). In the baseline scenario, the total cost of all health events was measured by summing up the total costs of outpatients, hospitalizations, and ICU admissions. We estimated these costs by multiplying the average cost per day with the average length of stay for each age group. We applied the unit cost per day of outpatient ($24.20), hospitalization ($162.11) and ICU admission ($219.15) from a previous study on the unit cost calculation of pulmonary TB patients in Indonesia [13]. The productivity loss due to death was estimated by considering the age-specific death in each age group, the life expectancy (72.7 years), and the GDP per capita of Indonesia ($4016) [14,15]. We also estimated the productivity loss due to illness using an average wage of $11 per day and workdays lost due to illness [15]. The number of workdays lost due to GP visits, hospitalization, and ICU admission was estimated to be 25, 36, and 34 days, respectively [10,11]. To estimate the productivity loss due to WC, we assumed that the working age population (>19 years old) would lose 100% of their productivity for 2, 4, and 8 weeks in the respective scenarios. We estimated the cost of schooldays lost due to SC by considering an average daily tuition fee in public schools of $1.26 per student and the number of schooldays lost in accordance to the duration of each mitigation scenario [16]. In addition, we did not take into account childcare cost in our analysis. All the costs were reported in US dollars using the latest index adjustments of the Central Bank of Indonesia in March 2020 [17]. All the input parameters in the model can be seen in Table 1.

3. Results

At the baseline (no intervention), we estimated that the number of outpatients, hospitalizations, ICU admissions, and deaths would be 598,198, 164,013, 335,036, and 328,814, respectively, in a 1-year time horizon. The baseline scenario resulted in the highest number of cases, which was expected. The scenario of SC + WC for 8 weeks yielded the lowest number of cases, confirming that the number of outpatients, hospitalizations, ICU admissions, and deaths would be 64,264, 19,993, 41,806, and 77,972, respectively. More detailed information about the number of cases among mitigation scenarios by level of severity can be seen in Figure 2a. To give an idea about the impact of SC and WC on reducing hospitalization cases and lowering the peak of mortality rate, we presented this in Figure 2b. The results showed that scenario of SC + WC for 8 weeks would give the highest impact compared with other scenarios.
Our analysis also confirmed that the total pandemic cost would be $50 billion, $26 billion, $25 billion, and $16 billion at the baseline and with SC + WC for 2, 4, and 8 weeks, respectively. To estimate the total pandemic cost among all scenarios, we took into account the cost of healthcare, SC, and productivity loss due to WC and illness. All the mitigation scenarios were considered to be cost-saving since the interventions are more effective and less costly. More detailed information about the cost analysis can be seen in Table 2.
Compared to other costs, the productivity loss due to illness would be the highest at a higher attack rate reduction at 3%, 7%, and 26% in scenarios of SC + WC for 2, 4, and 8 weeks, respectively. The productivity loss due to WC in scenarios of SC + WC for 2, 4, and 8 weeks would be reduced by 4%, 9%, and 27%, respectively. Additionally, the healthcare cost and cost of SC would be decreased by approximately 2% and <1%, respectively, in all scenarios. More detailed information about the percentage change in the cost due to intervention can be seen in Table 2.
Varying each parameter while all others were held constant, a univariate sensitivity analysis showed that the infectious period, basic reproduction number, incubation period, and case fatality rate were the most influential parameters affecting the number of averted deaths in all mitigation scenarios (see Figure 3a). In addition, the wage per day, infectious period, basic reproduction number, incubation period, and case fatality rate were the most influential parameters affecting the savings in all mitigation scenarios (see Figure 3b). The number of averted deaths and savings was not sensitive to other parameters.

4. Discussion

Social distancing strategies, such as SC and WC, have been widely considered as alternative measures for mitigating pandemics, particularly when vaccines and antiviral drugs are under development. This study confirmed that SC and WC could potentially reduce the total number of cases in the COVID-19 pandemic in Jakarta. In a 1-year time horizon, SC + WC for 8 weeks with the longest period of SC and WC would potentially reduce the number of hospitalizations and deaths by 88% and 76%, respectively. The result of this study is similar to that of a previous study conducted by Earn et al. in 2012, which mentioned that SC could reduce the total number of cases of an influenza pandemic by 28–52% in Canada [18]. In addition, routine school holidays in France have been proven to prevent 16–18% of seasonal influenza cases [19]. The experience of an influenza pandemic in the UK also illustrated that school holidays might lead to a significant reduction in the number of cases [20]. Given the inherent reduction in contact, the benefit of implementing SC and WC in a pandemic situation could be predicted to result in the greatest reductions in terms of the peak and cumulative attack rates [21,22].
This study also estimated that the total pandemic cost would be $50 billion, $26 billion, $25 billion, and $16 billion in the baseline and the scenarios of SC + WC for 2, 4, and 8 weeks, respectively. The largest contribution to the total cost in all scenarios was found to be productivity loss due to illness (71–97%). The result of this study confirmed the result of a previous study on the cost-effectiveness of strategies for mitigating an influenza pandemic in Australia, which mentioned that the largest contribution to the total cost of the non-intervention strategy was found to be due to the productivity losses which arise from illness (approximately 91% of the total pandemic cost) [6]. Even though SC and WC could significantly reduce the incidence rate and lower the peak of mortality rate, this intervention would have huge impact on non-medical costs. Given that COVID-19 is highly infectious and virulent, the potential for productivity loss is enormous. Social distancing measures can potentially flatten the pandemic curve if they are timely and adequate and if they can count on people’s sustained support [23]. However, social distancing measures are hard to implement and strict containment are not feasible for extended or repeated periods of time in overcrowded urban spaces, such as Jakarta. These conditions are prevalent in other low- and middle-income countries [23].
Our results indicated that all the mitigation scenarios were considered to be cost-saving since the interventions are more effective and less costly. In comparison with the baseline, the total savings in scenarios of SC + WC for 2, 4, and 8 weeks would be approximately $24 billion, $25 billion, and $34 billion, respectively. In addition, increasing the duration of SC and WC would increase the effectiveness of the intervention. Scenarios of SC + WC for 2, 4, and 8 weeks would result in approximately 159,075, 173,963, and 250,842 averted deaths, respectively. The result of this study is in line with the results of two previous studies [24,25]. Although not cost-saving, a study by Mao et al. on the cost-effectiveness of WC and travel restriction for mitigating an influenza outbreak mentioned that WC is a cost-effective choice and is particularly useful when specific pharmaceutical treatments are not available in a new disease pandemic [24]. Another study by Milne et al. also highlighted that a rigorous and sustained social distancing intervention is cost-effective for mitigating illness and death due to pandemic influenza [25]. Sensitivity analysis results also confirmed the results from several previous studies [6,26], which showed that the wage per day, infectious period, basic reproduction number, incubation period, and case fatality rate were found to be the most influential parameters affecting the savings and the number of averted deaths in a study for mitigating a pandemic situation. Wage per day is strongly associated with productivity loss [6]. Additionally, the infectious period, basic reproduction number, incubation period, and case fatality rate significantly affect the peak time, peak infected proportion, and total attack rate [26].
This study is the first economic evaluation study on mitigating the COVID-19 pandemic in Indonesia. Therefore, it has several major innovative aspects. Firstly, we specifically focused our setting in Jakarta (Indonesia) and developed a SEIR compartmental model accounting for the spread of the COVID-19 infection during the latent period. The input parameters were also mostly derived from the best available data. Secondly, we focused our study from the perspective of society, which is relevant for evaluating non-pharmacological interventions that can be considered to have higher non-medical costs than pharmacological interventions. Thirdly, we developed four duration scenarios within a hypothetical model of spread on the duration of SC and WC. This is crucial, since the government of Indonesia has a policy to review this decision periodically and cost-effective strategies for mitigating pandemic are important criteria for prioritizing strategies in a pandemic situation. Regarding the limitation of this study, the lack of reliable local data on epidemiological parameters (e.g., basic reproduction number, incubation and infectious period, time to recover, hospitalization and death, case fatality and hospitalization rates, and illness attack reduction) was found to be the main limitation. To deal with this limitation, we extrapolated data from several published studies in China [9,10,11], and took this issue into account in the sensitivity analysis. Other limitations are we did not take into account possible recurrent peaks of the virus and we only applied a 1-year time horizon since vaccines were targeted by the government to be ready at the end of 2020 [27].
The COVID-19 pandemic represents public health emergencies and a worldwide economic crisis. Its negative effects cause a large output contraction, more than half of which is due to COVID-induced economic uncertainty [28]. The World Bank estimated that the economy in Indonesia is projected to decline by 2.1–3.5% in 2020, coming from an increase of 5.0% in 2019 [29]. The contagion effects of this pandemic also affect the rest of the world, specifically low- and middle-income countries. Evidence of this can be seen in an unprecedented level of risk, causing investors to suffer significant loses in an uncertain period of time, and the rise in the unemployment rate [30,31,32]. As the consequence of financial market collapse, industries have to navigate a number of truly unforeseen contagion risks [33]. Flattening the pandemic curve through social distancing measures, such as SC and WC, can increase the capacity of the health care system and assist in the development of effective treatment. The results from this study can be used to assist stakeholders in estimating the best strategies related to SC and WC policies for mitigating the COVID-19 pandemic in low- and middle-income countries using Jakarta, Indonesia, as a reference case. It can be concluded that all mitigation scenarios were considered to be cost-saving, and increasing the duration of SC and WC would increase both the savings and the number of averted deaths, which means that these non-pharmacological interventions can be considered as alternative measures for mitigating the pandemic from the economic perspective, particularly when vaccines and antiviral drugs are still under development. However, these short-term measures require constant re-evaluation in line with the rapid development of COVID-19 transmissions.

5. Conclusions

All the mitigation scenarios were considered to be cost-saving, and increasing the duration of SC and WC would increase both the savings and the number of averted deaths. In addition, the wage per day, infectious period, basic reproduction number, incubation period, and case fatality rate were found to be the most influential parameters affecting the savings and the number of averted deaths in all mitigation scenarios.

Author Contributions

Conceptualization, A.A.S. and R.A.; methodology, A.A.S. and A.D.; software, A.A.S.; validation, A.A.S. and N.Z.; formal analysis, N.Z.; investigation, A.A.S. and R.A.; resources, A.D.; writing—original draft preparation, A.A.S. and N.Z.; writing—review and editing, N.Z. and M.J.P.; supervision, A.D. and M.J.P.; project administration, R.A. All the authors have read and agreed to the published version of the manuscript. All authors have read and agreed to the published version of the manuscript.

Funding

This research was funded by Universitas Padjadjaran through the Center of Excellence in Higher Education for Pharmaceutical Care Innovation.

Conflicts of Interest

The authors declare no conflict of interest.

References

  1. WHO. Coronavirus Disease 2019 (COVID-19) Situation Report—51. Available online: https://www.who.int/docs/default-source/coronaviruse/situation-reports/20200311-sitrep-51-covid-19.pdf?sfvrsn=1ba62e57_10 (accessed on 30 March 2020).
  2. WHO. Critical Preparedness, Readiness and Response Actions for COVID-19. Available online: https://www.who.int/emergencies/diseases/novel-coronavirus-2019/technical-guidance/critical-preparedness-readiness-and-response-actions-for-covid-19 (accessed on 30 March 2020).
  3. The Jakarta Administration. COVID-19 Monitoring Data. Available online: https://corona.jakarta.go.id/data (accessed on 30 March 2020).
  4. Jackson, C.; Vynnycky, E.; Hawker, J.; Olowokure, B.; Mangtani, P. School closures and influenza: Systematic review of epidemiological studies. BMJ Open 2013, 3, e002149. [Google Scholar] [CrossRef] [PubMed] [Green Version]
  5. Perlroth, D.J.; Glass, R.J.; Davey, V.J.; Cannon, D.; Garber, A.M.; Owens, D.K. Health outcomes and costs of community mitigation strategies for an influenza pandemic in the United States. Clin. Infect. Dis. 2010, 50, 165–174. [Google Scholar] [CrossRef] [PubMed]
  6. Halder, N.; Kelso, J.K.; Milne, G.J. Cost-Effective Strategies for Mitigating a Future Influenza Pandemic with H1N1 2009 Characteristics. PLoS ONE 2011, 6, e22087. [Google Scholar] [CrossRef] [PubMed] [Green Version]
  7. Goh, G. Epidemic Calculator. Available online: http://gabgoh.github.io/COVID/index.html (accessed on 30 March 2020).
  8. Statistics of Jakarta. Population by Age and Sex in 2018. Available online: https://jakarta.bps.go.id/dynamictable/2019/09/16/58/jumlah-penduduk-provinsi-dki-jakarta-menurut-kelompok-umur-dan-jenis-kelamin-2018-.html (accessed on 30 March 2020).
  9. Li, Q.; Guan, X.; Wu, P.; Wang, X.; Zhou, L.; Tong, Y.; Ren, R.; Leung, K.S.M.; Lau, E.H.Y.; Wong, J.Y.; et al. Early transmission dynamics in Wuhan, China, of novel coronavirus-infected pneumonia. N. Engl. J. Med. 2020, 382, 1199–1207. [Google Scholar] [CrossRef] [PubMed]
  10. Verity, R.; Okell, L.C.; Dorigatti, I.; Winskill, P.; Whittaker, C.; Imai, N.; Cuomo-Dannenburg, G.; Thompson, H.; Walker, P.G.T.; Fu, H.; et al. Estimates of the severity of coronavirus disease 2019: A model-based analysis. Lancet Infect. Dis. 2020, 20, 669–677. [Google Scholar] [CrossRef]
  11. Zhou, F.; Yu, T.; Du, R.; Fan, G.; Liu, Y.; Liu, Z.; Xiang, J.; Wang, Y.; Song, B.; Gu, X.; et al. Clinical course and risk factors for mortality of adult inpatients with COVID-19 in Wuhan, China: A retrospective cohort study. Lancet 2020, 395, 1054–1062. [Google Scholar] [CrossRef]
  12. Imperial College COVID-19 Response Team. Impact of Non-Pharmaceutical Interventions (NPIs) to Reduce COVID- 19 Mortality and Healthcare Demand. Available online: https://www.imperial.ac.uk/media/imperial-college/medicine/sph/ide/gida-fellowships/Imperial-College-COVID19-NPI-modelling-16-03-2020.pdf (accessed on 30 March 2020).
  13. Hilfi, L.; Setiawati, E.P.; Djuhaeni, H.; Paramita, S.A.; Komara, R. The Differences of Unit Cost Calculation by Activity Based Costing (ABC) Method and Double Distribution (DD) Method for Category 2 of Pulmonary TB Patients in Outpatient and Inpatient of Lung Hospital. JKKI 2015, 4, 109–116. [Google Scholar]
  14. Statistics of Jakarta. Life Expectancy Years. Available online: https://ipm.bps.go.id/data/provinsi/metode/baru/3100 (accessed on 30 March 2020).
  15. Statistics of Indonesia. GDP Per Capita. Available online: https://www.bps.go.id/dynamictable/2015/10/07/957/-seri-2010-produk-domestik-regional-bruto-per-kapita-atas-dasar-harga-berlaku-menurut-provinsi-2010-2018-ribu-rupiah-.html (accessed on 30 March 2020).
  16. The Jakarta Administration. Kartu Jakarta Pintar Plus. Available online: https://kjp.jakarta.go.id/kjp2/public/informasi_umum (accessed on 30 March 2020).
  17. The Central Bank of Indonesia. Exchange Rate Information. Available online: https://www.bi.go.id/id/moneter/informasi-kurs/transaksi-bi/Default.aspx (accessed on 30 March 2020).
  18. Earn, D.J.; He, D.; Loeb, M.B.; Fonseca, K.; Lee, B.E.; Dushoff, J. Effects of school closure on incidence of pandemic influenza in Alberta, Canada. Ann. Intern. Med. 2012, 156, 173–181. [Google Scholar] [CrossRef] [PubMed] [Green Version]
  19. Cauchemez, S.; Valleron, A.-J.; Boelle, P.-Y.; Flahault, A.; Ferguson, N.M. Estimating the impact of school closure on influenza transmission from sentinel data. Nature 2008, 452, 750–754. [Google Scholar] [CrossRef] [PubMed]
  20. Eames, K.T.; Tilston, N.L.; Brooks-Pollock, E.; Edmunds, W.J. Measured Dynamic Social Contact Patterns Explain the Spread of H1N1v Influenza. PLoS Comput. Biol. 2012, 8, e1002425. [Google Scholar] [CrossRef] [PubMed] [Green Version]
  21. Jackson, C.; Mangtani, P.; Hawker, J.; Olowokure, B.; Vynnycky, E. The Effects of School Closures on Influenza Outbreaks and Pandemics: Systematic Review of Simulation Studies. PLoS ONE 2014, 9, e97297. [Google Scholar] [CrossRef] [PubMed] [Green Version]
  22. Sadique, M.S.; Adams, E.J.; Edmunds, W.J. Estimating the costs of school closure for mitigating an influenza pandemic. BMC Public Health. 2008, 8, 135. [Google Scholar] [CrossRef] [PubMed] [Green Version]
  23. Loayza, N.V.; Pennings, S. Macroeconomic Policy in the Time of COVID-19: A Primer for Developing Countries. Available online: https://openknowledge.worldbank.org/bitstream/handle/10986/33540/Macroeconomic-Policy-in-the-Time-of-COVID-19-A-Primer-for-Developing-Countries.pdf?sequence=1&isAllowed=y (accessed on 8 October 2020).
  24. Mao, L. Cost-effectiveness of workplace closure and travel restriction for mitigating influenza outbreaks: A network-based simulation. In Proceedings of the Second ACM SIGSPATIAL International Workshop on Use of GIS in Public Health, HealthGIS 2013, Orlando, FL, USA, 5–8 November 2013; pp. 77–84. [Google Scholar]
  25. Milne, G.J.; Halder, N.; Kelso, J.K. The Cost Effectiveness of Pandemic Influenza Interventions: A Pandemic Severity Based Analysis. PLoS ONE 2013, 8, e61504. [Google Scholar] [CrossRef] [PubMed] [Green Version]
  26. Nsoesie, E.O.; Beckman, R.J.; Marathe, M.V. Sensitivity Analysis of an Individual-Based Model for Simulation of Influenza Epidemics. PLoS ONE 2012, 7, e45414. [Google Scholar] [CrossRef] [PubMed]
  27. Cabinet Secretariat of the Republic of Indonesia. BPOM Head: Indonesia Owns Two Options in COVID-19 Vaccine Development. Available online: https://setkab.go.id/en/bpom-head-indonesia-owns-two-options-in-covid-19-vaccine-development/ (accessed on 8 October 2020).
  28. Baker, S.R.; Bloom, N.; Davis, S.J.; Terry, S.J. COVID-Induced Economic Uncertainty. Available online: https://www.nber.org/papers/w26983.pdf (accessed on 8 October 2020).
  29. World Bank. East Asia and Pacific in the Time of COVID-19 East Asia and Pacific Economic Update (April); World Bank: Washington, DC, USA, 2020. [Google Scholar] [CrossRef]
  30. Akhtaruzzaman, M.; Boubaker, S.; Sensoy, A. Financial contagion during COVID–19 crisis. Financ. Res. Lett. 2020, 101604. [Google Scholar] [CrossRef] [PubMed]
  31. Zhang, D.; Hu, M.; Ji, Q. Financial markets under the global pandemic of COVID-19. Financ. Res. Lett. 2020, 101528. [Google Scholar] [CrossRef] [PubMed]
  32. Coibion, O.; Gorodnichenko, Y.; Weber, M. Labor Markets during the COVID-19 Crisis: A Preliminary View. Available online: https://www.nber.org/papers/w27017.pdf (accessed on 8 October 2020).
  33. Corbet, S.; Hou, Y.; Hu, Y.; Lucey, B.; Oxley, L. Aye Corona! The contagion effects of being named Corona during the COVID-19 pandemic. Financ. Res. Lett. 2020, 101591. [Google Scholar] [CrossRef] [PubMed]
Figure 1. Schematic presentation of the methodology.
Data 05 00098 g001
Figure 2. (a) Number of cases by level of severity in a 1-year time horizon. (b) Number of hospitalization cases and deaths in a 1-year time horizon.
Data 05 00098 g002aData 05 00098 g002b
Figure 3. (a) Effects of the different input parameters on averted deaths (SC + WC 2 weeks). (b) Effects of the different input parameters on savings (SC + WC 2 weeks).
Data 05 00098 g003aData 05 00098 g003b
Table 1. Input parameters in the model.
ParametersValueRef.
Basic reproduction number (R0)2.2 (95% CI; 1.4–3.9)[9]
Incubation period (Tinc)5.2 days (95% CI; 4.1–7.0 days)[9]
Infectious period (Tinf)2.3 days (95% CI; 0–14.9 days)[9]
Time from end of incubation to death21 days (95% CI; 17–25 days)[11]
Length of hospital stay11 days (95% CI; 7–14 days)[11]
Recovery time for mild cases24.7 days (95% CI; 22.9–28.1 days)[11]
Time to hospitalization in days7 days (95% CI; 4–9 days)[11]
Case fatality rate3.7% (95% CI; 3.6%–3.8%)[10]
Hospitalization rate18.4% (95% CI; 11.0%–37.6%)[10]
Illness attack rate reduction (SC + WC 2 weeks)42% (Rt = 1.28)[6]
Illness attack rate reduction (SC + WC 4 weeks)44% (Rt = 1.23)[6]
Illness attack rate reduction (SC + WC 8 weeks)54% (Rt = 1.01)[6]
Wage per dayAverage wage = $11.00 (Min wage = $3.39; Max wage = $45.68)[15]
Cost for school closure per dayAverage cost = $1.26 (Min cost = $0.85; Max cost = $1.59)[16]
Outpatient costAverage tariff = $24.20 (Min tariff = $16.01; Max tariff = $28.80)[13]
Hospitalization cost per dayAverage tariff = $162.11 (Min tariff = $81.57; Max tariff = $364.29)[13]
ICU admission cost per dayAverage tariff = $219.15 (Min tariff = $110.27; Max tariff = $492.46)[13]
Workdays lost (outpatient)25 (95% CI; 23–28)[10,11]
Workdays lost (hospitalization)36 (95% CI; 30–42)[10,11]
Workdays lost (ICU admission)44 (95% CI; 34–54)[10,11]
Number of people10.5 million[8]
Life expectancy7267 years[14]
Time horizon1 year[7]
Table 2. (a) Cost analysis results. (b) Percentage change in the cost due to intervention.
(a) Cost Analysis Results
InterventionCosts (Million $)Savings (Million $)Averted Deaths
Healthcare CostCost of SCProductivity Loss due to WCProductivity Loss due to IllnessTotal Pandemic Cost
No Intervention$1701.99--$48,215.89$49,917.88--
SC + WC 2 weeks$455.48$20.95$1102.61$24,782.81$26,361.85$23,556.03159,075
SC + WC 4 weeks$395.04$41.90$2205.22$22,604.64$25,246.80$24,671.08173,963
SC + WC 8 weeks$211.28$83.80$4410.43$11,386.75$16,092.27$33,825.61250,842
(b) Percentage Change in the Cost due to Intervention
InterventionHealthcare CostCost of SCProductivity Loss due to WCProductivity Loss due to Illness
%%%%
No Intervention3.41% 0.00% 0.00% 96.59%
SC + WC 2 weeks1.73%1.68%0.08%0.08%4.18%4.18%94.01%2.58%
SC + WC 4 weeks1.56%1.85%0.17%0.17%8.73%8.73%89.53%7.06%
SC + WC 8 weeks1.31%2.10%0.52%0.52%27.41%27.41%70.76%25.83%
Publisher’s Note: MDPI stays neutral with regard to jurisdictional claims in published maps and institutional affiliations.

