Dataset for Assessing the Economic Performance of a Residential PV Plant: The Analysis of a New Policy Proposal


1
Department of Computer, Control and Management Engineering, Sapienza University of Rome, Via Ariosto 25, 00185 Rome, Italy
2
Department of Industrial Engineering, Information and Economics, University of L’Aquila, Via G. Gronchi 18, 67100 L’Aquila, Italy
3
Department of Law and Economics, Unitelma Sapienza–University of Rome, Viale Regina Elena 295, 00161 Roma, Italy
*
Author to whom correspondence should be addressed.
Data 2020, 5(4), 101; https://0-doi-org.brum.beds.ac.uk/10.3390/data5040101
Submission received: 9 October 2020
/
Revised: 27 October 2020
/
Accepted: 27 October 2020
/
Published: 28 October 2020
Abstract
:This data article aims at providing a data description about the manuscript entitled “The post COVID-19 green recovery in practice: assessing the profitability of a policy proposal on residential photovoltaic plants”. The definition of a business plan is a complex decision because the choice of the input data significantly influences the economic assessment of a project. An Excel file is used to construct an economic model based on the Discounted Cash Flow (DCF) methodology using Net Present Value (NPV) as an indicator. The choice of input data is defined by literature analysis, and policy proposals are identified by the Revival Decree adopted by Italian Government to contrast human and economic shock effected by COVID-19. The aggregation of these data enabled us to obtain both baseline and alternative scenarios to define if the realization of a residential photovoltaic (PV) plant is economically feasible. Similar data can be obtained for other countries according to the policy actions adopted, and this work can be easily replicated in different geographical contexts and considering varying categories of stakeholders (e.g., consumers, which are called upon to implement a green transition).
Dataset: Submitted as the Supplementary file.
Dataset License: CC-BY-SA.
1. Summary
The COVID-19 pandemic has determined a significant socio-economic shock, and the use of fossil fuels has influenced environmental degradation. Photovoltaic (PV) systems are able to favour a green transition in which economic opportunities can be associated with social benefits and environmental improvements. In this phase, policy actors play a key-role in order to identify appropriate proposals. At the same time, it is necessary to implement good practices, and often there is an issue related to the transparency of the economic assessment of projects. The need of data for the PV system is useful not only for a practical use but also to address sustainable goals [1,2] with a particular emphasis on the economic side [3].
This investigation is based on a literature review. Initially, all input data are identified according to works referred to the economic assessment of PV plants, and additionally, the economic model is improved thanks to the reviewers’ comments during previous steps of this research oriented to develop the transition towards a low-carbon society pushed by the installation of solar PV plants.
The economic assessment of the PV residential plant was performed using Discounted Cash Flow (DCF) methodology and Net Present Value (NPV) as an indicator. For this scope, all parameters (variables) involved in this analysis were selected. Furthermore, our policy proposal is based on the combination of literature analysis and policy documents useful to identify a synchronization between the growth of PV plants and the development of decentralized systems.
The dataset is built starting from a literature analysis to identify the values associated with the techno-economic variables. Based on this information, a collection of input data has been provided. Additionally, another direction is to associate values with the policy variables through the analysis of Italian Decrees oriented to promote the development of photovoltaic plants. Finally, the values defined in our proposal are based on the mix of literature and policy data.
This work underlines that:
- The identification of data is a critical step in a green project.
- The collection of data is determined by literature analysis and can be replied in developed markets.
- The policy proposals significantly influence the economic model of a green project assigning a key-weight to values associated with these data.
- Both input data and the model are oriented to result in the economic assessment of a PV plant.
2. Data Description
The assessment of projects is typically associated with the identification of input data. An appropriate tool to select adequate input data is a pre-requisite to provide a robust output. Additionally, the economic assessment follows this direction, and the profitability of a project can be obtained following three approaches:
- The identification of data according to literature analysis.
- The identification of data based on an expert panel.
- The definition of data elaborated by subjective considerations.
In some cases, it is not possible to follow the same approach for all categories of data. In this green project, we opted to use data coming from literature analysis, because they permit both reviewers and readers to immediately see the reference of this value. However, we have seen that some of these data are obtained by colleagues through expert panels (e.g., update of investment cost, purchase cost of electricity, and selling price of electricity). Both approaches are valid.
This work is based on input data from literature analysis. A list of papers was selected through the most popular scientific works search engines (e.g., Google™ Scholar, Scopus™, Web of Science™, MDPI™, Science Direct™, Sage™, Springer™, Emerald™, Taylor&Francis™ Online, and Wiley™ Online Libraries). The core of this work (residential photovoltaic system) is associated with several key-words within the title and/or abstract: (i) business plan, (ii) economic analysis, (iii) discounted cash flow analysis, (iv) profitability analysis, (v) self-consumption, and (vi) policy proposal. All periods were considered, but we assigned more relevance to recent works with a special emphasis on manuscripts related to the socio-economic crisis caused by COVID-19.
Furthermore, the renewable sector is growing thanks to the support of subsidies, and consequently, the identification of data referring to the policy adopted in the country/region analysed assumes more relevance. We checked all policy tools adopted in Italy, analysing two actions for this project:
- Decree FER1 (Renewable Energy Source).
- Revival Decree.
Within Revival Decree, an eco-bonus measure provides a subsidized tax deduction of 110% (fixed to 50% before this Decree) for the realization of new PV plants. The period of deduction is fixed at 5 years, and the amount is equally subdivided. In particular, Revival Decree identifies two different business scenarios that change in function of the maximum value of investment. The first provides tax deduction of 110% to the entire investment up to a value of 2400 €/kW, if the realization of PV plant is linked to green operations such as air conditioning or thermal insulation (PV2400 scenario). The second provides a tax deduction of 110% to the investment up to a value of 1600 €/kW, if there is not the realization also of a green operation. Finally, our policy proposal is to apply a bonus to the energy produced and self-consumed in a residential context [4]. In this case, we choose the third approach above-cited to identify the value of data.
The dataset is composed of eight Excel files, and each file shows the business plan with relative values to use as input. Within files, the NPV (output of our model) is also calculated. Specifically, the file “Tax Deduction 50%.xlsx” (provided as a Supplementary file) shows the model previous to the application of the eco-bonus, while both files, “Tax Deduction 110%-5 years-PV2400.xlsx” and “Tax Deduction 110%-5 years – PV1600.xlsx” (provided as Supplementary files), identify the scenarios in which the eco-bonus is introduced. The following step is represented by the introduction of the bonus showed in our research project [4]. The file “Tax Deduction 50%-bonus 10 years.xlsx” (provided as a Supplementary file) is applied to the scenario without eco-bonus; instead the synergy and integration between two policy tools is proposed in the following files: “Tax Deduction 110%-5 years-PV2400-bonus 5 years.xlsx”, “Tax Deduction 110%-5 years-PV2400-bonus 10 years.xlsx”, “Tax Deduction 110%-5 years—PV1600-bonus 5 years.xlsx”, and “Tax Deduction 110%-5 years—PV1600-bonus 10 years.xlsx” (provided as Supplementary files). These alternative scenarios change not only in function of business scenario but also for the value assumed by another key-variable (the period of subsidy), which is released for 5 or 10 years. All input data are proposed in Table 1.
3. Methods
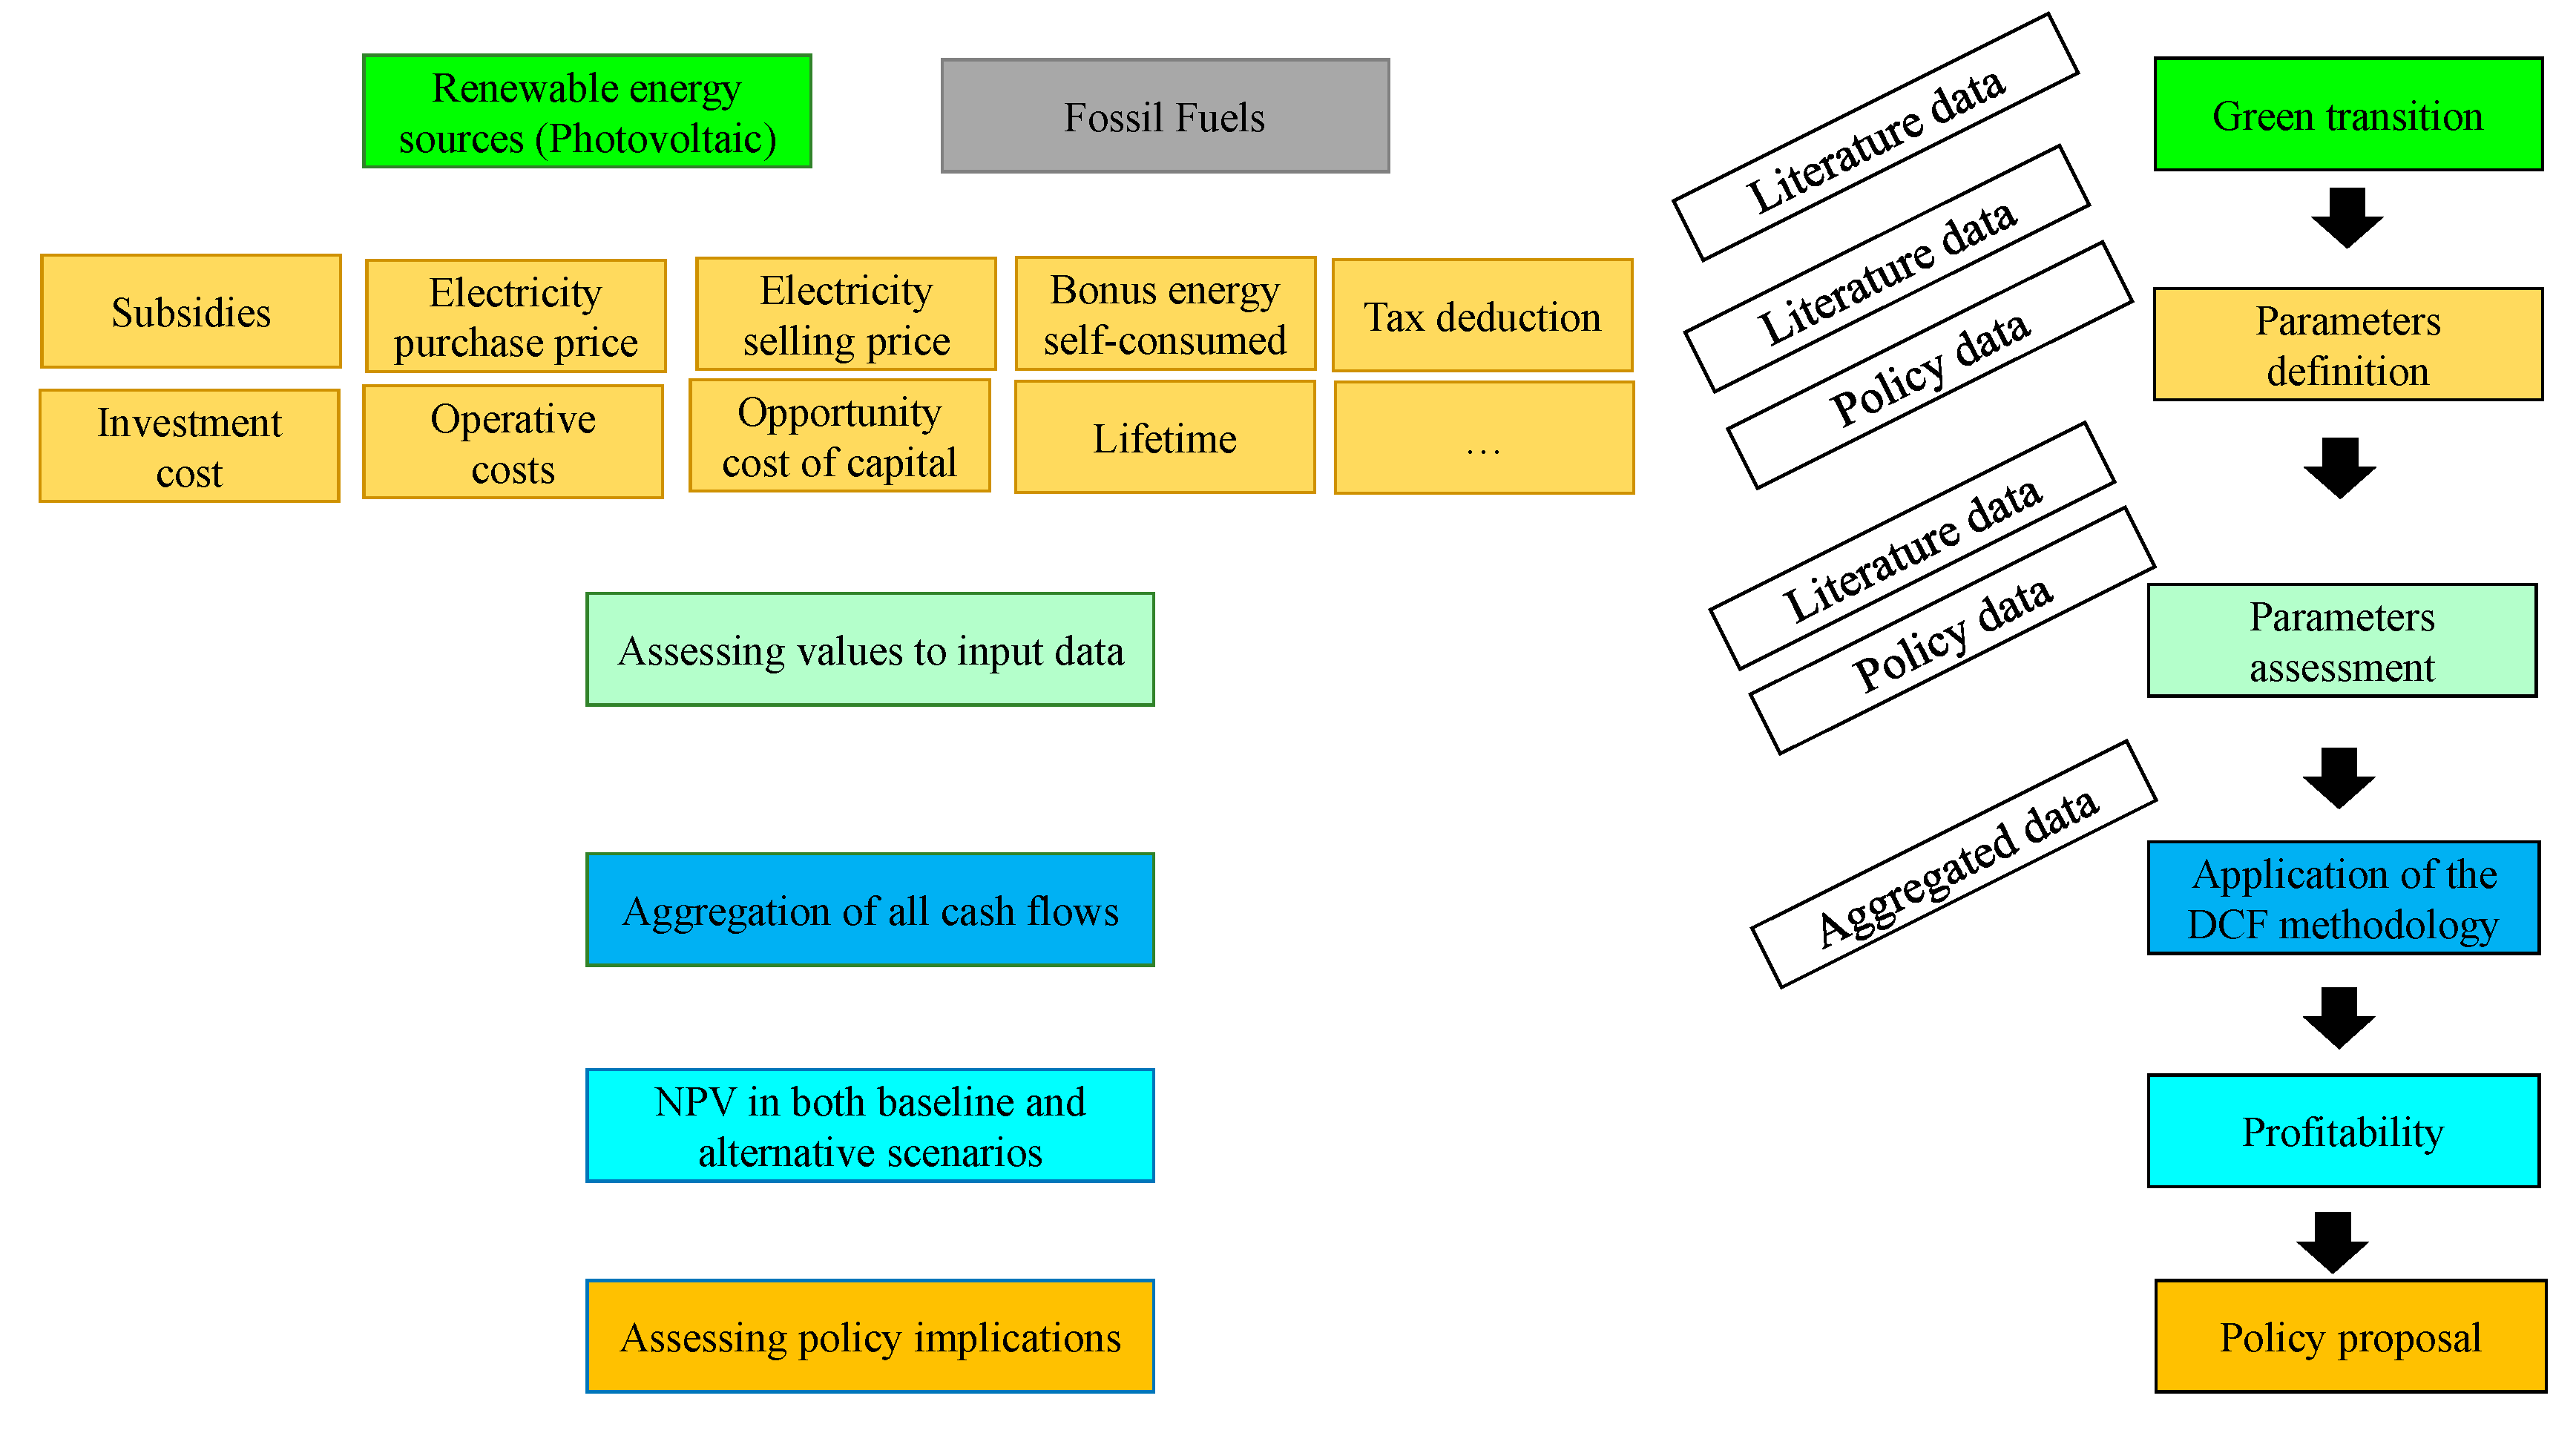
DCF is a consolidated methodology able to measure the economic impact associated with the realization of a project. It is characterized by the following aspects: (i) only cash flows are included; (ii) an incremental approach is used; and (iii) all cash flows are aggregated thanks to the use of an appropriate cost opportunity of capital. As depicted in Figure 1, the dataset construction was based on the literature and policy data.
The first step is represented by the motivation to study a PV plant as an alternative to the use of fossil fuels. There is a great number of studies that demonstrate its sustainability, and each of them is focused to assess some aspects (economic, social, policy, technological, and environmental) or their integration. Our attention is concentrated on the integration between economic feasibility and policy proposals. The following step is represented by a restriction of works proposed in literature. In fact, we focus our attention on the works titled solar or photovoltaic with the integration of the following keywords within the title of the manuscript: economic analysis, subsidies, net present value, self-consumption, and profitability. In this way, the analysis of several works is useful to identify the parameters involved in the assessment. The identification of values can be concentrated on the plant size analysed, because the value of variables such as purchase cost of electricity, selling price of electricity, and investment cost changes as a function of the residential, commercial, or industrial context. At the same time, the analysis cannot only be concentrated on the specific context, if the work is aimed not only to assess the profitability but also to suggest policy implications. In this way, the first aim is to aggregate all cash flows in order to calculate NPV: discounted cash inflow (DCI) and discounted cash outflow (DCO). This aggregation is able to define the profitability of the residential PV plant. The second aim is to evaluate the impact of policy proposals. This comparison can be enhanced through the analysis of both baseline and alternative scenarios that quantify the impact of specific measures. All case studies were obtained through the Excel programme as this is an easy way to replicate results, and the economic model is proposed as follows:
Supplementary Materials
The following are available online at https://0-www-mdpi-com.brum.beds.ac.uk/2306-5729/5/4/101/s1. Data are available in this article as eight supplementary files along with the economic model used in the profitability assessment.
Author Contributions
Conceptualization, I.D., M.G. and P.M.; methodology, I.D.; data curation, I.D.; writing—original draft preparation, I.D., M.G. and P.M.; writing—review and editing, I.D., M.G. and P.M.; supervision, M.G. and P.M.; project administration, M.G. and P.M. All authors have read and agreed to the published version of the manuscript.
Funding
This research received no external funding.
Conflicts of Interest
The authors declare no conflict of interest.
References
- Masoudinejad, M. Data-sets for indoor photovoltaic behavior in low lighting conditions. Data 2020, 5, 32. [Google Scholar] [CrossRef] [Green Version]
- Eichhorn, M.; Scheftelowitz, M.; Reichmuth, M.; Lorenz, C.; Louca, K.; Schiffler, A.; Keuneke, R.; Bauschmann, M.; Ponitka, J.; Manske, D.; et al. Spatial distribution of wind turbines, photovoltaic field systems, bioenergy, and river hydro power plants in Germany. Data 2019, 4, 29. [Google Scholar] [CrossRef] [Green Version]
- D’Adamo, I.; Falcone, P.M.; Gastaldi, M.; Morone, P. The economic viability of photovoltaic systems in public buildings: Evidence from Italy. Energy 2020, 207, 118316. [Google Scholar] [CrossRef]
- D’Adamo, I.; Gastaldi, M.; Morone, P. The post COVID-19 green recovery in practice: Assessing the profitability of a policy proposal on residential photovoltaic plants. Energy Policy 2020, 147, 111910. [Google Scholar] [CrossRef] [PubMed]
- Chiacchio, F.; Famoso, F.; D’Urso, D.; Cedola, L. Performance and Economic Assessment of a Grid-Connected Photovoltaic Power Plant with a Storage System: A Comparison between the North and the South of Italy. Energies 2019, 12, 2356. [Google Scholar] [CrossRef] [Green Version]
- Cerino Abdin, G.; Noussan, M. Electricity storage compared to net metering in residential PV applications. J. Clean. Prod. 2018, 176, 175–186. [Google Scholar] [CrossRef]
- Luthander, R.; Widén, J.; Munkhammar, J.; Lingfors, D. Self-consumption enhancement and peak shaving of residential photovoltaics using storage and curtailment. Energy 2016, 112, 221–231. [Google Scholar] [CrossRef]
- Talavera, D.L.; Muñoz-Cerón, E.; Ferrer-Rodríguez, J.P.; Pérez-Higueras, P.J. Assessment of cost-competitiveness and profitability of fixed and tracking photovoltaic systems: The case of five specific sites. Renew. Energy 2019, 134, 902–913. [Google Scholar] [CrossRef]
- Ramli, M.A.M.; Hiendro, A.; Sedraoui, K.; Twaha, S. Optimal sizing of grid-connected photovoltaic energy system in Saudi Arabia. Renew. Energy 2015, 75, 489–495. [Google Scholar] [CrossRef]
Figure 1.
Data source for economic assessment of residential PV plant.


| Acronym | Variable | Value |
|---|---|---|
| Acell | Active surface | 7 m2/kWp |
| Unitary bonus (incentive) | 10–25–40 €/MWh | |
| Cae | Administrative/electrical connection cost | 250 € |
| Cinv,unit | Unitary investment cost | 1700–1900–2100 €/kW |
| dEf | Decreased efficiency of a system | 0.7% |
| inf | Rate of inflation | 2% |
| infel | Rate of energy inflation | 1.5% |
| kf | Optimum angle of tilt | 1.13 |
| N | Lifetime of a PV system | 20 years |
| Ndebt | Period of loan | 10 years |
| NBonus | Period of bonus | 5–10 years |
| NTaxD | Period of tax deduction | 5–10 years |
| ƞbos | Balance of system efficiency | 85% |
| ƞf | Number of PV modules to be installed | function of S |
| ƞm | Module efficiency | 16% |
| pc | Electricity purchase price | 17–19–21 cent€/kWh |
| PCass | Percentage of assurance cost | 0.4% |
| PCi | Percentage of inverter cost | 15% |
| PCm | Percentage of maintenance cost | 1% |
| PCtax | Percentage of taxes cost | 40% |
| pf | Nominal power of a PV module | function of S |
| ps | Electricity selling price | 0–6 cent€/kWh |
| r | Opportunity cost of capital | 5% |
| rd | Interest rate on a loan | 3% |
| S | Plant size | 3 kW |
| tr | Average annual insolation | 1300–1450–1600 kWh/m2 × y |
| TaxDu | Unitary tax deduction | 36%–50%–110% |
| Vat | Value added tax | 10% |
| wself,c | Percentage of energy self-consumption | 0%–10%–20%–30%–40%–50%–60%–70%–80%–90%–100% |
Publisher’s Note: MDPI stays neutral with regard to jurisdictional claims in published maps and institutional affiliations. |
© 2020 by the authors. Licensee MDPI, Basel, Switzerland. This article is an open access article distributed under the terms and conditions of the Creative Commons Attribution (CC BY) license (http://creativecommons.org/licenses/by/4.0/).
Share and Cite
MDPI and ACS Style
D’Adamo, I.; Gastaldi, M.; Morone, P. Dataset for Assessing the Economic Performance of a Residential PV Plant: The Analysis of a New Policy Proposal. Data 2020, 5, 101. https://0-doi-org.brum.beds.ac.uk/10.3390/data5040101
AMA Style
D’Adamo I, Gastaldi M, Morone P. Dataset for Assessing the Economic Performance of a Residential PV Plant: The Analysis of a New Policy Proposal. Data. 2020; 5(4):101. https://0-doi-org.brum.beds.ac.uk/10.3390/data5040101
Chicago/Turabian StyleD’Adamo, Idiano, Massimo Gastaldi, and Piergiuseppe Morone. 2020. "Dataset for Assessing the Economic Performance of a Residential PV Plant: The Analysis of a New Policy Proposal" Data 5, no. 4: 101. https://0-doi-org.brum.beds.ac.uk/10.3390/data5040101