Dataset of User Reactions When Filling Out Web Questionnaires


1
Department of Intelligent Information Security Systems, MIREA—Russian Technological University, 119454 Moscow, Russia
2
Data Center, Russian Academy of Education, 119121 Moscow, Russia
*
Author to whom correspondence should be addressed.
Data 2020, 5(4), 108; https://0-doi-org.brum.beds.ac.uk/10.3390/data5040108
Submission received: 14 November 2020
/
Revised: 23 November 2020
/
Accepted: 24 November 2020
/
Published: 25 November 2020
Abstract
:This paper presents the dataset and the results of the analysis of user reactions when filling out questionnaires. Based on the analysis of 1980 results of users’ responses to simple questionnaire questions, patterns in user reactions were revealed. Data analysis shows that a user is characterized by reactions when answering a variety of questions, reflecting the individual skills of the interface, reading speed, speed of choosing an answer, which can be used to supplement personal verification in information systems. The built-in reaction time does not significantly load the data volumes for logging and transferring and does not contain confidential information. The data would be of interest for further research by specialists in the field of psychology, information security, and information systems design.
Dataset License: CC-BY-40
1. Summary
Digitalization introduced into all social spheres a widespread distribution of platforms, web portals, and computing services, which determined the development of new technologies for collecting, storing, processing and transferring the data, and, accordingly, specialized architectures of computing complexes and data transferring services over computer networks, mechanisms of interaction between clients and computer complexes using various telecommunication technologies, technologies for protecting computer networks and applications.
In distributed digital platforms and web portals that use personal data, big data is being collected and processed with the help of specialized applications using computer networks. The data are stored on internal corporate servers [1]. Special attention is paid to the tasks of differentiation and control of access in modern information systems [2]. Wide availability and mass scale of services should be accompanied by more careful control and user verification. Access control to such systems cannot be ensured only by means of information security technologies and tools; efficiency can be increased by means of interface solutions and assessment of user behavior.
Platforms processing big data have a number of common features: as a rule, a web interface or an application with access over a network, a large number of users, a complex infrastructure of a computing complex, differentiation of data access rights, various types of interfaces depending on access rights, large volumes of processed data; availability of confidential and often private (banking, medical) data; web interfaces that form queries to databases.
User verification does not provide the required control of access to data: for example, in educational systems, passing a password allows one student to complete tests remotely for several people; in health care systems, when a computer is left on, another employee can access medical data; in banking systems, anti-fraud systems are being developed that monitor transactions to identify fraudsters. An important feature of such a violation of access to big data is the absence of anomalies in the traffic level. Obtaining the individual characteristics of users [3], the peculiarities of working with the same type of user group with the system, will also increase the efficiency of data storage by structuring the most likely data requests, and will also allow one to form a client-oriented interface based on user preferences.
These features of new technologies create difficulties in access control. An obvious contradiction arises for software development: services should be accessible and understandable, they should not be difficult to use, and issues of entry and access to services should not be more difficult than the services provided. Receiving a coupon for medical services (one-click information service) should not be accompanied by a ten-minute verification or a seven-step verification of the user’s identity. Such checks are especially important, since there are personal data, and possibly medical data, and access to specialized services for personal health insurance, etc. Therefore, developers ought to develop technologies related to personal verification, but without causing negative reactions from users, thereby limiting the dissemination and availability of information services for different people.
The dataset provided is aimed at identifying personal reactions of users based on the built-in estimates of the reaction time as individual indicators of psychological and psychophysiological reactions.
There is a line of research related to user behavior analytics (UBA) [4] aimed at ensuring the security process associated with the detection of internal threats, targeted attacks and financial fraud. UBA solutions study patterns of human behavior and then apply algorithms to detect anomalies of these patterns. For example, in [5], the case is considered in which an attacker on a company’s network can use stolen credentials to secretly collect confidential data. This behavior is difficult to detect unless it triggers an access violation or data leak warning.
An alternative to multilevel technology is the use of embedded dynamic models in Internet applications [6]. An approach is known that includes obtaining characteristics of user actions (user login, mouse movement, average time between pressing a mouse button and the beginning of cursor movement, typing speed, etc.). Such studies are interesting, but they are of a limited nature—for multi-user systems, receiving, transferring, storing, and processing data are very computationally expensive. In addition, using a mouse manipulator to analyze reactions is difficult—delays are highly dependent on the producer and on the surface on which the user is currently working. In addition, web interfaces imply the use on different devices, including touch screens.
However, it seems appropriate to use psychomotor reactions [7]. Modern psychological research has revealed the reliability of data on the study of reactions obtained using web interfaces with data obtained in laboratory conditions. For example, in [8], the results of complex linguo-cognitive tests were compared, which in a way corresponds to the execution of actions from the interfaces.
The use of individual features will allow identifying the replacement of users in the process of accessing a computing service. It may be found that the user has gone through all the personal identifications but has moved away from the work device and another user continues to interact with the system. It can also be a malefactor in an office trying to take possession of confidential data from someone else’s workplace, or maybe, by agreement, one user is replaced by another: for example, when passing online testing, when in the process of passing online testing in an educational system, a verified user yields its place for a more trained one.
Thus, it is proposed to develop a technology for building a multilevel protection architecture, using the reaction time when working with interface elements as an additional user identifier. In this case, data collection will be carried out by built-in software, and interface elements will be transferred to the system.
The use of the proposed approach can also be applied in other applications—for assessing the difficulties with interface elements for certain categories of users [9], measuring reactions will allow [10] service developers to adapt interfaces to the capabilities of the target audience, and can also be used as built-in personal diagnostic elements in working memory simulators.
2. Data Description
The presented dataset shows user reactions when conducting a mass survey using the DigitalPsyTools platform [11].
The table below shows the reactions of 1980 students when answering four questions.
Question No. 1. The basis of training is the (DemStEducationType2):
- 1
- Budget
- 2
- Contract/extrabudgetary
- 3
- Target (contract on targeted training with subsequent employment)
Question No 2. Have you entered the specialty you wanted? (DemStCareerTrueChoice):
- 1
- Yes
- 2
- No
Question No. 3. Specify the profile of your education (which you are getting now) (DemStEducationProfile):
- 1
- Technical
- 2
- Humanitarian
- 3
- Natural sciences
- 4
- No profile
Question No. 4. Training program (DemStUniversityYear):
- 1
- Bachelor course
- 2
- Master study
- 3
- Specialty
- 4
- Postgraduate studies
For each of the questions, it was necessary to choose the answer options.
For question No 1—one of three options.
For question No 2—one of two options.
For question No 3—one of four options.
For question No 4—one of five options.
The questionnaire is organized in the form of a web interface, transmitted in the platform in the form of an archive. After receiving the archive with the survey, the archive is unpacked on the client’s device and loaded into the browser. In each element of the survey, the answer and the reaction time in ms are recorded (from the moment of loading until the choice of the answer and pressing the next button), that is, the user will read the question, choose the desired option and, if finished, click the next button. The entire survey was large and included cognitive tests and the user was interested in going to the next page. The data are transmitted to the platform after the end of the entire survey, or after the user closes the web page. This ensures that the networks do not interfere with the response time estimates.
3. Methods
The hypothesis of the analysis of data on the reaction time consisted of the possibility of determining the dependence in the reactions of users when working with interface elements when answering a question asked, as well as the possibility of determining individual psychomotor reactions when working with the interface.
Data analysis showed the consistency of the hypothesis.
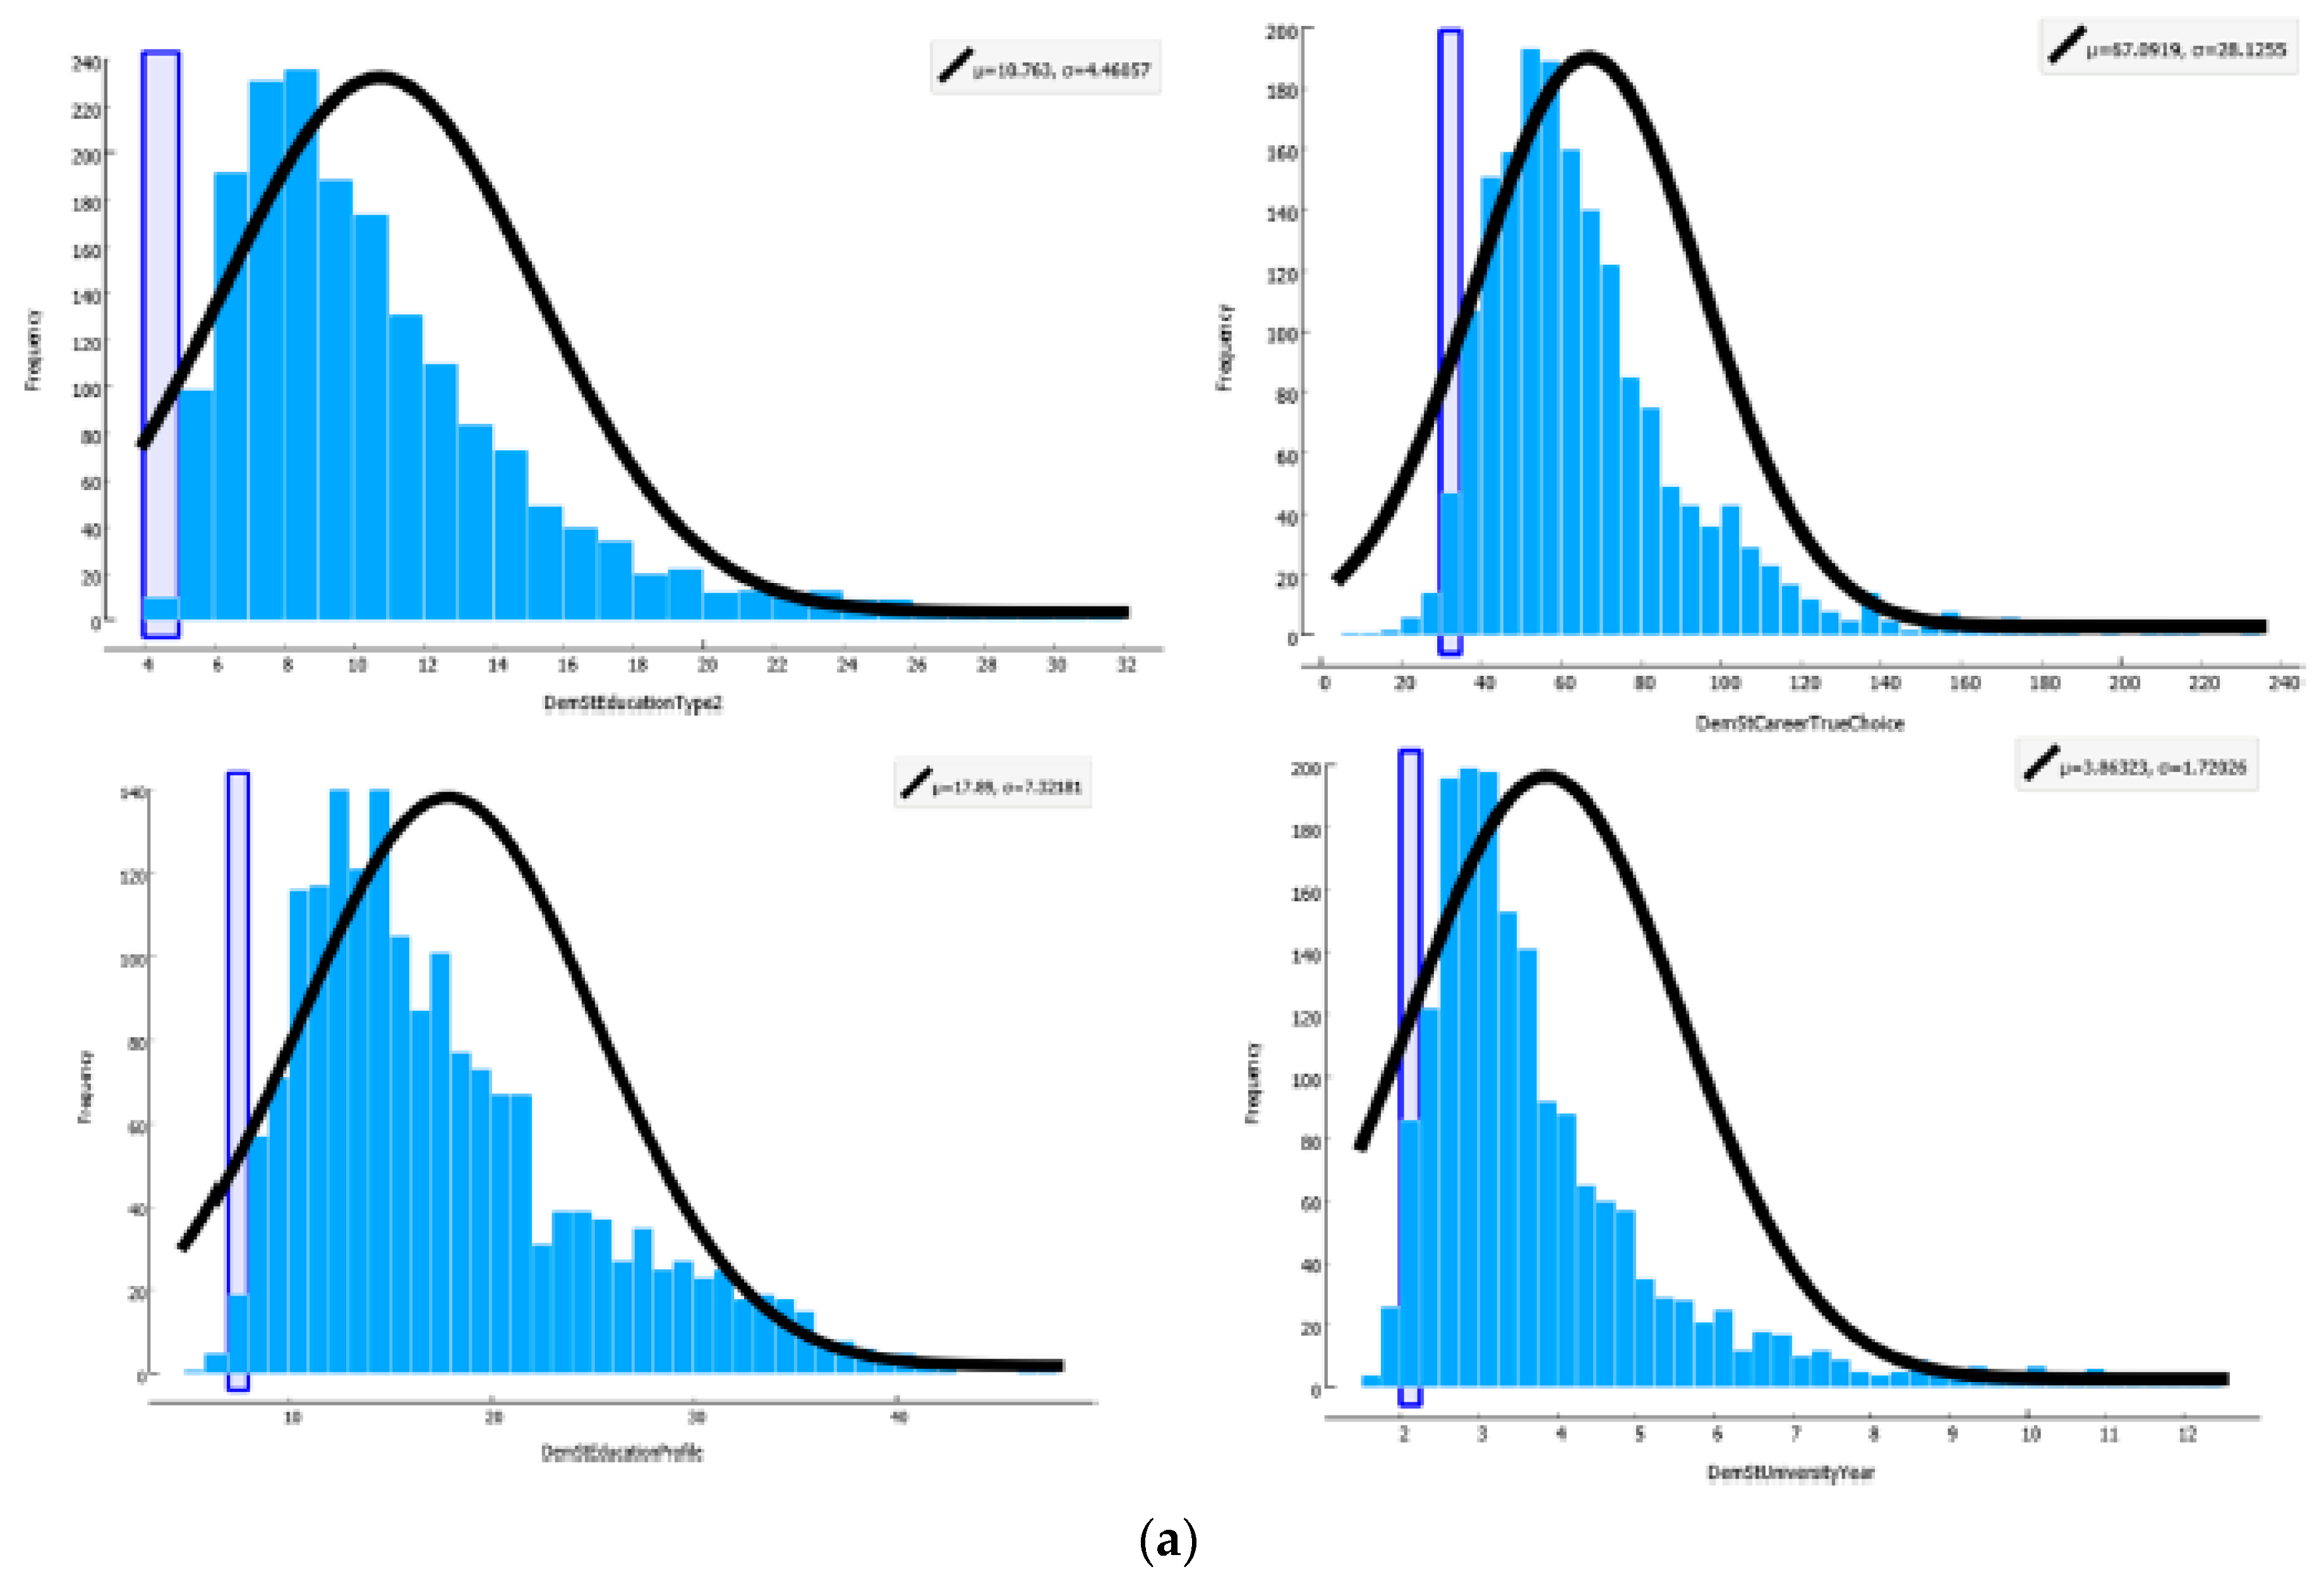
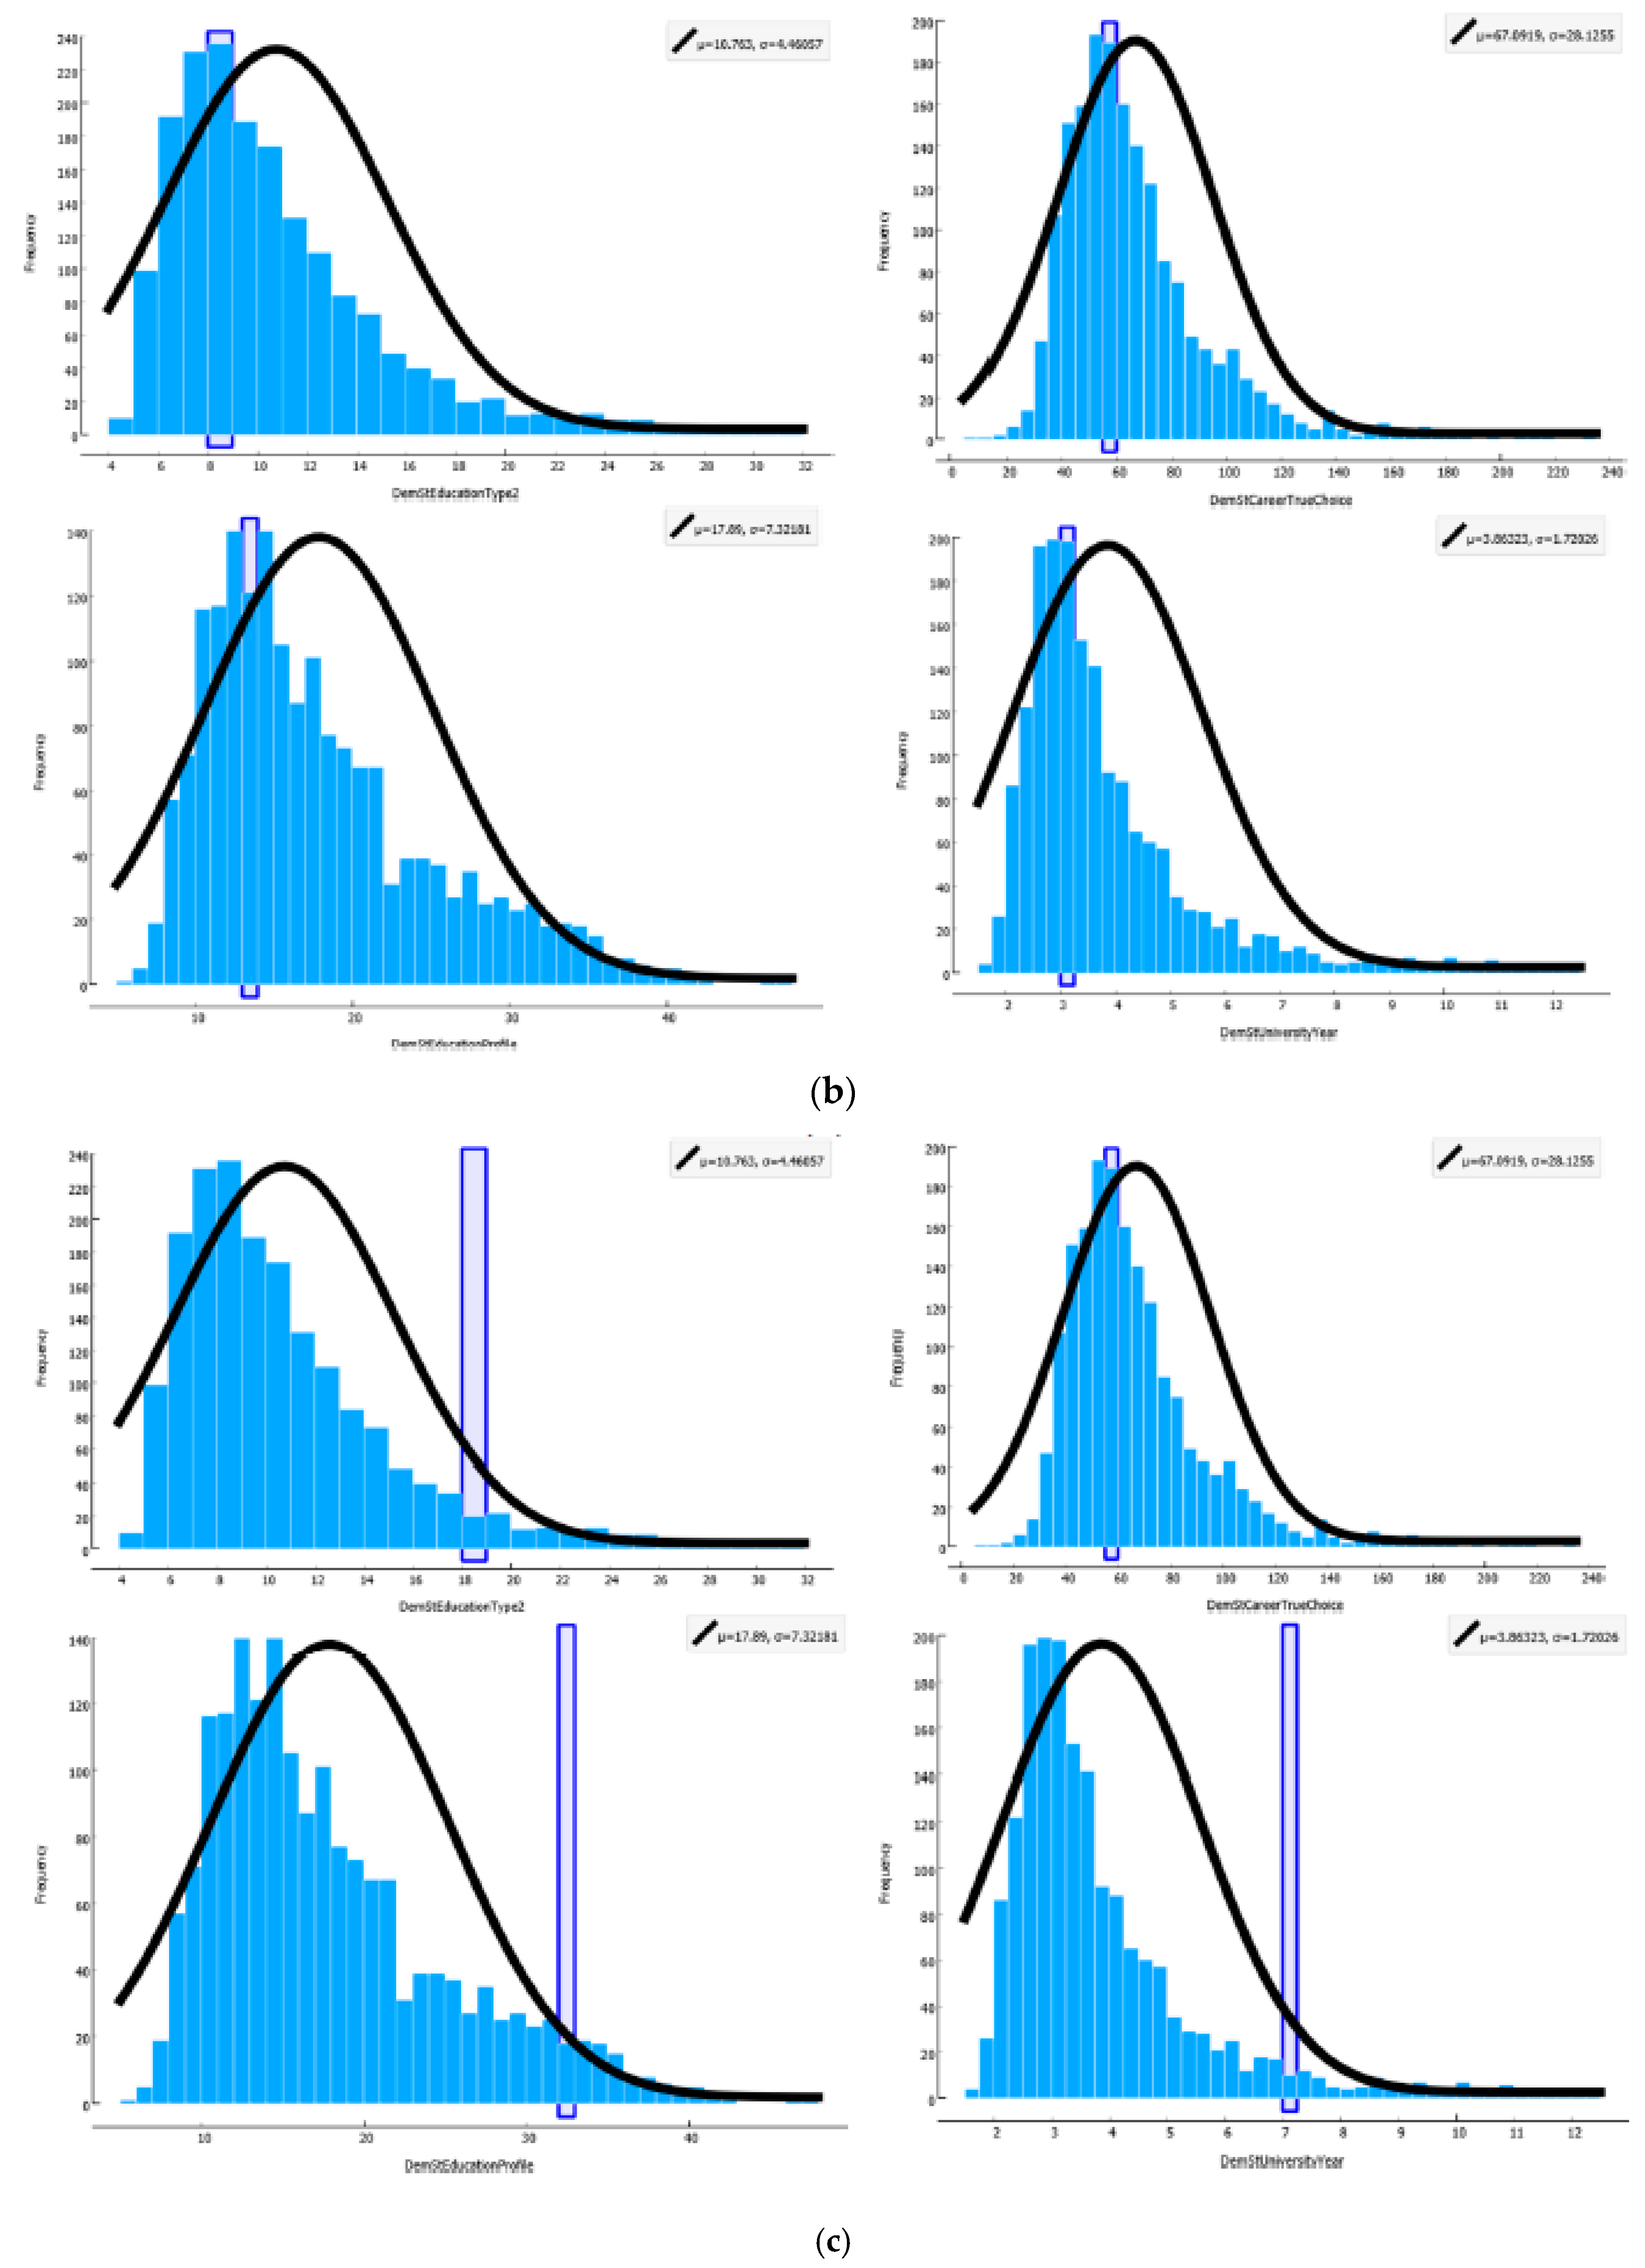
Figure 3 shows the plotted histograms for each question and shows the individual reactions of three randomly selected users (45, 119, 329). The results presented show that fast responses (Figure 3a) are characteristic of answering all questions, medium and long responses (Figure 3b,c) are preserved when the question and the number of answer options change. Using the dataset presented, the reactions of other users can be seen and studied; the pattern is visible on the entire sample (1980).
Based on the preliminary results of the analysis, it can be concluded that these reactions can be studied for further research when planning and conducting psychological tests, including the use of web interfaces.
The data can be used for validation and additional verification of users participating in surveys and using interfaces.
4. Conclusions
It is proposed to expand technologies for user verification by analyzing reactions from interactions with the interface. As a characteristic that can be measured without overloading communication channels and is independent of the type of device used, the response time is proposed, measured as the execution of actions with the interface.
The results of experimental research using a digital platform of mass psychological research are presented. For the research, data from a mass survey were used when answering (in the form of a choice from the available options) the questionnaire questions about the level of education. Analysis of the data on the response time showed the possibility of standardization and the same response rates when answering different questions.
It seems relevant to use artificial intelligence tools to identify hidden dependencies in data. It is possible to use the data to improve and personalize the interface.
Author Contributions
Conceptualization, S.M. and E.N.; methodology, S.M. and E.N.; software, D.I.; formal analysis, A.S.; data curation, E.N.; writing—original draft preparation, S.M. and E.N.; writing—review and editing, D.I. and A.S.; visualization, A.S.; supervision, S.M. All authors have read and agreed to the published version of the manuscript.
Funding
This research was funded by Russian Foundation for Basic Research, grant number 17-29-02198.
Conflicts of Interest
The authors declare no conflict of interest.
References
- Nikulchev, E.; Ilin, D.; Kolyasnikov, P.; Belov, V.; Zakharov, I.; Malykh, S. Programming technologies for the development of web-based platform for digital psychological tools International. J. Adv. Comput. Sci. Appl. 2018, 9, 34–45. [Google Scholar] [CrossRef]
- Izergin, D.A.; Eremeev, M.A.; Magomedov, S.G.; Smirnov, S.I. Information security evaluation for Android mobile operating system. Russ. Technol. J. 2019, 7, 44–55. [Google Scholar] [CrossRef]
- Sancho, J.C.; Caro, A.; Ávila, M.; Bravo, A. New approach for threat classification and security risk estimations based on security event management. Future Gener. Comput. Syst. 2020, 113, 488–505. [Google Scholar] [CrossRef]
- Csaba, K.; Péter, H.B. Analysis of Cyberattack Patterns by User Behavior Analytics. AARMS Acad. Appl. Res. Mil. Sci. 2018, 17, 101–114. [Google Scholar]
- Lee, J.; Kim, J.; Kim, I.; Han, K. Cyber threat detection based on artificial neural networks using event profiles. IEEE Access 2019, 7, 165607–165626. [Google Scholar] [CrossRef]
- Mironov, V.; Gusarenko, A.; Yusupova, N.; Smetanin, Y. Json documents processing using situation-oriented databases. Acta Polytech. Hung. 2020, 17, 29–40. [Google Scholar] [CrossRef]
- Grigoriev, V.K.; Ilyushechkin, A.S.; Ovchinnikov, M.A. Quality assessment of a user interface based on the mental time of performing the user tasks of the subject area. Russ. Technol. J. 2019, 7, 38–47. [Google Scholar] [CrossRef]
- Kim, J.; Gabriel, U.; Gygax, P. Testing the effectiveness of the Internet-based instrument PsyToolkit: A comparison between web-based (PsyToolkit) and lab-based (E-Prime 3.0) measurements of response choice and response time in a complex psycholinguistic task. PLoS ONE 2019, 14, e0221802. [Google Scholar] [CrossRef] [PubMed]
- Anrijs, S.; Ponnet, K.; De Marez, L. Development and psychometric properties of the Digital Difficulties Scale (DDS): An instrument to measure who is disadvantaged to fulfill basic needs by experiencing difficulties in using a smartphone or computer. PLoS ONE 2020, 15, e0233891. [Google Scholar] [CrossRef] [PubMed]
- Moret-Tatay, C.; Beneyto-Arrojo, M.J.; Gutierrez, E.; Boot, W.R.; Charness, N. A spanish adaptation of the computer and mobile device proficiency questionnaires (CPQ and MDPQ) for older adults. Front. Psychol. 2019, 10, 1165. [Google Scholar] [CrossRef] [PubMed]
- Nikulchev, E.; Kolyasnikov, P.; Ilin, D.; Kasatonov, S.; Biryukov, D.; Zakharov, I. Selection of Architectural Concept and Development Technologies for the Implementation of aWeb-Based Platform for Psychology Research. Adv. Intell. Syst. Comput. 2019, 858, 672–685. [Google Scholar] [CrossRef]
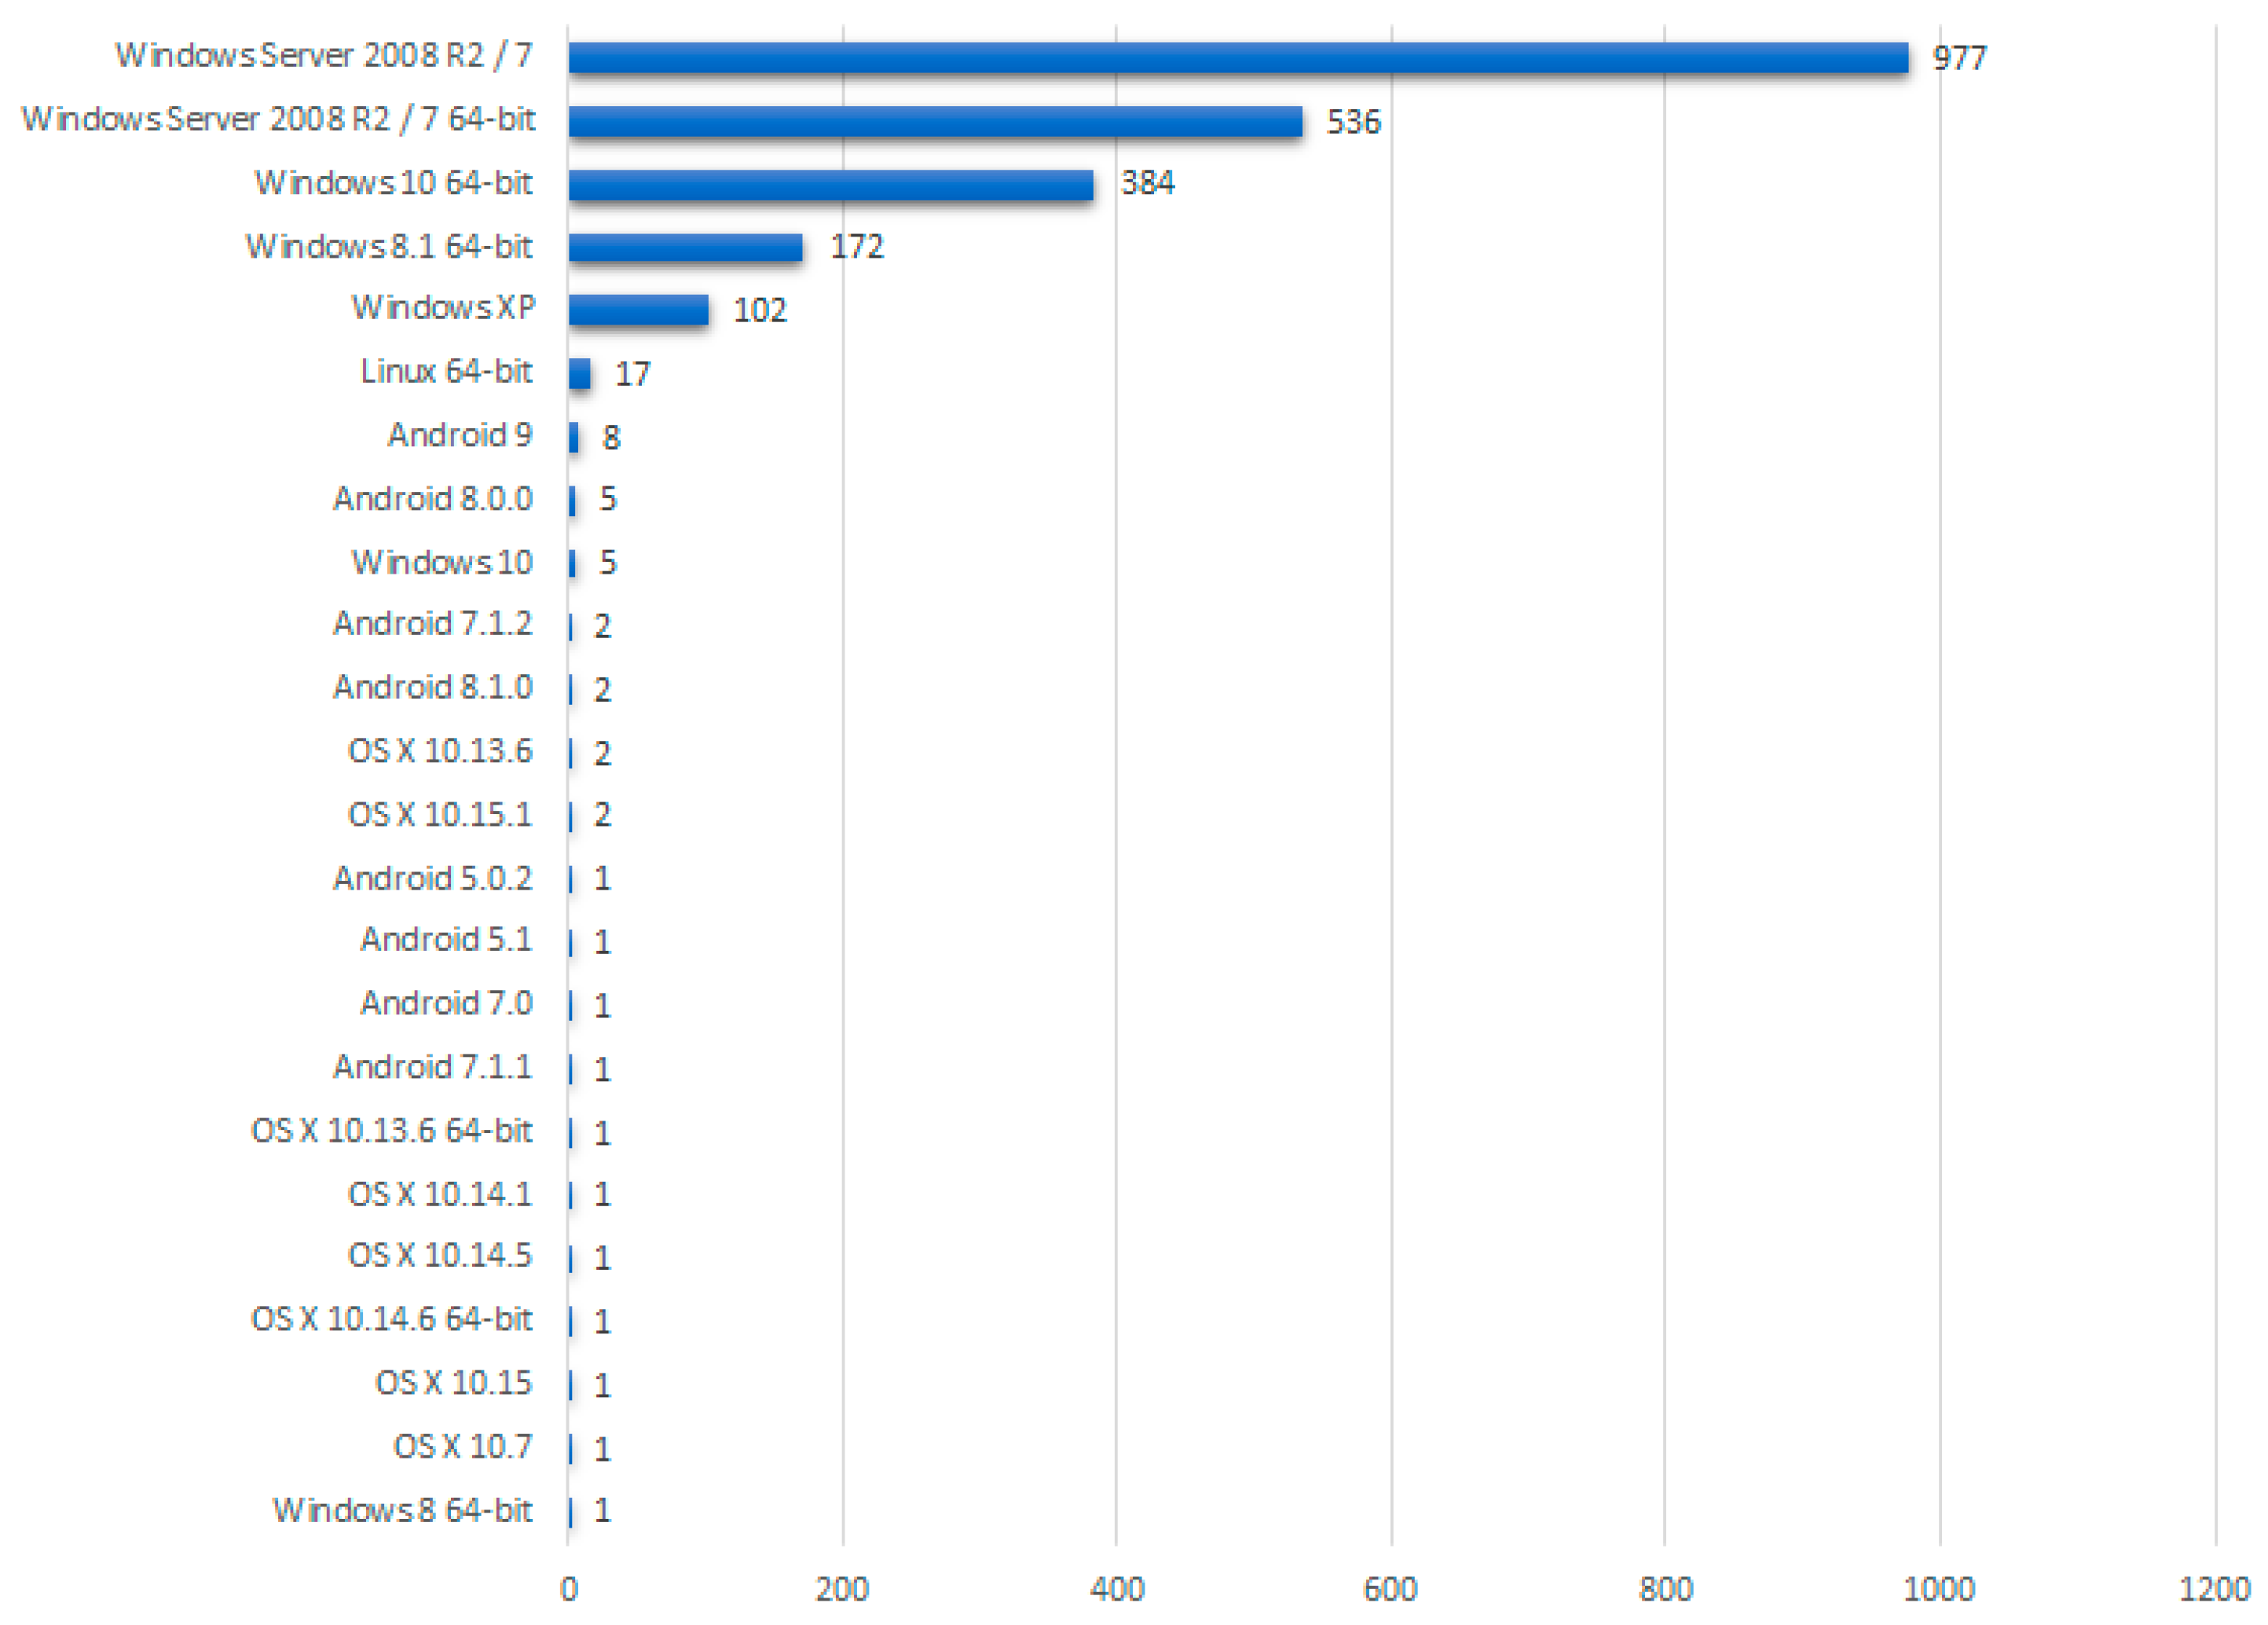
Figure 1.
Operating systems used by users in the survey.

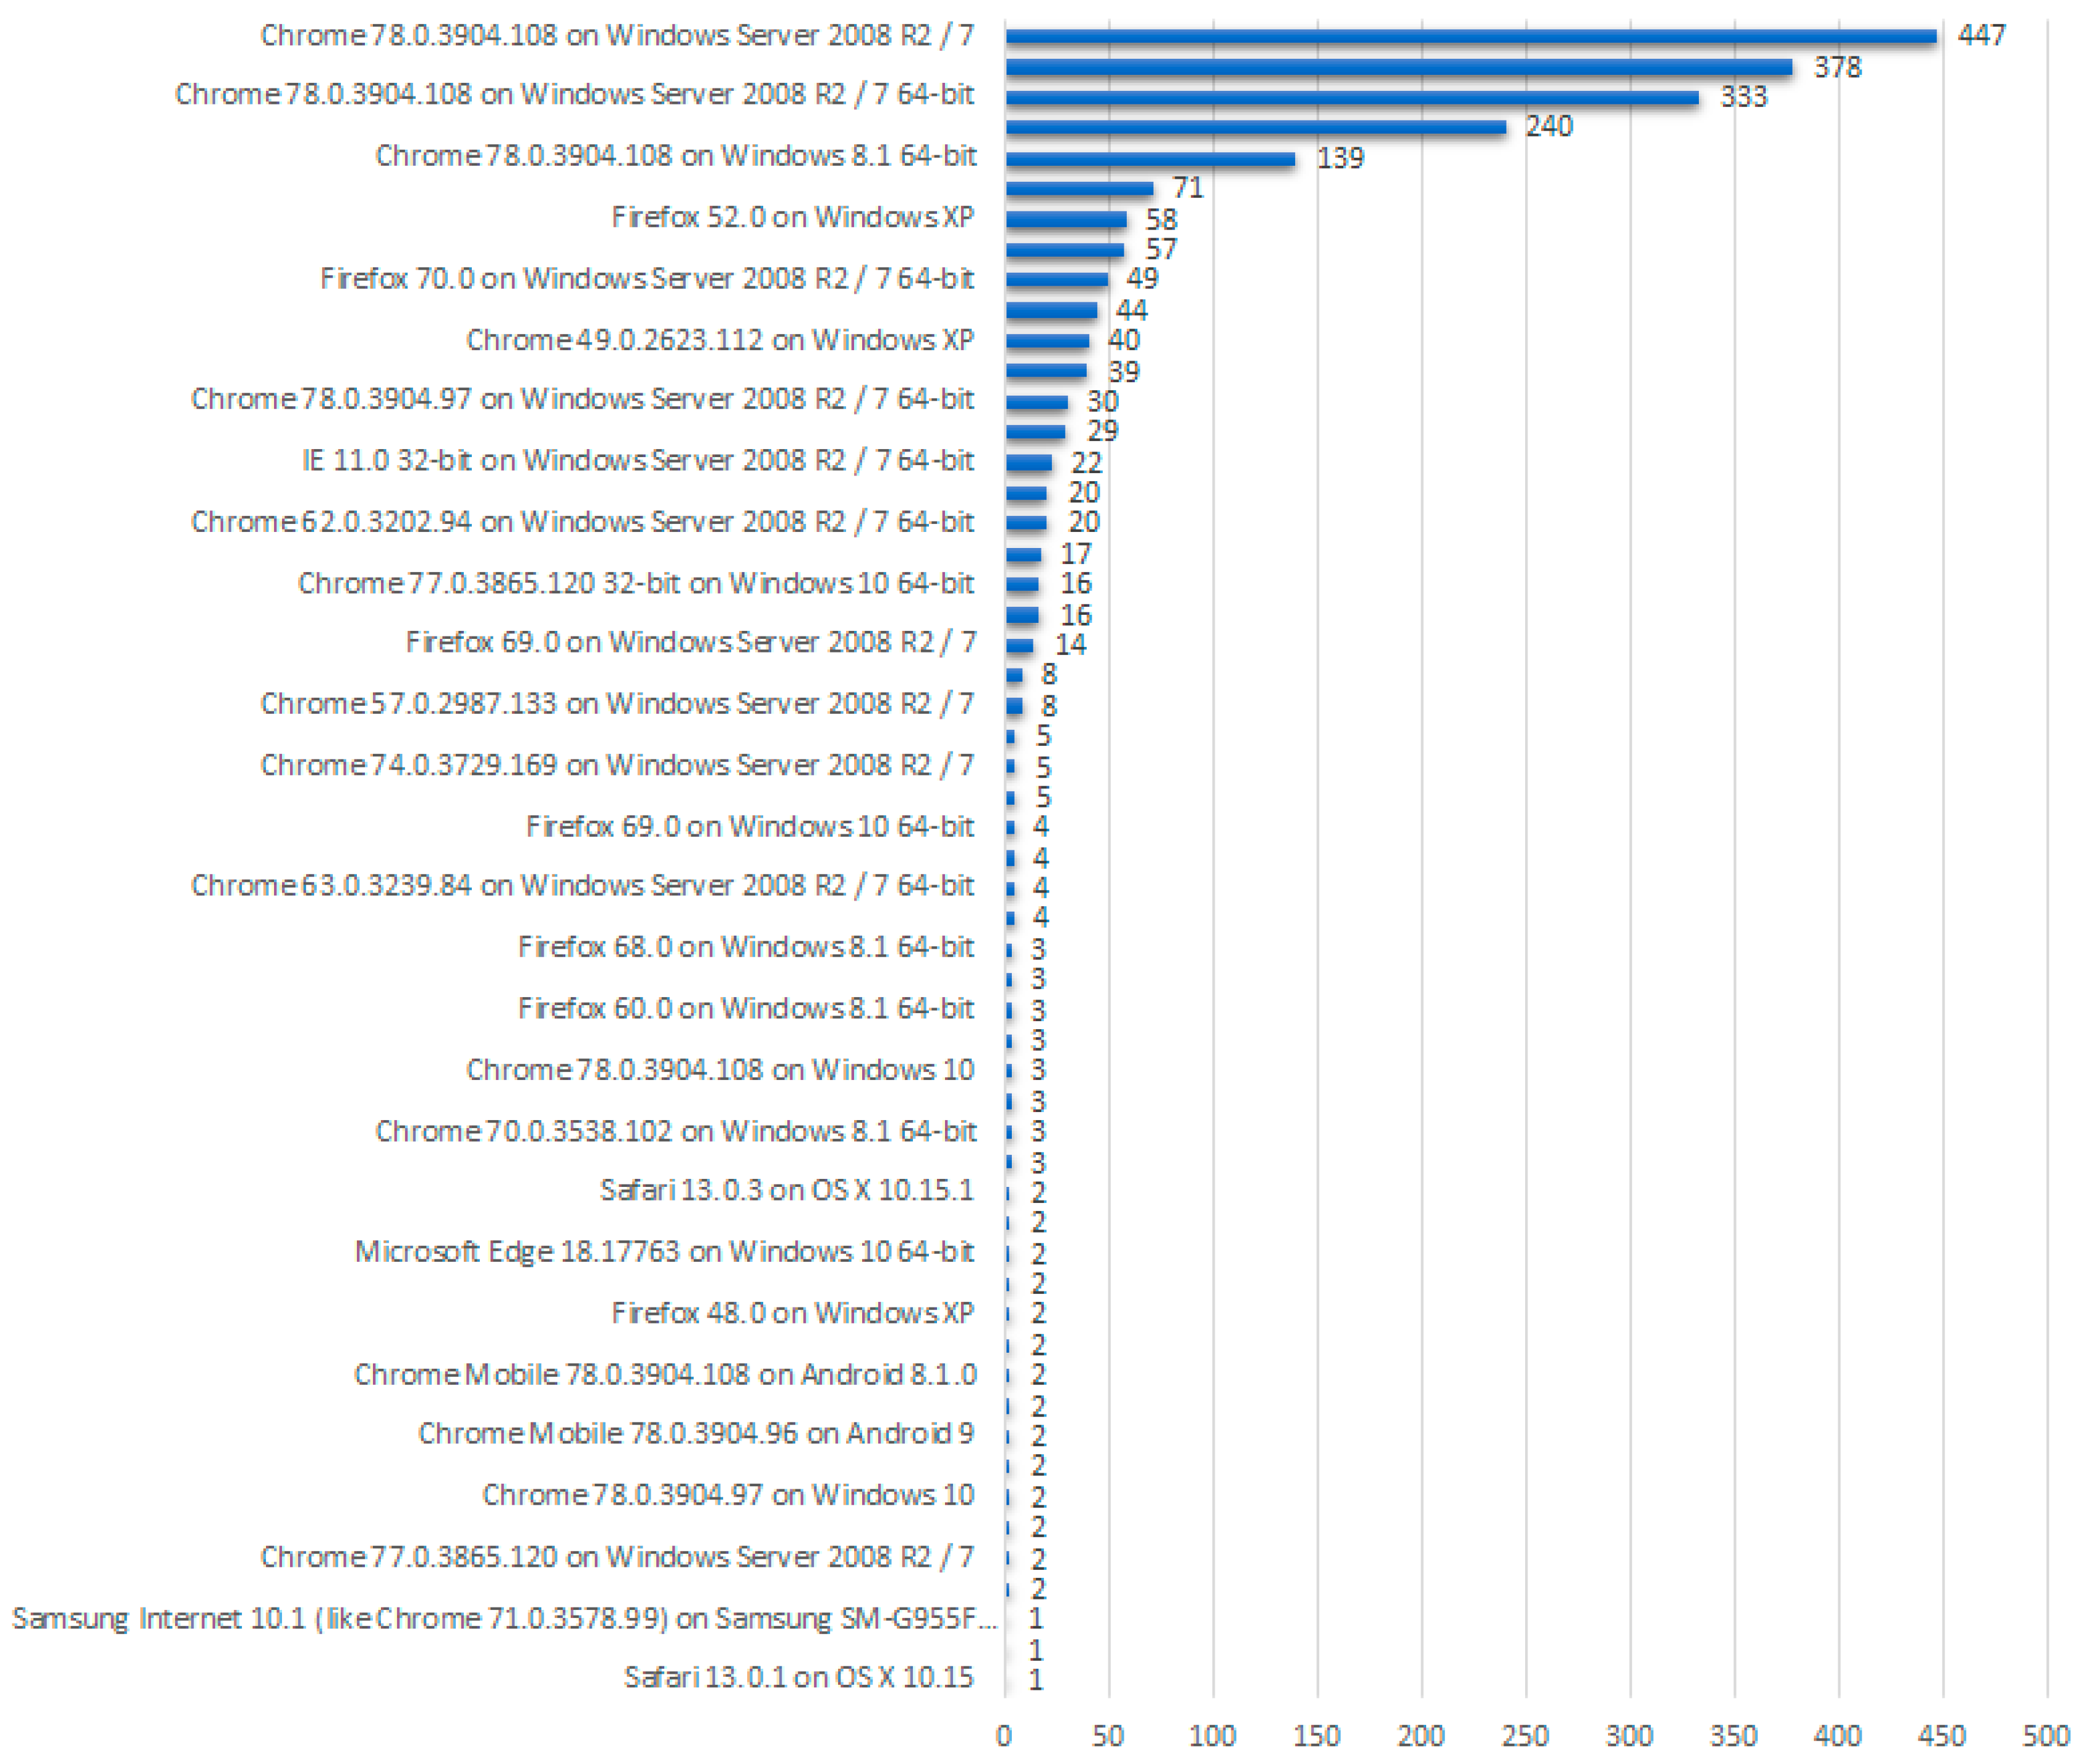
Figure 2.
Types and versions of browsers used in the survey.

Figure 3.
Examples of users’ reaction to questions 1, 2, 3, 4: (a) user 45; (b) user 119; (c) user 329.
Figure 3.
Examples of users’ reaction to questions 1, 2, 3, 4: (a) user 45; (b) user 119; (c) user 329.


Publisher’s Note: MDPI stays neutral with regard to jurisdictional claims in published maps and institutional affiliations. |
© 2020 by the authors. Licensee MDPI, Basel, Switzerland. This article is an open access article distributed under the terms and conditions of the Creative Commons Attribution (CC BY) license (http://creativecommons.org/licenses/by/4.0/).
Share and Cite
MDPI and ACS Style
Magomedov, S.; Ilin, D.; Silaeva, A.; Nikulchev, E. Dataset of User Reactions When Filling Out Web Questionnaires. Data 2020, 5, 108. https://0-doi-org.brum.beds.ac.uk/10.3390/data5040108
AMA Style
Magomedov S, Ilin D, Silaeva A, Nikulchev E. Dataset of User Reactions When Filling Out Web Questionnaires. Data. 2020; 5(4):108. https://0-doi-org.brum.beds.ac.uk/10.3390/data5040108
Chicago/Turabian StyleMagomedov, Shamil, Dmirty Ilin, Anastasiya Silaeva, and Evgeny Nikulchev. 2020. "Dataset of User Reactions When Filling Out Web Questionnaires" Data 5, no. 4: 108. https://0-doi-org.brum.beds.ac.uk/10.3390/data5040108