Data Descriptor

An Open GMNS Dataset of a Dynamic Multi-Modal Transportation Network Model of Melbourne, Australia

1
Department of Industrial Engineering, Khajeh Nasir University of Technology, Tehran 19991-43344, Iran
2
Research Center for Integrated Transport Innovation (rCITI), School of Civil and Environmental Engineering, University of New South Wales (UNSW), Sydney, NSW 2052, Australia
3
Transport Analytics Group, DATA61, CSIRO, Sydney, NSW 2015, Australia
4
Jiangsu Key Laboratory of Urban ITS, Jiangsu Province Collaborative Innovation Center of Modern Urban Traffic Technologies, School of Transportation, Southeast University, Nanjing 210096, China
*
Author to whom correspondence should be addressed.
Submission received: 11 February 2021 / Revised: 16 February 2021 / Accepted: 17 February 2021 / Published: 19 February 2021
(This article belongs to the Section Information Systems and Data Management)

Abstract

:
Simulation-based dynamic traffic assignment models are increasingly used in urban transportation systems analysis and planning. They replicate traffic dynamics across transportation networks by capturing the complex interactions between travel demand and supply. However, their applications particularly for large-scale networks have been hindered by the challenges associated with the collection, parsing, development, and sharing of data-intensive inputs. In this paper, we develop and share an open dataset for reproduction of a dynamic multi-modal transportation network model of Melbourne, Australia. The dataset is developed consistently with the General Modeling Network Specification (GMNS), enabling software-agnostic human and machine readability. GMNS is a standard readable format for sharing routable transportation network data that is designed to be used in multimodal static and dynamic transportation operations and planning models.
Dataset License: CC BY 4.0

1. Summary

The emergence of dynamic traffic assignment (DTA) since the late 1970s [1] is largely due to the fact that traffic networks are generally not in a steady state, as depicted by static traffic assignment. Thus, two important extensions were made: (i) travel times may change due to varying traffic conditions (i.e., experienced travel time); and (ii) travel times on used routes should be equal for the same departure time interval [2,3,4]. A recent methodological review of DTA can be found in [5]. Due to their dynamic nature, DTA models are able to capture and replicate complex behavior of formation, propagation, and dissipation of traffic congestion in cities [6] and are often used for transportation network design and planning purposes such as corridor management [7], downtown traffic management [8], road pricing [9], and emergency management [10]. A comprehensive summary of DTA applications can be found in [2].
More recently, a growing number of studies have unraveled the potential benefits of big data in understanding and modeling of urban transportation networks, including use of mobile phone data [11,12] and, more generally, floating car data [13,14]. Nevertheless, simulation-based DTA has still remained the dominant and more widely used methodology in understanding and predicting both the short- and long-term dynamics of traffic congestion in urban networks.
Applications of simulation-based DTA models have been growing in urban transportation systems operations and planning, but development of such models requires a large number of data inputs that often make their real-world applications a practical challenge. These inputs generally fall into two categories of demand and supply sides [2]. The former typically include time-dependent origin-destination (TDOD) matrices and traveler behavior models’ parameters, while the latter consist of network geometry, traffic control information, traffic flow parameters, and others. Some of these inputs can be relatively easy to acquire such as network geometry (e.g., via OpenStreetMap), whereas some others are difficult to observe in reality such as TDOD matrices. Thus, calibration and validation of simulation-based DTA models are integral to their deployment to ensure that models accurately reflect the ground truth [15,16,17,18,19].
The overall deployment procedure of simulation-based DTA models is data demanding, but lack of a globally used data standard has been limiting reproducibility of easily transferable large-scale travel demand models. In a recent and timely initiative by the Zephyr Transport Foundation [20], a standard format for sharing routable transportation network data known as the General Modeling Network Specification (GMNS) is developed [21]. GMNS is designed to facilitate sharing tools and datasets for development of static and dynamic multi-modal transportation networks. In this paper, we develop and share an open GMNS dataset for reproduction of a dynamic multi-modal transportation network model of Melbourne, Australia (see [19] for model deployment details).

2. Data Description

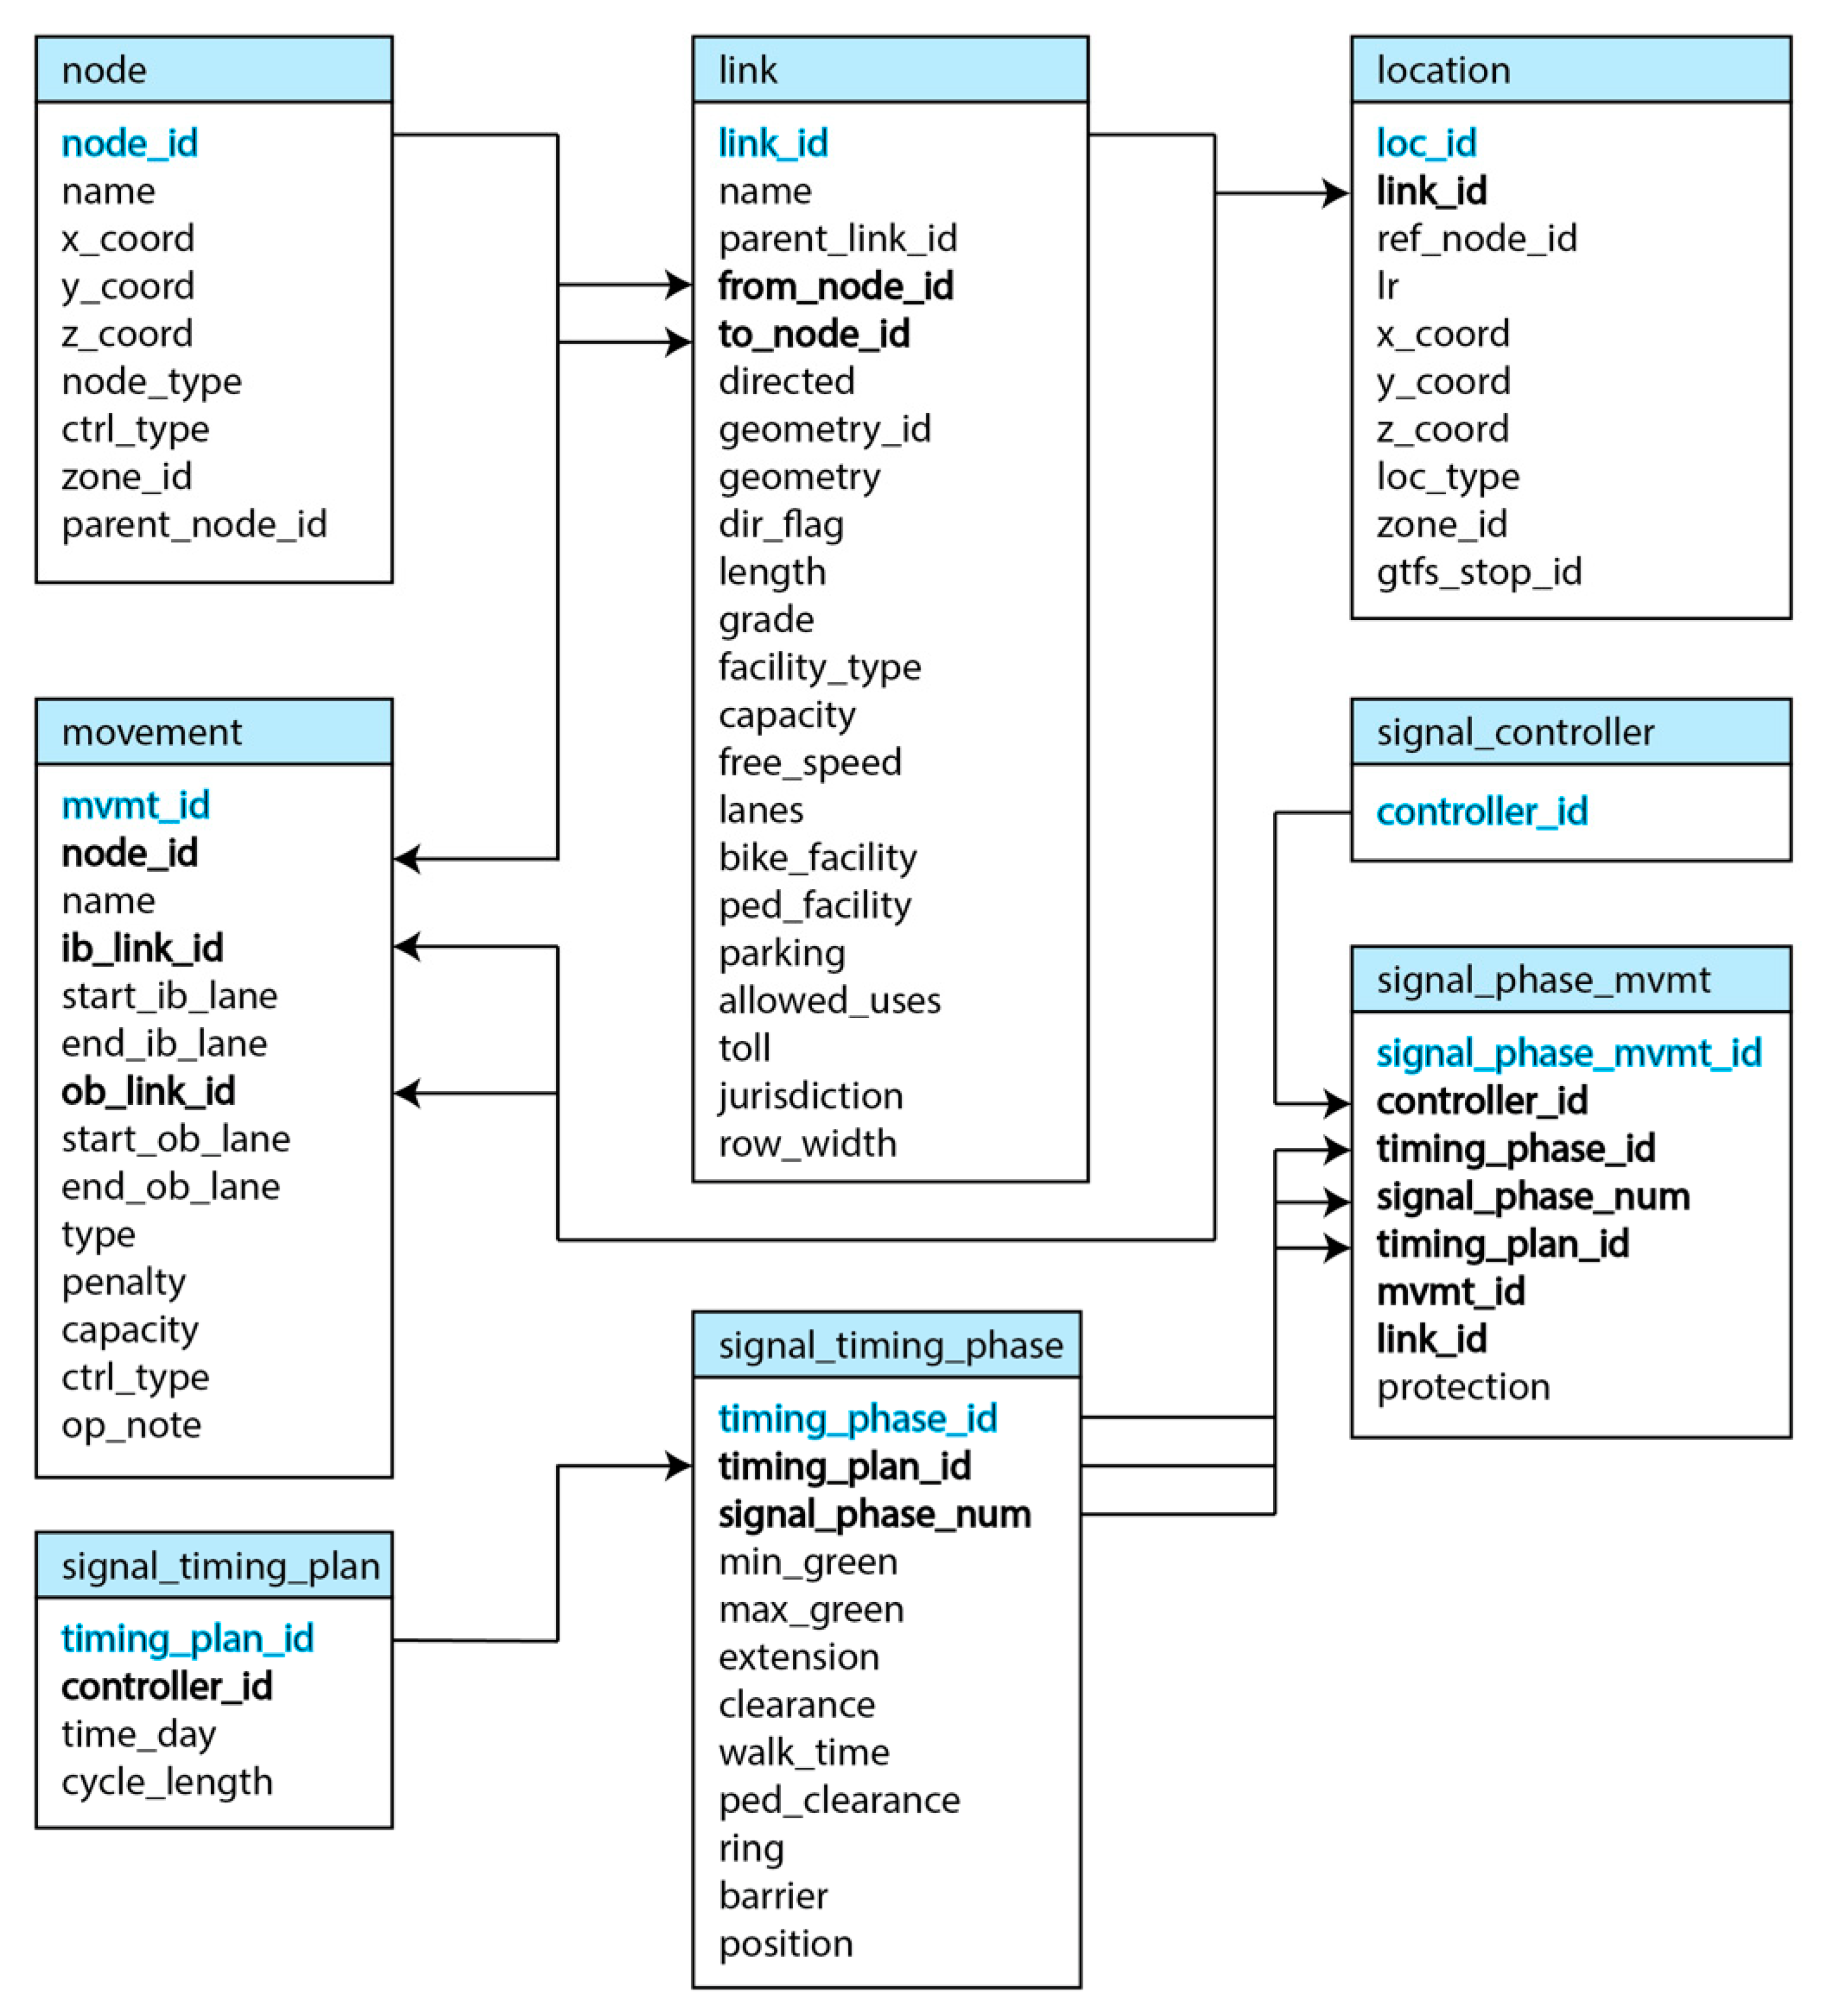
In this section, we follow the GMNS data sharing standards that include two general data elements: basic and advanced. The basic data elements are sufficient to generate a routable transportation network while the advanced data elements provide more information on the time-dependent features of the network including movements and traffic signal controls. We also include additional data elements, not included in the GMNS for sharing travel demand origin-destination matrices and observed traffic volume data for model validation and benchmarking purposes. See Figure 1 for an illustration of the relational structure of the developed GMNS dataset.

2.1. Basic Network Data Elements

The basic network data elements include information on
  • nodes
  • links
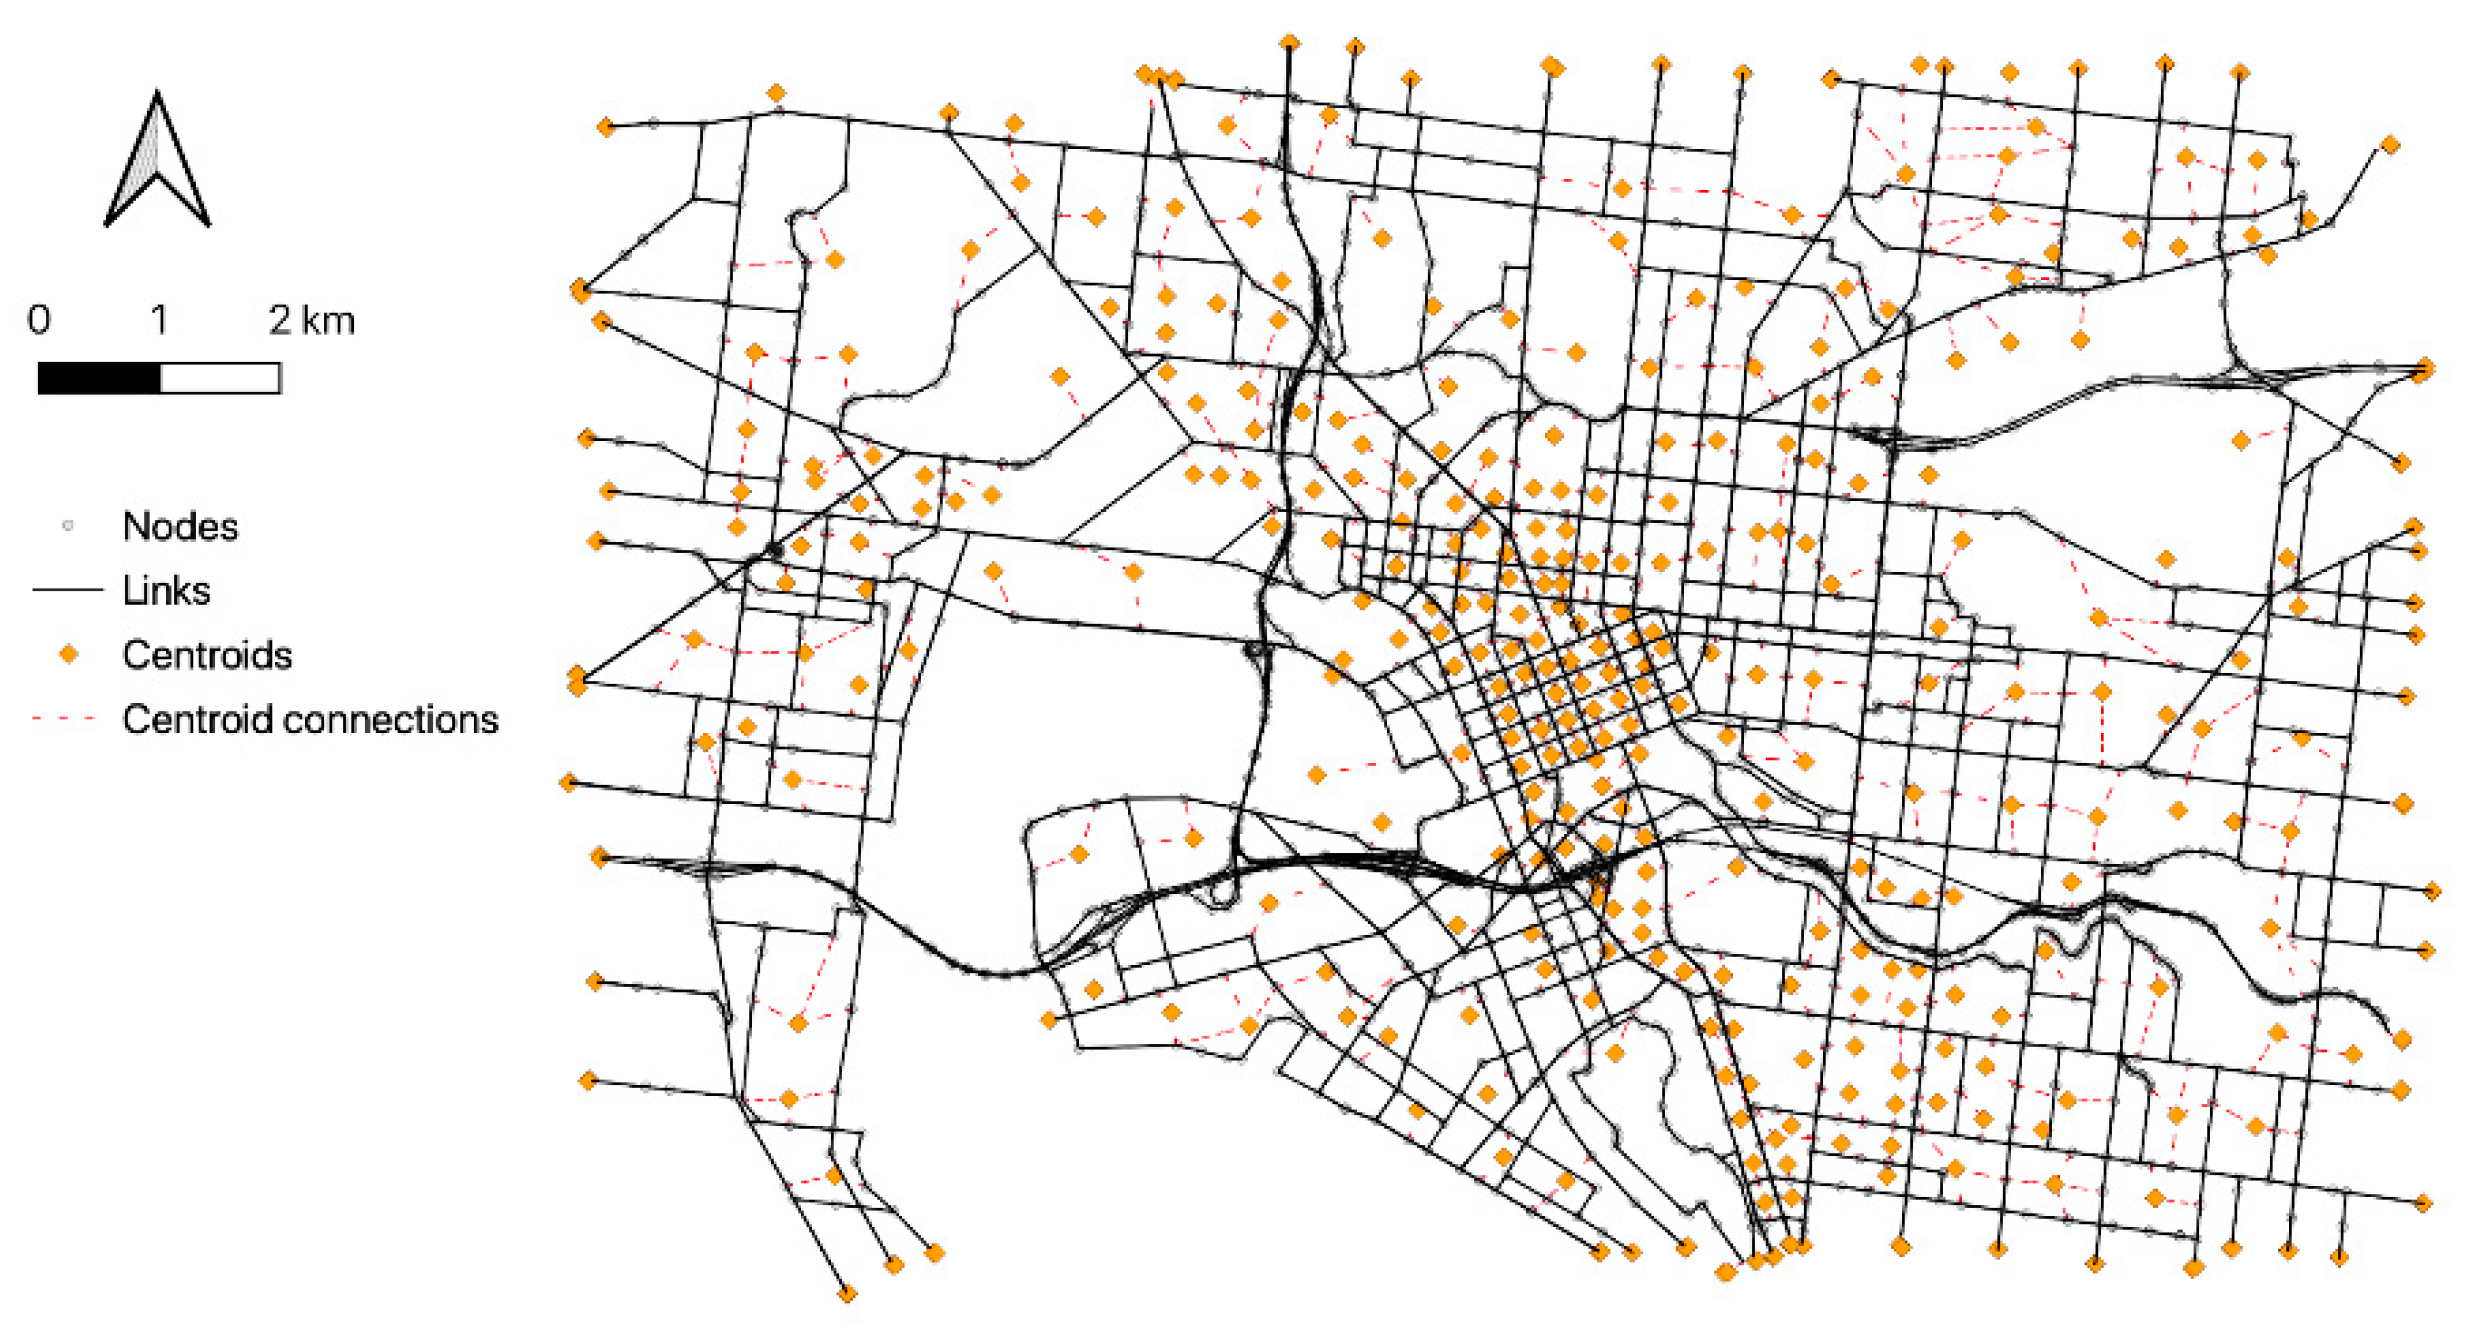
The node data table (node.csv) includes of 2077 rows and nine columns in which each row represents an individual node, and the columns contain information on the geometry of the nodes including node ID, latitude and longitude, type of node (e.g., external, centroid, etc.), and node control type (e.g., signal) (see Table 1). Note that all latitude and longitude information included in the table below and all consecutive tables are in the UTM (Universal Transverse Mercator) coordinate system.
The link data table (link.csv) includes 4223 rows and 22 columns in which each row represents an individual edge in the network and the columns contain information including link ID, link name, parent link ID, from node ID, to node ID, link type (e.g., directed), geometry ID, geometry, direction flag, length, grade, facility type, capacity, free flow speed, number of lanes, bike facility, pedestrian facility, parking, allowed uses, toll, jurisdiction, and row width. Some of the columns are left blank as we did not have the associated information to include in the table (see Table 2).

2.2. Advanced Network Data Elements

The advanced network data elements include information on
  • location
  • movements
  • signal controllers
  • signal timing plans
  • signal time phases
  • signal phase movements
The location data table (location.csv) consists of 4289 rows and 10 columns in which each row represents a specific location in the network (e.g., bus stops and detectors) and its attributes are nearly the same as those for a node, except that the location includes an associated link. The zone ID field enables the network to be loaded via locations (similar to what is done in existing commercial transportation network traffic simulation). Other information included in this table are location ID, link ID, referred node ID, LR number (it is used if link geometry exists; otherwise, the link geometry is assumed to be the straight-line distance between the from node and to node), x and y and z coordinates, location type and zone ID (see Table 3).
The movement data table (movement.csv) describes how inbound and outbound links connect at an intersection. The table contains 6879 rows and 14 columns in which each row represents a movement at a node and columns consist of movement ID, node ID, movement name, inbound link ID, start_ib_lane (innermost lane number the movement applies to at the inbound end), end_ib_lane (outermost lane number the movement applies to at the inbound end), outbound link ID, start_ob_lane (innermost lane number the movement applies to at the outbound end), end_ob_lane (outermost lane number the movement applies to at the outbound end), movement type (e.g., left, right or thru), penalty (in seconds), capacity, and control type (e.g., no control, signal, yield, and stop) (see Table 4).
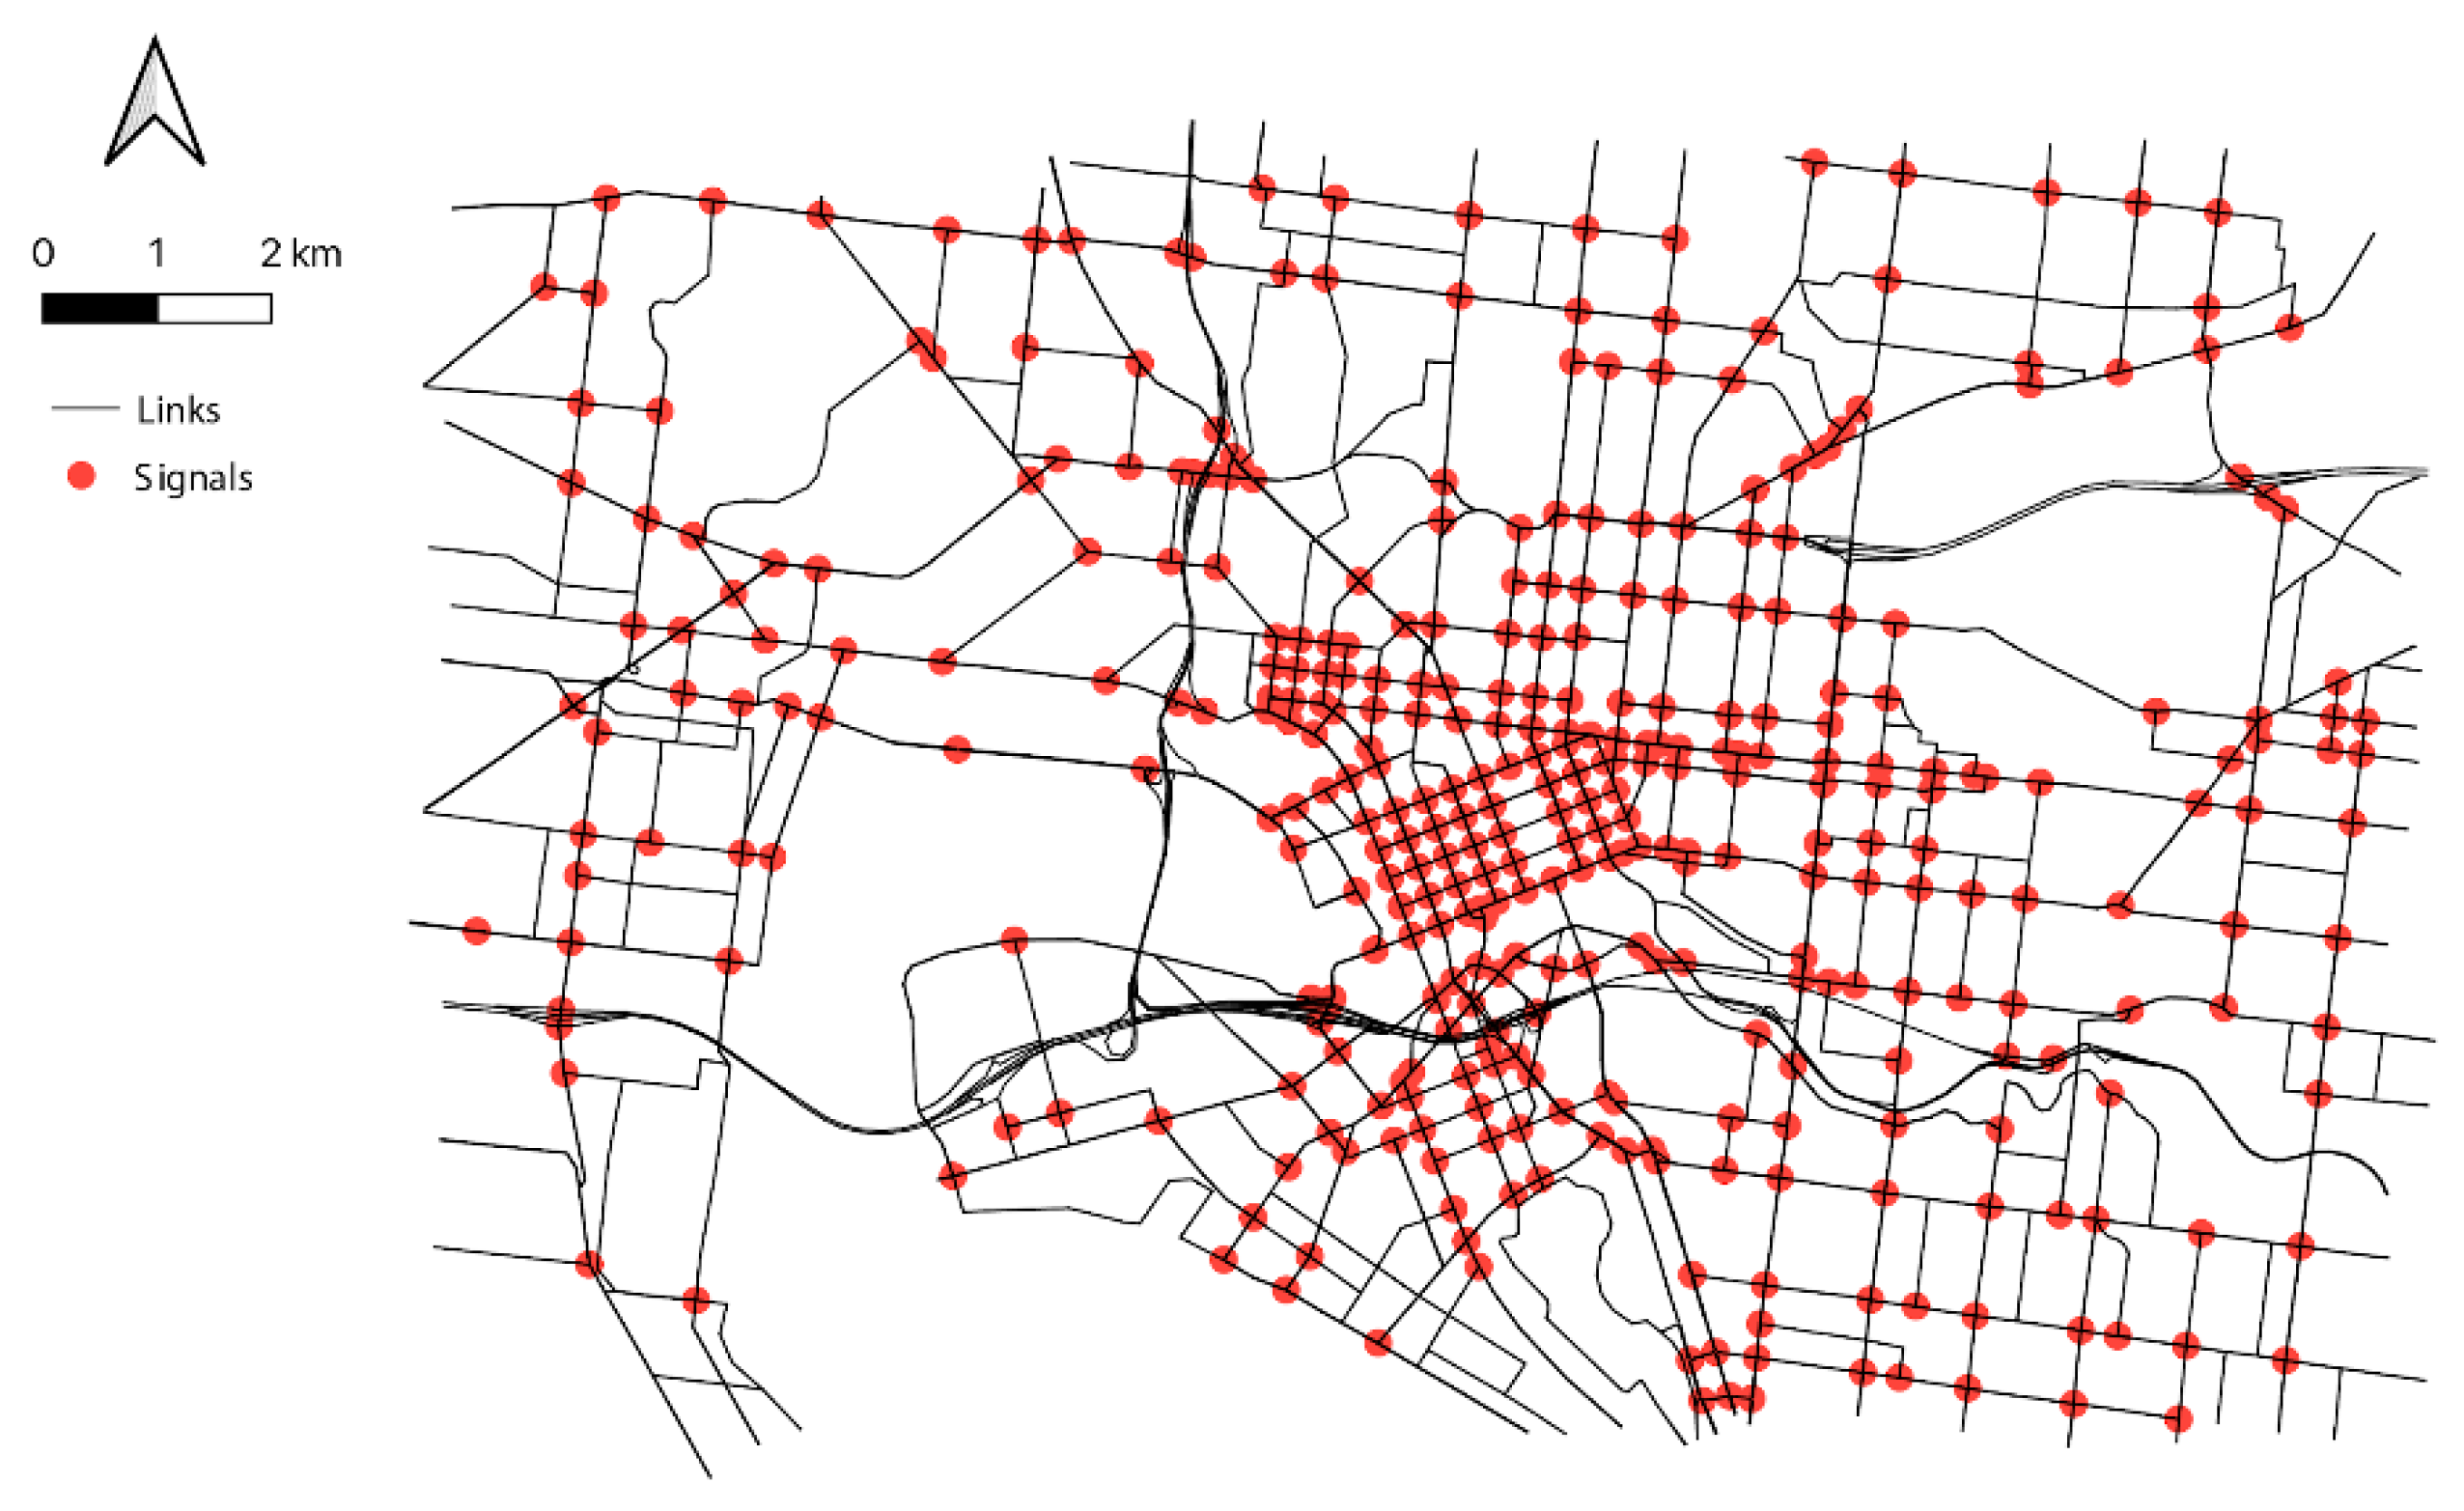
The signal controller data table (signal_controller.csv) contains 1 row and 1 column, which is the controller ID. The signal controller is associated with an intersection or a cluster of intersections. Here, all traffic signals are coded as actuated.
The signal timing plan data table (signal_timing_plan.csv) includes 372 rows and 4 columns in which each row represents a particular signal timing time. Columns consist of time plan ID, controller ID, time day, and cycle length. This data table establishes timing plans for signalized nodes (see Table 5).
The signal timing phase data table (signal_timing_phase.csv) includes 2756 rows and 13 columns. Each row describes an individual timing phase. Columns consist of timing phase ID, timing plan ID, signal phase number, min green, max green, extension, clearance, walk time, pedestrian clearance, ring, barrier, and position. This data table provides signal timing information and establishes phases that may run concurrently for signalized nodes (see Table 6).
The signal phase movement data table (signal_phase_mvmt.csv) includes 3959 rows and 8 columns. Each individual row represents a signal phase. Columns consist of signal phase movement ID, controller ID, timing phase ID, signal phase number, timing plan ID, movement ID, link ID, and protection. This data table associates movements and pedestrian links (e.g., crosswalks if any) with signal phases. A signal phase may be associated with several movements. A movement may also run on more than one phase (see Table 7).

2.3. Additional Network Data Elements

The GMNS does not provide any formatting standard for sharing the time-dependent origin-destination demand matrices that are often used in transportation network models. Here, we use a commonly used long format in the literature for sharing network weight matrices in which rows and columns represent the travel demand (number of vehicle trips) going from one node to another with provided node IDs. Here the travel demand moves from one centroid to another centroid. Note that the connectors between centroids to links are not provided. Users can connect centroids to links or nodes as appropriate in their application. We provide 16 origin-destination demand matrices for every 15 min time interval from 6:00 am to 10:00 am. All matrices are calibrated using empirical data as discussed in detail in [15] (see Table 8).
We also provide observed traffic volume data (observed_traffic_volume.csv) on 448 links across the network for every 15 min time interval obtained from loop detector data on both freeways and arterials. These data can be used for benchmarking and model validation if needed. Note that GMNS does not provide any formatting standard for sharing observed traffic volume data (see Table 9).

3. Methods

The presented network data consists of 2077 nodes, 4223 links, and a time-dependent origin-destination demand matrix with 330,000 commuting trips in a 4 h long morning peak period. The spatial configuration of the road network is obtained from the Victoria Integrated Transport Model (VITM) [22] consisting of 416 traffic zones (see Figure 2). Road links are grouped into several classes based on their physical attributes including information such as the number of lanes, capacity, and free flow speed. Nodes include two key attributes of permitted turning movements and signal control parameters. The network also includes 372 actuated signal controls that are set up using Sydney Coordinated Adaptive Traffic System (SCATS) data containing information on the cycle time, the turning movements associated with each signal phase, and the maximum and minimum green times (see Figure 3). The network also includes 2483 bus stops specified as points associated with the links (see Figure 4).
The dataset also includes traffic count data from hundreds of loop detectors across the network that are map matched to the road network using the commonly available spatial analysis tool in ArcGIS [23]. Note that the presented model and the time-dependent origin-destination matrices are validated using a large set of path travel times obtained from the publicly available Google distance matrix API [24]. The time-dependent origin-destination demand matrices are calibrated based on an initial static demand matrix obtained from the VITM and re-estimated using traffic counts from freeways and signalized intersections.
The obtained and collated data here are manually checked against other publicly available datasets such as Google Maps and OpenStreetMap to ensure the location of nodes and links are correct. Capacity and free flow speed information are directly obtained from VITM and have not been quality controlled against in any other source, assuming information already in the VITM is of high quality as the model has been widely used by the government of Victoria and many consulting firms in the transportation profession for many years. There may be some disparity between the number and location of bus stops across the network, given the public transportation system in the area might have gone through occasional network design updates. However, the change is expected to be small without significant impact on the overall bus network. The signal timing information is also directly obtained from available SCATS data prior to 2015. Given the nature of SCATS, the signal timing data may have also changed over time since then. However, the impact on the overall performance of the network given its large scale and its strategic long-term application is expected to be minimal.
Further details of the deployment, calibration and validation of the network model can be found in [19,25]. The developed network model has already been used in various transportation network design, traffic operations, and optimization applications [26,27,28,29,30,31,32]. For more information on GMNS specifications, please refer to [21].

Author Contributions

Conceptualization, M.S.; methodology, F.N., M.M., S.S., Z.G., and M.S.; software, F.N., M.M., and S.S.; validation, F.N., M.M., and S.S.; formal analysis, F.N., M.M., S.S., Z.G., and M.S.; investigation, F.N., M.M., S.S., Z.G., and M.S.; data curation, F.N., M.M., and S.S.; writing—original draft preparation, F.N. and M.S.; writing—review and editing, F.N., M.M., S.S., Z.G., and M.S.; visualization, M.S.; supervision, M.S.; project administration, M.S. All authors have read and agreed to the published version of the manuscript.

Funding

This research received no external funding.

Data Availability Statement

The data presented in this study are available in https://0-doi-org.brum.beds.ac.uk/10.5281/zenodo.4541153.

Acknowledgments

We acknowledge the contributions from Majid Sarvi from University of Melbourne in the initial stages of the project.

Conflicts of Interest

The authors declare no conflict of interest.

References

  1. Merchant, D.K.; Nemhauser, G.L. A model and an algorithm for the dynamic traffic assignment problems. Transp. Sci. 1978, 12, 183–199. [Google Scholar] [CrossRef]
  2. Chiu, Y.C.; Bottom, J.; Mahut, M.; Paz, A.; Balakrishna, R.; Waller, S.; Hicks, J. Dynamic Traffic Assignment: A Primer; Transportation Research Circular E-C153; Transportation Research Board: Washington, DC, USA, 2011. [Google Scholar]
  3. Peeta, S.; Ziliaskopoulos, A.K. Foundations of dynamic traffic assignment: The past, the present and the future. Netw. Spat. Econ. 2001, 1, 233–265. [Google Scholar] [CrossRef]
  4. Mahmassani, H.S. Dynamic Network Traffic Assignment and Simulation Methodology for Advanced System Management Applications. Netw. Spat. Econ. 2001, 1, 267–292. [Google Scholar] [CrossRef]
  5. Wang, Y.; Szeto, W.; Han, K.; Friesz, T.L. Dynamic traffic assignment: A review of the methodological advances for environmentally sustainable road transportation applications. Transp. Res. Part B Methodol. 2018, 111, 370–394. [Google Scholar] [CrossRef]
  6. Ben-Akiva, M.E.; Gao, S.; Wei, Z.; Wen, Y. A dynamic traffic assignment model for highly congested urban networks. Transp. Res. Part C Emerg. Technol. 2012, 24, 62–82. [Google Scholar] [CrossRef] [Green Version]
  7. Zhou, X.; Mahmassani, H.S.; Zhang, K. Dynamic micro-assignment modeling approach for integrated multimodal urban corridor management. Transp. Res. Part C Emerg. Technol. 2008, 16, 167–186. [Google Scholar] [CrossRef]
  8. Florian, M.; Mahut, M.; Tremblay, N. Application of a simulation-based dynamic traffic assignment model. Eur. J. Oper. Res. 2008, 189, 1381–1392. [Google Scholar] [CrossRef]
  9. Lu, C.-C.; Mahmassani, H.S.; Zhou, X. A bi-criterion dynamic user equilibrium traffic assignment model and solution algorithm for evaluating dynamic road pricing strategies. Transp. Res. Part C Emerg. Technol. 2008, 16, 371–389. [Google Scholar] [CrossRef]
  10. Balakrishna, R.; Wen, Y.; Ben-Akiva, M.; Antoniou, C. Simulation-based framework for transportation network management in emergencies. Transp. Res. Rec. J. Transp. Res. Board 2008, 2041, 80–88. [Google Scholar] [CrossRef]
  11. Iqbal, M.S.; Choudhury, C.F.; Wang, P.; González, M.C. Development of origin–destination matrices using mobile phone call data. Transp. Res. Part C Emerg. Technol. 2014, 40, 63–74. [Google Scholar] [CrossRef] [Green Version]
  12. Paipuri, M.; Xu, Y.; González, M.C.; Leclercq, L. Estimating MFDs, trip lengths and path flow distributions in a multi-region setting using mobile phone data. Transp. Res. Part C 2020, 118, 102709. [Google Scholar] [CrossRef]
  13. Croce, A.I.; Musolino, G.; Rindone, C.; Vitetta, A. Transport system models and big data: Zoning and graph building with traditional surveys, FCD and GIS. ISPRS Int. J. Geo-Inf. 2019, 8, 187. [Google Scholar] [CrossRef] [Green Version]
  14. Croce, A.I.; Musolino, G.; Rindone, C.; Vitetta, A. Route and Path Choices of Freight Vehicles: A Case Study with Floating Car Data. Sustainability 2020, 12, 8557. [Google Scholar] [CrossRef]
  15. Lu, L.; Xu, Y.; Antoniou, C.; Ben-Akiva, M. An enhanced SPSA algorithm for the calibration of Dynamic Traffic Assignment models. Transp. Res. Part C: Emerg. Technol. 2015, 51, 149–166. [Google Scholar] [CrossRef]
  16. Vaze, V.; Antoniou, C.; Wen, Y.; Ben-Akiva, M. Calibration of Dynamic Traffic Assignment Models with Point-to-Point Traffic Surveillance. Transp. Res. Rec. J. Transp. Res. Board 2009, 2090, 1–9. [Google Scholar] [CrossRef] [Green Version]
  17. Antoniou, C.; Balakrishna, R.; Koutsopoulos, H.N.; Ben-Akiva, M. Off–line and on–line calibration of Dynamic Traffic Assignment Systems. IFAC Proc. Vol. 2009, 42, 104–111. [Google Scholar] [CrossRef]
  18. Mahut, M.; Florian, M.; Tremblay, N.; Campbell, M.; Patman, D.; McDaniel, Z.K. Calibration and Application of a Simulation-Based Dynamic Traffic Assignment Model. Transp. Res. Rec. J. Transp. Res. Board 2004, 1876, 101–111. [Google Scholar] [CrossRef]
  19. Shafiei, S.; Gu, Z.; Saberi, M. Calibration and Validation of a Simulation-based Dynamic Traffic Assignment Model for a Large-Scale Congested Network. Simul. Model. Pract. Theory 2018, 86, 169–186. [Google Scholar] [CrossRef]
  20. Smith, S.; Berg, I.; Yang, C. General Modeling Network Specification: Documentation, Software, and Data; United States Department of Transportation: Washington, DC, USA, 2020.
  21. GitHub. Available online: https://github.com/zephyr-data-specs/GMNS (accessed on 1 February 2021).
  22. Spiridonos, F.J.W.T.o.T.B.E. Transport demand modelling in Melbourne. WIT Trans. Built Environ. 2013, 130, 331–347. [Google Scholar]
  23. ArcGIS. Choosing an Edge Snap Method. Available online: https://desktop.arcgis.com/en/arcmap/10.3/manage-data/editing-existing-features/choosing-an-edge-snap-method.htm (accessed on 1 February 2021).
  24. Google Maps Platform. Distance Matrix Service. Available online: https://developers.google.com/maps/documentation/javascript/distancematrix (accessed on 1 February 2021).
  25. Gu, Z.; Saberi, M.; Sarvi, M.; Liu, Z. A big data approach for clustering and calibration of link fundamental diagrams for large-scale network simulation applications. Transp. Res. Part C Emerg. Technol. 2018, 94, 151–171. [Google Scholar] [CrossRef]
  26. Gu, Z.; Waller, S.T.; Saberi, M. Surrogate-based toll optimization in a large-scale heterogeneously congested network. Comput. Aided Civil Infrastruct. Eng. 2019, 34, 638–653. [Google Scholar] [CrossRef] [Green Version]
  27. Gu, Z.; Saberi, M. Simulation-based optimization of toll pricing in large-scale urban networks using the network fundamental diagram: A cross-comparison of methods. Transp. Res. Part C Emerg. Technol. 2021, 122, 102894. [Google Scholar] [CrossRef]
  28. Gu, Z.; Saberi, M. A bi-partitioning approach to congestion pattern recognition in a congested monocentric city. Transp. Res. Part C Emerg. Technol. 2019, 109, 305–320. [Google Scholar] [CrossRef]
  29. Shafiei, S.; Saberi, M.; Vu, H. Integration of Departure Time Choice Modeling and Dynamic Origin–Destination Demand Estimation in a Large-Scale Network. Transp. Res. Rec. 2020, 2674, 972–981. [Google Scholar] [CrossRef]
  30. Shafiei, S.; Saberi, M.; Zockaie, A.; Sarvi, A. Sensitivity-Based Linear Approximation Method to Estimate Time-Dependent Origin–Destination Demand in Congested Networks. Transp. Res. Rec. 2017, 2669, 72–79. [Google Scholar] [CrossRef] [Green Version]
  31. Olmos, L.E.; Çolak, S.; Shafiei, S.; Saberi, M.; González, M.C. Macroscopic dynamics and the collapse of urban traffic. Proc. Natl. Acad. Sci. USA 2018, 115, 12654–12661. [Google Scholar] [CrossRef] [Green Version]
  32. Saberi, M.; Hamedmoghadam, H.; Ashfaq, M.; Hosseini, S.A.; Gu, Z.; Shafiei, S.; Nair, D.J.; Dixit, V.; Gardner, L.; Waller, S.T.; et al. A simple contagion process describes spreading of traffic jams in urban networks. Nat. Commun. 2020, 11, 1616. [Google Scholar] [CrossRef] [Green Version]
Figure 1. Relational structure of the developed General Modeling Network Specification (GMNS) dataset. The first field in each table represents the primary reference.
Data 06 00021 g001
Figure 2. The spatial distribution of nodes, links, centroids and centroid connections.
Data 06 00021 g002
Figure 3. The location of traffic signals across the network.
Data 06 00021 g003
Figure 4. The spatial distribution of bus stops and detectors across the network.
Data 06 00021 g004
Table 1. Example of node data.
Node_IDNamex_Coordy_Coordz_CoordNode_TypeControl_TypeZone_IDParent_Node_ID
60399 3159815810552
60400 3158105810563
63800 3136885812843 Signal
64412 3233625815050 External
Table 2. Example of link data (not all columns are included).
LINK_IDNamefrom_Node_IDto_Node_IDCapacityFree_SpeedLanesBike_FacilityPed_Facility
2967 603996040090001005
3008 604366043718001001
3507 60903609041000501
4905 6186760903950901
Table 3. Example of location data (not all columns are included).
Loc_IDLink_IDx_Coordy_Coordz_CoordLoc_TypeZone_IDgtfs_Stop_ID
191030402823190305813732 Bus stop
191031402903196475813015 Bus stop
235244343023234345815564 Detector
235255355483232175813703 Detector
Table 4. Example of movement data (not all columns are included).
MVMT_IDNode_IDIb_Link_IDStart_Ib_LaneEnd_Ib_LaneOb_Link_IDStart_Ib_LaneEnd_Ib_Lane
85940637503921111814912
85941637503921111815012
85942637504399111814811
85943637504399112815012
Table 5. Example of signal timing plan data.
Time_Plan_IDController_IDTime_DayCycle_Length
11 180
501 102
1261 74
1581 65
Table 6. Example of signal timing phase data (not all columns are included).
Timing_Phase_IDTiming_Plan_IDSignal_Phase_NumMin_GreenMax_GreenClearanceRingBarrier
111091311
21233311
31306311
41433311
Table 7. Example of signal phase movement data (not all columns are included).
Signal_Phase_mvmt_IDTiming_Phase_IDSignal_Phase_NumTiming_Plan_IDmvmt_ID
1111133217
2111133218
3111133215
4221133216
Table 8. Example of the origin-destination demand matrix data.
Node_ID318475318481318485318487
3177882000
3177946000
3177980200
3178010000
Table 9. Example of the observed traffic volume data.
Link_IDTimeObserved_Volume
82206:1547
82206:3070
82206:4588
82207:00109
Publisher’s Note: MDPI stays neutral with regard to jurisdictional claims in published maps and institutional affiliations.

