
Collection of Environmental Variables and Bacterial Community Compositions in Marian Cove, Antarctica, during Summer 2018


1
Department of Marine Science, Incheon National University, Incheon 22012, Korea
2
East Sea Fisheries Research Institute, National Institute of Fisheries Science, Gangneung 25435, Korea
3
Faculty of Marine Applied Biosciences, Kunsan National University, Gunsan 54150, Korea
*
Authors to whom correspondence should be addressed.
Data 2021, 6(3), 27; https://0-doi-org.brum.beds.ac.uk/10.3390/data6030027
Submission received: 28 January 2021
/
Revised: 3 March 2021
/
Accepted: 3 March 2021
/
Published: 5 March 2021
Abstract
:Marine bacteria, which are known as key drivers for marine biogeochemical cycles and Earth’s climate system, are mainly responsible for the decomposition of organic matter and production of climate-relevant gases (i.e., CO₂, N₂O, and CH₄). However, research is still required to fully understand the correlation between environmental variables and bacteria community composition. Marine bacteria living in the Marian Cove, where the inflow of freshwater has been rapidly increasing due to substantial glacial retreat, must be undergoing significant environmental changes. During the summer of 2018, we conducted a hydrographic survey to collect environmental variables and bacterial community composition data at three different layers (i.e., the seawater surface, middle, and bottom layers) from 15 stations. Of all the bacterial data, 17 different phylum level bacteria and 21 different class level bacteria were found and Proteobacteria occupy 50.3% at phylum level following Bacteroidetes. Gammaproteobacteria and Alphaproteobacteria, which belong to Proteobacteria, are the highest proportion at the class level. Gammaproteobacteria showed the highest relative abundance in all three seawater layers. The collection of environmental variables and bacterial composition data contributes to improving our understanding of the significant relationships between marine Antarctic regions and marine bacteria that lives in the Antarctic.
Dataset License: CC-BY
1. Summary
The collection of environmental variables and bacterial composition data will help understand the correlation between environmental variables and bacterial community composition in the rapidly changing Antarctic marine environment. Environmental variables and bacterial data were collected at three different layers (seawater surface, middle, and bottom layers) from 15 different stations in Marian Cove, Antarctica, in 2018. The data set can be found in Supplementary Table S1 that comprises temperature (T), salinity (S), dissolved oxygen (DO), dissolved inorganic nitrogen (DIN), phosphate (PO₄3−), and silicate (SiO₂) in units of µmol L−1 (µM). Bacterial composition data contain 559 different bacteria at the species level (Supplementary Table S2). The obtained bacterial data were quality filtered by removing ambiguous DNA sequences, chimera sequences, and denoising. Relative abundance (%) was calculated with an operational taxonomic unit (OTU) count number of each sample. In total, 8,022,571 OTUs were detected, and Gammaproteobacteria had the highest relative abundance in each seawater surface, middle, and the bottom layer at all 15 stations, followed by Alphaproteobacteria (Supplementary Table S2). All bacterial sequence data were deposited in the National Center for Biotechnology Information (NCBI).
2. Data Description
2.1. Study Area
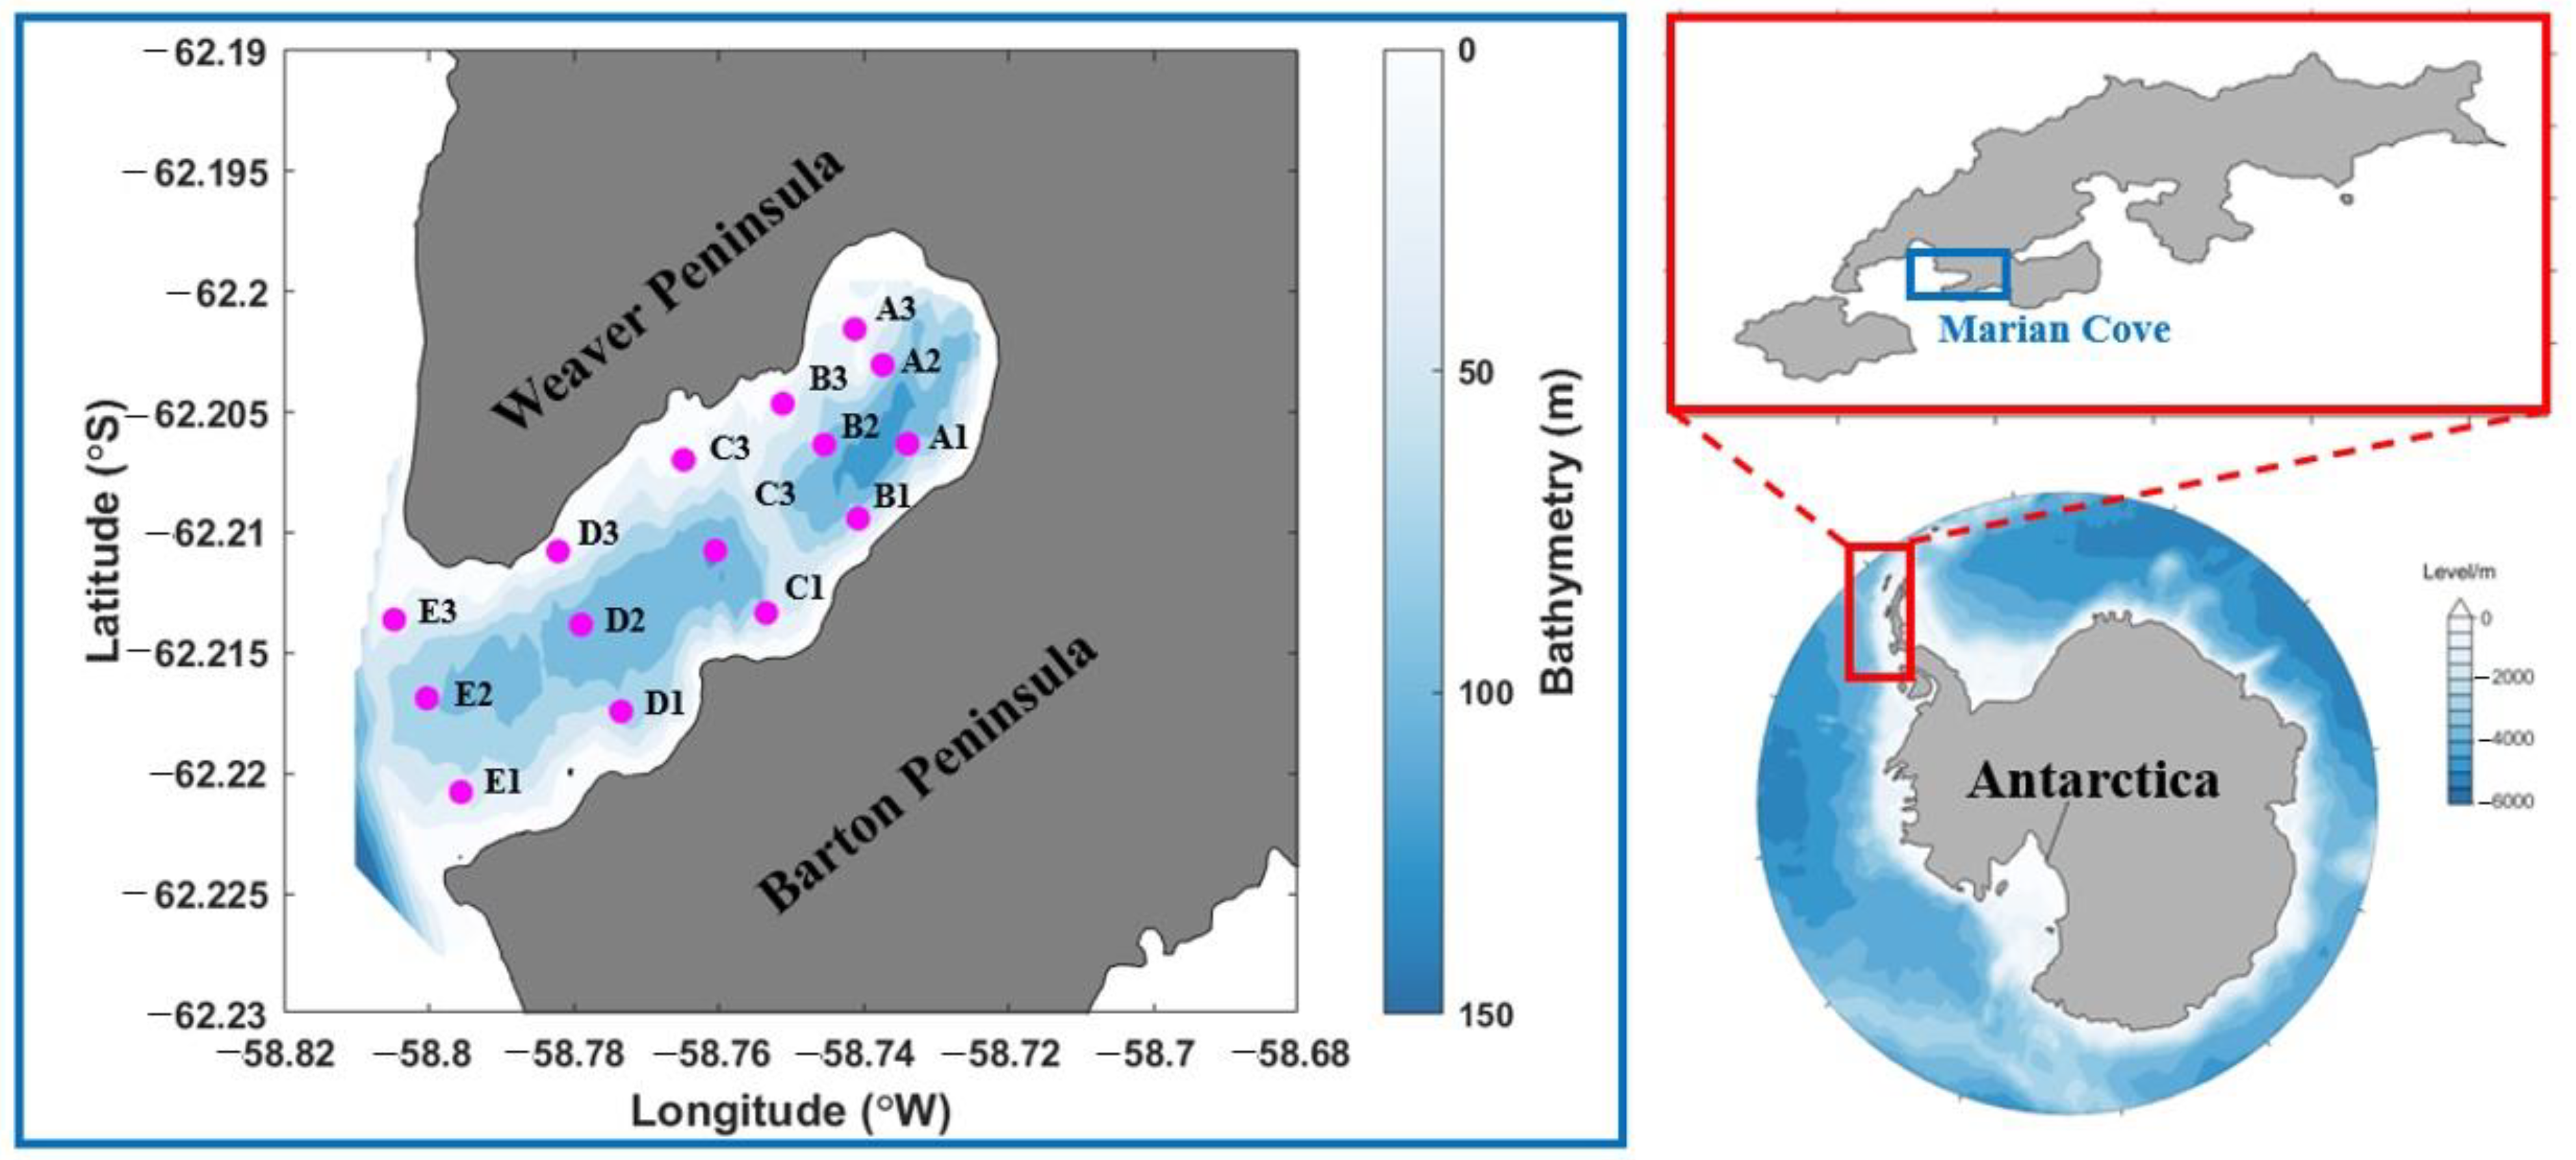
The study area was the small Marian Cove in the Antarctic, located between the Weaver and Barton Peninsulas. The length, width, and depth of the Marian Cove are 4.5, 1.5, and 120 m, respectively (Figure 1) [1,2]. The Marian Cove is experiencing rapid environmental changes in the Antarctic region as a result of global warming [3,4,5,6,7,8], such as increased glacial retreat [9], which causes an increased inflow of freshwater [10]. Seawaters inflow into Marian Cove through Maxwell Bay in the Bellingshausen Sea. Horizontally, the Marian Cove is characterized by the continuous inflow of seawater and freshwater [11,12,13,14]. Vertically, the Marian Cove is composed of three different water masses: Surface Glacier Water (SGW: relatively low S and nutrients), Surface Maxwell Bay Water (SMBW; relatively high T and nutrients), and Subsurface Marian Cove Water (SMCW; relatively high S and low nutrients) [15,16].
2.2. Marine Environmental Variables
To investigate the differences in the bacterial community composition of each water mass that exhibits different environmental characteristics, we conducted a hydrographic survey to collect environmental variables and bacterial community composition data at three different layers (seawater surface, middle, and bottom) from 15 stations during January 2018. The seawater temperature, salinity, and dissolved oxygen were measured in-situ using a conductivity, temperature, and depth (CTD) instrument (Supplementary Table S1). Seawater sampling for nutrients (i.e., dissolved inorganic nitrogen (DIN), phosphate (PO₄3−), and silicate (SiO₂) and bacterial composition analysis were performed using a 5 L Niskin bottle. All seawater samples obtained through the filtering system and bacterial samples and nutrient samples were immediately frozen in the −80 °C and −20 °C deep freezer, respectively, until the analysis. Nutrients of DIN, phosphate, and silicate were measured using an autoanalyzer (Quaatro, Seal Analytical, Norderstedt, Germany). The total number of collected environmental data (T, S, DO, DIN, phosphate, and silicate) was 264 (Supplementary Table S1). Mean T, S, and DO values were 1.06 °C (range: 0.28−2.78 °C), 31.44 psu (range: 32.95−34.11 psu), and 313.5 µM (range: 284.3–347.7 µM), respectively. Mean DIN, phosphate, and silicate concentrations were 24.81 µM (range: 10.75–47.36 µM), 1.67 µM (range: 0.58–1.82 µM), and 61.34 µM (range: 29.06–65.87 µM), respectively.
2.3. Bacterial Community Compositions
For the bacterial data quality check, the QC20 score (the percentage of bases in which the Phred quality score is above 20) of all 44 samples was higher than 97, with a minimum of 97.56 and a maximum of 98.3 (the average was 97.92). The relative abundance (%) was calculated using each sample OTU count number. For all 44 samples, the total number of sequences read and number of OTU were 8,022,571 and 1,924,384, respectively. The bacterial data (Supplementary Table S2) show that Proteobacteria (50.3%) was the most abundant phylum level, followed by Bacteroidetes (30.4%), Firmicutes (6.4%), and Actinobacteria (3.4%). Additionally, unclassified (35.6%) was the most abundant class-level bacteria category, followed by Gammaproteobacteria (27%), Alphaproteobacteria (17%), and Clostridia (4%). Gammaproteobacteria showed the highest relative abundance in the surface—middle—bottom layers (Supplementary Table S2).
3. Methods
3.1. Collection and Measurement of Marine Environmental Variables
In January 2018, seawater was collected at three different layers (surface, middle, and bottom layer) from 15 different stations located between the glacier present inside the Marian Cove and Maxwell Bay using 5 L Niskin bottles (Figure 1 and Supplementary Table S1). These three layers were determined with CTD profile, described the shallowest depth as the surface layer, the deepest depth as the bottom layer, and the middle depth of the surface and bottom layer as the middle layer. For bacterial community analysis, 2 L of seawater from each station was filtered through a 0.2 μm membrane (Whatman 47 mm polycarbonate membrane). Filtered samples were then immediately frozen and stored at −80 °C until DNA extraction. For nutrient analysis (dissolved inorganic nitrogen (DIN = NH₄+ + NO₂− + NO₃−), phosphate (PO₄3−), and silicate (SiO₂), seawater was filtered through a 0.2 µm syringe filter (Sartorius, Cat. No 16532, Gottingen, Germany) and filtered seawater was placed in a 50 mL conical tube and stored at −20 °C until the analysis was performed.
Marine environmental variables of the seawater samples were measured at each of the 15 stations. Seawater T, S, and DO were measured using a conductivity—temperature—depth instrument (CTD; RBR Ltd., Ottawa, ON, Canada). After thawing the frozen seawater for nutrient analysis, DIN, phosphate, and silicate contents were measured using an autoanalyzer (Quaatro, Seal Analytical, Norderstedt, Germany).
3.2. DNA Extraction and Sequencing
DNA from the filter paper was extracted using the PowerSoil® DNA Isolation Kit (Cat. No 12888, MOBIO, Carlsbad, CA, USA) to assess the bacterial community composition. Using PicoGreen and Nanodrop, DNA quantitative and qualitative analysis were carried out, respectively. To amplify the extracted environmental DNA V3–V4 regions, a Polymerase chain reaction (PCR) was carried out using primers 341F and 805R. The Illumina (San Diego, CA, USA) MiSeq™ platform was used for sequencing.
The paired-end sequence generated as the result of sequencing was merged using FLASH (v. 1.2.11, Center for Computational Biology, College Park, MD, USA) [17] to obtain a single long sequence. The sequence data were formed after removing low-quality sequences, chimera sequences, and ambiguous sequences, which were treated as sequencing errors. Denoising was performed using rDNA tools of CD-HIT-OTU, the rRNA operational taxonomic unit (OTU) analysis program. Then, clustered sequences with 97% or more sequence similarity at the species level of OTU were obtained [18,19]. QIIME (v. 1.8.0, San Diego, CA, USA) was used to analyze microbial community populations [20,21]. Each OTU was compared to the National Center for Biotechnology Information 16S microbial database. Raw sequence data were deposited in the NCBI with Sequence Read Archive (SRA) accession number PRJNA533713. Further details can be found in S. Kim, et al. [22].
Supplementary Materials
The following are available online at https://0-www-mdpi-com.brum.beds.ac.uk/2306-5729/6/3/27/s1, Table S1: Marian Cove environmental data, Table S2: Marian Cove bacterial composition data.
Author Contributions
H.-R.K. and I.-N.K. developed the concept and design of the manuscript. H.-R.K., J.-H.L., J.-H.K., and I.-N.K. wrote the manuscript. All authors discussed the results and commented on the manuscript. All authors have read and agreed to the published version of the manuscript.
Funding
This research was funded by a grant from the National Institute of Fisheries Science (R2021032) and the National Research Foundation (NRF-2019R1A4A1026423).
Institutional Review Board Statement
Not applicable.
Informed Consent Statement
Not applicable.
Data Availability Statement
The data presented in this study are available within the supplementary material.
Acknowledgments
We thank the KOPRI people in King Sejong Station for their valuable support.
Conflicts of Interest
The authors declare no conflict of interest.
References
- Yoo, K.; Kyung Lee, M.; Il Yoon, H.; Il Lee, Y.; Yoon Kang, C. Hydrography of Marian Cove, King George Island, West Antarctica: Implications for Ice-Proximal Sedimentation during Summer. Antarct. Sci. 2015, 27, 185–196. [Google Scholar] [CrossRef]
- Yoon, Y.J. The Mosses of Barton Peninsula, King George Island: New Records and an Updated Checklist. PNIE 2021, 2, 15–20. [Google Scholar] [CrossRef]
- Vaughan, D.G.; Marshall, G.J.; Connolley, W.M.; Parkinson, C.; Mulvaney, R.; Hodgson, D.A.; King, J.C.; Pudsey, C.J.; Turner, J. Recent Rapid Regional Climate Warming on the Antarctic Peninsula. Clim. Chang. 2003, 60, 243–274. [Google Scholar] [CrossRef]
- Siegert, M.; Atkinson, A.; Banwell, A.; Brandon, M.; Convey, P.; Davies, B.; Downie, R.; Edwards, T.; Hubbard, B.; Marshall, G.; et al. The Antarctic Peninsula under a 1.5 °C Global Warming Scenario. Front. Environ. Sci. 2019, 7, 102. [Google Scholar] [CrossRef]
- King, J.C. Recent Climate Variability in the Vicinity of the Antarctic Peninsula. Int. J. Clim. 1994, 14, 357–369. [Google Scholar] [CrossRef]
- Comiso, J.C. Variability and Trends in Antarctic Surface Temperatures from in situ and Satellite Infrared Measurements. J. Clim. 2000, 13, 1674–1696. [Google Scholar] [CrossRef]
- King, J.C.; Harangozo, S.A. Climate Change in the Western Antarctic Peninsula since 1945: Observations and Possible Causes. Ann. Glaciol. 1998, 27, 571–575. [Google Scholar] [CrossRef] [Green Version]
- Pearce, D.A. Climate Change and the Microbiology of the Antarctic Peninsula Region. Sci. Prog. 2008, 91, 203–217. [Google Scholar] [CrossRef] [PubMed]
- Alcamán-Arias, M.E.; Fuentes-Alburquenque, S.; Vergara-Barros, P.; Cifuentes-Anticevic, J.; Verdugo, J.; Polz, M.; Farías, L.; Pedrós-Alió, C.; Díez, B. Coastal Bacterial Community Response to Glacier Melting in the Western Antarctic Peninsula. Microorganisms 2021, 9, 88. [Google Scholar] [CrossRef] [PubMed]
- Bae, H.; Ahn, I.Y.; Park, J.; Song, S.J.; Noh, J.; Kim, H.; Khim, J.S. Shift in polar benthis community structure in a fast retreating glacial area of Marian Cove, West Antarctica. Sci. Rep. 2021, 11, 1–10. [Google Scholar] [CrossRef]
- Fox, A.J.; Cooper, A.P.R. Climate-Change Indicators from Archival Aerial Photography of the Antarctic Peninsula. Ann. Glaciol. 1998, 27, 636–642. [Google Scholar] [CrossRef] [Green Version]
- Yang, J.S. Nutrients, Chlorophyll-a and Primary Productivity in Maxwell Bay, King George Island, Antarctica. Polar Res. Lab KORDI Korean J. Polar Res. 1990, 1, 11–18. [Google Scholar]
- Nikrad, M.P.; Cottrell, M.T.; Kirchman, D.L. Growth Activity of Gammaproteobacterial Subgroups in waters off the West Antarctic Peninsula in Summer and Fall. Environ. Microbiol. 2013, 16, 1513–1523. [Google Scholar] [CrossRef] [PubMed]
- Piquet, A.M.; Bolhuis, H.; Meredith, M.P.; Buma, A.G. Shifts in coastal Antarctic Marine Microbial Communities during and After Melt Water-related Surface Stratification. FEMS Microbiol. Ecol. 2011, 76, 413–427. [Google Scholar] [CrossRef] [PubMed] [Green Version]
- Kim, D.U.; Khim, J.S.; Ahn, I.Y. Patterns drivers and implications of ascidian distributions in a rapidly deglaciating fjord, King George Island, West Antarctic Peninsula. Ecol. Indic. 2021, 125, 107467. [Google Scholar] [CrossRef]
- Luria, C.M.; Amaral-Zettler, L.A.; Ducklow, H.W.; Repeta, D.J.; Rhyne, A.L.; Rich, J.J. Seasonal Shifts in Bacterial Community Responses to Phytoplankton-Derived Dissolved Organic Matter in the Western Antarctic Peninsula. Front. Microbiol. 2017, 8, 2117. [Google Scholar] [CrossRef]
- Magoc, T.; Salzberg, S.L. FLASH: Fast Length Adjustment of Short Reads to Improve Genome Assemblies. Bioinformatics 2011, 27, 2957–2963. [Google Scholar] [CrossRef] [PubMed]
- Clarke, K.; Gorley, R. PRIMER V6: User Manual-Tutorial; Plymouth Marine Laboratory: Plymouth, UK, 2006; pp. 1–190. [Google Scholar]
- Li, W.; Fu, L.; Niu, B.; Wu, S.; Wooley, J. Ultrafast Clustering Algorithms for Metagenomic Sequence Analysis. Brief. Bioinform. 2012, 13, 656–668. [Google Scholar] [CrossRef]
- Armour, K.; Marshall, J.C.; Scott, J.M.J.R.; Donohoe, A.; Newsom, E.R. Southern Ocean Warming Delayed by Circumpolar Upwelling and Equatorward Transport. Nat. Geosci. 2016, 9, 549–554. [Google Scholar] [CrossRef]
- Caporaso, J.G.; Kuczynski, J.; Stombaugh, J.; Bittinger, K.; Bushman, F.D.; Costello, E.K.; Fierer, N.; Pena, A.G.; Goodrich, J.K.; Gordon, J.I.; et al. QIIME Allows Analysis of High-Throughput Community Sequencing Data. Nat. Methods 2010, 7, 335–336. [Google Scholar] [CrossRef] [Green Version]
- Kim, S.; Kim, J.-H.; Lim, J.-H.; Jeong, J.-H.; Heo, J.-M.; Kim, I.-N. Distribution and Control of Bacterial Community Composition in Marian Cove Surface Waters, King George Island, Antarctica during the Summer of 2018. Microorganisms 2020, 8, 1115. [Google Scholar] [CrossRef] [PubMed]
Figure 1.
Map of the Marian Cove, showing the 15 stations used in the study (A1–E3). The seawater was captured at the surface, middle, and bottom layers for bacterial data collection.
Figure 1.
Map of the Marian Cove, showing the 15 stations used in the study (A1–E3). The seawater was captured at the surface, middle, and bottom layers for bacterial data collection.

Publisher’s Note: MDPI stays neutral with regard to jurisdictional claims in published maps and institutional affiliations. |
© 2021 by the authors. Licensee MDPI, Basel, Switzerland. This article is an open access article distributed under the terms and conditions of the Creative Commons Attribution (CC BY) license (http://creativecommons.org/licenses/by/4.0/).
Share and Cite
MDPI and ACS Style
Kim, H.-R.; Lim, J.-H.; Kim, J.-H.; Kim, I.-N. Collection of Environmental Variables and Bacterial Community Compositions in Marian Cove, Antarctica, during Summer 2018. Data 2021, 6, 27. https://0-doi-org.brum.beds.ac.uk/10.3390/data6030027
AMA Style
Kim H-R, Lim J-H, Kim J-H, Kim I-N. Collection of Environmental Variables and Bacterial Community Compositions in Marian Cove, Antarctica, during Summer 2018. Data. 2021; 6(3):27. https://0-doi-org.brum.beds.ac.uk/10.3390/data6030027
Chicago/Turabian StyleKim, Hyo-Ryeon, Jae-Hyun Lim, Ju-Hyoung Kim, and Il-Nam Kim. 2021. "Collection of Environmental Variables and Bacterial Community Compositions in Marian Cove, Antarctica, during Summer 2018" Data 6, no. 3: 27. https://0-doi-org.brum.beds.ac.uk/10.3390/data6030027