The Retreat of Mountain Glaciers since the Little Ice Age: A Spatially Explicit Database

 , , ,
, , ,  , , , , ,
  , , , , , , , , , , , and
  add
Show full author list
add
Show full author list
Abstract
:Abstract
Dataset
Dataset License
1. Summary
2. Data Description

| Filename | Description |
|---|---|
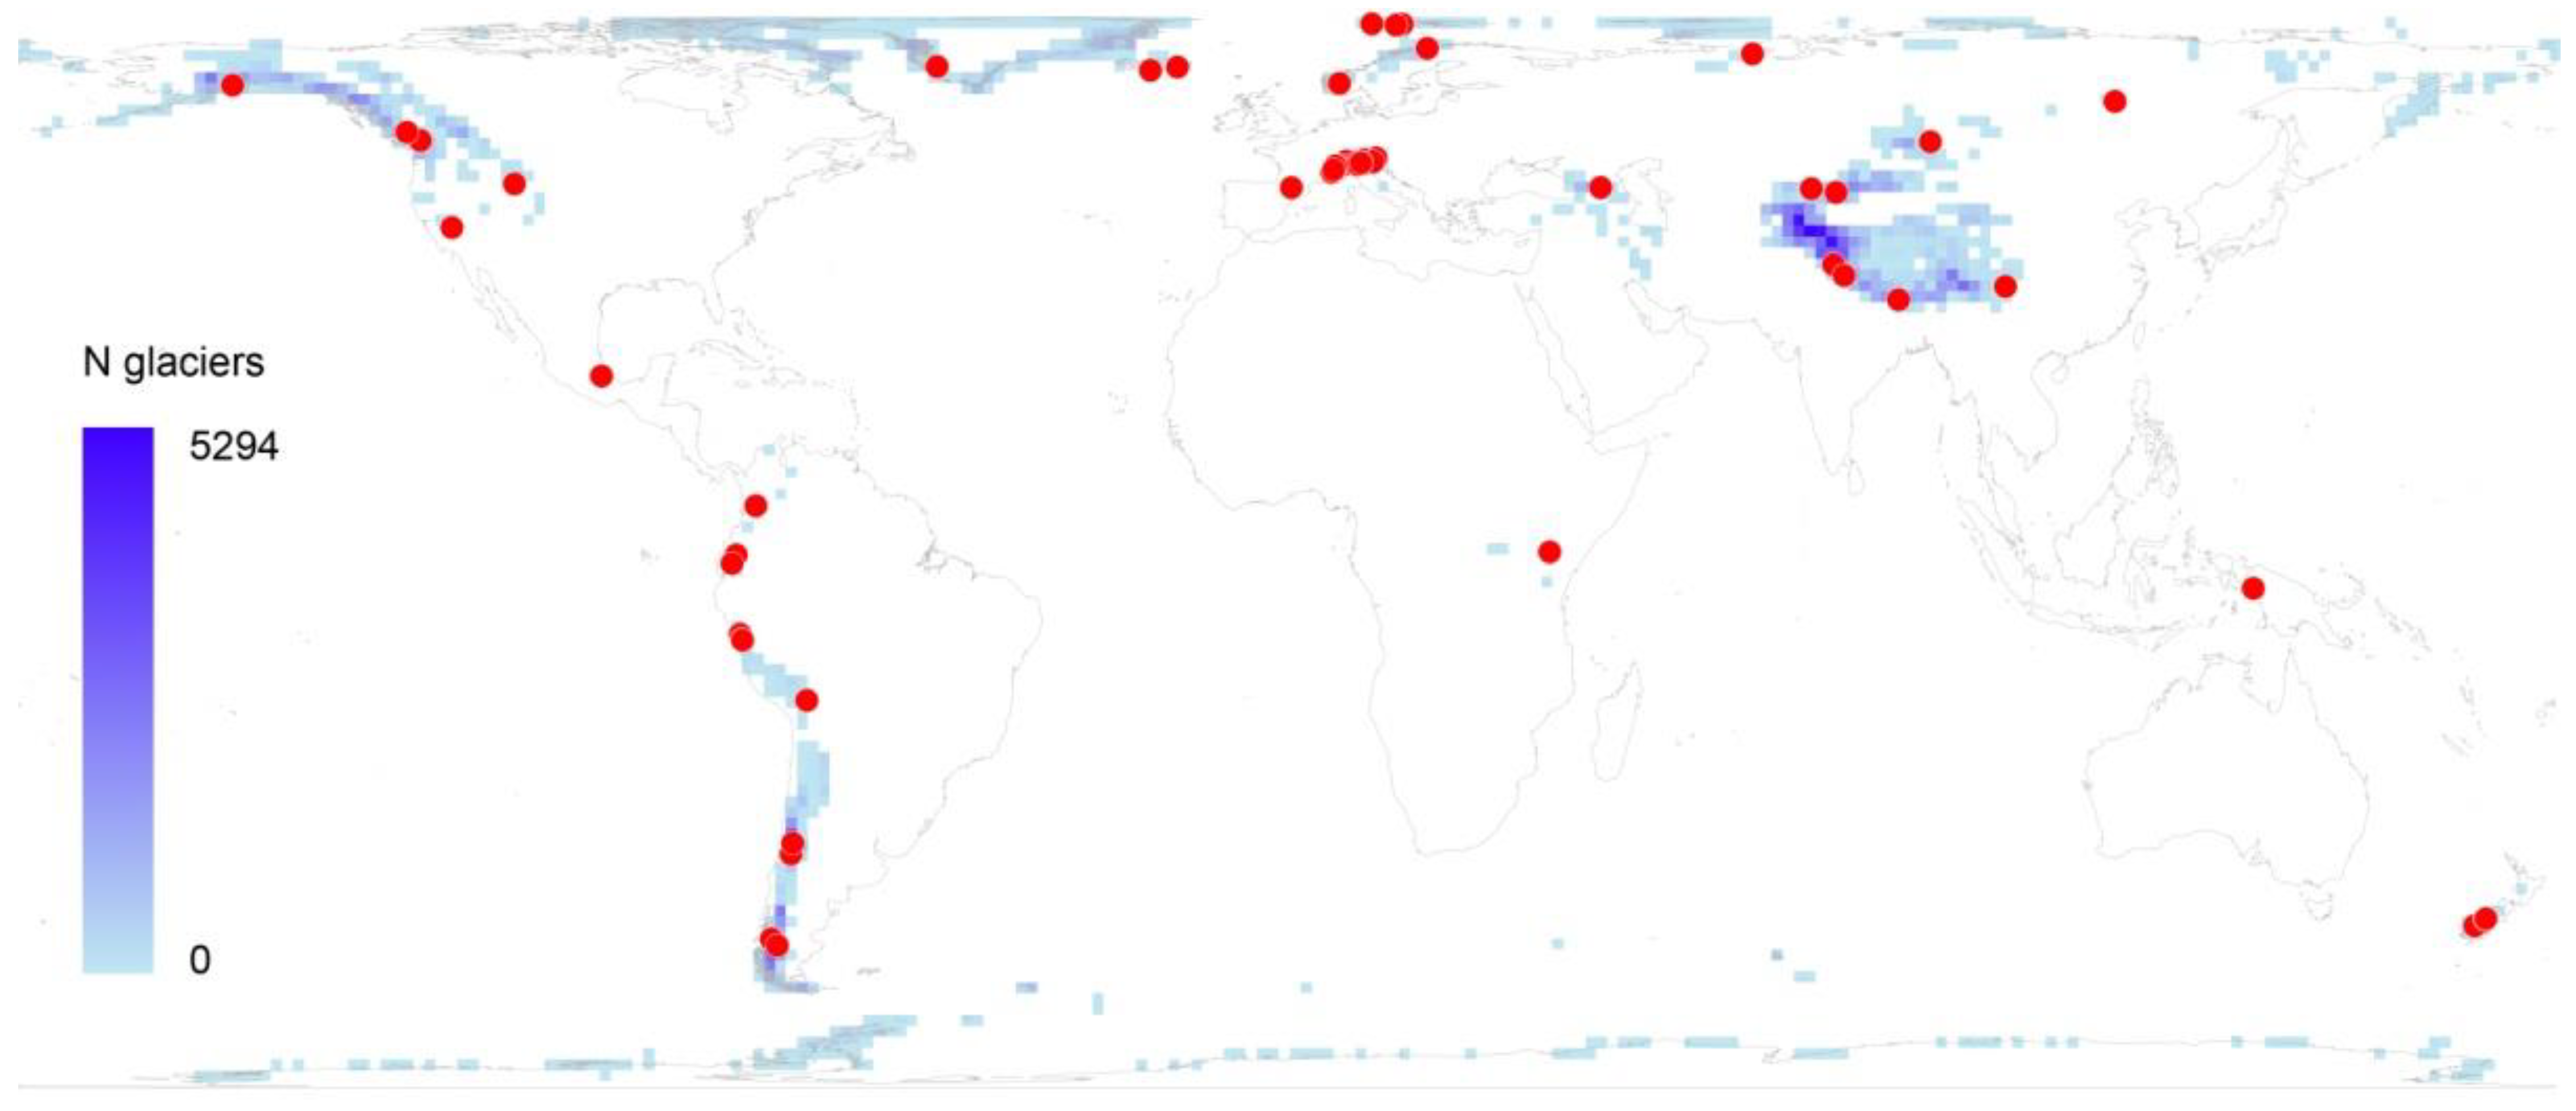
| IC_glac_lines (*.shp, *.shx, *.prj, *.dbf) | ESRI shapefile (EPSG:4326) containing the 728 reconstructed positions of glacier margins for the 94 glacier analyzed. For each line, glacier name, dating, source, GLIMS id, and maximum extent are reported in the associated table. |
| IC_glac_ sites (*.csv) | Table reporting the description of the study sites (glacier name, GLIMS id, country, coordinates of the centroid, mean elevation, mean annual temperature, annual precipitation, lithology, area, and number of reconstructed lines) |
| IC_glac_references (*.csv) | Table reporting the references cited in IC_glac_lines |
- IC_glac_lines
| Identity | Definition | Unit | Storage | Range |
|---|---|---|---|---|
| glacier | Glacier name | - | Character | - |
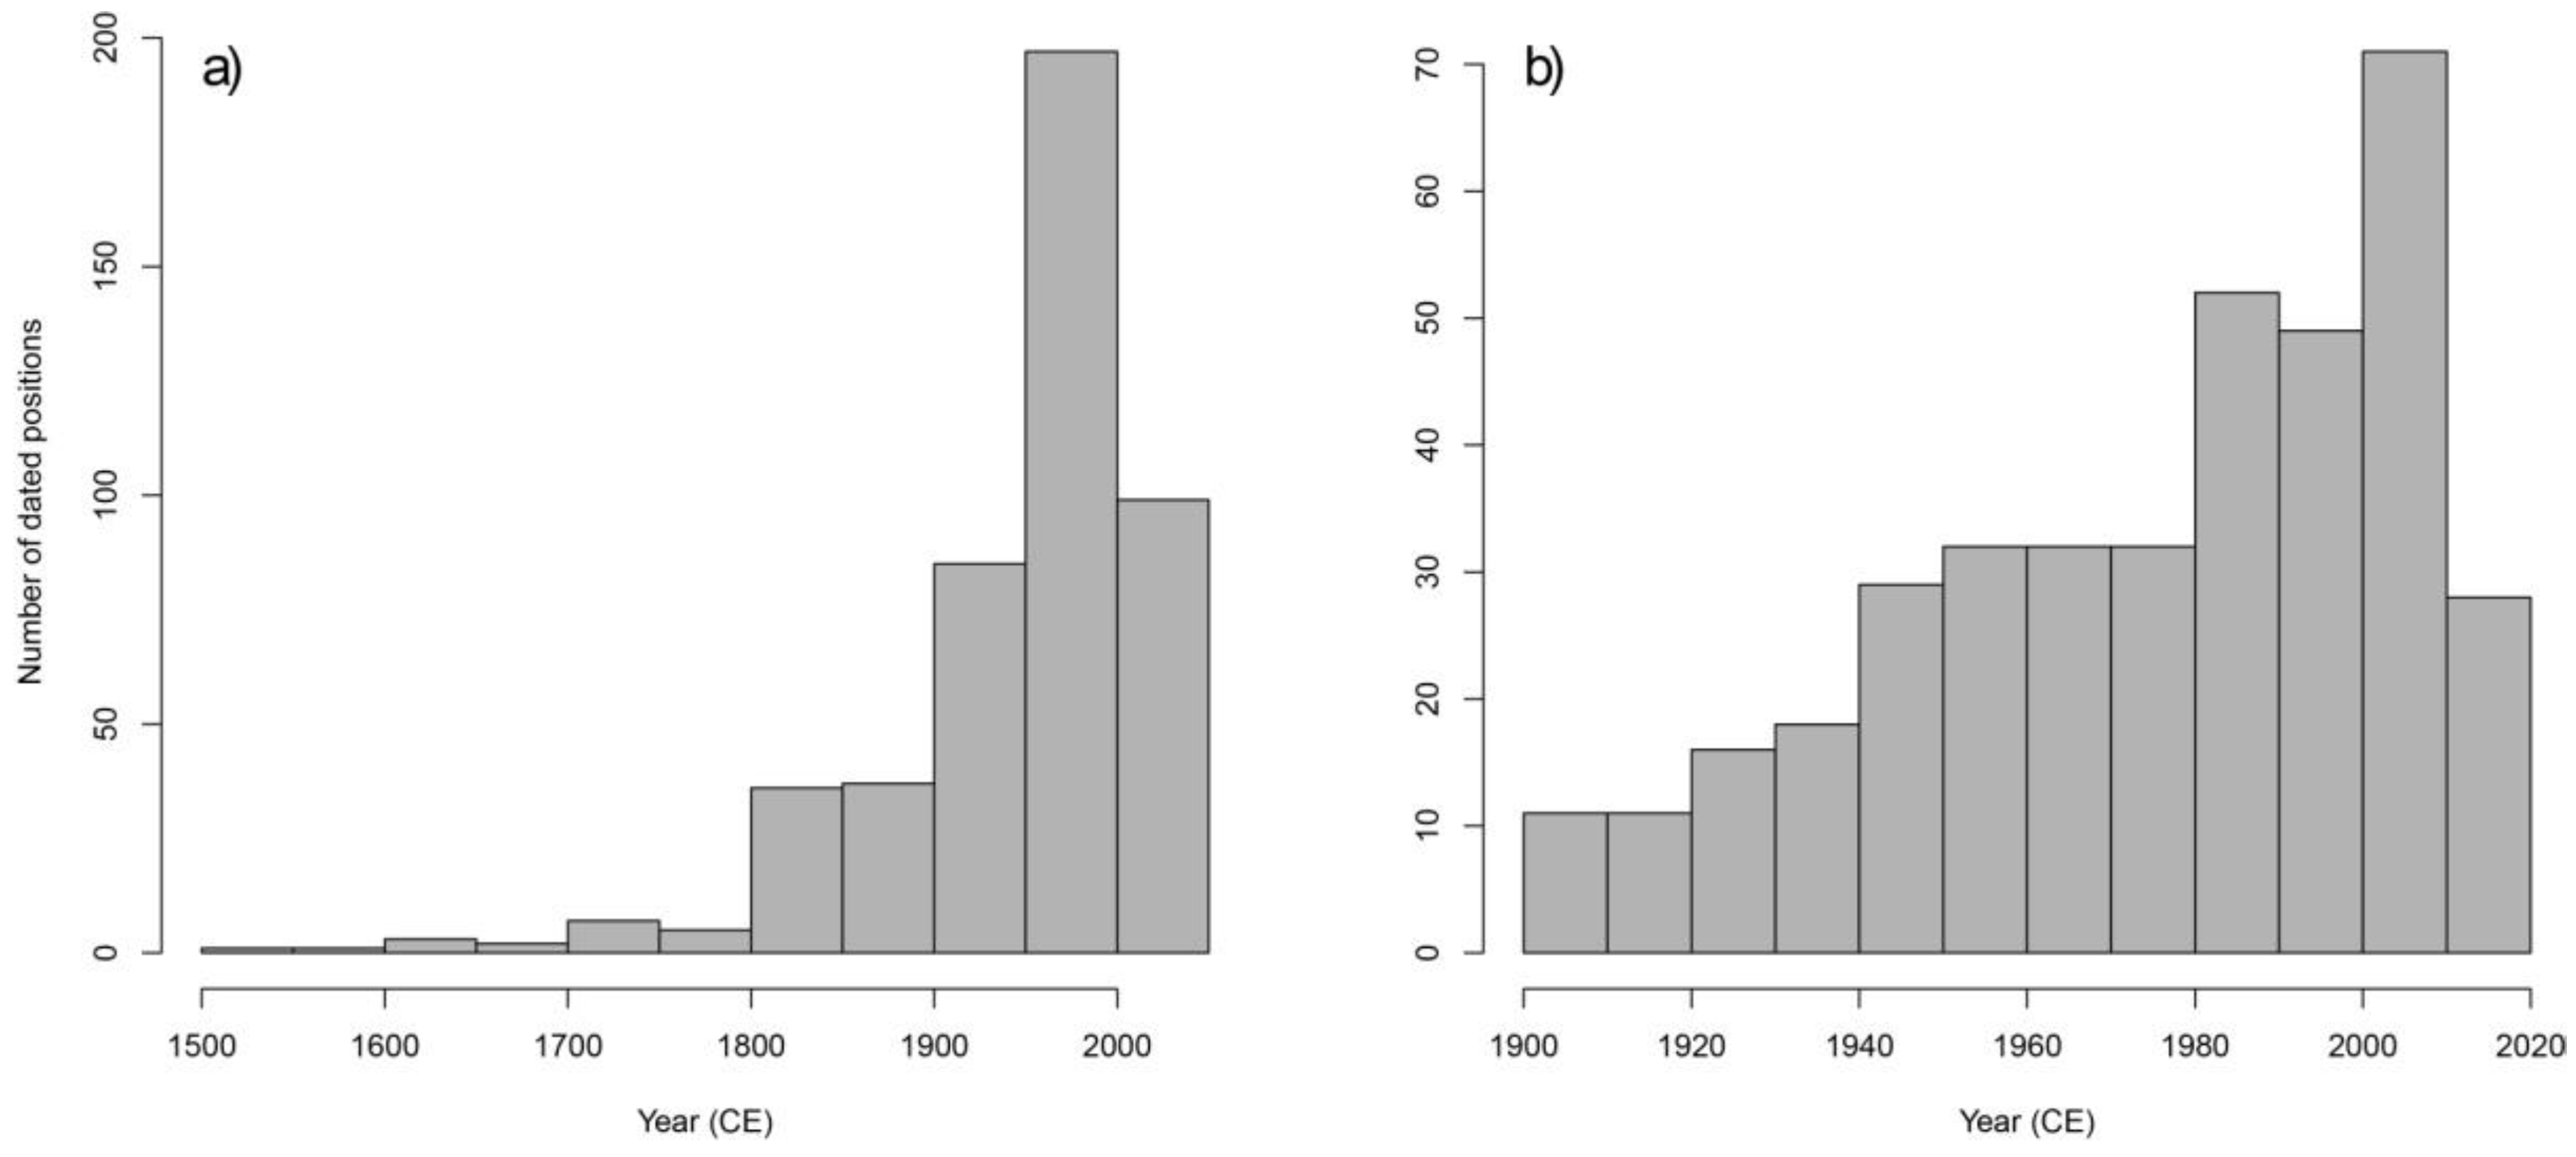
| dating | Dating | year CE | Integer/character | 1500 to 2019 |
| source | Reference | - | Character | - |
| GLIMS_id | Id | - | Character | - |
| max_extent | Maximum glacier extent 1 | - | Character (y/n) | - |
- IC_glac_sites
| Identity | Definition | Unit | Storage | Range |
|---|---|---|---|---|
| glacier | Glacier name | - | Character | - |
| country | Country name | - | Character | - |
| GLIMS_id | Id | - | Character | - |
| lon_wgs84 | Longitude (centroid) | DD | Numeric | −149.631 to 170.173 |
| lat_wgs84 | Latitude (centroid) | DD | Numeric | −47.530 to 78.899 |
| elev_m | Mean elevation | m a.s.l. | Integer | 51 to 5120 |
| mat_°C | Mean annual temperature 1 | °C | Numeric | −13.28 to 9.49 |
| pcp_mm | Annual precipitation 1 | mm | Integer | 181 to 4515 |
| litho | Lithology 2 | - | Character | - |
| area_km2 | Glacier area 3 | km2 | Numeric | 0.014 to 8091.670 |
| N_positions | Number of reconstructed lines | - | Numeric | 1 to 27 |
- IC_glac_references
| Identity | Definition | Unit | Storage | Range |
|---|---|---|---|---|
| References | Sources used to reconstruct or date glacier margins | - | Character | - |
3. Methods
4. User Notes
Author Contributions
Funding
Institutional Review Board Statement
Informed Consent Statement
Data Availability Statement
Conflicts of Interest
References
- Marzeion, B.; Cogley, J.G.; Richter, K.; Parkes, D. Attribution of global glacier mass loss to anthropogenic and natural causes. Science 2014, 345, 919–921. [Google Scholar] [CrossRef] [PubMed]
- Zemp, M.; Huss, M.; Thibert, E.; Eckert, N.; McNabb, R.; Huber, J.; Barandun, M.; Machguth, H.; Nussbaumer, S.U.; Gärtner-Roer, I.; et al. Global glacier mass changes and their contributions to sea-level rise from 1961 to 2016. Nature 2019, 568, 382–386. [Google Scholar] [CrossRef] [PubMed]
- Leclercq, P.W.; Oerlemans, J.; Cogley, J.G. Estimating the Glacier Contribution to Sea-Level Rise for the Period 1800–2005. Surv. Geophys. 2011, 32, 519–535. [Google Scholar] [CrossRef] [Green Version]
- Hock, R.; Rasul, G.; Adler, C.; Cáceres, B.; Gruber, S.; Hirabayashi, Y.; Jackson, M.; Kääb, A.; Kang, S.; Kutuzov, S.; et al. High Mountain Areas. In IPCC Special Report on the Ocean and Cryosphere in a Changing Climate; Pörtner, H.-O., Roberts, D.C., Masson-Delmotte, V., Zhai, P., Tignor, M., Poloczanska, E., Mintenbeck, K., Alegría, A., Nicolai, M., Okem, A., et al., Eds.; IPCC Intergovernmental Panel on Climate Change: Geneva, Switzerland; Available online: www.ipcc.ch2019 (accessed on 2 August 2021).
- Gardent, M.; Rabatel, A.; Dedieu, J.-P.; Deline, P. Multitemporal glacier inventory of the French Alps from the late 1960s to the late 2000s. Glob. Planet. Chang. 2014, 120, 24–37. [Google Scholar] [CrossRef]
- Smiraglia, C.; Diolaiuti, G.A. The New Italian Glacier Inventory; Ev-K2-CNR: Bergamo, Italy, 2015. [Google Scholar]
- Paul, F.; Rastner, P.; Azzoni, R.S.; Diolaiuti, G.; Fugazza, D.; Le Bris, R.; Nemec, J.; Rabatel, A.; Ramusovic, M.; Schwaizer, G.; et al. Glacier shrinkage in the Alps continues unabated as revealed by a new glacier inventory from Sentinel-2. Earth Syst. Sci. Data 2020, 12, 1805–1821. [Google Scholar] [CrossRef]
- Tielidze, L.G.; Wheate, R.D. The Greater Caucasus Glacier Inventory (Russia, Georgia and Azerbaijan). Cryosphere 2018, 12, 81–94. [Google Scholar] [CrossRef] [Green Version]
- Khedim, N.; Cecillon, L.; Poulenard, J.; Barré, P.; Baudin, F.; Marta, S.; Rabatel, A.; Dentant, C.; Cauvy-Fraunié, S.; Anthelme, F.; et al. Topsoil organic matter build-up in glacier forelands around the world. Glob. Chang. Biol. 2021, 27, 1662–1677. [Google Scholar] [CrossRef]
- Cauvy-Fraunié, S.; Dangles, O. A global synthesis of biodiversity responses to glacier retreat. Nat. Ecol. Evol. 2019, 3, 1675–1685. [Google Scholar] [CrossRef]
- Erschbamer, B.; Caccianiga, M. Glacier Forelands: Lessons of Plant Population and Community Development. Prog. Bot. 2016, 78, 259–284. [Google Scholar] [CrossRef] [Green Version]
- Ficetola, G.F.; Marta, S.; Guerrieri, A.; Gobbi, M.; Ambrosini, R.; Fontaneto, D.; Zerboni, A.; Poulenard, J.; Caccianiga, M.; Thuiller, W. Dynamics of ecological communities following current retreat of glaciers. Annu. Rev. Ecol. Evol. Syst. 2021, 52. [Google Scholar] [CrossRef]
- Rosero, P.; Crespo-Pérez, V.; Espinosa, R.; Andino, P.; Barragán, Á.; Moret, P.; Gobbi, M.; Ficetola, G.F.; Jaramillo, R.; Muriel, P.; et al. Multi-taxa colonisation along the foreland of a vanishing equatorial glacier. Ecography 2021, 44, 1010–1021. [Google Scholar] [CrossRef]
- Carey, M. Living and dying with glaciers: People’s historical vulnerability to avalanches and outburst floods in Peru. Glob. Planet. Chang. 2005, 47, 122–134. [Google Scholar] [CrossRef]
- Carey, M. The history of ice: How glaciers became an endangered species. Environ. Hist. 2007, 12, 497–527. [Google Scholar] [CrossRef] [Green Version]
- Nüsser, M.; Schmidt, S. Nanga Parbat revisited: Evolution and dynamics of sociohydrological interactions in the Northwestern Himalaya. Ann. Am. Assoc. Geogr. 2017, 107, 403–415. [Google Scholar] [CrossRef] [Green Version]
- WGMS. Fluctuations of Glaciers Database; World Glacier Monitoring Service: Zurich, Switzerland. [CrossRef]
- GLIMS; NSIDC. Global Land Ice Measurements from Space Glacier Database; International GLIMS Community and the National Snow and Ice Data Center: Boulder, CO, USA, 2005; Available online: www.glims.org (accessed on 3 February 2021).
- Raup, B.H.; Racoviteanu, A.; Khalsa, S.J.S.; Helm, C.; Armstrong, R.; Arnaud, Y. The GLIMS Geospatial Glacier Database: A New Tool for Studying Glacier Change. Glob. Planet. Chang. 2007, 56, 101–110. [Google Scholar] [CrossRef]
- Rabatel, A.; Francou, B.; Soruco, A.; Gomez, J.; Cáceres, B.; Ceballos, J.L.; Basantes, R.; Vuille, M.; Sicart, J.E.; Huggel, C.; et al. Current state of glaciers in the tropical Andes: A multi-century perspective on glacier evolution and climate change. Cryosphere 2013, 7, 81–102. [Google Scholar] [CrossRef] [Green Version]
- Nussbaumer, S.U.; Zumbühl, H.J. The Little Ice Age history of the Glacier des Bossons (Mont Blanc massif, France): A new high-resolution glacier length curve based on historical documents. Clim. Chang. 2012, 111, 301–334. [Google Scholar] [CrossRef]
- Zumbühl, H.J.; Nussbaumer, S.U. Little Ice Age glacier history of the Central and Western Alps from pictorial documents. Cuad. Investig. Geogr. 2018, 44, 115–136. [Google Scholar] [CrossRef] [Green Version]
- Nüsser, M.; Schmidt, S. Glacier changes on the Nanga Parbat 1856-2020: A multi-source retrospective analysis. Sci. Total Environ. 2021, 785, 147321. [Google Scholar] [CrossRef]
- Nüsser, M.; Schmidt, S. Assessing glacier changes in the Nanga Parbat region using a multitemporal photographic dataset. Data Brief 2021, 37, 107178. [Google Scholar] [CrossRef] [PubMed]
- Cogley, J.G.; Arendt, A.A.; Bauder, A.; Braithwaite, R.J.; Hock, R.; Jansson, P.; Kaser, G.; Moller, M.; Nicholson, L.; Rasmussen, L.A.; et al. Glossary of Glacier Mass Balance and Related Terms; IHP-VII Technical Documents in Hydrology No. 86; IACS Contribution No. 2; UNESCO-IHP: Paris, France, 2011. [Google Scholar]
- Jomelli, V.; Favier, V.; Rabatel, A.; Brunstein, D.; Hoffmann, G.; Francou, B. Fluctuations of glaciers in the tropical Andes over the last millennium and palaeoclimatic implications: A review. Paleogeogr. Paleoclimatol. Paleoecol. 2009, 281, 269–282. [Google Scholar] [CrossRef]
- Morano-Buchner, C.; Aravena, J.C. Lichenometric analysis using genus Rhizocarpon, section Rhizocarpon (Lecanorales: Rhizocarpaceae) at Mount San Lorenzo, southern Chile. Rev. Chil. Hist. Nat. 2013, 86, 465–473. [Google Scholar] [CrossRef] [Green Version]
- Martin, L.J.; Blossey, B.; Ellis, E. Mapping where ecologists work: Biases in the global distribution of terrestrial ecological observations. Front. Ecol. Environ. 2012, 10, 195–201. [Google Scholar] [CrossRef] [Green Version]
- Ficetola, G.F.; Rondinini, C.; Bonardi, A.; Katariya, V.; Padoa-Schioppa, E.; Angulo, A. An evaluation of the robustness of global amphibian range maps. J. Biogeogr. 2014, 41, 211–221. [Google Scholar] [CrossRef]
- Karger, D.N.; Conrad, O.; Böhner, J.; Kawohl, T.; Kreft, H.; Soria-Auza, R.W.; Zimmermann, N.E.; Linder, H.P.; Kessler, M. Climatologies at high resolution for the earth’s land surface areas. Sci. Data 2017, 4, 170122. [Google Scholar] [CrossRef] [PubMed] [Green Version]
- Hartmann, J.; Moosdorf, N. The new global lithological map database GLiM: A representation of rock properties at the Earth surface. Geochem. Geophys. Geosyst. 2012, 13, Q12004. [Google Scholar] [CrossRef]
- Chand, P.; Sharma, M.C.; Bhambri, R.; Sangewar, C.V.; Juyal, N. Reconstructing the pattern of the Bara Shigri Glacier fluctuation since the end of the Little Ice Age, Chandra valley, north-western Himalaya. Prog. Phys. Geogr. 2017, 41, 643–675. [Google Scholar] [CrossRef]
- Zekollari, H.; Huss, M.; Farinotti, D. On the Imbalance and Response Time of Glaciers in the European Alps. Geophys. Res. Lett. 2020, 47, e2019GL085578. [Google Scholar] [CrossRef] [Green Version]


Publisher’s Note: MDPI stays neutral with regard to jurisdictional claims in published maps and institutional affiliations. |
© 2021 by the authors. Licensee MDPI, Basel, Switzerland. This article is an open access article distributed under the terms and conditions of the Creative Commons Attribution (CC BY) license (https://creativecommons.org/licenses/by/4.0/).
Share and Cite
Marta, S.; Azzoni, R.S.; Fugazza, D.; Tielidze, L.; Chand, P.; Sieron, K.; Almond, P.; Ambrosini, R.; Anthelme, F.; Alviz Gazitúa, P.; et al. The Retreat of Mountain Glaciers since the Little Ice Age: A Spatially Explicit Database. Data 2021, 6, 107. https://0-doi-org.brum.beds.ac.uk/10.3390/data6100107
Marta S, Azzoni RS, Fugazza D, Tielidze L, Chand P, Sieron K, Almond P, Ambrosini R, Anthelme F, Alviz Gazitúa P, et al. The Retreat of Mountain Glaciers since the Little Ice Age: A Spatially Explicit Database. Data. 2021; 6(10):107. https://0-doi-org.brum.beds.ac.uk/10.3390/data6100107
Chicago/Turabian StyleMarta, Silvio, Roberto Sergio Azzoni, Davide Fugazza, Levan Tielidze, Pritam Chand, Katrin Sieron, Peter Almond, Roberto Ambrosini, Fabien Anthelme, Pablo Alviz Gazitúa, and et al. 2021. "The Retreat of Mountain Glaciers since the Little Ice Age: A Spatially Explicit Database" Data 6, no. 10: 107. https://0-doi-org.brum.beds.ac.uk/10.3390/data6100107