Influence of the Coating System on the Acoustic, Thermal and Luminous Performance of Brazilian Buildings

 , and
, and
Abstract
:1. Introduction
2. Building’s Performance and Requirements
2.1. Acoustic Performance of Housing Buildings
2.2. Thermal Performance of Housing Buildings
2.3. Luminous Performance of Housing Buildings
- −
- During the day, the housing building facilities of the rooms, dormitories, pantry/kitchens, and service areas must receive convenient natural lighting, coming from the outside or indirectly, through adjacent enclosures.
- −
- For the night time, the artificial lighting system must provide satisfactory internal conditions for enclosure occupancy and circulation in environments with comfort and safety.
3. Methodology
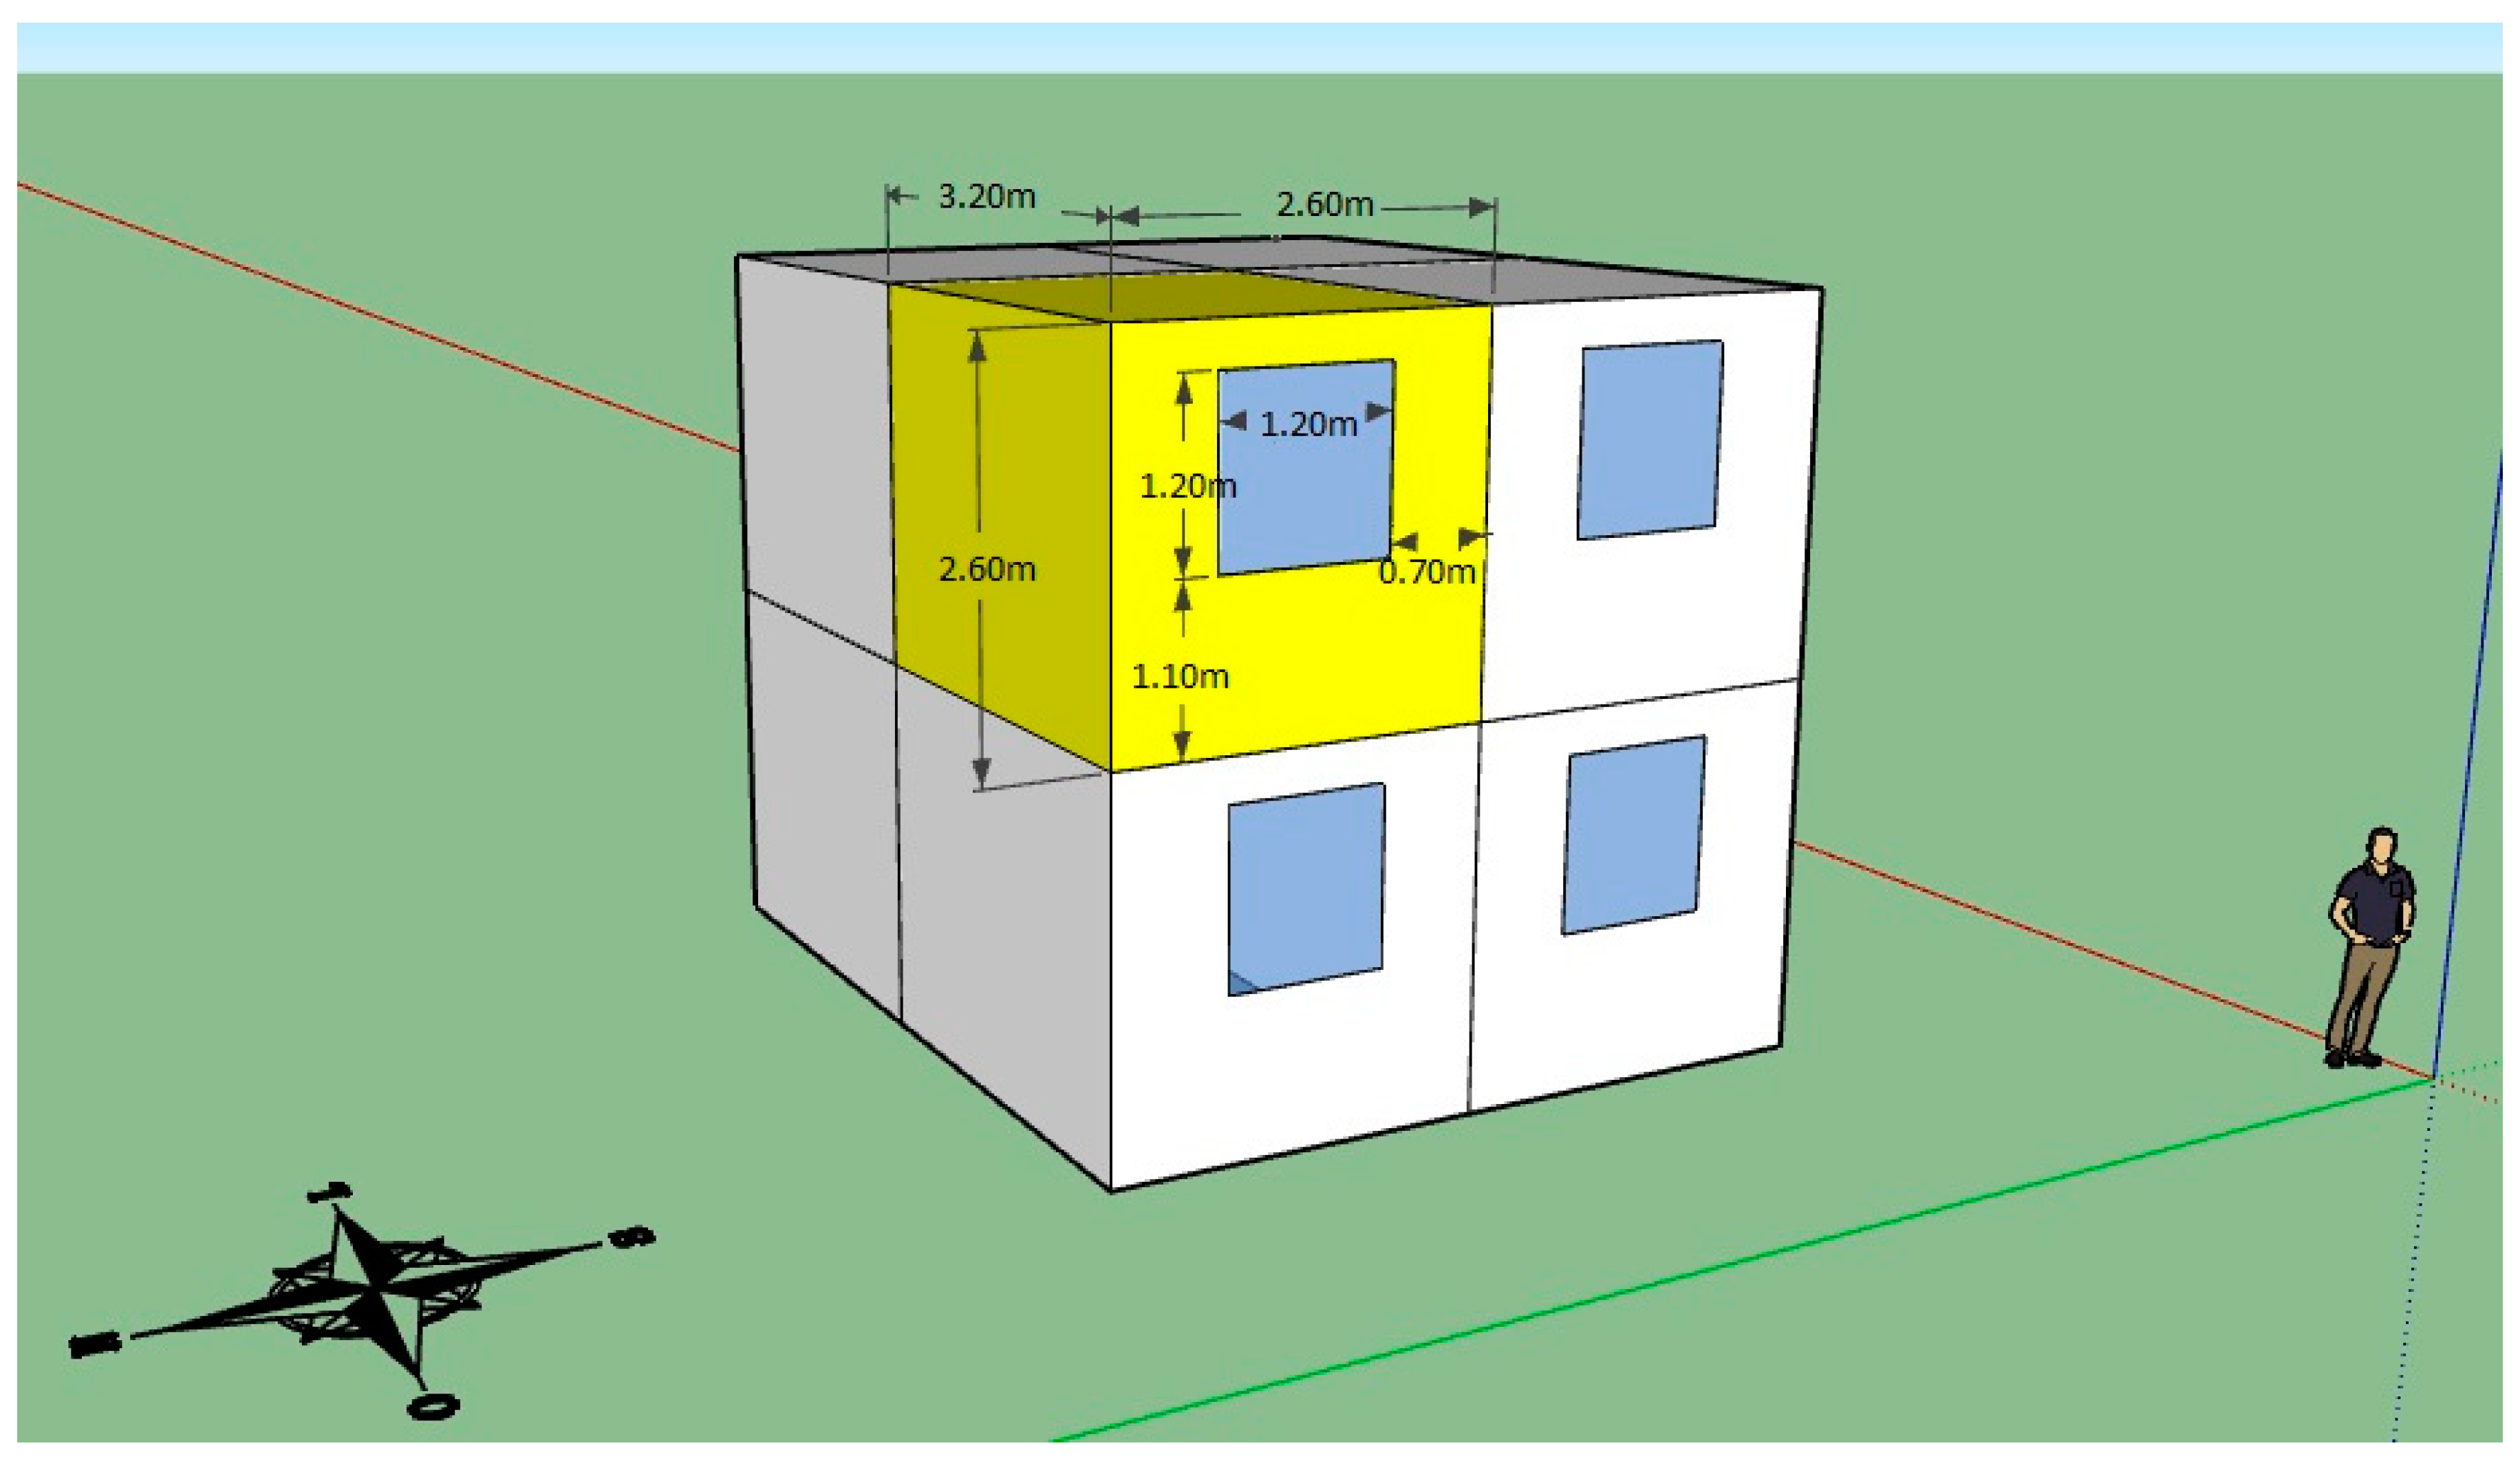
3.1. Reference Model
Building Components
3.2. Adopted Method for the Study of Acoustic Performance
3.3. Adopted Method for the Study of Luminous Performance
3.4. Adopted Method for the Study of Thermal Performance
4. Results and Discussion
4.1. Acoustic Performance Results
- −
- The variation in the thickness of the internal and external coatings of the external wall (façade) does not increase the insulation of the external or internal walls (ID2-5, ID9, and ID10). They also do not show a significant increase in the insulation of the floor system or internal walls, with 1 dB being the largest recorded.
- −
- The variations in the structural element of the external wall did not increase the acoustic insulation of the internal or external wall systems. They also do not show a significant increase in the insulation of the floor system or internal walls, with 1 dB being the highest recorded (ID6, ID7, and ID8). This not vulgar result is explained by the Rw of the window that governs the insulation of the external wall. In Brazil, the most used windows presented low values of Rw, and the increase in the sound reduction index (Rw) of the opaque element (wall) is not reflected in a correspondent increase in the insulation of the external wall, if this type of window is maintained (see simulation results ID12 and ID13).
- −
- The variation of the external windows showed a significant increase, reaching an increase of 8 dB in relation to the reference model, in the acoustic insulation of the external walls (ID12 and ID13).
- (a)
- For Internal wall systems, the results show:
- −
- The increase in the thickness of the coatings provides an important increase in the acoustic insulation of the internal walls. It is noticed that such increase has a direct correlation with the increase in the thickness of the coatings (ID14 to ID 17).
- −
- The alteration of the structural element of the internal walls provided a relevant increase in the acoustic insulation to aerial noise of the internal wall system (ID18 and ID20).
- −
- By comparing the use of MCB14 and BCO14, it can be seen that the increase in the density of the wall element has a direct correlation with the increase in sound insulation, thus, despite the same dimension, the concrete block has greater sound insulation.
- −
- The changes in the internal wall systems (IWS) have no significant increase in the insulation of the floor system or external or floor seals, with 1 dB being the largest recorded.
- (b)
- The results presented for Floor Systems shows:
- −
- The removal of the ceiling considered in the reference model caused a significant decrease in the acoustic insulation both to aerial noise and to the impact noise of the floor system and still had a less significant impact, reducing the acoustic insulation of the internal wall system (ID21).
- −
- The use of mineral wool on the plaster lining provided an increase of only 1 dB in the insulation to noise from impacts of the floor system, and no increase in the acoustic insulation to aerial noise, showing itself as an ineffective solution (ID22).
- −
- The increase in the thickness of the structural element of the reference model resulted in a positive increase in acoustic insulation for both aerial and impact noise, with a direct correlation between the increase in thickness and the increase in acoustic insulation (ID23 to ID25).
- −
- The increase in the thickness of the structural element also generated a minor increase in the acoustic insulation of the external wall system (ID23 to ID25).
- −
- The adoption of the acoustic blanket between the structural element and the subfloor in the reference model showed a very high increase in terms of acoustic insulation to noise from impacts of the floor system (ID26 and ID27). However, it did not confer any change in the insulation to aerial noise.
- −
- The results presented in the simulation for the floor system without lining (ID21) and for the floor covering system with ∆Lw equal to 29 dB (ID27) are compatible with the results obtained in tests presented in a scientific article by Zuchetto et al. [35].
- −
- The increase in the thickness of the subfloor gave an insignificant increase in relation to the acoustic insulation to impact noise and aerial noise of the floor system (ID28 and ID29).
- −
- The increase in the thickness of the subfloor also gave a minor increase in relation to the acoustic insulation of the external wall system of the reference model (ID28 and ID29).
4.2. Luminous Performance Results
- −
- The color of the internal coating of the external wall system has a significant influence on the luminous performance of the model (ID32 and ID32).
- −
- The color of the façade lining did not present a relevant influence on the luminous performance of the model (ID32 to ID37).
- −
- The types of glasses considered had a very significant influence on the luminous performance of the model (ID38 and ID39).
- −
- The color of the lining of the internal walls showed a very significant influence on the luminous performance of the model (ID401 and ID41).
- −
- The colors of floor and ceiling coatings showed significant influence on the acoustic performance of the model (ID42 to ID45).
4.3. Thermal Performance Results
- −
- The increase in the thickness of the coating layers, both internal and external, showed a direct correlation with the decrease in temperature in the evaluated environment, contributing significantly to the improvement of the thermal performance of the model (ID49–ID52, ID56, and ID57). The changes in the structuring elements of the external walls also resulted in significant changes in temperature inside the environment, and the solid concrete wall presented the best result among the evaluated systems (ID53 to ID55).
- −
- Changes in the color of the external lining of the façades resulted and very significant variations in the temperature values measured in the environments and the darker the temperature were, consequently, worse thermal performance (ID58 to ID62). It can also be observed that models with coating on ceramic boards present temperatures slightly lower than textures with the same color.
- −
- It can also be observed that the lower the Solar Factor of the windows of the external windows of the model, the lower the temperature measured in the environment (ID63 and ID64).
- (a)
- The results for Roofing Systems shows:
- −
- The change in the color of the lining, that is, the color of the ceiling, does not significantly interfere with the temperature of the environment (ID65 and ID66).
- −
- The removal of the plaster lining of the model represented a significant increase in the temperature measured in the environment, representing a loss of thermal performance in the building (ID67).
- −
- The increase in the thickness of the structural element, solid concrete slab, presented a direct correlation with the improvement of thermal performance, resulting in a relatively relevant decrease in ambient temperature (ID69–ID71).
- −
- The use of thermal blanket, either with XPS or EPS, in the roof, even with relatively small thicknesses, proved to be an intervention with significant effect on thermal performance and reduction of ambient temperatures (ID72 and ID73).
- −
- The roof with fiber cement tiles showed a significantly lower thermal performance than the reference model, even considering the air layer between the roof and the structural element (ID74).
- −
- The change in color/absorbedness of the external finishing layer of the roofing system had a very significant impact on the thermal performance of the model, having a direct relationship between the increase in absorbedness and internal temperature (ID75 and ID76).
4.4. Resume
5. Conclusions
- (a)
- Acoustic performance
- Façades
- −
- The coating systems have low influence on the acoustic performance of the façade, and external windows are the main element of influence in this requirement.
- Internal walls
- −
- Coating systems have a high influence on the acoustic performance of internal walls, being of the same order of magnitude as the influence of the façades. However, the largest increments were obtained with high thicknesses, from 4 cm on each side, which may not be feasible from an executive point of view.
- Floor systems
- −
- The use of liners in the floor system has provided an important increase in insulation for both air and impact noise. On the other hand, the use of mineral wool has not been shown to be an efficient solution for sound insulation.
- −
- The increase in the thickness of the structural layer of the floor system provided an increase in acoustic insulation for both air and impact noise. However, increasing the thickness of the floor proved to be an ineffective solution.
- −
- The use of resilient acoustic blankets in a floating floor system has proved to be the most efficient solution for increasing insulation to impact noise, although the solution does not present a relevant increase in air noise insulation.
- (b)
- Thermal performance
- −
- Thermal performance is influenced by virtually all elements and components of external wall systems (façades) and roofing system, with the colors of the façade and roofing system, use of thermal blanket, and typology of the roofing system being the main factors of influence.
- −
- Thermal performance is not significantly influenced by the floor system or internal wall system.
- (c)
- Luminous performance
- −
- The main variations that influenced the luminous performance were the external windows and the color of the coatings of the internal walls and ceiling. As more translucent is the glass and lighter the color of the internal walls and ceiling, higher is the level of illuminance in the environment.
- −
- The colors of the external coating and the floor also have an influence on the luminous performance, although with less importance.
- −
- To improve the acoustic insulation of external vertical seals (facades), considering the construction systems studied here, the best strategy is to improve the insulation of the frames, being the optimization obtained mainly by using better components and glasses with larger thicknesses. To increase internal vertical seals or walls between buildings acoustic insulation, it is necessary to use heavier building systems (masses law) or that use the mass-spring-mass law, such as drywall systems or double walls. To increase noise isolation from the floor system impacts, percussion, the most efficient way identified was the use of resilient blankets under the floor. There are several materials available on the market for this purpose, from bituminous products, such as rubbers, polymers, such as expanded polypropylene, to natural material blankets or cork, for example. The most important thing is to evaluate the impact sound loss transmission appropriate to the project.
- −
- To improve thermal performance, several strategies can be used, from the use of external coatings of external walls and coverage with lower absorbedness, in the case of hot climates, to the use of materials of low thermal conductivity in sealing systems, such as EPS, drywall counter-wall with blanket, or coatings with low thermal conductivity. The use of glasses with smaller Solar Factors, more specifically with lower transmittance to solar radiation are also an interesting possibility.
- −
- To improve the luminous performance, the use of internal coatings, especially floors and walls, with greater reflectance to visible radiation and glasses with greater transmittance to visible radiation are the best strategies for optimizing natural lighting.
Author Contributions
Funding
Conflicts of Interest
References
- Gomes, J.E.V. Building Performance Evaluation According to ABNT NBR 15575: Adaptation to the Case of Rehabilitated Building. Master’s Thesis, Faculdade de Engengaria da Universidade do Porto, Porto, Portugal, 2015. [Google Scholar]
- Lorensi, L.S. Critical Analysis and Propose Advances in Methodologies of the Experimental Performance Tests to Analysis Based on ABNT NBR 15575 (2013). In UFRS, 2015NBR 15220-3: Thermal Performance in Buildings Part 3: Brazilian Bioclimatic Zones and Building Guidelines for Low-Cost Houses; Brazilian National Standards Organization: Rio de Janeiro-RJ, Brazil, 2005. [Google Scholar]
- Bluyssen, P.M. Management of the Indoor Environment: From a Component Related to an Interactive Top-down Approach. Indoor Built Environ. 2008, 17, 483–495. [Google Scholar] [CrossRef]
- Mendell, M.J. Indices for IEQ and building-related symptoms. Indoor Air 2003, 13, 364–368. [Google Scholar] [CrossRef] [PubMed]
- ANSI/ASHRAE 55. Thermal Environmental Conditions for Human Occupancy; American Society of Heating, Refrigerating and Air-Conditioning Engineers: Atlanta, GA, USA, 2004.
- ISO, International Organization for Standardization. ISO 7730. In Moderate Thermal Environments, Determination of the PMV and PPD Indices and Specification of the Conditions for Thermal Comfort; ISO: Geneva, Switzerland, 1995. [Google Scholar]
- Clausen, G.; Wyon, D.P. The Combined Effects of Many Different Indoor Environmental Factors on Acceptability and Office Work Performance. HVAC&R Res. 2008, 14, 103–113. [Google Scholar] [CrossRef]
- Goldman, R.F. Extrapolating ASHRAE’s Comfort Model. HVAC&R Res. 1999, 5, 189–194. [Google Scholar] [CrossRef]
- Haghighat, F.; Donnini, G. Impact of psycho-social factors on perception of the indoor air environment studies in 12 office buildings. Build. Environ. 1999, 34, 479–503. [Google Scholar] [CrossRef]
- Nagano, K.; Horikoshi, T. New Comfort index during combined conditions of moderate low ambient temperature and traffic noise. Energy Build. 2005, 37, 287–294. [Google Scholar] [CrossRef]
- Krüger, E.L.; Zannin, P.H. Acoustic, thermal and luminous comfort in classrooms. Build. Environ. 2004, 39, 1055–1063. [Google Scholar] [CrossRef]
- ABNT, Brazilian Association of Technical Standards. ISO 6241: Performance Standards in Building—Principles for Their Preparation and Factors to be Considered; International Organization for Standardization: Geneva, Switzerland, 1984. [Google Scholar]
- ABNT, Brazilian Association of Technical Standards. NBR 15575-1: Residential Buildings—Performance Part 1: General Requirements; Brazilian National Standards Organization: Rio de Janeiro-RJ, Brazil, 2013. [Google Scholar]
- ABNT, Brazilian Association of Technical Standards. NBR 15575-3: Residential Buildings—Performance Part 3: Requirements for Floor Systems; Brazilian National Standards Organization: Rio de Janeiro-RJ, Brazil, 2013. [Google Scholar]
- ABNT, Brazilian Association of Technical Standards. NBR 15575-4: Residential Buildings—Performance Part 4: Requirements for Internal and External Wall Systems; Brazilian National Standards Organization: Rio de Janeiro-RJ, Brazil, 2013. [Google Scholar]
- ABNT, Brazilian Association of Technical Standards. NBR 15575-5 Residential Buildings—Performance Part 5: Requirements for Roofing Systems; Brazilian National Standards Organization: Rio de Janeiro-RJ, Brazil, 2013. [Google Scholar]
- Proacústica. Proacoustic Manual for Noise Class of Housing Buildings; Brazilian Association for Acoustic Quality: São Paulo, Brazil, 2017. [Google Scholar]
- Souza, J.L.P.; Kern, A.P.; Tutikian, B.F. Quantitative and qualitative analysis of the Performance Standard (NBR 15575/2013) and Main Challenges of Implementing Higher Education in Residential Multi-Floor Building. Proj. Manag. Technol. 2018, 13, 127. [Google Scholar]
- ABNT, Brazilian Association of Technical Standards. NBR 15220-3: Thermal Performance in Buildings Part 3: Brazilian Bioclimatic Zones and Building Guidelines for low-Cost Houses; Brazilian National Standards Organization: Rio de Janeiro-RJ, Brazil, 2005. [Google Scholar]
- ABNT, Brazilian Association of Technical Standards. NBR 15220-2: Thermal Performance in Buildings Part 2: Calculation Methods of Thermal Transmittance, Thermal Capacity, Thermal Delay and Solar Heat Factor of Elements and Components of Buildings; Brazilian National Standards Organization: Rio de Janeiro-RJ, Brazil, 2005. [Google Scholar]
- Melo, A.P.; Lamberts, R. The Thermal Balance Method through Computer Simulation in the Energyplus Program; LabEEE—Energy Efficiency Laboratory in Buildings: Florianópolis, Brazil, 2008. [Google Scholar]
- Doe, U.S.D.O.E. EnergyPlus: Version 8.1.0. Available online: https://energyplus.net/ (accessed on 8 July 2019).
- Knebel, D.E.; Kolling, S.E.; McDowell, T.P. Standard Method of Test for the Evaluation of Building Energy Analysis Computer Programs; ASHRAE: Atlanta, GA, USA, 2017. [Google Scholar]
- Lamberts, R.; Dutra, L.; Pereira, F.O.R. Energy Efficiency in Architecture; Eletrobras/PROCEL: Rio de Janeiro, Brazil, 2014. [Google Scholar]
- Shishegar, N.; Boubekri, M. Natural Light and Productivity: Analyzing the Impacts of Daylighting on Students’ and Workers’ Health and Alertness. Int. J. Adv. Chem. Eng. Biol. Sci. 2016, 3, 1–6. [Google Scholar]
- Borisuit, A.; Linhart, F.; Scartezzini, J.-L.; Münch, M. Effects of realistic office daylighting and electric lighting conditions on visual comfort, alertness and mood. Light. Res. Technol. 2014, 47, 192–209. [Google Scholar] [CrossRef]
- Chan, A. Effect of adjacent shading on the thermal performance of residential buildings in a subtropical region. Appl. Energy 2012, 92, 516–522. [Google Scholar] [CrossRef]
- Insul, P.S.I. About Insul. Available online: http://www.insul.co.nz (accessed on 24 November 2019).
- ISO, International Organization for Standardization. ISO 12354-1: Building Acoustics—Estimation of Acoustic Performance of Buildings from the Performance of Elements—Part 1: Airborne Sound Insulation between Rooms; ISO: Geneva, Switzerland, 2017. [Google Scholar]
- ISO, International Organization for Standardization. ISO 12354-2 Building Acoustics—Estimation of Acoustic Performance of Buildings from the Performance of Elements—Part 2: Impact Sound Insulation between Rooms; ISO: Geneva, Switzerland, 2017. [Google Scholar]
- ISO, International Organization for Standardization. ISO 12354-3: Building Acoustics—Estimation of Acoustic Performance of Buildings from the Performance of Elements—Part 3: Airborne Sound Insulation against Outdoor Sound; ISO: Geneva, Switzerland, 2017. [Google Scholar]
- Remígio, E.G.; Barbosa, M.M.; Verissimo, J.V.; Junior, O.J.; Gois, P.F.; Costa e Silva, A.J. Comparative study between field tests and computer simulations for the isolation of aerial noise from VVI consisting of an 8-hole ceramic block. In Proceedings of the XV ENCAC, João Pessoa, Brazil, 18–21 September 2019; pp. 227–234. (In Portuguese). [Google Scholar]
- Bies, D.A.; Hansen, C.H. Engineering Noise Control—Theory and Practice; Spon Press: Abingdon, UK, 2009. [Google Scholar]
- Building Energy Efficiency Laboratory. Climatic Files. Available online: http://www.labeee.ufsc.br/downloads/arquivos-climaticos (accessed on 28 October 2019.).
- Zuchetto, L.K.; Oliveira, M.F.; Patrício, J.V. Influence of the compression conditions in the acoustic performance of resilient layers of floors. In Proceedings of the ICA 2016, Buenos Aires, Argentina, 5–9 September 2016. [Google Scholar]
- Mendonça, M.; Barbosa, M.M.; Mendonça Barbosa, M.; Demétrio, D.N.Q.; Gois, P.F.; Costa e Silva, A.J. Analysis of the influence of the external vertical wall system on the energy consumption of a residential building located in the bioclimatic zone 8. In Proceedings of the XV ENCAC, João Pessoa, Brazil, 18–21 September 2019; pp. 2120–2128. (In Portuguese). [Google Scholar]
- Husin, S.N.F.S.; Harith, Z.Y.H. The Performance of Daylight through Various Type of Fenestration in Residential Building. Procedia Soc. Behav. Sci. 2012, 36, 196–203. [Google Scholar] [CrossRef] [Green Version]


| Noise Class | Housing Location | D2m,nT,w (dB) |
|---|---|---|
| I | Housing located far away sources of intense noise | ≥20 |
| II | Housing located in areas subject to non-fit noise situations in Class I or III | ≥25 |
| III | Housing subject to intense noise from transports and others, since that it complies with the legislation | ≥30 |
| For external walls of rooms, kitchens, laundries, and bathrooms, there are no specific requirements. In regions of airports, stadiums, sporting event venues, highways, and railways, there is a need for specific studies. | ||
| Noise Class | Equivalent Sound Pressure Levels LAeq,T | D2m,nT,w (dB) |
|---|---|---|
| I | <60 dB | ≥20 |
| II | 61–65 dB | ≥25 |
| III | 66–70 dB | ≥30 |
| Element | DnT,w (dB) |
|---|---|
| Wall between autonomous housing units (twinning wall), in situations where there is no bedroom environment. | ≥40 |
| Wall between autonomous housing units (twinning wall), in case at least one of the environments is dormitory. | ≥45 |
| Blind wall of bedrooms between a housing unit and common areas of eventual transit, such as corridors and staircase on the floors. | ≥40 |
| Blind wall of rooms and kitchens between a housing unit and common areas of eventual transit, such as corridors and staircase on the floors. | ≥30 |
| Blind wall between a housing unit and common areas of permanence of people, leisure activities and sports activities, such as home theatre, gyms, ballroom, games room, bathrooms and locker rooms collective, kitchens and collective laundries. | ≥45 |
| Set of walls and doors of distinct units separated by the hall (DnT,w obtained between the units). | ≥40 |
| Element | DnT,w (dB) |
|---|---|
| Floor system between autonomous housing units, in case at least one of the environments is a bedroom. | ≥45 |
| Floor system separating autonomous units from common areas of eventual transit, such as corridors and staircase on the floors, as well as on different floors. Floor system between autonomous housing units, in situations where there is no bedroom. | ≥40 |
| Floor system separating autonomous housing units from common areas for collective use, for leisure and sports activities, such as home theatre, gyms, ballroom, games room, bathrooms and collective changing rooms, kitchens and collective laundries. | ≥45 |
| Element | L’nT,w (dB) |
|---|---|
| Floor system separating autonomous housing units positioned on different floors. | ≤80 |
| Floor system of public use areas (leisure and sports activities, such as home theatre, gyms, ballroom, games room, bathrooms and collective changing rooms, kitchens and collective laundries) on autonomous housing units. | ≤55 |
| External Wall Systems | Roofing System | ||||||
| Thermal transmittance, U (W/m².K) | |||||||
| Zones 1 and 2 | Zones 3–8 | Zones 1 and 2 | Zones 3–6 | Zones 7 and 8 | |||
| U ≤ 2.5 | α a ≤ 0.6 | α a ≥ 0.6 | U ≤ 2.3 | α a ≤ 0.6 | α a ≥ 0.6 | α a ≤ 0.6 | α a ≥ 0.6 |
| U ≤ 3.7 | U ≥ 2.5 | U ≤ 2.3 | U ≤ 1.5 | U ≤ 2.3FT | U ≤ 1.5FT | ||
| Thermal capacity, C (kJ/m².K) | |||||||
| Zones 1–7 | Zone 8 | ||||||
| C ≥ 130 | No requirements | ||||||
| Summer | Winter | |
|---|---|---|
| Zones 1–8 | Bioclimatic Zones 1–5 | Bioclimatic Zones 6–8 |
| Ti,máx ≤ Te,máx | Ti,mín ≥ (Te,mín + 3 °C) | No criterium |
| Ti,máx is the maximum daily air temperature value inside the building (°C); Ti,min is the minimum daily air temperature value inside the building (°C); Te,máx is the maximum daily value of the air temperature outside the building (°C); and Te,min is the minimum daily value of the air temperature outside the building (°C). | ||
| Building Division | Illuminance (lux) for Minimum Performance Level M | |
|---|---|---|
| Illuminance Levels for Natural Lighting | Daylight Factor | |
| Kitchen; Bedroom; Cup/kitchen; Service area | ≥60 | ≥0.50% |
| Bathroom; Corridor or internal staircase; Common use corridor in flats; Common staircase in flats; Garages/parking lots (other environments) | Not required | |
| EWS | Internal Coating | Wall | External Coating | Window | ||
|---|---|---|---|---|---|---|
| 1 | PAINTα0.3 | GP1 | MCB9 | MORT3 | CERα0.3 | WIND15Fg0.85 |
| 2 | PAINTα0.5 | GP1 | MCB9 | MORT3 | CERα0.3 | WIND15Fg0.85 |
| 3 | PAINTα0.7 | GP1 | MCB9 | MORT3 | CERα0.3 | WIND15Fg0.85 |
| 4 | PAINTα0.3 | GP3 | MCB9 | MORT3 | CERα0.3 | WIND15Fg0.85 |
| 5 | PAINTα0.3 | MORT2 | MCB9 | MORT3 | CERα0.3 | WIND15Fg0.85 |
| 6 | PAINTα0.3 | MORT4 | MCB9 | MORT3 | CERα0.3 | WIND15Fg0.85 |
| 7 | PAINTα0.3 | MORT6 | MCB9 | MORT3 | CERα0.3 | WIND15Fg0.85 |
| 8 | PAINTα0.3 | GP1 | MCB14 | MORT3 | CERα0.3 | WIND15Fg0.85 |
| 9 | PAINTα0.3 | GP1 | BCO14 | MORT3 | CERα0.3 | WIND15Fg0.85 |
| 10 | PAINTα0.3 | GP1 | CW10 | MORT3 | CERα0.3 | WIND15Fg0.85 |
| 11 | PAINTα0.3 | GP1 | MCB9 | MORT5 | CERα0.3 | WIND15Fg0.85 |
| 12 | PAINTα0.3 | GP1 | MCB9 | MORT7 | CERα0.3 | WIND15Fg0.85 |
| 13 | PAINTα0.3 | GP1 | MCB9 | MORT3 | CERα0.5 | WIND15Fg0.85 |
| 14 | PAINTα0.3 | GP1 | MCB9 | MORT3 | CERα0.7 | WIND15Fg0.85 |
| 15 | PAINTα0.3 | GP1 | MCB9 | MORT3 | TEXα0.3 | WIND15Fg0.85 |
| 16 | PAINTα0.3 | GP1 | MCB9 | MORT3 | TEXα0.5 | WIND15Fg0.85 |
| 17 | PAINTα0.3 | GP1 | MCB9 | MORT3 | TEXα0.7 | WIND15Fg0.85 |
| 18 | PAINTα0.3 | GP1 | MCB9 | MORT3 | CERα0.3 | WIND19Fg0.66 |
| 19 | PAINTα0.3 | GP1 | MCB9 | MORT3 | CERα0.3 | WIND23Fg0.52 |
| IWS | Coating 1 | Wall | Coating 2 | ||
|---|---|---|---|---|---|
| 1 | PAINTα0.3 | GP1 | MCB9 | GP1 | PAINTα0.3 |
| 2 | PAINTα0.5 | GP1 | MCB9 | GP1 | PAINTα0.5 |
| 3 | PAINTα0.7 | GP1 | MCB9 | GP1 | PAINTα0.7 |
| 4 | PAINTα0.3 | GP3 | MCB9 | GP3 | PAINTα0.3 |
| 5 | PAINTα0.3 | MORT2 | MCB9 | MORT2 | PAINTα0.3 |
| 6 | PAINTα0.3 | MORT4 | MCB9 | MORT4 | PAINTα0.3 |
| 7 | PAINTα0.3 | MORT6 | MCB9 | MORT6 | PAINTα0.3 |
| 8 | PAINTα0.3 | GP1 | MCB14 | GP1 | PAINTα0.3 |
| 9 | PAINTα0.3 | GP1 | BCO14 | GP1 | PAINTα0.3 |
| 10 | PAINTα0.3 | GP1 | CW10 | GP1 | PAINTα0.3 |
| FS | Lining | Structure | Sub-Floor | Coating | ||
|---|---|---|---|---|---|---|
| 1 | PL20 | W/MW | CS7 | W/AB | MORT3 | CERα0.3 |
| 2 | W/PL | W/MW | CS7 | W/AB | MORT3 | CERα0.3 |
| 3 | PL20 | MW5 | CS7 | W/AB | MORT3 | CERα0.3 |
| 4 | PL20 | W/MW | CS10 | W/AB | MORT3 | CERα0.3 |
| 5 | PL20 | W/MW | CS13 | W/AB | MORT3 | CERα0.3 |
| 6 | PL20 | W/MW | CS16 | W/AB | MORT3 | CERα0.3 |
| 7 | PL20 | W/MW | CS7 | AB∆14 | MORT3 | CERα0.3 |
| 8 | PL20 | W/MW | CS7 | AB∆29 | MORT3 | CERα0.3 |
| 9 | PL20 | W/MW | CS7 | W/AB | MORT5 | CERα0.3 |
| 10 | PL20 | W/MW | CS7 | W/AB | MORT7 | CERα0.3 |
| 11 | PL20 | W/MW | CS7 | W/AB | MORT3 | CERα0.5 |
| 12 | PL20 | W/MW | CS7 | W/AB | MORT3 | CERα0.7 |
| RS | Lining | Structure | Sub-Roof | Coating | ||
|---|---|---|---|---|---|---|
| 1 | PL20α0.3 | W/MW | CS7 | W/TB | IMP0.4 + MORT5 | PAINTα0.3 |
| 2 | PL20α0.5 | W/MW | CS7 | W/TB | IMP0.4 + MORT5 | PAINTα0.3 |
| 3 | PL20α0.7 | W/MW | CS7 | W/TB | IMP0.4 + MORT5 | PAINTα0.3 |
| 4 | W/PL | W/MW | CS7 | W/TB | IMP0.4 + MORT5 | PAINTα0.3 |
| 5 | PL20α0.3 | MW5 | CS7 | W/TB | IMP0.4 + MORT5 | PAINTα0.3 |
| 6 | PL20α0.3 | W/MW | CS10 | W/TB | IMP0.4 + MORT5 | PAINTα0.3 |
| 7 | PL20α0.3 | W/MW | CS13 | W/TB | IMP0.4 + MORT5 | PAINTα0.3 |
| 8 | PL20α0.3 | W/MW | CS16 | W/TB | IMP0.4 + MORT5 | PAINTα0.3 |
| 9 | PL20α0.3 | W/MW | CS7 | XPS2 | IMP0.4 + MORT5 | PAINTα0.3 |
| 10 | PL20α0.3 | W/MW | CS7 | EPS4 | IMP0.4 + MORT5 | PAINTα0.3 |
| 11 | PL20α0.3 | W/MW | CS7 | W/TB | FCT | PAINTα0.3 |
| 12 | PL20α0.3 | W/MW | CS7 | W/TB | IMP0.4 + MORT5 | PAINTα0.5 |
| 13 | PL20α0.3 | W/MW | CS7 | W/TB | IMP0.4 + MORT5 | PAINTα0.7 |
| Type of Wall | Block/Brick Width | Coating | Approx. Mass | Rw (dB) |
|---|---|---|---|---|
| Concrete hollow blocks | 9 cm | Mortar with 1.5 cm on each face | 180 kg/m² | 41 |
| 11.5 cm | 210 kg/m² | 42 | ||
| 14 cm | 230 kg/m² | 45 | ||
| Ceramic hollow blocks | 9 cm | Mortar with 1.5 cm on each face | 120 kg/m² | 38 |
| 11.5 cm | 150 kg/m² | 40 | ||
| 14 cm | 180 kg/m² | 42 | ||
| Solid bricks of baked clay | 11 cm | Mortar with 2.0 cm on each face | 260 kg/m² | 45 |
| 15 cm | 320 kg/m² | 47 | ||
| 11 cm + 11 cm * | 450 kg/m² | 52 | ||
| Walls of reinforced concrete | 5 cm | No coating | 120 kg/m² | 38 |
| 10 cm | 240 kg/m² | 45 | ||
| 12 cm | 290 kg/m² | 47 | ||
| Drywall | 2 boards + glass wool | No coating | 22 kg/m² | 41 |
| 4 boards | 44 kg/m² | 45 | ||
| 4 boards + glass wool | 46 kg/m² | 49 |
| Type of Product Used in Floating Floor and Concrete Slab Results without Any Acoustic Treatment | Impact Sound Pressure Index (dB) |
|---|---|
| Concrete slab thickness with 10 cm, without resilient blanket and without sub-floor | 82 |
| Concrete slab thickness with 15 cm, without resilient blanket and without sub-floor | 71 |
| Blanket thickness 10 mm with synthetic rubber and 88% recycled material, without sub-floor | 58 |
| 5 mm thick recycled rubber blanket (800 kg/m³)—no flooring | 58 |
| Rubber blanket recycled thickness 3 mm (600 kg/m³), plus 5 cm sub-floor | 64 |
| Synthetic wool blanket +sub-floor 5 cm | 57 |
| Polypropylene blanket with 10 mm + sub-floor 5 cm | 52 |
| Polypropylene blanket with 5 mm + sub-floor 5 cm | 60 |
| Material | Density (kg/m³) | Modulus of Elasticity (GPa) | Damping |
|---|---|---|---|
| Gypsum | 1100 | 30 | 0.003 |
| Mortar | 1600 | 30 | 0.003 |
| Concrete | 2400 | 40 | 0.006 |
| Ceramic block | 616 | 10 | 0.011 |
| Concrete block | 896 | 40 | 0.001 |
| Ceramic board | 1600 | 4.68 | 4.68 |
| Gypsum board | 900 | 30 | 30 |
| Glass wool | 22 | - | - |
| IWS | Rw | FS | Rw | L’nT,w |
|---|---|---|---|---|
| IWS1 | 36 | FS1 | 59 | 70 |
| IWS4 | 39 | FS2 | 50 | 81 |
| IWS5 | 39 | FS3 | 61 | 67 |
| IWS6 | 43 | FS4 | 61 | 68 |
| IWS7 | 47 | FS5 | 62 | 67 |
| IWS8 | 40 | FS6 | 63 | 64 |
| IWS9 | 44 | FS7 | 59 | 58 |
| IWS10 | 46 | FS8 | 59 | 43 |
| FS9 | 60 | 69 | ||
| FS10 | 61 | 69 |
| Glass | Tsol | Rsol1 | Rsol2 | Tvis | Rvis1 | Rvis2 | Emis1 | Emis2 |
|---|---|---|---|---|---|---|---|---|
| Colorless Float with 4 mm (SF = 0.85) | 0.83 | 0.08 | 0.08 | 0.89 | 0.08 | 0.08 | 0.89 | 0.89 |
| Green Float with 4 mm (SF = 0.66) | 0.58 | 0.06 | 0.06 | 0.81 | 0.07 | 0.07 | 0.89 | 0.89 |
| Grey laminate with 6 mm (SF = 0.52) | 0.38 | 0.05 | 0.05 | 0.43 | 0.05 | 0.05 | 0.89 | 0.89 |
| Surfaces | Reflectance Bands NBR ISO/CIE 8995-1 (2013e) | Reflectance Used in Simulations | ||
|---|---|---|---|---|
| Dark Color | Medium Color | Light Color | ||
| Ceiling | 0.6 to 0.9 | 0.6 | 0.75 | 0.9 |
| Walls | 0.3 to 0.8 | 0.3 | 0.55 | 0.8 |
| Floor | 0.1 to 0.5 | 0.1 | 0.3 | 0.5 |
| Material | Thermal Conductivity (W/m.K) | Density (kg/m³) | Specific Heat (J/kg.K) |
|---|---|---|---|
| Gypsum | 0.5 | 1200 | 840 |
| Mortar | 1.15 | 1600 | 1000 |
| Concrete | 1.75 | 2400 | 1000 |
| Ceramic block | 0.7 | 1300 | 920 |
| Ceramic board | 0.9 | 1600 | 920 |
| Gypsum board | 0.35 | 900 | 840 |
| Glass wool | 0.45 | 22 | 700 |
| XPS | 0.035 | 40 | 1420 |
| EPS | 0.04 | 35 | 1420 |
| Fiber cement tile | 0.95 | 1900 | 840 |
| ID | EWS | DnT,w (ΔD) IWS (dB) | D2m,nT,w (ΔD) (dB) | DnT,w (ΔD) FS (dB) | L’nT,w (dB) |
|---|---|---|---|---|---|
| 1 | EWS1 | 35 | 22 | 49 | 76 |
| 2 | EWS4 | 35 (0) | 22 (0) | 49 (0) | 76 (0) |
| 3 | EWS5 | 35 (0) | 22 (0) | 49 (0) | 76 (0) |
| 4 | EWS6 | 35 (0) | 22 (0) | 49 (0) | 75 (−1) |
| 5 | EWS7 | 35 (0) | 22 (0) | 49 (0) | 75 (−1) |
| 6 | EWS8 | 35 (0) | 22 (0) | 49 (0) | 75 (−1) |
| 7 | EWS9 | 35 (0) | 22 (0) | 50 (+1) | 75 (−1) |
| 8 | EWS10 | 35 (0) | 22 (0) | 50 (+1) | 75 (−1) |
| 9 | EWS11 | 35 (0) | 22 (0) | 49 (0) | 75 (−1) |
| 10 | EWS14 | 35 (0) | 22 (0) | 49 (0) | 75 (−1) |
| 11 | EWS17 | 35 (0) | 22 (0) | 49 (0) | 76 (0) |
| 12 | EWS18 | 35 (0) | 26 (+4) | 49 (0) | 76 (0) |
| 13 | EWS19 | 35 (0) | 30 (+8) | 49 (0) | 76 (0) |
| IWS | |||||
| 14 | IWS4 | 37 (+2) | 22 (0) | 49 (0) | 76 (0) |
| 15 | IWS5 | 37 (+2) | 22 (0) | 49 (0) | 76 (0) |
| 16 | IWS6 | 41 (+6) | 22 (0) | 49 (0) | 76 (0) |
| 17 | IWS7 | 44 (+9) | 22 (0) | 49 (0) | 75 (−1) |
| 18 | IWS8 | 38 (+3) | 22 (0) | 49 (0) | 76 (0) |
| 19 | IWS9 | 42 (+7) | 22 (0) | 49 (0) | 75 (−1) |
| 20 | IWS10 | 43 (+8) | 22 (0) | 49 (0) | 75 (−1) |
| FS | |||||
| 21 | FS2 | 34 (−1) | 22 (0) | 44 (−5) | 85 (+9) |
| 22 | FS3 | 35 (0) | 22 (0) | 49 (0) | 75 (−1) |
| 23 | FS4 | 35 (0) | 23 (+1) | 50 (+1) | 74 (−2) |
| 24 | FS5 | 35 (0) | 23 (+1) | 52 (+3) | 72 (−4) |
| 25 | FS6 | 35 (0) | 23 (+1) | 54 (+5) | 71 (−5) |
| 26 | FS7 | 35 (0) | 22 (0) | 49 (0) | 64 (−12) |
| 27 | FS8 | 35 (0) | 22 (0) | 49 (0) | 49 (−27) |
| 28 | FS9 | 35 (0) | 23 (+1) | 49 (0) | 75 (−1) |
| 29 | FS10 | 35 (0) | 23 (+1) | 50 (+1) | 74 (−2) |
| ID | EWS | IWS | FS | RS | 23/04-09:30 | 23/10-15:30 | ||||
|---|---|---|---|---|---|---|---|---|---|---|
| Internal | External | Window | Illuminance (lux) | Illuminance (lux) | ||||||
| 30 | PAINTα0.3 | CERα0.3 | WINDFg0.85 | PAINTα0.3 | CERα0.3 | PLα0.3 | 738 | Inc. | 10938 | Inc. |
| 31 | PAINTα0.5 | [email protected] | WINDFg0.85 | [email protected] | CERα0.3 | PLα0.3 | 703 | −5% | 10796 | −1% |
| 32 | PAINTα0.7 | [email protected] | WINDFg0.85 | [email protected] | CERα0.3 | PLα0.3 | 629 | −15% | 10465 | −4% |
| 33 | PAINTα0.3 | CERα0.5 | WINDFg0.85 | [email protected] | CERα0.3 | PLα0.3 | 730 | −1% | 10926 | 0% |
| 34 | PAINTα0.3 | CERα0.7 | WINDFg0.85 | [email protected] | CERα0.3 | PLα0.3 | 726 | −2% | 10919 | 0% |
| 35 | PAINTα0.3 | TEXα0.3 | WINDFg0.85 | [email protected] | CERα0.3 | PLα0.3 | 734 | −1% | 10932 | 0% |
| 36 | PAINTα0.3 | TEXα0.5 | WINDFg0.85 | [email protected] | CERα0.3 | PLα0.3 | 734 | −1% | 10932 | 0% |
| 37 | PAINTα0.3 | TEXα0.7 | WINDFg0.85 | [email protected] | CERα0.3 | PLα0.3 | 726 | −2% | 10919 | 0% |
| 38 | PAINTα0.3 | [email protected] | WINDFg0.66 | [email protected] | CERα0.3 | PLα0.3 | 651 | −12% | 9856 | −10% |
| 39 | PAINTα0.3 | [email protected] | WINDFg0.52 | [email protected] | CERα0.3 | PLα0.3 | 348 | −53% | 5249 | −52% |
| 40 | PAINTα0.3 | [email protected] | WINDFg0.85 | PAINTα0.5 | CERα0.3 | PLα0.3 | 621 | −16% | 10482 | −4% |
| 41 | PAINTα0.3 | [email protected] | WINDFg0.85 | PAINTα0.7 | CERα0.3 | PLα0.3 | 395 | −46% | 9484 | −13% |
| 42 | PAINTα0.3 | [email protected] | WINDFg0.85 | [email protected] | CERα0.5 | PLα0.3 | 624 | −15% | 10375 | −5% |
| 43 | PAINTα0.3 | [email protected] | WINDFg0.85 | [email protected] | CERα0.7 | PLα0.3 | 568 | −23% | 10091 | −8% |
| 44 | PAINTα0.3 | [email protected] | WINDFg0.85 | [email protected] | CERα0.3 | PLα0.5 | 557 | −25% | 10087 | −8% |
| 45 | PAINTα0.3 | [email protected] | WINDFg0.85 | [email protected] | CERα0.3 | PLα0.7 | 475 | −36% | 9730 | −11% |
| ID | EWS | T (ΔT) (°C) | ID | RS | T (ΔT) (°C) |
|---|---|---|---|---|---|
| 46 | EWS1 | 33.48 | 46 | RS1 | 33.48 |
| 47 | EWS2 | 33.48 (0) | 65 | RS2 | 33.50 (+0.02) |
| 48 | EWS3 | 33.48 (0) | 66 | RS3 | 33.49 (+0.01) |
| 49 | EWS4 | 33.32 (−0.16) | 67 | RS4 | 34.00 (+0.52) |
| 50 | EWS5 | 33.19 (−0.29) | 68 | RS5 | 33.21 (−0.26) |
| 51 | EWS6 | 32.92 (−0.56) | 69 | RS6 | 33.26 (−0.22) |
| 52 | EWS7 | 32.73 (−0.74) | 70 | RS7 | 33.10 (−0.37) |
| 53 | EWS8 | 33.12 (−0.36) | 71 | RS8 | 32.99 (−0.48) |
| 54 | EWS9 | 33.26 (−0.22) | 72 | RS9 | 32.86 (−0.62) |
| 55 | EWS10 | 32.74 (−0.73) | 73 | RS10 | 32.84 (−0.64) |
| 56 | EWS11 | 33.24 (−0.24) | 74 | RS11 | 33.98 (+0.50) |
| 57 | EWS12 | 33.06 (−0.41) | 75 | RS12 | 34.70 (+1.15) |
| 58 | EWS13 | 34.80 (+1.33) | 76 | RS13 | 35.72 (+2.25) |
| 59 | EWS14 | 36.15 (+2.67) | |||
| 60 | EWS15 | 33.61 (+0.13) | |||
| 61 | EWS16 | 35.00 (+1.52) | |||
| 62 | EWS17 | 36.38 (+2.90) | |||
| 63 | EWS18 | 33.18 (−0.30) | |||
| 64 | EWS19 | 32.96 (−0.52) |
| System | System Variation | D2m,nT,w (EWS) | DnT,w (IWS) | L’nT,w (Floor) | DnT,w (Floor) |
|---|---|---|---|---|---|
| EWS | Internal coating thickness | Low | Low | Low | Low |
| Wall structuring element | Low | Low | Low | Low | |
| External coating thickness | Low | Low | Low | Low | |
| Thickness of external coating layer | Low | Low | Low | Low | |
| Type of external coating | Low | Low | Low | Low | |
| External windows | High | Low | Low | Low | |
| IWS | Coating thickness | Low | High | Low | Low |
| Wall structuring element | Low | High | Low | Low | |
| FS | Use of lining | Low | Low | High | High |
| Use of mineral wool on the lining | Low | Low | Low | Low | |
| Structural element thickness (Slab) | Low | Low | Medium | Medium | |
| Use of acoustic blanket | Low | Low | Low | High | |
| Sub-floor thickness | Low | Low | Low | Low |
| System | System Variation | Level of Influence |
|---|---|---|
| EWS | Color of inner coating | Medium |
| Type and color of external coating | Low | |
| External windows | High | |
| IWS | Color of inner coating | High |
| FS | Color of the floor coating | Medium |
| RS | Ceiling flooring color | High |
| External color of the roofing system | Low |
| System | System Variation | Level of Influence |
|---|---|---|
| EWS | Color of inner coating | Low |
| Thickness of the inner coating | Medium | |
| Wall structuring element | Medium | |
| Thickness of external coating | Medium | |
| Type and color of external coating | High | |
| External windows | Medium | |
| RS | Use of lining | Medium |
| Ceiling flooring color | Low | |
| Use of mineral wool on the lining | Medium | |
| Structural element thickness (Slab) | Medium | |
| Use of thermal blanket | High | |
| Typology of the roofing system | High | |
| External color of the roofing system | High |
© 2020 by the authors. Licensee MDPI, Basel, Switzerland. This article is an open access article distributed under the terms and conditions of the Creative Commons Attribution (CC BY) license (http://creativecommons.org/licenses/by/4.0/).
Share and Cite
Gois, P.F.; Silva, Â.J.C.e.; Delgado, J.M.P.Q.; Azevedo, A.C.; Guimarães, A.S.; Sá, A.V. Influence of the Coating System on the Acoustic, Thermal and Luminous Performance of Brazilian Buildings. Designs 2020, 4, 34. https://0-doi-org.brum.beds.ac.uk/10.3390/designs4030034
Gois PF, Silva ÂJCe, Delgado JMPQ, Azevedo AC, Guimarães AS, Sá AV. Influence of the Coating System on the Acoustic, Thermal and Luminous Performance of Brazilian Buildings. Designs. 2020; 4(3):34. https://0-doi-org.brum.beds.ac.uk/10.3390/designs4030034
Chicago/Turabian StyleGois, Pedro F., Ângelo J. Costa e Silva, João M. P. Q. Delgado, António C. Azevedo, Ana S. Guimarães, and Ana Vaz Sá. 2020. "Influence of the Coating System on the Acoustic, Thermal and Luminous Performance of Brazilian Buildings" Designs 4, no. 3: 34. https://0-doi-org.brum.beds.ac.uk/10.3390/designs4030034