1. Introduction
The ambitious challenge of the European Community to achieve a zero-emission energy system, follows a virtuous path that has the following objectives: to fully involve citizens; to prevent the challenge from translating into a mere rise of costs for the community; to become a development opportunity for European companies and employment growth for member states both to meet the domestic and emerging markets; to ensure that national electrical systems maintain the necessary levels of adequacy, security, and resilience. To fully involve the citizens, it is necessary to make them aware of their consumption and direct them towards choices that have benefits in terms of energy and costs saving. Smart metering might be a solution [
1]. A continuous energy information and feedback might be an effective driver related to the change of the energy behavior.
Smart meters have been deployed around the globe during the past decade [
2]. In this period, the numbers of smart meters installed in the UK, the US, and China reached 2.9 million, 70 million, and 96 million, respectively by the end of 2016 [
3]. As for the other countries, also in Europe, it is worth to underline the case of the Italian DSO e-Distribuzione which represents a relevant practical demonstration of new approaches based on smart metering. New smart metering technologies deployed by e-Distribuzione refer to technologically advanced measurement systems that currently monitor the consumption of 32 million end-users. Information technology and industrial and scientific research promoted recent innovations on smart meter technologies [
4] that have led to a massive replacement plan which is already in place with the most advanced Open Meters [
5]. In this case, it probably represents one of the most significant percentage of installations if compared to the population respect the mentioned countries [
6].
Use of smart meters, communication network, and data management systems compose the advanced metering infrastructure, which plays a central role in demand side management (DSM) and power delivery systems by recording the load profiles and facilitating bi-directional information flow [
7]. The universal popularity of smart meters enables a huge amount of granular electricity consumption data to be collected.
Data with high-resolution from smart meters provide so much information about electricity consumption behaviors and the consumers’ lifestyles. At the same time, power industry deregulation is considering several accelerating factors that shape the system with a new bottom-up approach. In particular, increasingly active end-users, use of energy storage, and innovative technologies are generating a lot of interest in distribution grids that require new actors as aggregators and flexibility providers to guarantee a secure, resilient, and adequate power system [
8]. For these reasons, regulations on the power delivery side in many countries at the global level are moving forward continuously [
9].
More and more participants are involved in making the retail market more interesting, profitable, active and competitive, including the retailers, consumers, and aggregators [
10]. How to employ massive smart meter data to promote and enhance the efficiency and sustainability of the demand side has become an important topic worldwide [
11]. As a premise for smart meters, people have traditionally been unaware of their energy consumption because utility bills provide little information, and it takes too long for the consumption to influence decisions regarding the timing of energy demand. In several places, it is required by law that traditional meter reading takes place on an annual or semi-annual basis. As a result, the bills received by customers most of the time consist of estimates, making it even more difficult to get any useful information from them. The analogy of ‘a supermarket with no price labels’ is often used to describe such lack of information by the demand side. Smart meters do not per se determine any change in energy demand either in absolute energy conservation or in load shifting. However, smart meters generate information (also known as direct feedback) which is otherwise not available to end-users [
12]. When it is combined with end-user actions, smart meters have been shown to activate some level of change in energy demand [
13]. The effectiveness of smart meters in influencing electricity consumption depends heavily on the resolution of the feedback. Feedback can be provided indirectly, through measures such as more detailed, frequent, and accurate billing. Feedback can be also provided directly by means of a web portal or reading on a dedicated display of the meter.
Based on previous considerations, it is clear that the main benefits of smart meters consist of smart meter programs (SMP) that the utility chooses to implement. Indeed, the goal of SMP is to change the behavior of the end-user so that the utility can reduce costs and overhead, improving the quality of service. Regarding the programs there are several possibilities that can be implemented as a result of the smart meters. Smart meters can be used to accomplish a never-ending stream of goals and, regarding this concept, several scenarios exist that can be applied. The implementation of smart meters represents a business value associated with the pathway of smart-grids [
14].
Most of the utility companies control and aggregate information from meters. This allows the utilities to profile load usage based on consumption levels reported by each singular meter [
15]. The goal of these, would be to align consumptions with the base load output from their generating facilities. If total consumption stays consistent with the base load, then no action is needed, and the utility would simply monitor power quality to make sure that nothing unusual occurs.
Smart meters provide much more information when it is compared with a traditional meter, allowing end-users to be well informed about their energy consumption and price and so facilitating the process of end-user engagement. This characteristic makes decisions easier and more intuitive, enabling more efficient consumption.
Novelty, Contribution, and Structure of the Paper
One of the most common problem regarding energy efficiency and connected choices is evaluating a real and precise situation mainly due to a lackness of data for end-users. With the advent of smart metering along with a great development of IT platforms connected to electricity costs monitoring, end-users are able to better decide which actions best fit their expectations. As significant novelty, the paper shows the technology, software functionalities, and a simple example method to size a PV generation plant for a small-scale end-user considering the recent Italian tariff scenario.
The main contribution of the paper is to highlight possible functionalities, implemented and integrated in the smart meter, as the one based on an optimal sizing tool, to accelerate the process of end-user’s engagement, empowerment and awareness. It can provide optimal sizing support for a photovoltaic and storage system and to help the end-user evaluating the use of electricity to meet the energy needs generally required for the direct use of fossil fuels. These functionalities could facilitate the end-user engagement, making electricity consumers more conscious of their energy choices. Regarding the optimal sizing, unlike the other methods used in literature, the proposed method is really simple and it uses a data history with very high resolutions, able to measure the power ramps that occur during the transitory regime that are established when new appliances or any other load is connected.
In the paper structure, firstly, the design of a smart meter is explained, highlighting some core functionalities. Afterward, the proposed method to define an optimal size for a small-scale PV plant for a user who changes its electrical behavior is described. Finally, we present the functionality of the method based on the proposed tool for performing economic analysis to guide the end-user in their energy choices. Different test cases are analyzed for an end-user that need to make a choice between increasing the generation system or its grid electrical consumption due to new electrical loads installation.
2. Smart Meter
A smart meter is an electronic device that allows the measurement of all the quantities necessary to monitor the energy exchange of an end-user with the public network. It allows the end-user (residential or industrial) to monitor generation systems as a photovoltaic plant, storage systems, and loads. It generally records real power usage during a certain time interval of the day and it communicates the information to the electricity supplier for monitoring and billing. Typically, smart meters record energy on an hourly basis (or more frequently) and report at least daily. It enables the measurement and determination of the following data: voltage, current, active power, reactive power, and energy exchanges. Data are collected and generally sent to a central data management system via wireless communication by a secure network. The earliest smart meters provide what is called automated meter readings (AMR) [
16,
17].
The earliest smart meters were based on simple one-way communication, enabling regular automated readings (monthly) involving the customer on one side and the billing-accounting departments on the other. The increasing development first added system services—such as daily hourly reads on demand, notifications of emergency, etc.—used by electricity transport and distribution companies to maintain the grid safety and stability. For interoperability with the infrastructure of a smart grid, smart meters are designed store and communicate data according to certain standards. For this reason, smart meters are powerful devices for measurement that can have digital display, and are capable of recording when and how much power is consumed. Smart meters also come with an in-home display that gives the household a real-time usage information, including kWh use and related costs. The in-home display allows to see how much energy is used among different times of the day, week, month or year, which could help cut the energy usage and bills by highlighting ways it can be more energy efficient.
With the smart meter display, direct impact of habits and lifestyle on the electricity bill can be noted. This is particularly useful to prepayment meter customers, who can better track how their usage impacts their available credit. By making energy usage easier to understand, smarter decisions to save energy and money can be taken, including feeling more confident switching energy supplier.
Smart metering implementation will provide several benefits to the consumers, the utilities and to entire society as a whole [
18].
Benefits for consumers are:
Increased knowledge of energy quality and delivery and a more detailed feedback on the energy use.
More information about their energy usage. This will provide energy efficiency gains for both consumer and industry.
Bills are based on a real consumption.
Customers can adjust their habits to use energy during off-peak hours to lower their electricity bills.
Increased knowledge of consumption effects positively power outages that are reduced.
Switching and moving are easily facilitated.
The bill estimates are reduced.
There is no need to provide physical access to utility workers for taking reading of meters located indoors.
Most of the smart meters on the market collect electricity consumption data at every 15 min per hour while the smart meter used within the analysis can monitor production and consumption data with a sampling interval up to 5 s. In this way, it is possible to evaluate the instantaneous power change in detail due to the connection of an electrical appliance.
The smart meter is designed to be installed at any kind of end-user facility that can be divided into three types: producer, consumer, or prosumer.
It has brought advanced functionalities oriented to smart grid and end-user needs, such as the DSM for unregulated market trading and real time information.
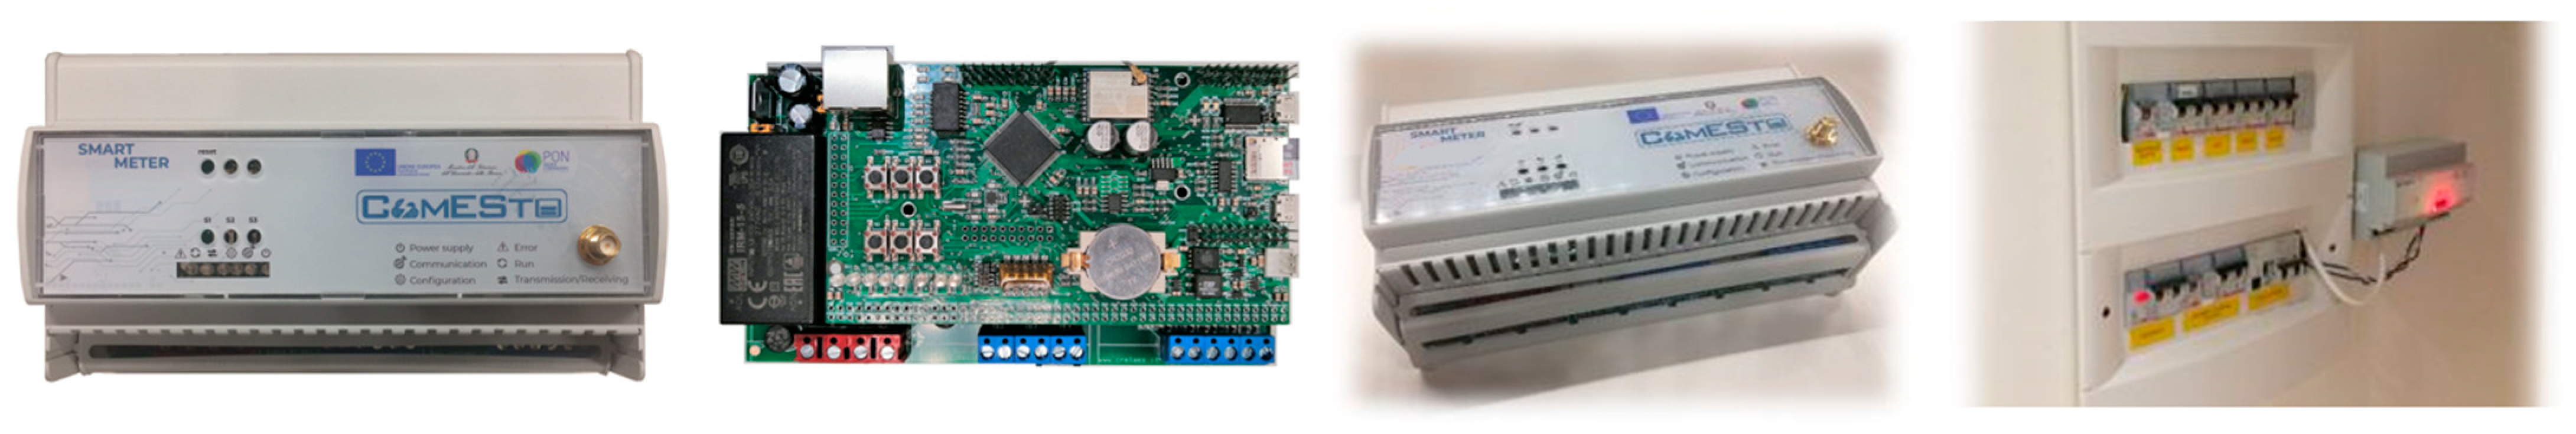
The proposed smart meter as depicted in
Figure 1 is realised to change a normal citizen in an active smart citizen with its energy behavior. Smart citizen changing their lifestyle routines and energy consumption can provide energy services and consumption flexibility, also reducing their energy costs. A smart citizen becomes part of a ‘smart energy community’ and helps to ensure quality of supply and environment preservation.
The smart meter functionalities should be understandable, user friendly, standardized, and provide a broad range of technical functionalities in order to inform end-users about their consumption, helping to increase awareness in energy consumption and furthermore, engage them actively in order to participate in the electricity (and gas, water, heat) supply market [
15].
2.1. Smart Meter Functionalities
Generally, smart meter functionalities can be divided in basic and dedicated.
The ‘basic functionalities’ fulfil the requirements of the passive “smart consumers”. This type of functionalities are services offered to the end-users when introducing the smart meters: online access to the consumption and cost data; bills based on actual consumption.
The ‘dedicated functionalities’ are developed to respond to one or more requests of end-user or to reach common goal for the energy transition. Some examples are:
- -
Alert functionalities regarding unexpected interruptions of energy delivery and exceptional peak power or energy consumption. This functionality may also indirectly contribute to the energy preserving goals by introducing the load operation details to the end-user and enhancing its energy knowledge.
- -
Diagnostic monitoring functionalities such as monitoring of the system status and monitoring of the diagnostics of electrical components (detection of the inconsistent metering results).
Dedicated functionalities for the producers are those where smart customers dealing with production and selling of energy on the market and users are interested in functionalities such as:
- -
Measurement of production and consumption in one spot. This functionality enables internal consumption of the locally produced energy and full refund of incentives for RES production.
- -
Monitoring of the generation systems disruptions of the end-user.
In this paper, another dedicated functionality which has been implemented is the ‘end-user engagement functionality’.
- -
‘End-user engagement functionality’ refers to awareness in use of additional electrical loads both from the consumption and economic point of view. It allows to provide what-if analysis, which stimulate end-users to move toward the electric vector for the benefit of end-users themselves and the environment. Consumption/generation monitoring and forecasting of the electricity bill are simple functionalities which attract due to a direct economic impact on end-users.
They have the goal to ensure increased and lasting awareness of the benefits in energy efficiency—with a stimulating effect on demand—also encourage behavioral changes in the use of the same technologies. They include:
- -
Domestic energy reports: end-users who receive periodic reports, through which they compare their use of energy (electricity, gas, or both) with that of 100 similar homes in the same area of residence tend to reduce their energy consumption to align with that of one’s neighbors [
19];
- -
Evaluations on energy efficiency interventions: convey useful information by bringing out the practical benefits of energy management more rational; tool to evaluate the optimal size of PV and storage system to reach the maximum self-consumption rate at the minimum investment cost.
In the following section, after the illustration of a basic functionalities, the paper illustrates the last one related to the end-user engagement.
2.2. Basic Functionalities Demonstration
By mean of a specific App installed on mobile device or via website it is possible to configure the device and monitor in an easy and intuitive way the exchange of electricity/power with the public network. The web application allows to graphically display the real-time data and status for a monitored end-user.
In
Figure 2, with reference to a prosumer, the real-time status is shown. The web application provides daily values related to energy consumption reported in kWh, maximum power absorbed, and minimum power absorbed reported in W (updated in real-time). The web application provides also the daily values related to production power profile.
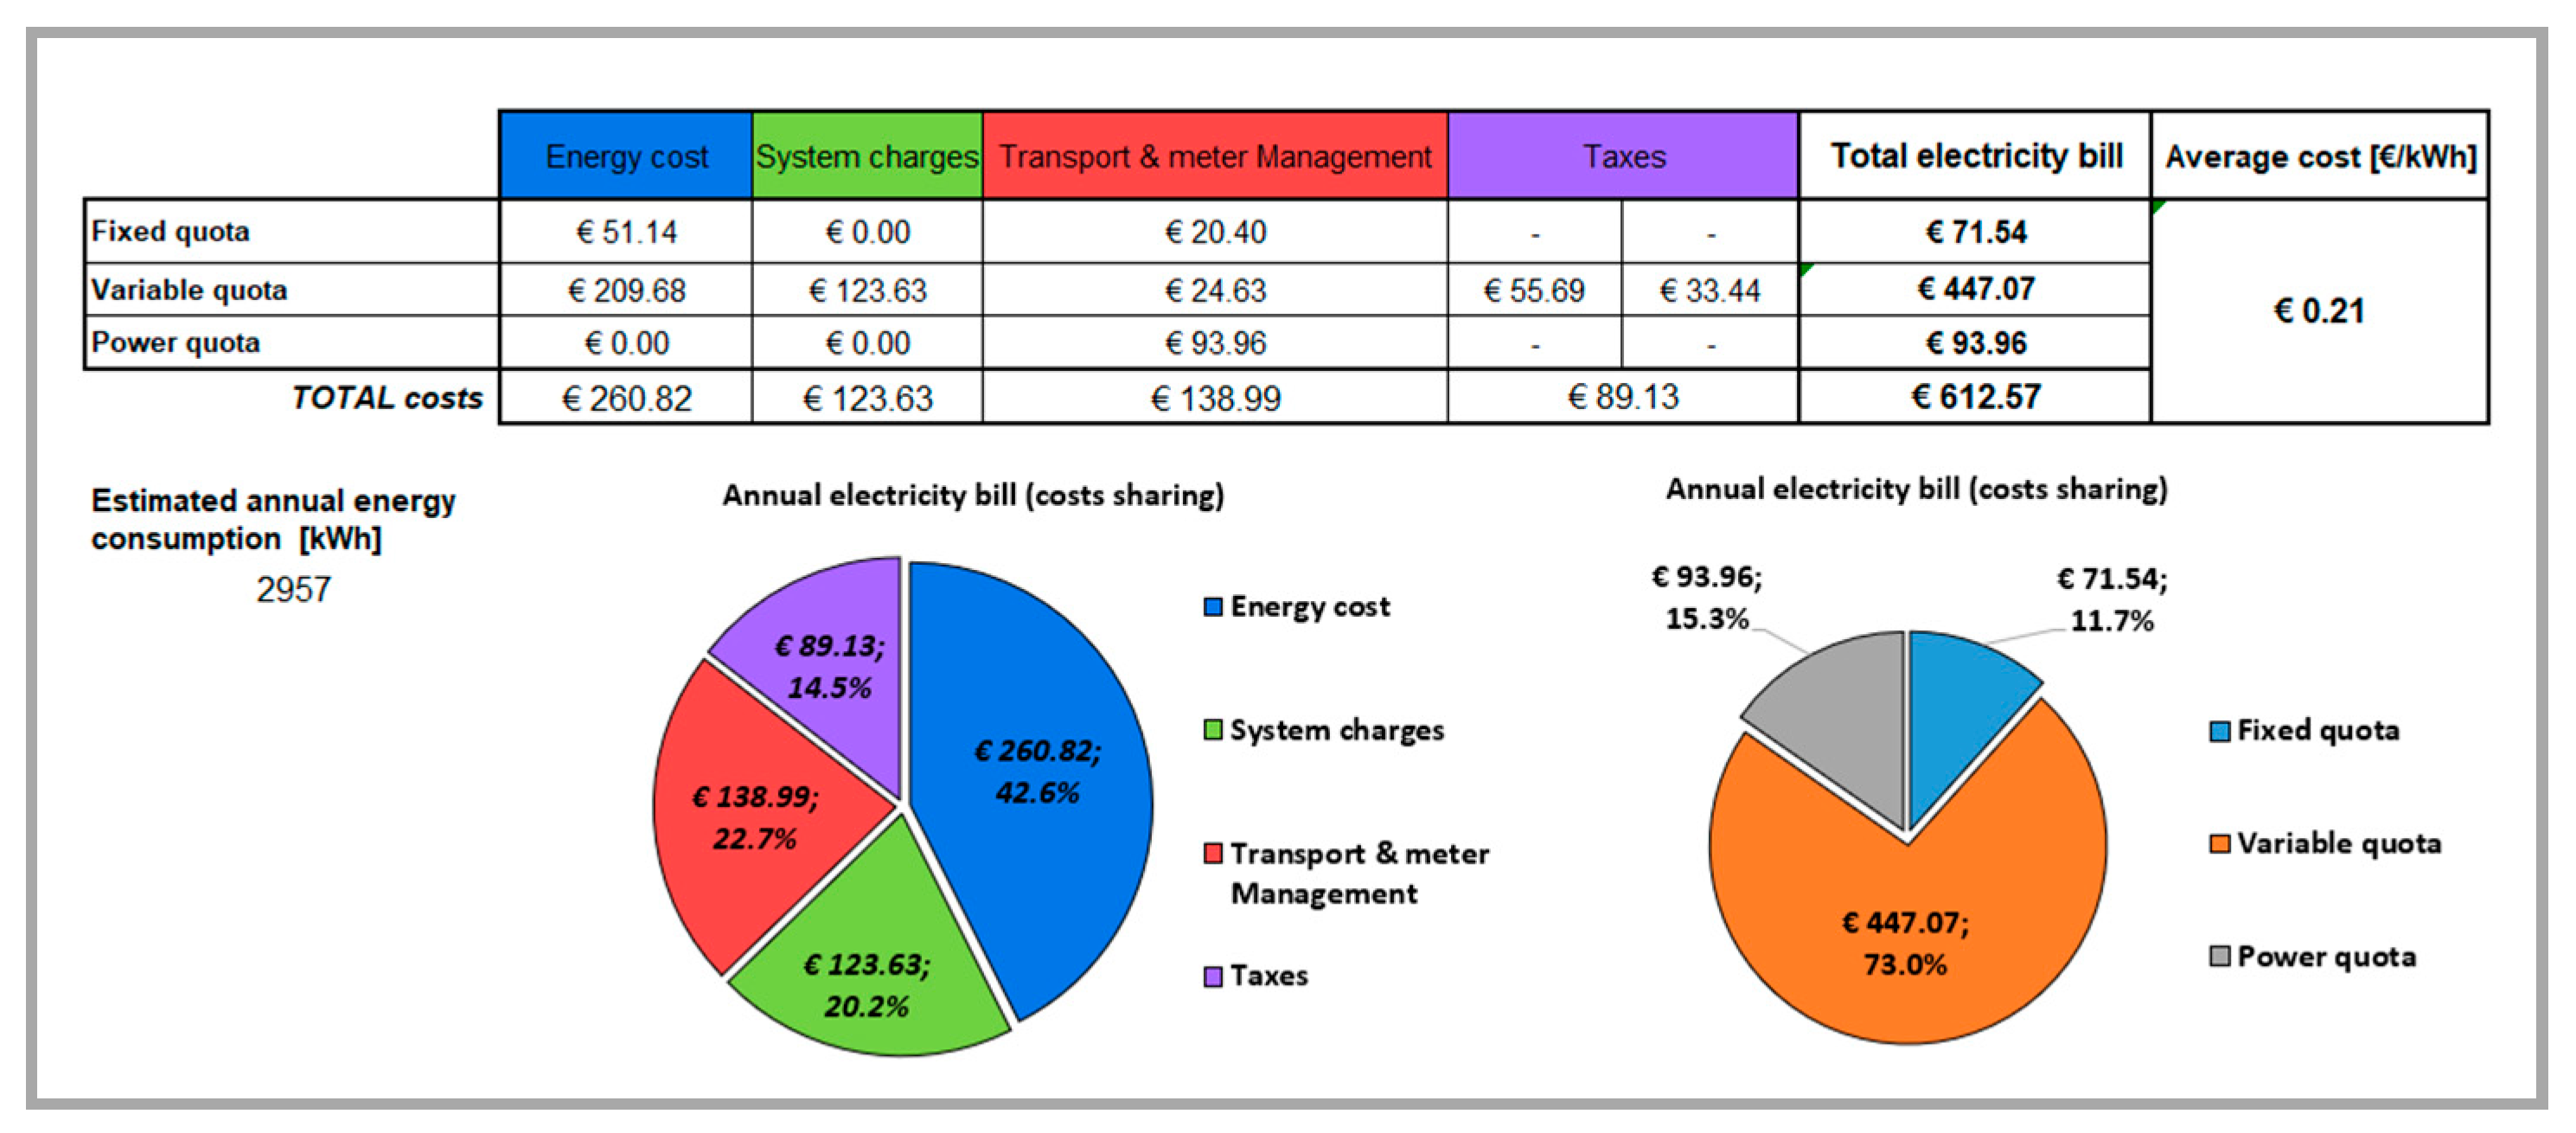
As reported in
Figure 3, based on the energy consumption or historical data, it is possible to evaluate an estimate of the total annual electricity bill for the monitored prosumer.
3. End-User Engagement Functionality: Optimal Sizing of PV and Storage System Method
In the following the proposed functionality based on optimal sizing method for PV and storage systems, is presented. This method is simple and based on the construction of load and production duration curves, based on historical data collected through the installation of the mentioned smart meter that guarantee simple data retrieval and processing.
3.1. Load Duration Curve
Generally, a duration curve represents the trend of a particular type of energy needs (thermal/electric power, gas flow, etc.) over the time. During the year, it shows in abscissa the annual duration for which the load is kept higher or equal to the indicated value in the ordinates; note that the load values must be reported in descending order. In particular, the area under the duration profile—i.e., its integral—expresses (in case of power) the annual energy absorbed by the load or the annual volume of fluid (in case of flow).
The starting point to build the load duration curve is the daily load diagram for each day of the year, so it is necessary to mediate the obtained values to have an average annual trend representative of the end-user under analysis. The instantaneous load values were collected through the installation of smart meter, appropriately programmed in order to have a detailed profile for the load.
The measurement performed by the smart meter takes place with a frequency of 5 s. This makes possible to identify the loading ramps in transient states giving the possibility to identify the real power peaks required by the end-user.
During the case study, a passive domestic end-user (consumer) was monitored. It consists in an independent dwelling located in southern Italy, with an area of 100 m2 used by two people. The end-user is connected to the distribution network and has a contractual power of 4.5 kW.
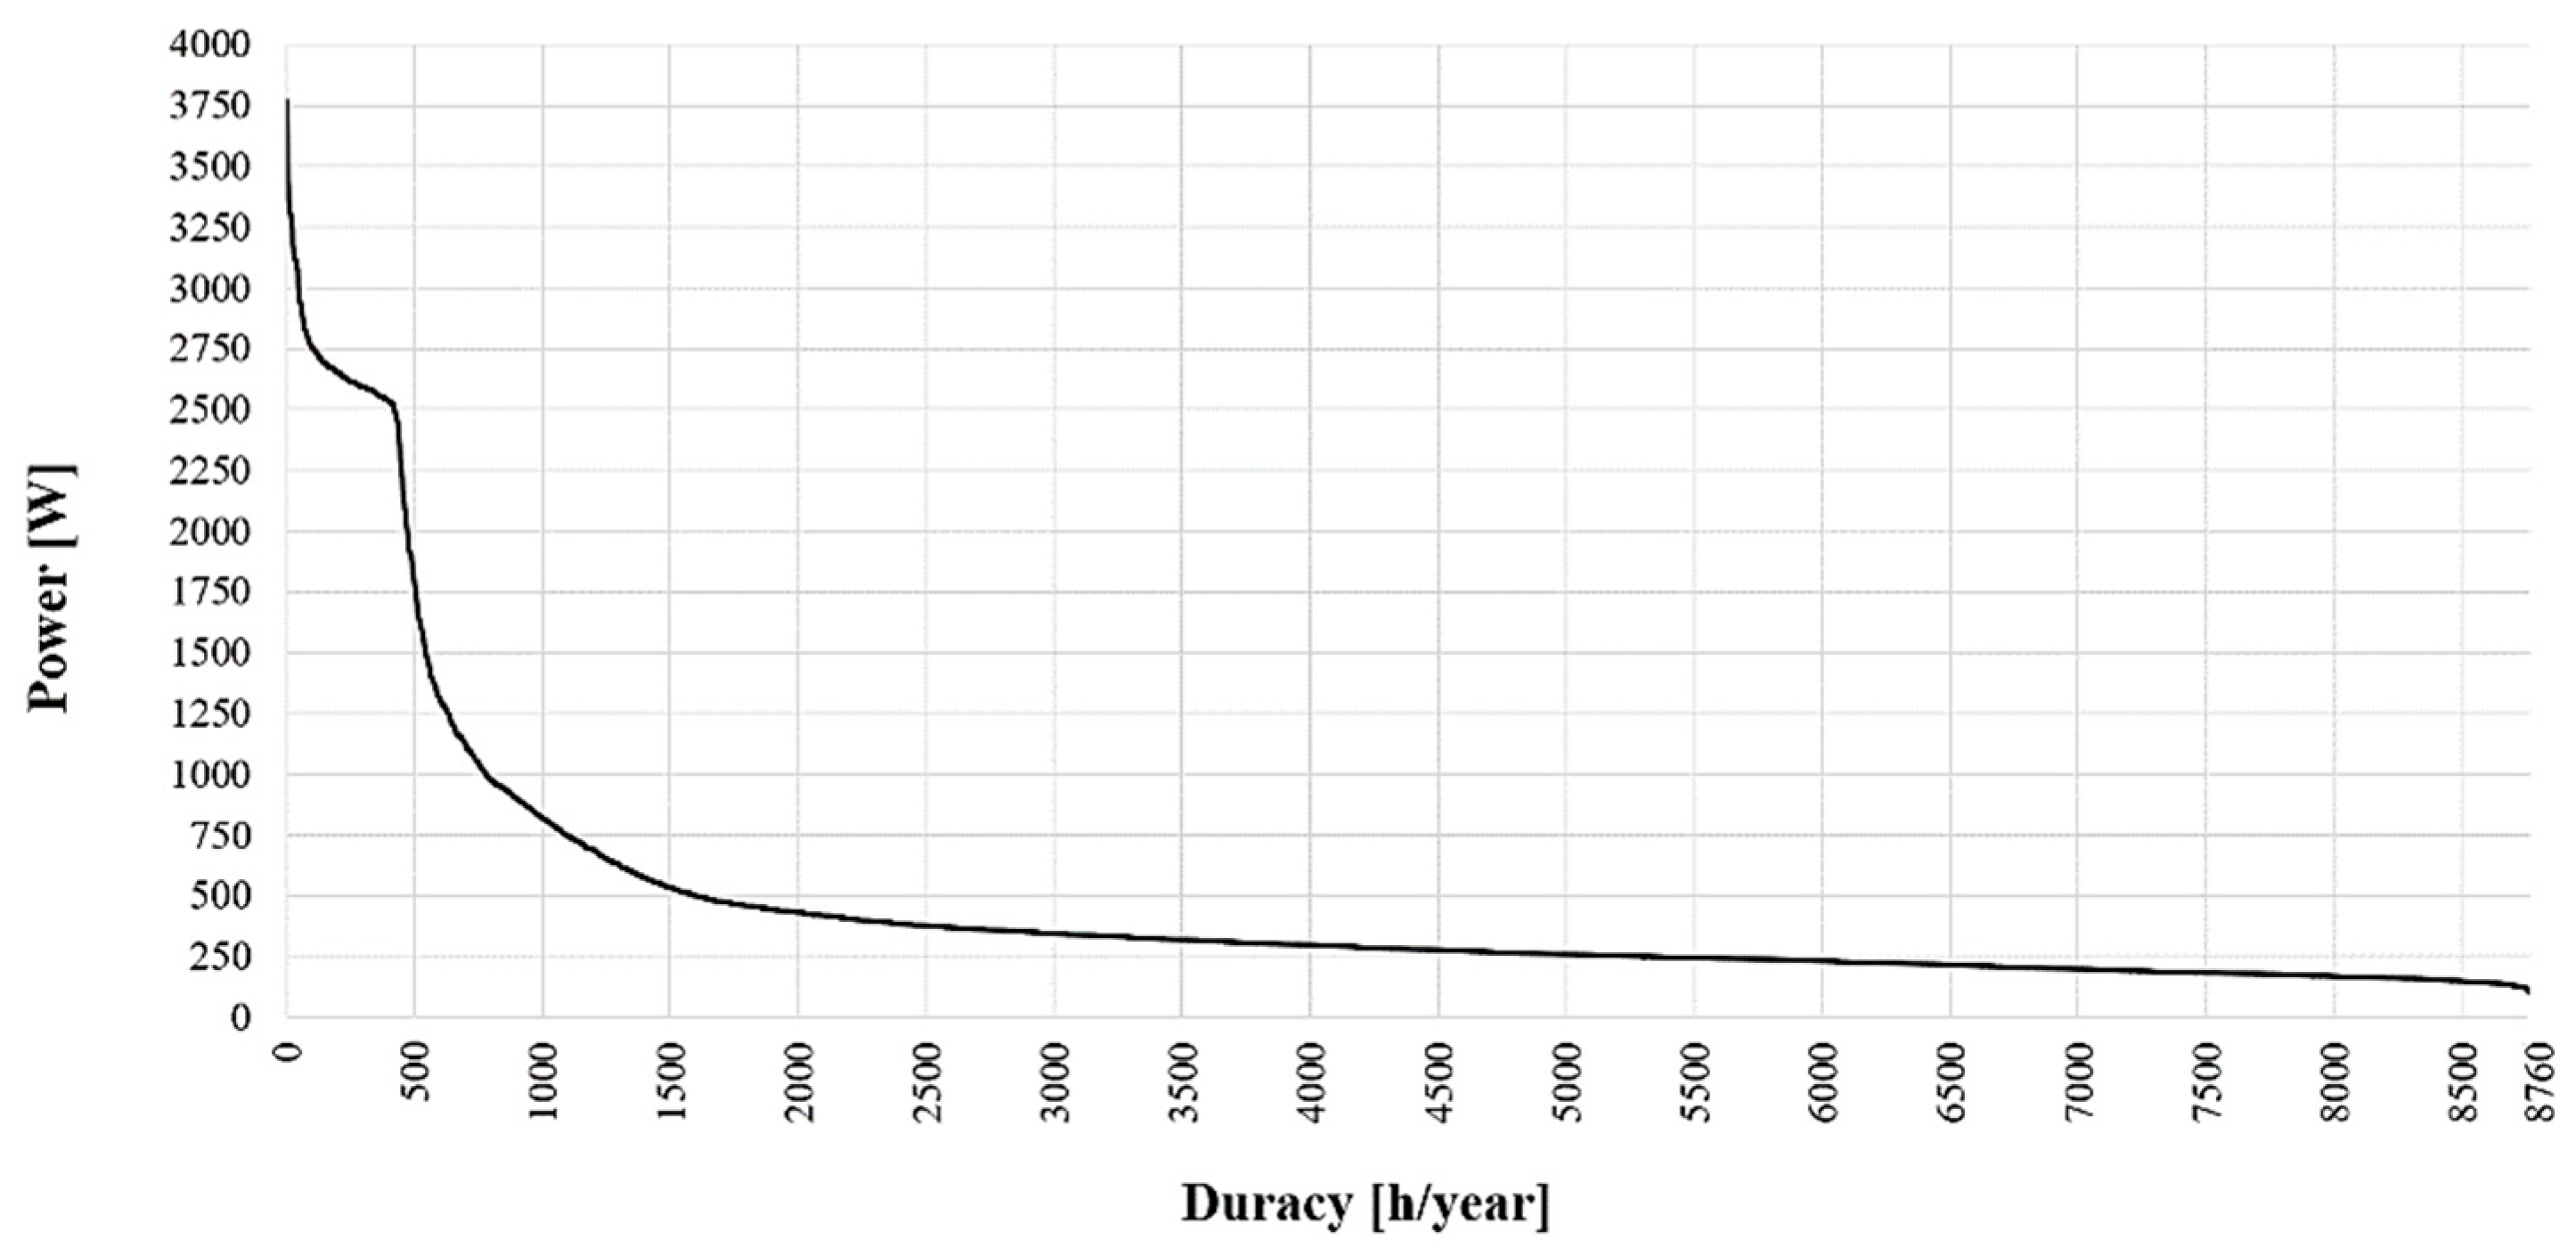
The appliances used by the end-user are: refrigerator, freezer compartment, iron, washing machine, dishwasher, electric coffee machine, plasma TV, lights, and an electric vehicle. Cooling systems are provided using electricity. The load duration curve that expresses the load request by the user is reported in
Figure 4.
Each value in abscissa represents the number of hours during the year in which the requested power was equal to or higher than the corresponding value reported in ordinate. The underlying area expresses the electrical energy absorbed per year (Wh/year).
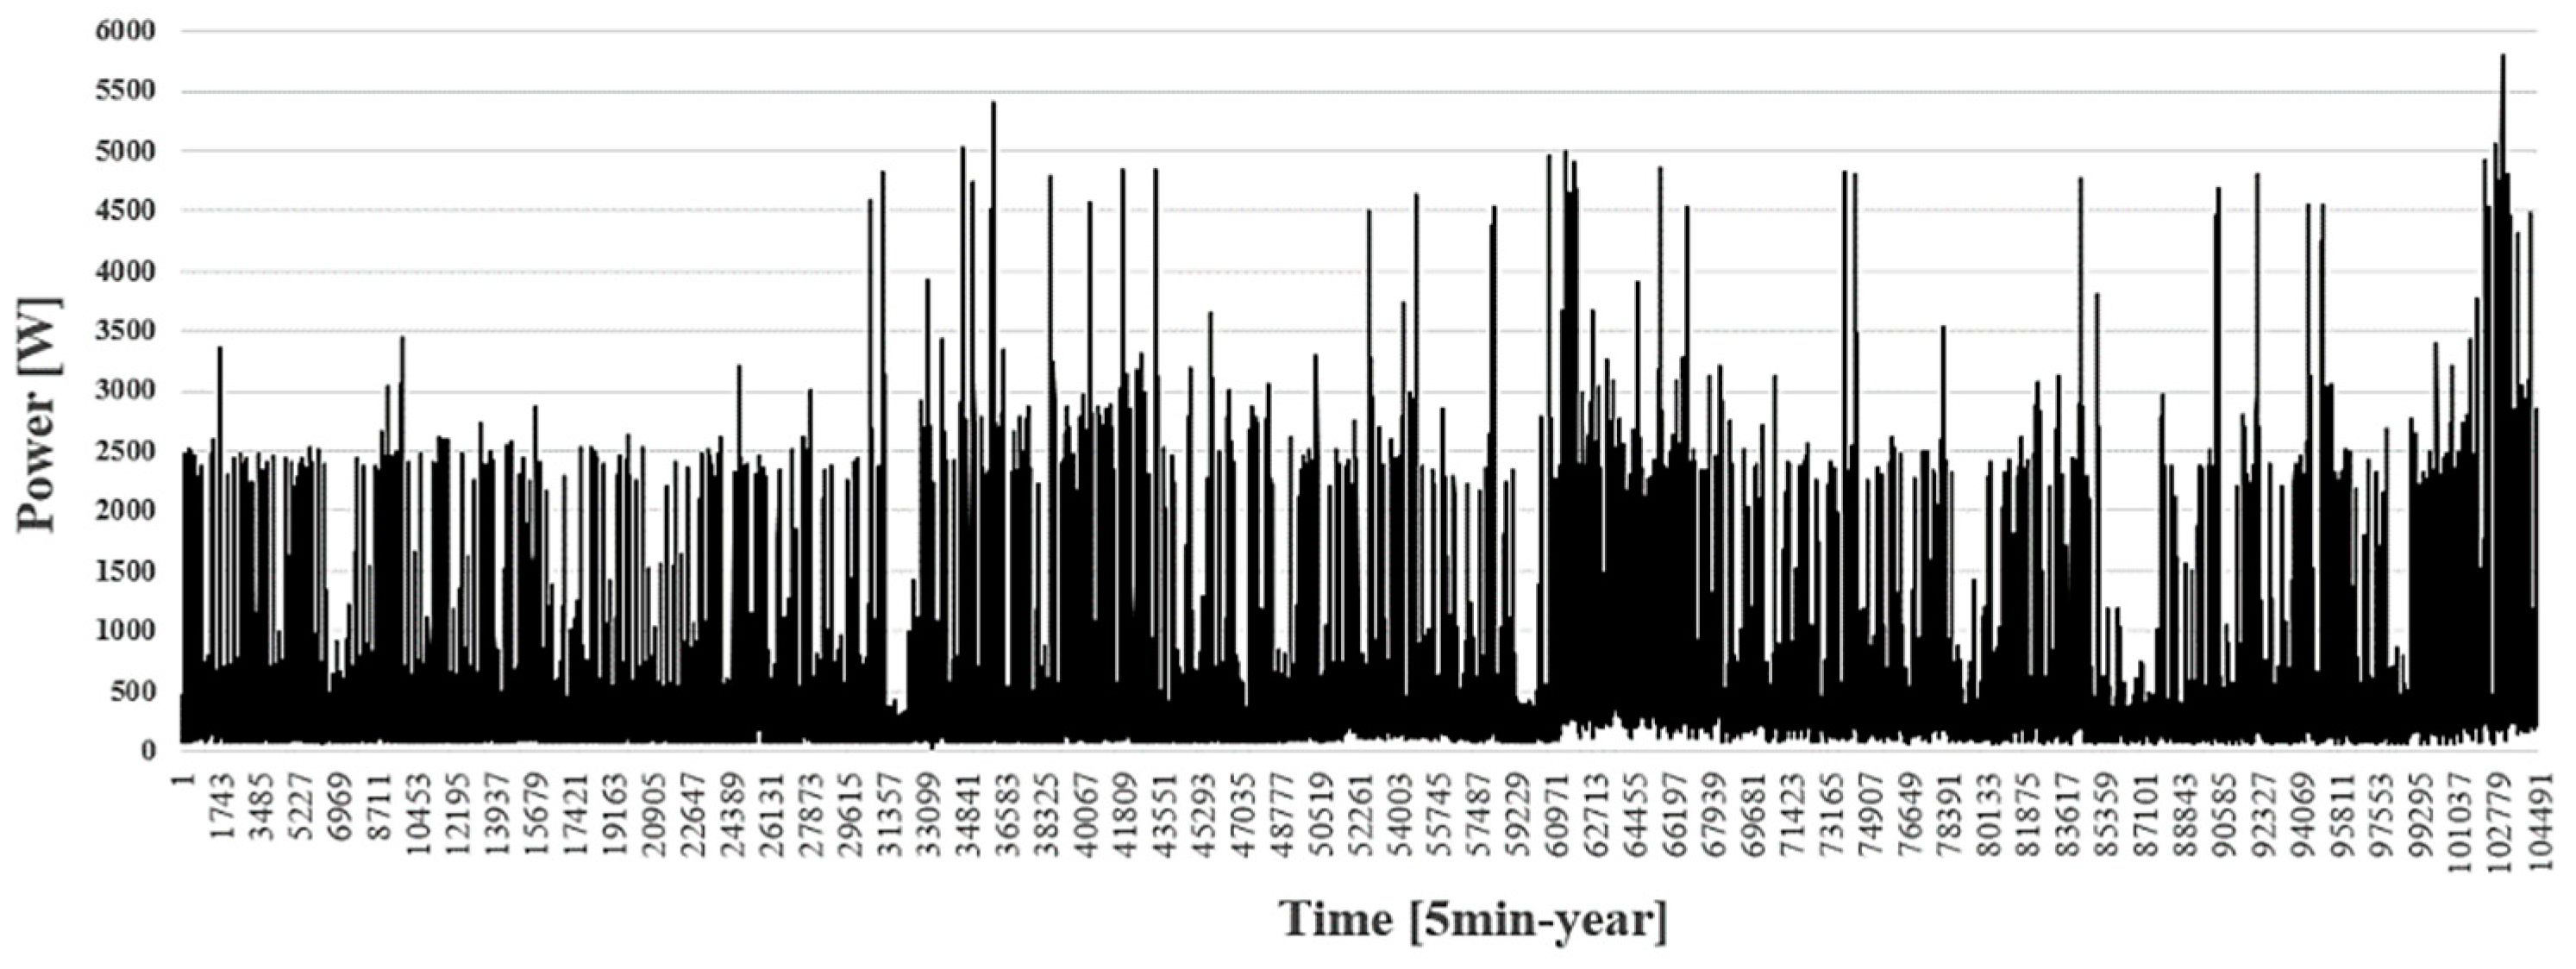
Looking at the previous figures, it can be assumed that there is a base consumption that is kept between 0–500 W for 7156 h of the year, there is a load between 500–2500 W for 1182 h per year, a load between 2500–3500 W for 418 per year and only 4 h per year have a higher demand. The previous considerations are confirmed by the
Figure 5, in which the hourly power profile for the whole 2019 is shown.
For instance, the daily power profile with a time interval of 5 min for the whole 2019 is shown in
Figure 6.
As it is possible to see in
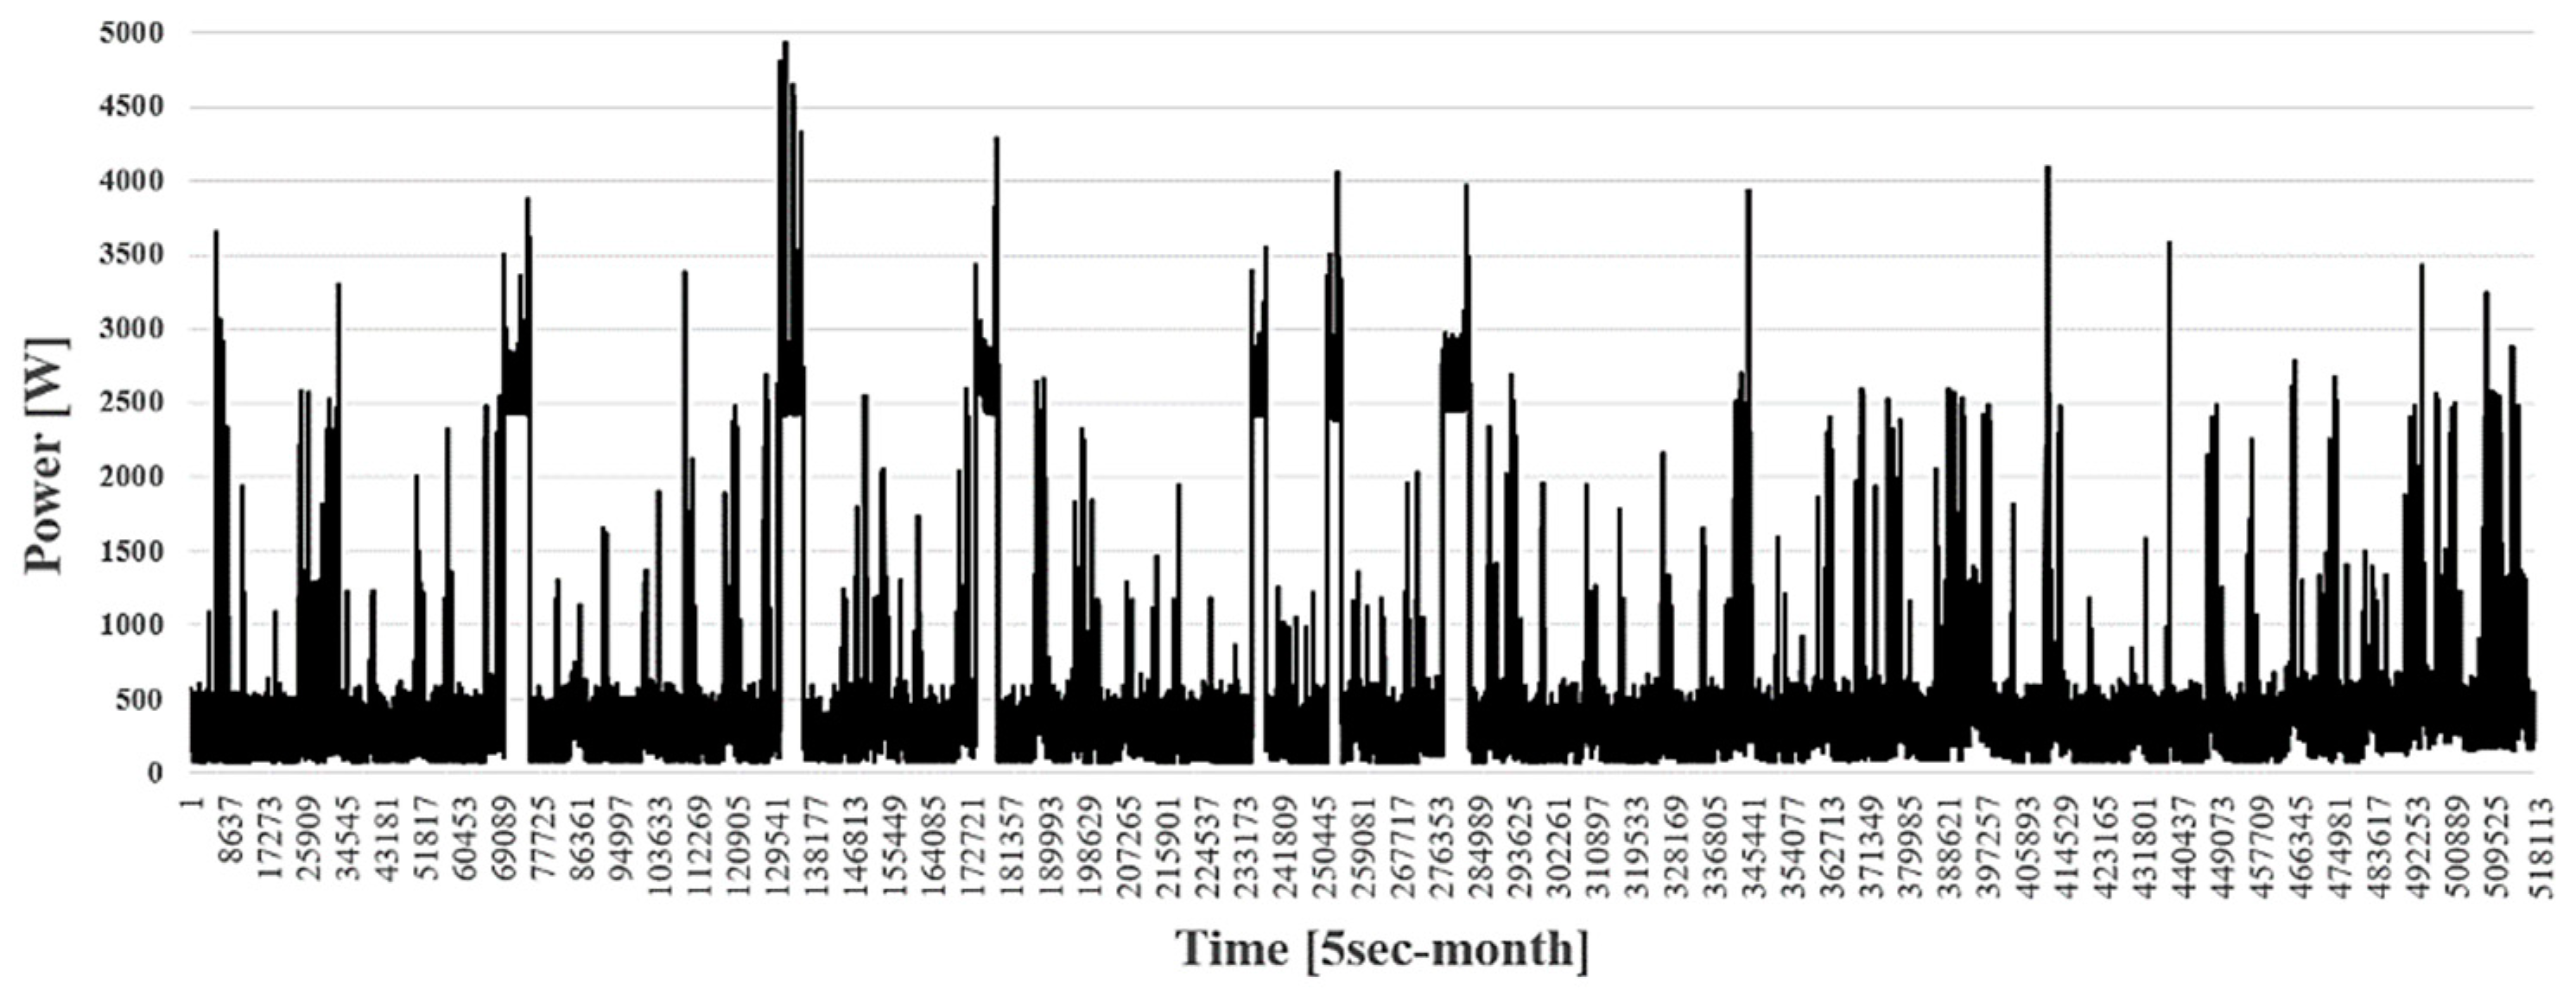
Figure 6, there are situations for short time periods in which requested load excess the contractual power. In
Figure 7, a more detailed daily power profile with a time interval of 5 s is shown for the whole month of June, thus such a representation enables us to highlight the frequent power peaks during the load requests.
3.2. Generation Duration Curve
To create the generation duration curve of the PV plant, daily production data are necessary. The average annual trend representative of the PV plant generation is obtained mediating within the hour the collected values.
For this purpose, the instant power values of a 2.2 kWp PV plant located in southern Italy (near to the city of Cosenza) were collected. In this case, the smart meter was programmed to perform measurements with a 5 second frequency. The duration curve of the generation system, normalized to 1 kW, is reported in
Figure 8.
Each value in abscissa represents the number of hours of the year in which the generated power was equal to or higher than the corresponding value reported in ordinate. The area under the generation profile expresses the electrical energy produced per year (expressed in Wh/year). Looking at the
Figure 8, it can be evaluated as the production remains lower than 100 W/kWp for 5558 h of the year (more than half of the time). Values of production between 100–800 W for 3099 h per year and only for 73 h per year there is a higher generation.
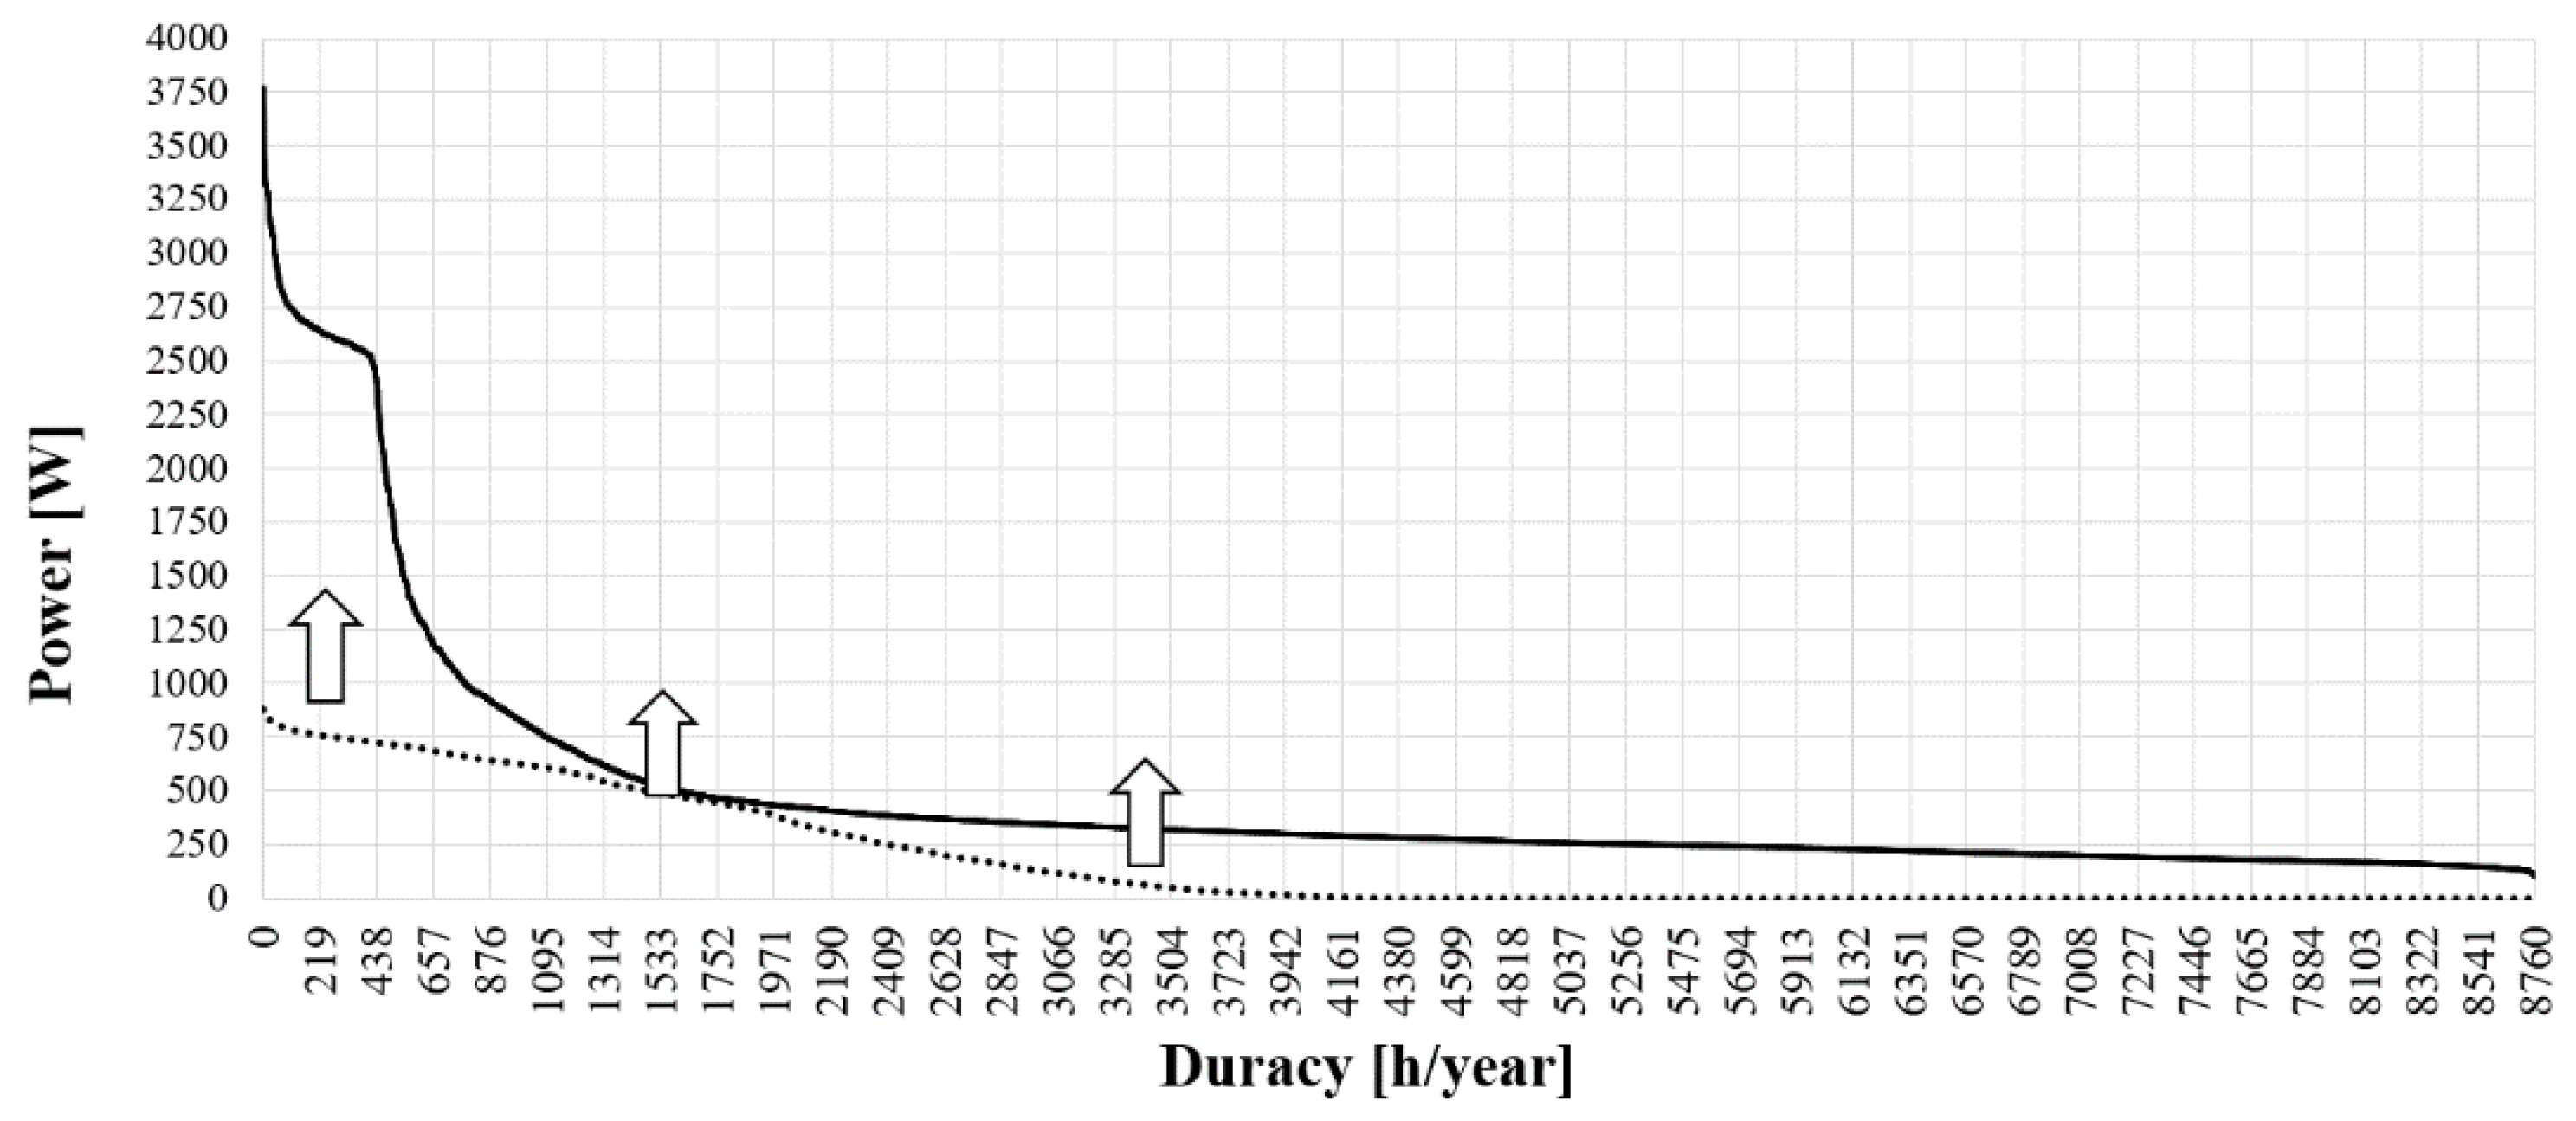
Considering the represented load duration curve in
Figure 4, it is possible to see how it is necessary to increase the nominal power of the PV plant to obtain an optimal size able to increase the matching between load demand profile and generation profile as shown in
Figure 9.
3.3. Proposed Method
The aim of the optimal sizing method is to determine the size of the photovoltaic system able to generate an annual quantity of energy which is equal to the annual energy demand required by the load. In other words, it is necessary to determine the PV size for which, the area under the corresponding generation duration curve (over the load duration curve) equals the areas under the load duration curve (over the generation duration curve), see
Figure 10.
Starting from data collected by the smart meter, it is possible to evaluate the annual energy demand for the monitored end-user. The estimated values are equal to
which correspond to the following monthly and daily average values of
Starting from the generation duration curve showed in
Figure 8, the functionality based on this method allows to define step by step the optimal size for the PV plant which determines annual energy production equal to the annual energy consumption. In particular, it is based on a graphical procedure in which the subtended area of the generation duration curve and the subtended area of the load duration curve are compared. The method as showed in
Figure 10 returns an optimal generation plant size PV* = 2.76.
Indeed, the area under the generation duration curve corresponds with the area under the load duration curve. This confirms that the PV plant production satisfies the annual energy demand required by the user.
Starting from the historical production data related to the PV plant discussed in the previous paragraph, the generation duration curve of the optimal PV plant (2.76 KWp) was computed. In
Figure 10, areas indicated by A1, A2, and A3, are equal to
In detail, the areas A1 and A3 represent the energy amount required by the loads but not produced by the PV plant (i.e., in deficit respect to the load demand) while the bounded area in A2 represents the amount of energy produced in surplus respect to the load demand. Obviously, it is noted that
with reference to available sizes on the market, optimal PV plant size will be equal to
The computed annual production, related to the considered PV size is equal to
which correspond to the following monthly and daily average values of
Once the best size of the PV plant is determined, the next step is to size the electrical storage system. Energy storage technology is rapidly evolving, as large-scale penetration of intermittent renewable generation seems increasingly expected. There are many criteria to evaluate storage technology. Some storage technologies may be more suited to large macro-grid scale application. A variety of electrochemical battery technologies is presently feasible for microgrid-scale energy storage applications.
Among several storage technologies [
20], lithium-ion batteries may be the best overall choice for micro-grid applications in temperate climates areas, due to their energy efficiency, high specific power and energy, and a maturing market. For extreme hot or cold climates, nickel-metal hydride batteries may be the best choice, as less capital and operating energy need be spent on a cooling or heating system [
21,
22].
For the mentioned reasons, in the following the functionality is integrated with the sizing method of a lithium-ion battery technology. The optimal sizing for the battery storage system is immediate. In order to guarantee the end-user the best self-sufficiency in an annual perspective, useful capacity must be equal to the amount of energy generated by the PV plant in surplus respect to the load demand, i.e., the amount of energy represented by the area A2.
Consequently, revaluating the A1, A2, A3 values with the PV size of 3 kW, the optimal size for the battery storage system requires an annual useful capacity equal to
which correspond to the following monthly and daily average values of
Assuming a daily use of the storage system and considering a lithium-ion battery technology generally characterized by a maximum depth of discharge (DoD) of about 80 %, the total capacity of the storage system has to be at least equal to
The best size capacity for the battery storage system to be combined with the PV plant of 3 kWp results equal to 6 kWh that corresponds to an available size on the market.
4. End-User Engagement
Smart meter allows to simulate any time how the energy needs may change when some other load as cooking, heating systems, or vehicles are replaced by electrical one and support if and how to modify its PV and/or storage system optimizing costs. In this way, if the end-user wants to buy a new electrical appliance, assuming that an estimate load profile is available, it is possible to evaluate which solution best fits the use of the new appliance considering the following different options:
- (a)
End-user satisfies the higher electrical energy requirements through a greater grid absorption.
- (b)
End-user increases the PV plant size respect to the standard solution.
- (c)
End-user considers the use of an additional energy storage system only.
- (d)
End-user considers an increase of the PV plant size in combination with an energy storage system.
Based on the further investigations it is possible to evaluate the convenience among the four different solutions when a new electrical appliance has to be installed by the end-user.
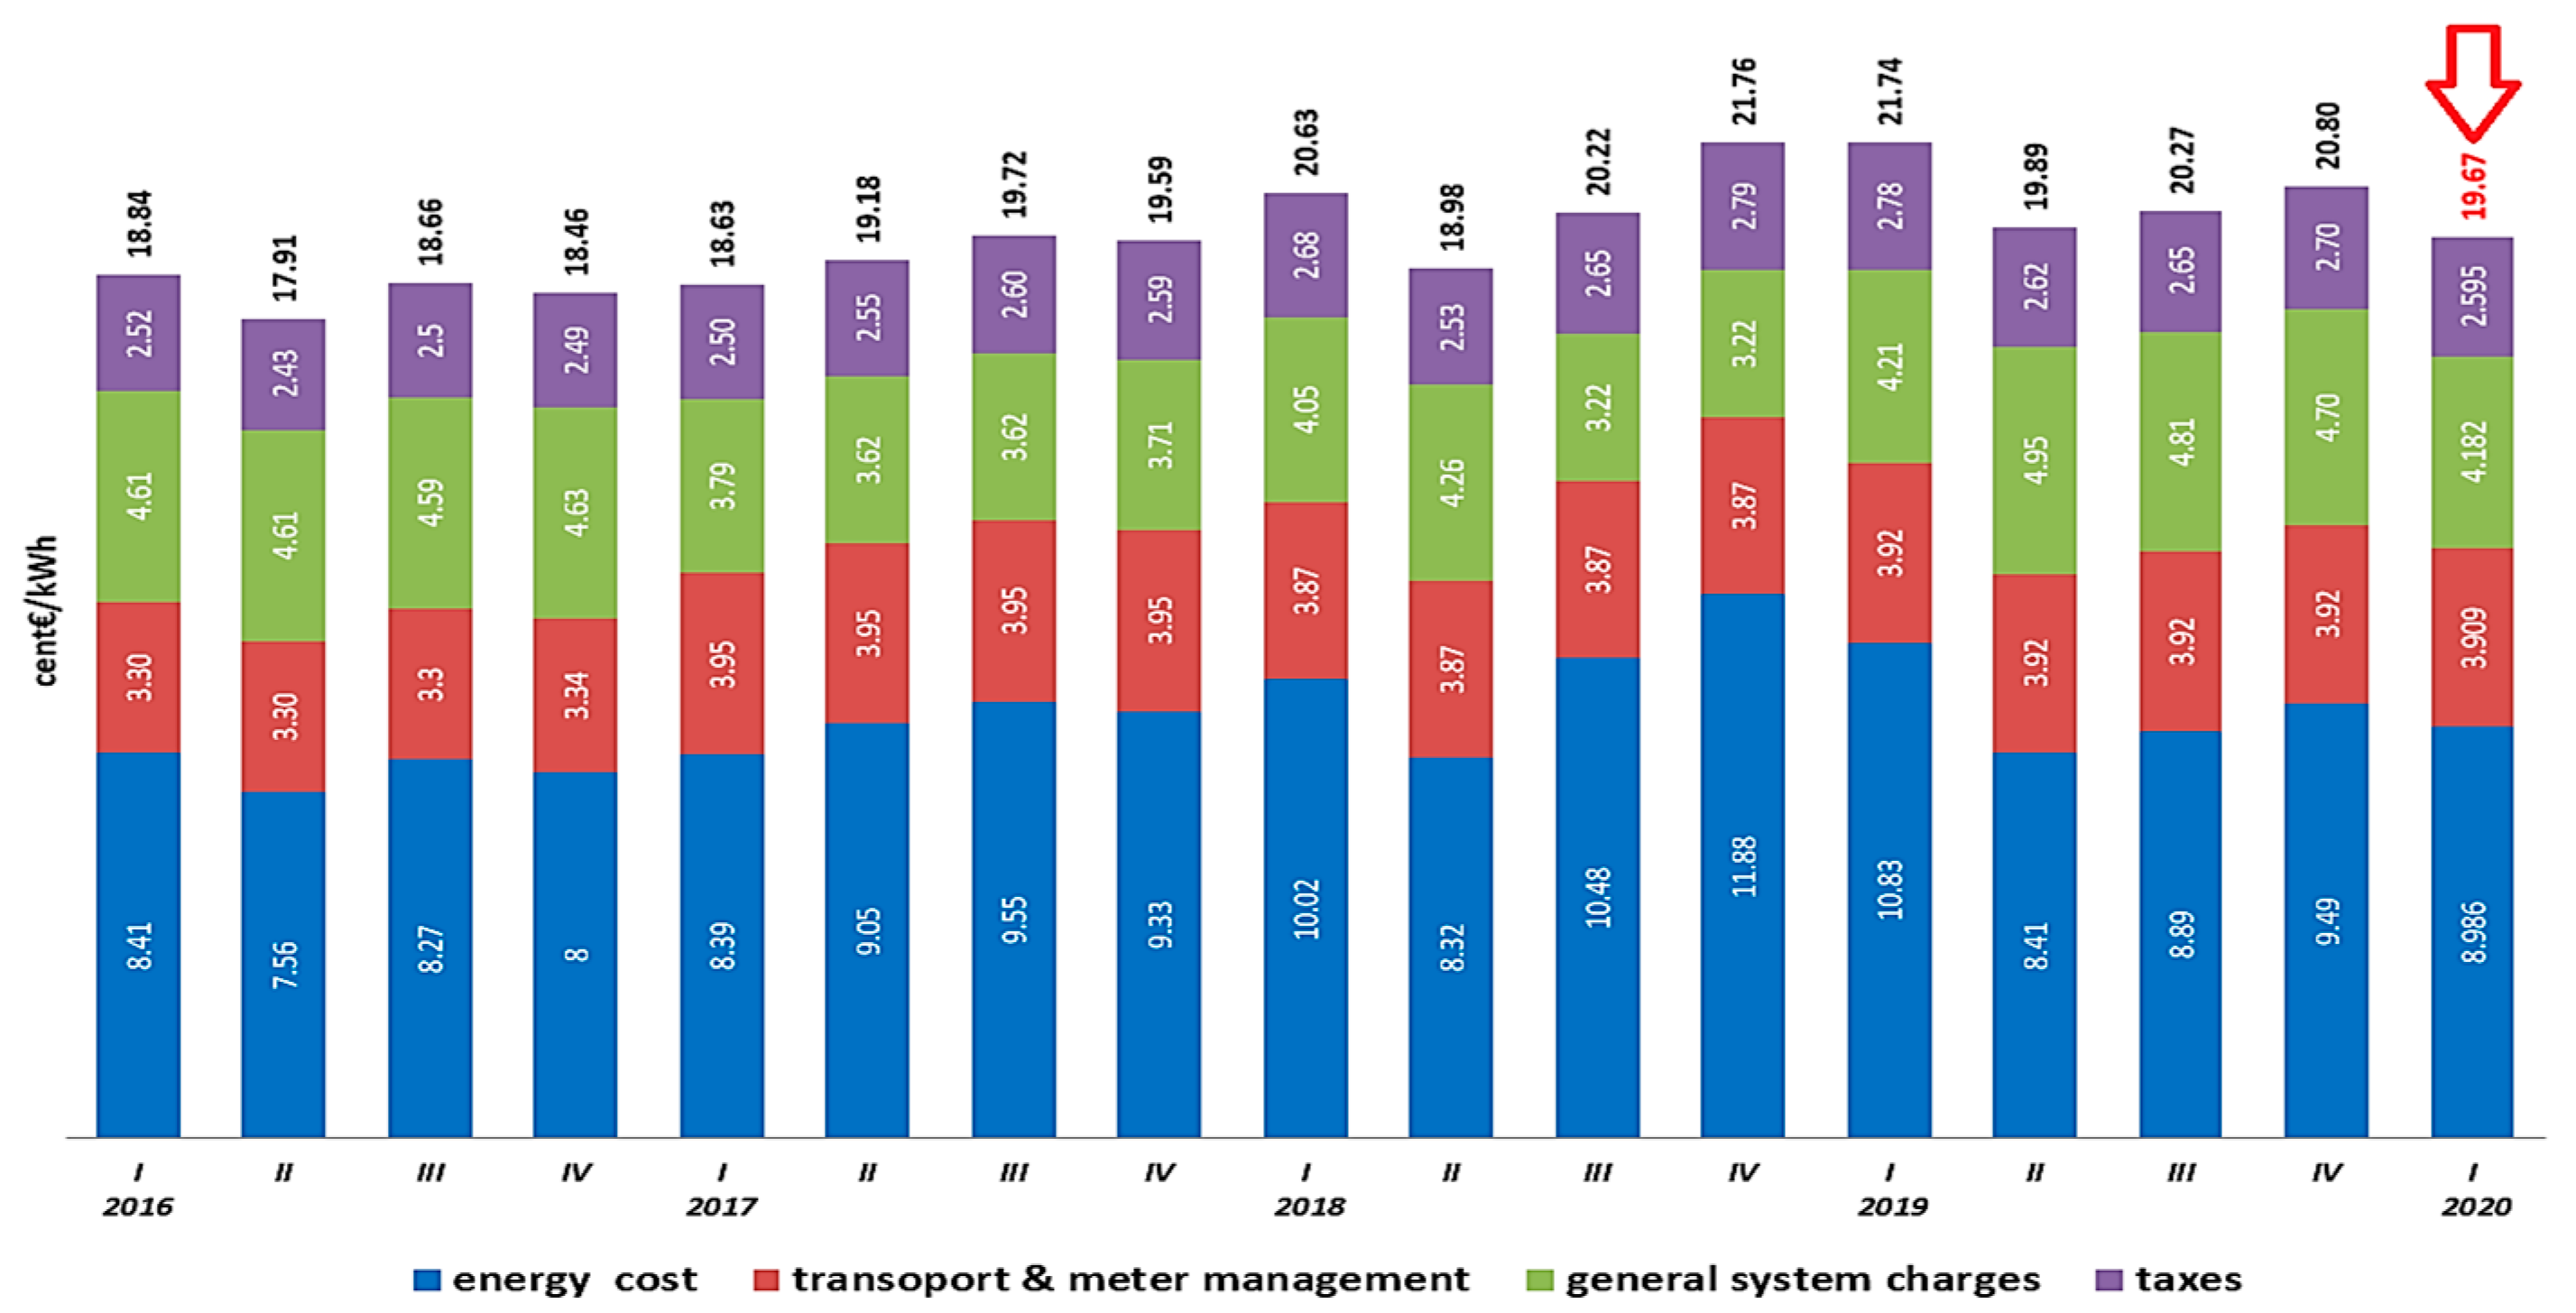
The starting point for the economic analysis, is the end-user electricity bill evaluating the differences only for the variable cost components whenever each of the above-mentioned solutions is applied. The use cases are evaluated considering the Italian tariff scenario of the first quarter 2020 as in
Figure 11.
New appliance might be any possible kind of load but in these simulations, for instance, an induction cooker with a consumption between 130–2200 Wh is considered. It is assumed that new appliance is used three times per day (morning, midday, and evening) and load simulation returns during the year an additional 3000 kWh to the standard consumption.
As shown in
Table 1, the basic situation where the household consume 4183 kWh/year and it has a 3 kW PV plant is considered as reference scenario (baseline). In this situation, the end-user pays a variable cost within the electricity bill (considering latest tariff conditions in
Figure 11) of 447.07 €/year (for completeness fixed cost is 165.50 €/year and total cost is 612.57 €/year). The application of the different solutions returns for each case the following results.
Case (a): in this simulation, it is assumed that higher consumption due to new electrical appliance is satisfied absorbing a greater amount of energy from the main grid. This situation implies a variable cost within the electricity bill of 846.83 €/year. The increase in variable cost respect to the basic situation, corresponds to 399.76 €/year. The 3kW PV plant feeds into the grid an amount of energy of 2546 kWh (56% of generation) that corresponds to a value of 99.3 €/year considering the Italian feed-in tariff scenario (39 €/MWh) [
23].
In this case, it is possible to consider as the net increase in variable costs is equal to 300.46 €/year.
It is important to investigate how much is the cost difference if the end-user decides to satisfy the additional loads of the new electrical appliance increasing the size of the PV plant instead of absorbing higher energy requirements from the main grid.
Case (b): in this simulation is supposed that, higher consumption is satisfied increasing the PV plant size from 3 to 5 kW. This situation implies that variable cost in electricity bill is 782.31 €/year increases respect to the basic situation of 335.25 €/year. The 5 kW PV plant due to a bigger size, feeds into the grid an amount of energy of 5172 kWh (68% of generation) returning feed-in income of 201.72 €/year; therefore, it is as net increase in variable costs is equal to 133.54 €/year (335.25 €/year–201.72 €/year).
Considering the difference between the net increase in variable costs of case (b) and case (a) equal to 166.92 €/year, this amount represents the savings within the electricity bill that the end-user achieves in installing additional 2 kW PV plant respect to the case of a greater energy absorption from the grid. The increase of the PV plant implies an additional cost of about 2000€ (1000 €/kWp). As illustrated in
Table 2, the sustained costs in increasing the PV plant size compared with achievable savings, returns a payback time of 12 years.
Case (c): in this simulation, the end-user installs a 6 kWh storage system in addition to the 3 kW PV plant. Respect to best situation shown in
Table 2 represented by the case (b) which is the reference scenario, adding the storage system in combination with the 3 kW PV plant end-user achieves a variable cost within the electricity bill of 580.36 €/year with a decrease in variable cost of 201.95 €/year.
Use of the storage system allows to reduce the energy injection into the grid to 985 kWh/year with a feed-in income of 38.5 €/year.
As shown in
Table 3 total savings in case (c) are 240.4 €/year. If it is considered, the missing increase of the PV plant, respect to the reference scenario, it represents an additional saving of −2000 €/year while storage cost is 3600€ (600 €/kWh), the total cost with reference to technology might be considered as equal to 1600€.
As shown in
Table 3, the sustained costs in installing storage system compared with the saving in electricity bill returns a payback time of 6.7 years.
Case (d): in the last simulation results, reported in
Table 4, it is supposed that end-user installs the 6 kWh storage system in combination with the increase of the PV plant as well, that rises from 3 to 5 kW.
Regarding the reference scenario shown in
Table 2 represented by case (b), the end-user adopting of a 6 kWh storage in combination with additional 2 kW PV plant is able to achieve a variable cost in the electricity bill of 484.36 €/year with a decrease in variable cost of 297.95 €/year.
The combination of additional power to the PV plant and storage system returns an energy injection into the grid equal to 3495 kWh/year (46% of generation) corresponding to an income of 136.3 €/year.
For these reasons, total savings in case (d) are 434.25 €/year. If it is, considering that PV plant is equal to the reference situation (5 kW) there are no extra costs/savings due to the PV system and technology cost is referred only to the increase of storage system. Comparing the sustained technology cost with the total savings within the electricity bill, the current simulation returns a payback time of 8.3 years.
5. Main Achievement: Results and Discussion
The main achievement of the paper is to provide a useful smart meter functionality that support end-user in changing its electrical behavior, for instance assessing optimal size of the PV plant [
24] and storage system, based on the annual trend of its consumption and therefore its own habits collected through the smart meter. Doing that, it gives the opportunity to easily evaluate the choice to switch on a higher use of electricity to feed some appliances that traditionally are powered by fossil sources highlighting the advantages from the point of view of electrical bill. In such a case, the functionality provides suggestions as to whether it is economically convenient to increase the size of the PV only or of the storage alone or both [
25]. In this way, it is the opinion of the authors that the end-user is led in its energy choices and so to possibly accelerate the energy transition.
From numerical results it has emerged as it is possible to evaluate the economic convenience in installing new loads. For instance, adding an ‘induction cooker’ for the considered household, it represents a situation that require an important amount of electricity that depends on the time interval when the load is used.
The simulated scenarios returned the following results:
- -
The increase of PV plant respect to the greater grid absorption is a solution that allows a small savings. The comparison between the achievable savings with the incurred costs determines a too long payback time period (12 years).
- -
Maintaining the size for the PV plant to 3 kWh, adding only the storage system seems to be the best solution because it allows to reduce the energy injection into the grid increasing the self-consumption from 33% to 49%. Put in place a well sized storage system, with a not-oversized PV plant allows a deep increase in self-consumption respect to the situation where the PV plant is also increased. This situation allows recovery of the investment in a shorter time (6.7 years).
- -
Increasing the PV in combination with a storage system, despite is a good solution, does not seems to be the best one. This choice strongly depends on the kind of load it is going to install. The simulation returns a good result which does not return the best solution (8.3 years), but it represents the best solution in terms of system and energy transition.
6. Conclusions
Within the paper, the authors show that a smart meter with opportune functionalities is able to provide—in addition to real time monitoring—support as for the PV plant and storage system sizing, starting from the historical production and consumption data collected. Working in simulation mode the end-user may check as his electricity needs change when some traditional loads supplied by fossil fuel are recovered by electrical ones, and it helps in resizing the PV and or storage system in order to minimize cost, improving the awareness of the end-user. Data collection is fundamental because through their analysis it is possible to determine the behavior of the monitored end-user, in terms of energy requirements and production having awareness about peak load demand and information about specific behaviors in electrical consumption. Moreover, it is fundamental to assess the effectiveness of smart metering as smart tool for changing the end-user energy habits thanks to the interaction of the end-user and the smart meter.
The numerical simulations allowed to verify self-consumption and economic benefits in several use cases. The numerical results highlight as a solution with a well sized storage system in combination with a small PV plant can completely use the generation in favor of a variable cost decrease within the electricity bill.
The optimal sizing method based on the analysis of the smart meter data allows optimal sizing of the PV and storage system useful to increase the end-user self-consumption, thus helping to avoid overload or critical situations for the grid, in favor of a more conscious use of energy resources available.
Author Contributions
Conceptualization, A.P., L.M. and S.M.; methodology, A.P. and L.M.; software: S.M. and L.M.; formal analysis, A.P., N.S. and L.M.; data curation: A.P. and L.M.; validation, A.P., N.S., D.M.; writing—original draft, L.M. and A.P.; writing—review and editing, A.P., L.M. and S.M.; draft preparation, L.M. and S.M.; supervision, D.M., A.P. and N.S.; funding acquisition, D.M., A.P. and N.S. All authors have read and agreed to the published version of the manuscript.
Funding
This work has been funded by the Italian Ministry of Education, University and Research (MIUR), through the National Operational Program for Business and Competitiveness 2014–2020, Project: ComESto (Community Energy Storage): Aggregated Management of Energy Storage Systems in Power Cloud—project code ARS01_01259-CUP: H56C18000150005.
Data Availability Statement
The national market energy data prices used to support the findings of this study were supplied by national market operator (GME) and freely available at (
http://www.mercatoelettrico.org/en/) the section ‘Result & Statistics’. The standard tariff data for domestic consumers was supplied by national authority (AREA) and freely available at (
https://www.arera.it/it/prezzi.htm) the section ‘Prices & Tariffs’. All other data used during the study have been obtained as calculations and performed analysis.
Acknowledgments
Project: ComESto (Community Energy Storage): Aggregated Management of Energy Storage Systems in Power Cloud—project code ARS01_01259-CUP: H56C18000150005.
Conflicts of Interest
The authors declare no conflict of interest.
References
- Al-Waisi, Z.; Agyeman, M.O. On the Challenges and Opportunities of Smart Meters in Smart Homes and Smart Grids. In Proceedings of the 2nd International Symposium on Computer Science and Intelligent Control, Stockholm, Sweden, 21–23 September 2018; p. 16. [Google Scholar]
- Wang, Y.; Chen, Q.; Hong, T.; Kang, C. Review of Smart Meter Data Analytics: Applications, Methodologies, and Challenges. IEEE Trans. Smart Grid 2019, 10, 3125–3148. [Google Scholar] [CrossRef] [Green Version]
- Mohassel, R.R.; Fung, A.; Mohammadi, F.; Raahemifar, K. A survey on Advanced Metering Infrastructure. Int. J. Electr. Power Energy Syst. 2014, 63, 473–484. [Google Scholar] [CrossRef] [Green Version]
- Brusco, G.; Burgio, A.; Menniti, D.; Pinnarelli, A.; Sorrentino, N.; Scarcello, L. An Energy Box in a Cloud-Based Architecture for Autonomous Demand Response of Prosumers and Prosumages. Electronics 2017, 6, 98. [Google Scholar] [CrossRef] [Green Version]
- E-Distribuzione, Open Meter: Contatore elettrico 2.0. Available online: https://www.e-distribuzione.it/open-meter.html (accessed on 14 December 2020).
- E-Distribuzione, Open Meter: Piano di Sostituzione Contatori. Available online: https://www.e-distribuzione.it/open-meter/Piano-di-sostituzione.html (accessed on 14 December 2020).
- Gelazanskas, L.; Gamage, K.A. Demand side management in smart grid: A review and proposals for future direction. Sustain. Cities Soc. 2014, 11, 22–30. [Google Scholar] [CrossRef]
- Carlini, E.M.; Birkebaek, J.M.; Schroeder, R.; Massaro, F. A Power Sector in Transition Understanding Transition Towards a Cleaner Grid and how Distributed Energy Resources Affect the Design and Operation of Electric Power Systems. In Proceedings of the 2018 IEEE International Conference on Environment and Electrical Engineering and 2018 IEEE Industrial and Commercial Power Systems Europe (EEEIC/I&CPS Europe), Palermo, Italy, 12–15 June 2018; pp. 1–6. [Google Scholar]
- Yesudas, R.; Clarke, R. Measures to Improve Public Acceptance of Smart Metering System. In Proceedings of the RE4SuSy@RE 2015, Ottawa, ON, Canada, 24 August 2015; pp. 1–10. [Google Scholar]
- Yang, J.; Zhao, J.; Luo, F.; Wen, F.; Dong, Z.Y. Decision-Making for Electricity Retailers: A Brief Survey. IEEE Trans. Smart Grid 2018, 9, 4140–4153. [Google Scholar] [CrossRef]
- Henneke, D.; Freudenmann, C.; Kammerstetter, M.; Rua, D.; Wisniewski, L.; Jasperneite, J. Communications for AnyPLACE: A smart metering platform with management and control functionalities. In Proceedings of the 2016 IEEE 21st International Conference on Emerging Technologies and Factory Automation (ETFA), Berlin, Germany, 6–9 September 2016; pp. 1–8. [Google Scholar]
- Burgio, A.; Giordano, A.; Manno, A.A.; Mastroianni, C.; Menniti, D.; Pinnarelli, A.; Scarcello, L.; Sorrentino, N.; Stillo, M. An IoT approach for Smart Energy districts. In Proceedings of the 2017 IEEE 14th International Conference on Networking, Sensing and Control (ICNSC), Calabria, Italy, 16–18 May 2017; IEEE: New York, NY, USA, 2017; pp. 146–151. [Google Scholar]
- Pitì, A.; Verticale, G.; Rottondi, C.; Capone, A.; Schiavo, L.L. The Role of Smart Meters in Enabling Real-Time Energy Services for Households: The Italian Case. Energies 2017, 10, 199. [Google Scholar] [CrossRef] [Green Version]
- Opris, I.; Caracasian, L. On the implementation of the functionalities of smart metering systems. In Proceedings of the 2013 8th International Symposium on Advanced Topics in Electrical Engineering (ATEE), Bucharest, Romania, 23–25 May 2013; pp. 1–6. [Google Scholar]
- Barai, G.R.; Krishnan, S.; Venkatesh, B. Smart metering and functionalities of smart meters in smart grid—A review. In Proceedings of the 2015 IEEE Electrical Power and Energy Conference (EPEC), London, ON, Canada, 26–28 October 2015; Institute of Electrical and Electronics Engineers (IEEE): New York, NY, USA, 2015; pp. 138–145. [Google Scholar]
- Palaniappan, S.; Asokan, R.; Bharathwaj, S.; Sujaudeen, N. Automated Meter Reading System—A Study. Int. J. Comput. Appl. 2015, 116, 39–46. [Google Scholar] [CrossRef]
- Zhid Iqbal, H.M.; Wassem, M.; Mahmood, T. Automatic Energy Meter Reading using Smart Energy Meter. In Proceedings of the International Conference on Engineering & Emerging Technologies (ICEET-2014), Islamabad, Pakistan, 1–2 December 2014. [Google Scholar] [CrossRef]
- M., Q.; Ma, Q.; Xu, M.; Li, R.; Li, F. Quantitative benefit assessment of electricity settlement using smart meters. In Proceedings of the 2016 13th International Conference on the European Energy Market (EEM), Porto, Portugal, 6–9 June 2016. [Google Scholar]
- S3C CONSORTIUM. Guideline: Smart Meter Monitoring and Controlling Functionalities. Available online: https://www.smartgrid-engagement-toolkit.eu/exploring/infrastructure-devices/ (accessed on 15 April 2020).
- Brandeis, L.; Sprake, D.; Vagapov, Y.; Tun, H. Analysis of electrical energy storage technologies for future electric grids. Analysis of electrical energy storage technologies for future electric grids. In Proceedings of the 2016 IEEE NW Russia Young Researchers in Electrical and Electronic Engineering Conference (EIConRusNW), St. Petersburg, Russia, 2–3 February 2016; pp. 513–518. [Google Scholar] [CrossRef]
- Energy Hunters. Sistemi di Accumulo di Energia Elettrica—Classificazione, Caratteristiche Vantaggi e Svantaggi—Energy Hunters. Available online: http://www.energyhunters.it/sistemi-di-accumulo-di-energia-elettrica-classificazione-caratteristiche-vantaggi-e-svantaggi/ (accessed on 3 March 2020).
- Sistemi di Accumulo Elettrochimico—Descrizione Tecnica. Available online: www.energystorageexchange.org/ (accessed on 3 March 2020).
- ARERA. Ritiro Dedicato e Prezzi Minimi Garantiti. Available online: https://www.arera.it/it/elettricita/prezziminimi.htm#aggiornamento (accessed on 3 March 2020).
- Boeckl, B.; Kienberger, T. Sizing of PV storage systems for different household types. J. Energy Storage 2019, 24, 100763. [Google Scholar] [CrossRef]
- Sharma, V.; Haque, M.H.; Aziz, S.M. Energy cost minimization for net zero energy homes through optimal sizing of battery storage system. Renew. Energy 2019, 141, 278–286. [Google Scholar] [CrossRef]
| Publisher’s Note: MDPI stays neutral with regard to jurisdictional claims in published maps and institutional affiliations. |
© 2021 by the authors. Licensee MDPI, Basel, Switzerland. This article is an open access article distributed under the terms and conditions of the Creative Commons Attribution (CC BY) license (http://creativecommons.org/licenses/by/4.0/).


