
Power System Modeling for the Study of High Penetration of Distributed Photovoltaic Energy


Electrical and Computer Engineering Department, University of Puerto Rico-Mayagüez, Mayagüez, PR 00680, USA
*
Author to whom correspondence should be addressed.
Designs 2021, 5(4), 62; https://0-doi-org.brum.beds.ac.uk/10.3390/designs5040062
Submission received: 26 August 2021
/
Revised: 24 September 2021
/
Accepted: 29 September 2021
/
Published: 3 October 2021
(This article belongs to the Section Electrical Engineering Design)
Abstract
:Many conventional power systems are evolving due to the growth of renewable energy and distributed energy resources (DERs). Modeling the interplay of transmission and distribution systems is critical to analyze how DERs impact a system’s conventional operation and which electric infrastructure improvements are needed to achieve a balance between centralized generation and DERs. This article describes the process, tools, and resources used to model electric power systems with a centralized infrastructure in an isolated context and limited access to actual utility data. Photovoltaic systems installed on residential rooftops were the main design option. This work broadened the typical power system modeling to include planning and social considerations. This integrative engineering-social method allows for interdisciplinary teams to work in the development of a model as part of broader design goals for a renewable-dominant energy system. The Puerto Rico electric power system was used as a case study to demonstrate the process. The integrative engineering-social perspective in developing the model and the actions to manage data limitations are aspects that could be followed in other locations with aggressive renewable energy goals and where utility data are not readily available.
1. Introduction
Technological advances and environmental concerns are causing dramatic changes in electrical systems worldwide. Electric utilities are planning the way forward to face electric industry challenges. This planning process will impact future investments in new infrastructure, operation, and maintenance. The challenges of energy transitions, e.g., going from a dominant electric power arrangement to another, go beyond engineering to energy policy, and socio-economic planning. In many instances, it is not enough to inform policy makers about technological options, engineers should get involved in agenda setting and policy analysis to ensure a broader impact on society [1]. The key role of this paradigmatic shift and the importance of collaborations among engineers and social scientists are shown on locations that have aggressive renewable energy goals that require a strong social agreement to achieve them [2,3]. For example, renewable energy and in particular distributed energy resources (DER), present both sustainability and resilience benefits to tropical and subtropical regions in the world that are vulnerable to natural disasters such as hurricanes and earthquakes. The conventional, hierarchical power structure could be complemented by local DERs and eventually, centralized power could be refocused to support the use of local resources [4]. This technological transformation of the electric power infrastructure might make sense from the engineering perspective, but it must also fully address social needs to ensure the benefits reach all segments of society. Even the best idea can fail when technology is incompatible with the social context [4]. Thus, there is a need to prove the feasibility of integrating more renewable energy into the grid, especially in low-inertia systems such as those in islanded or remote locations and including both technical and social considerations.
This paper describes the process, tools, and resources used to model power systems in a low-inertia, isolated, or remote context, with limited access to actual system data from utilities. This paper strives to broaden the typical power system modeling to include planning and social considerations. Although utility planning divisions take a similar approach, the social data are usually obtained from a government or entity outside the utility, with little or no interactions between utility personnel and social planners. The method followed on this paper allows for interdisciplinary teams to work in the development of a model as part of broader design goals for a renewable-dominant energy system [3]. Social data were used as input to create a power system model, resulting in a more realistic and useful tool. Puerto Rico’s existing electric power system was used as a simulation case study to illustrate the process. The case study used quasi-steady-state modeling for long-term studies as an initial approach. In addition to the limited utility data, information directly related to electrical components was used to describe the transmission, sub-transmission, and distribution systems and the demand distribution and profile of the archipelago. Furthermore, the limited land availability in small islands is one of the main concerns about the transition from traditional generation to renewable energy [5]. For that reason, the potential electricity production by PV systems installed on residential rooftops was evaluated and calculated for the Puerto Rican case. Finally, the distributed PV (DPV) integration modeling is explained as a key element in future research to study possible scenarios of different levels of PV-based DERs penetration and in support of new, more distributed power grid designs that are renewable-based.
Accessing utility data was a key challenge in this work. The lack of actual data from utilities is a common roadblock for power systems researchers [6]. Researchers used the latest data available at the time of the study (2017–2019) and were able to validate the accuracy of the model in spite of this data limitation. Thus, the integrative engineering-social perspective in developing the model and the actions to manage data limitations are aspects that could be followed by others seeking a more holistic view of power infrastructure analysis. The process followed in this work could also guide future research requiring modeling existing power systems under similar conditions and analyzing DER impacts (especially PV systems) on grid operation. The model will be used in the future by engineers and social scientists in crafting and analyzing plausible scenarios of renewable energy integration in a low-inertia power system.
1.1. Hybrid Transmission-Distribution System Modeling
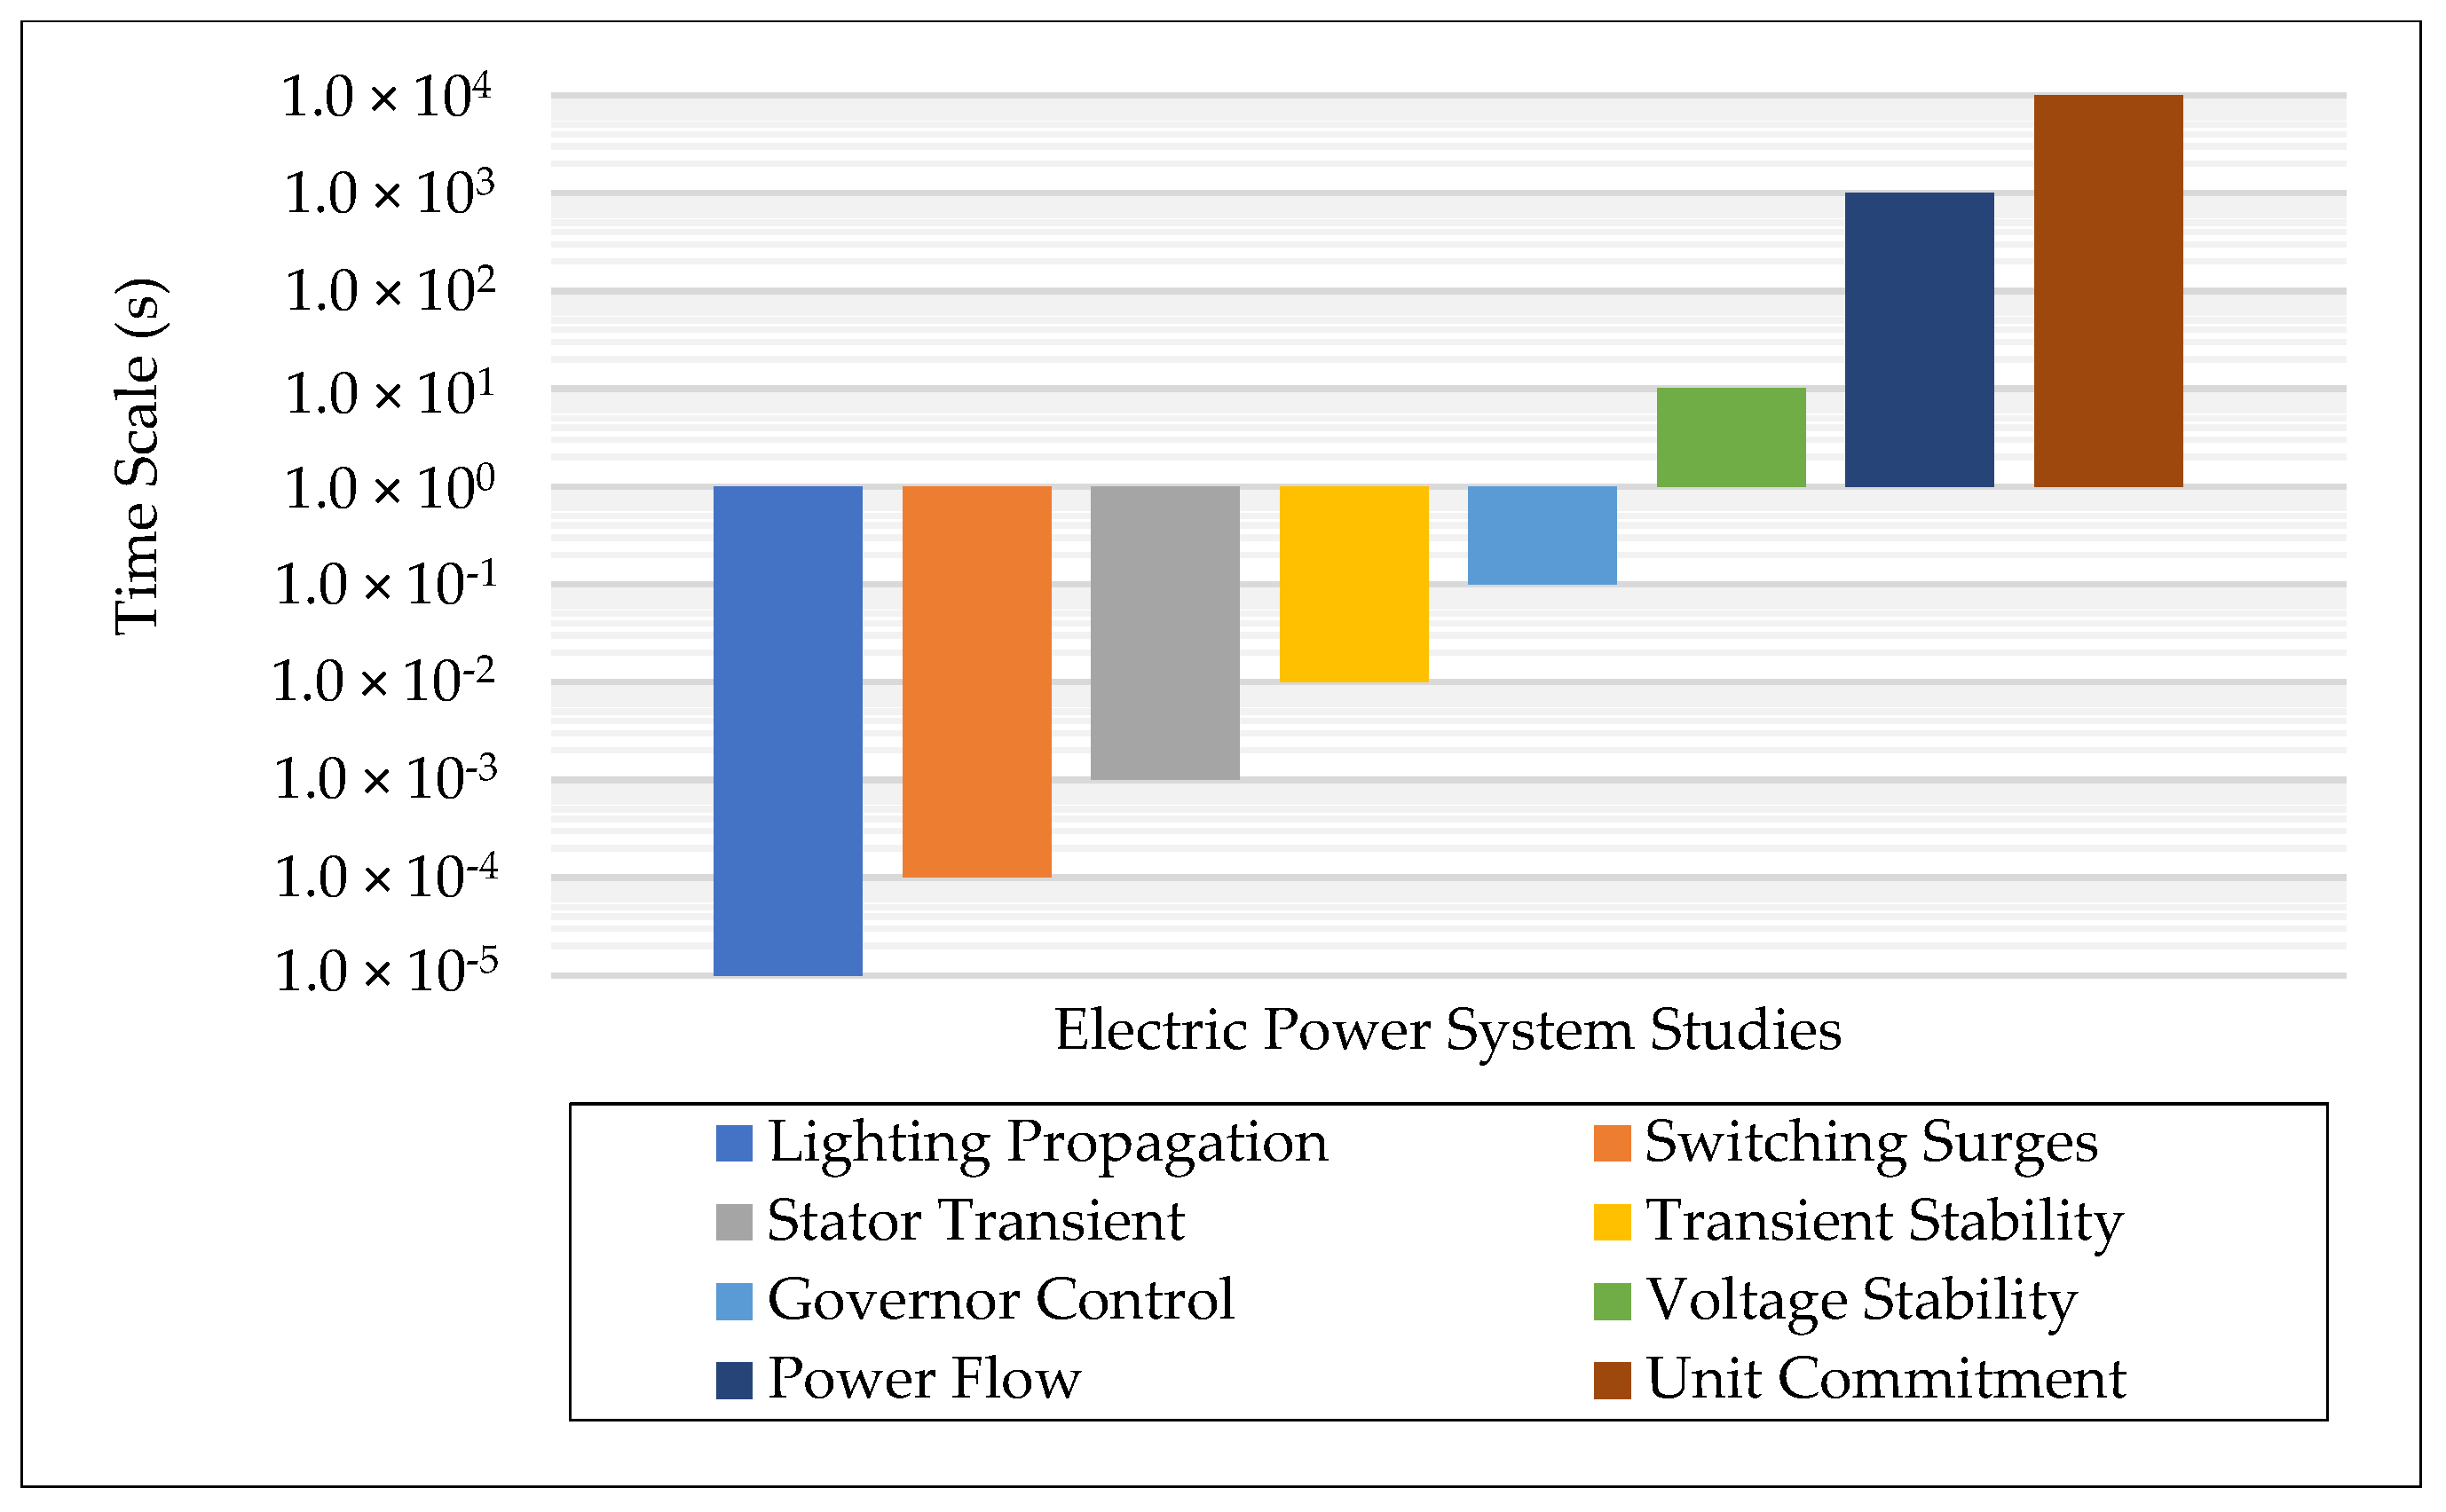
Diverse computational tools are used to facilitate the analysis of existing and potential future scenarios in complex systems without interfering in regular operations. It is crucial to get accurate parameters for power system components to reduce simulation uncertainty and model the system elements’ interaction in a precise way. The study and analysis of electric power systems can be approached at different time scales depending on the study focus [7]. The type of study determines the modeling used to represent the electrical components under analysis. Lightning propagation and switching transient studies require time steps on the order of microseconds (10−6 s). In contrast, power flow studies and unit commitment problems can be solved using time steps on the order of hours and days (see Figure 1).
Traditional approaches suggest studying transmission and distribution systems separately. However, studying the transmission-distribution interplay is vital to achieve a balance between the large-scale transmission network and the smaller scale distribution systems with a high penetration of renewables. Modeling the interplay of transmission and distribution systems is critical to analyze how DERs impact a system’s conventional operation. Similarly, considering this interplay contributes to answering questions about the effectiveness of transmission systems’ controls in addressing operational challenges at DERs levels [8]. Finally, more complete models are required to investigate the dynamic interactions between the electric power transmission and distribution systems due to the continuous deployment of distributed energy resources (DERs). Nevertheless, modeling the equivalent dynamic behavior of aggregated loads and DERs, representing the entire distribution network, is a complex and computationally demanding task [9].
There is a great interest in studying the interplay between transmission and distribution systems [8,9,10,11]. To model large distribution systems, utilities use an aggregated representation of all the equipment connected to a distribution feeder to optimize computational operations in electrical studies. This simplification is made assuming that the consumption profile of users along the feeder is similar. However, customers’ behavior is aimed at totally or partially generating their own electricity. For that reason, engineers are looking for ways to simplify the grid topology while keeping realistic models, using more accurate criteria.
Loads can be classified according to their behavior during a disturbance. Distribution networks that actively participate in system dynamics through load responses during disturbances are called “active”. The distribution networks without activity are called “latent” [10]. This approach enables a detailed dynamic simulation for both transmission and distribution systems. After completing the first iteration of the disturbance on the study, a network could be immediately declared as “latent” and modeled in a simplified way or could be considered as “active” and modeled in detail. Studies suggest that the level of activity in a distribution feeder could be quantified and then classified through their apparent power variation.
Another way to model distribution networks for hybrid transmission-distribution system modeling is based on social and economic information by areas [12]. According to the collected data, distribution networks are classified by type of load (residential, industrial, agricultural, and tertiary consumers). This type of classification strives to reduce the detailed models and, in a way, to aggregate distribution networks with similar socioeconomic characteristics to the transmission system. As a result, reduced models of distribution feeders are used, decreasing complexity and computational time in simulations.
On the other hand, there are efforts to model the complete combined transmission and distribution system using new software or even several software tools working at the same time. Authors in [9] developed a co-simulation platform: the Integrated Grid Modeling System at the National Renewable Energy Laboratory (NREL). Transmission level operations (economic dispatch and unit commitment) are simulated with FESTIV software. This software is coupled with MATPOWER, which calculates a balanced positive-sequence AC power flow for the transmission system. The power flow solution obtained in MATPOWER is used as input for distribution feeders modeled with GribLAB-D, which finally runs a three-phase unbalanced AC power flow at the distribution level.
In comparison with the latter approach, a three-phase dynamics analyzer was developed to study steady-state and dynamic responses of power systems, using an unbalanced three-phase model [11]. This study used the IEEE 39-Bus system as the transmission system and the IEEE 123-Bus as the distribution system. Besides, the authors simulated the hybrid model as one large power system using the Distributed Engineering Workstation software [11]. The distribution and transmission systems were modeled separately and then compared to the integrated transmission and distribution system model. As a result, the authors highlighted the need to simulate combined transmission and distribution systems for planning and operation studies.
In general, there is a trend towards the unbalanced three-phase model, which is closer to physical system behavior [8]. However, given the complexity of unbalanced-network hybrid simulation due to a large number of elements to be considered, simplifying assumptions should be made to facilitate the problem. Furthermore, there is not a study that includes the impacts of DPV systems connected at the distribution level on an island-type electric system and considers the response of conventional generators to encourage an increased level of PV integration.
1.2. PV Modeling and Implications for Bulk Power System Simulations
To study the PV integration impacts on the power system, it is necessary to consider the type of study that will be carried out. Transmission systems planning studies generally focus on what is the system behavior after a contingency. In this sense, positive-sequence models are currently used to perform power flow calculations and dynamics studies. Besides, aggregated models of PV are recommended by the Western Electricity Coordinating Council and others for power system studies [13,14]. A PV-aggregated model allows controlling both active and reactive power output. The PV energy output in the aggregated model strictly depends on PV parameters and the irradiance and temperature forecasting for the PV location. Furthermore, there are no totally accepted, aggregated dynamic models for small-scale PV systems [15].
To study the impact of DPV systems on bulk power systems (BPS), references [16,17] suggest simulating the whole electric system: transmission lines, transformers, sub-transmission lines (in some cases), and distribution system. Differences between integrated simulations (transmission and distribution systems) and separate simulations were observed in [16]. It was concluded that a sudden change in PV output could impact another distribution network through the transmission network. This fact could cause a cascading disconnection of DPV systems, affecting the whole system’s stability.
Different considerations need to be considered to approach the problem of the PV system modeling in BPS.
- (1)
- General considerations:
There is a trend towards multi-phase models because they consider the unbalanced nature of the distribution system [15]. Three-phase simulations were used in [14,18], although there is a difference in the way they modeled PV settings. While [14] modeled PV as active power sources, [18] added the voltage regulation offered by PV systems. Even though modeling BPS with a multi-phase representation of DERs and distribution feeders is essential for accurate studies, modeling hundreds or thousands of DPV systems in detail is a complex task, as discussed earlier. For this reason, it is important to look for ways of simplifying the PV connection at the distribution voltage level using aggregated models.
- (2)
- Aggregated models:
PV integration can be simplified using different methodologies. On the one hand, PV systems could be simplified by (1) a model aggregation (i.e., clustering of models with similar performance), (2) derivation of equivalent models (i.e., reduced-order representation), or (3) a combination of the two [19]. On the other hand, research suggests a more systemic clustering methodology to group smart inverters connected to secondary systems. For example, a cluster could be formed considering the PV connectivity strength (the number of buses between them) [20]. Furthermore, the netting of DERs with loads at the transmission or medium-voltage bus is not a suitable way to simplify the PV modeling for high-DER penetration scenarios. In contrast, the resulting models misrepresent potential aggregated impacts of DERs on BPS [13,19].
- (3)
- Geographical distribution:
The smoothing effects of DPV systems are considered in [6,17]. Through spatial-temporal analysis performed for Puerto Rico in [6], the variability of PV output was studied. Results showed that the variability decreased at lower time scales when PV systems are dispersed around the system. These studies showed that if PV systems are geographically distributed in distribution systems, a reduction in output fluctuations is achieved. Thus, through the optimal allocation of PV, sudden changes in PV output are minimized as well as the negative impacts at the transmission level.
To study the interplay between transmission and distribution systems with a high level of PV-based DERs, it is essential to account for the distinctive and relevant features of PV systems when creating DER models. PV allocation and the proximity between PV systems are key to determine the impacts on the electric grid [21]. Also, individual PV output in distribution systems is not equal to aggregated PV output connected to a transmission bus, since the geographic distribution of PV smooths the output fluctuations [17] as already mentioned. Finally, increasing PV penetration at the distribution level could reduce transmission line strain due to the direct injection of energy near the load centers. Nevertheless, the lack of PV dynamic disturbance ride-through capability and the displacement of conventional generation by DERs could negatively affect the operation safety requirements of the entire system [22].
1.3. The Electric Infrastructure in Puerto Rico
Puerto Rico has been struggling with its electric infrastructure at least for the last 15 years. A reduced industrial demand caused by the exodus of many industrial clients and decades of short-sighted management, created financial instability in Puerto Rico’s sole utility. Direct consequences of the financial problems were: reduced maintenance and an inability of keeping pace with technological advances [23]. Natural disasters, such as hurricane María in 2017 and earthquakes in early 2020 showed the frailty of the local power system and the need to re-think the electric infrastructure [24]. On the other hand, since the 1990s diverse stakeholders called for an increased use of renewable energy and more recently, distributed energy resources [3]. However, even with the dire financial and infrastructure conditions, the utility did not seek assistance in re-designing the grid and insisted on the centralized design that was proven ineffective by hurricane María and the 2020 earthquakes. This lack of collaboration has led some stakeholders to produce models based on publicly-available data in support of new, more distributed, and renewable-based power grid designs.
At the time of this study, the Puerto Rico Electric Power Authority (PREPA), a government-owned corporation, produced 70% of all electric energy and transmitted and distributed it in the archipelago. On June 2021, the operation, transmission and distribution were assigned to LUMA, a private consortium. Puerto Rico’s power system backbone is the 230 and 115 kV transmission network, whereas a 38 kV system, which is considered sub-transmission, works as a link between the transmission system and about two-thirds of the distribution substations and most private substations on the island [25]. Finally, the distribution system serves most customers at 13.2, 8.32, and 4.16 kV, with a small portion at 7.2 kV.
2. Methodology
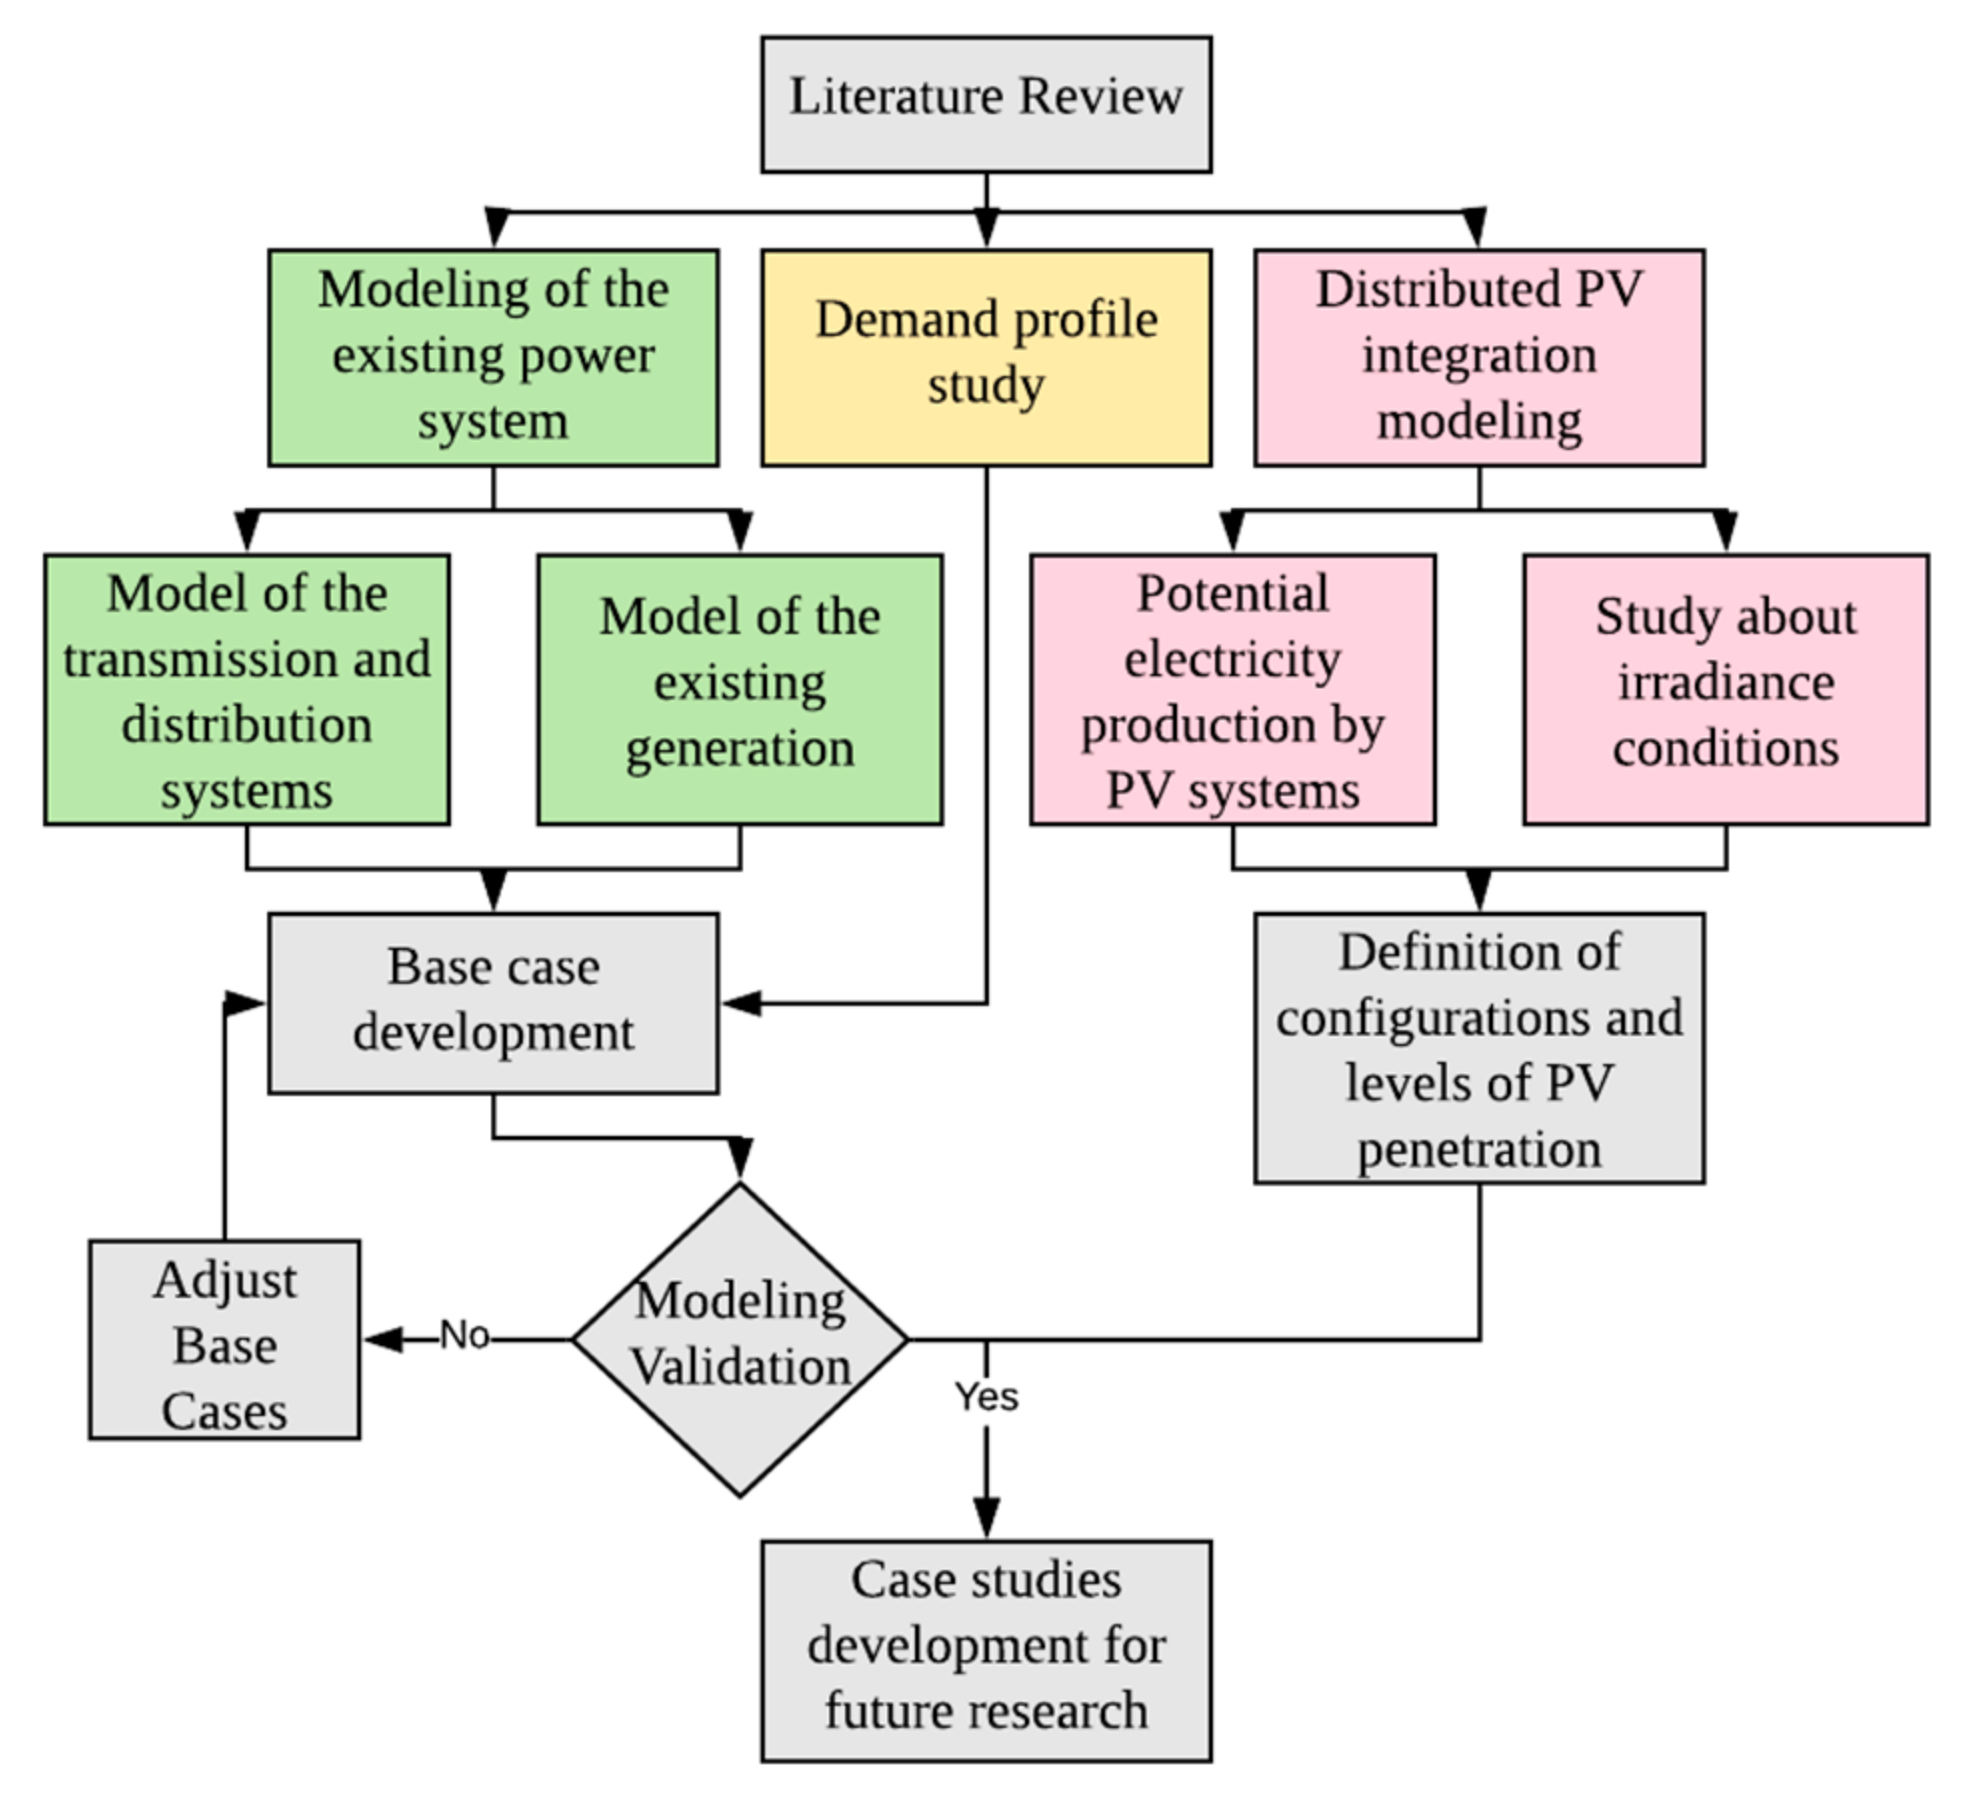
In order to evaluate the impacts of DERs on an existing electrical grid, an exhaustive study about the main electrical components of the actual power system is required. Figure 2 illustrates the process followed to study and create the model, including available conventional generators, existing transmission and distribution lines, transformers, and electricity use patterns. The subsections describe information, sources, and calculations used to simulate and validate the Puerto Rico power system as realistically as possible. Moreover, the procedure to estimate potential electricity production by residential rooftop PV systems and the process to analyze irradiance conditions for sunny and cloudy days are described. This methodology could be replicated in other remote or islanded contexts to evaluate potential scenarios for the power grid, identifying the optimal penetration level and allocation of renewable systems and the grid upgrades required to support the highest possible integration of renewable energy.
DIgSILENT PowerFactory was the software selected to model and analyze the electric system. This commercial software for power system analysis allows modeling electrical components of a power grid at all levels (generation, transmission, distribution, and load). It also provides several tools to study the integration of renewable resources at different points in the system. Both long-term (e.g., power flow) and short-term (e.g., short circuit, stability, and harmonics) studies can be performed.
This work presents the process to build a power system model not only considering technical data, but also social data, as well in order to create a more integrative planning perspective. This work is also applicable in locations where system data are not available, either because the utility does not cooperate with outside stakeholders, or because there are limited planning resources. For such instances, this paper presents a roadmap that can facilitate the planning work of diverse groups working towards an increased use of renewable energy. Tropical and subtropical regions of the world will find this paper useful, since most likely those places have similar insolation levels as the case study presented. Literature on the integration of renewable energy to the grid is dominated by studies of regions within large, interconnected power systems. However, comprehensive work related to isolated/islanded and remote locations that have low-inertia power systems is very limited. Conditions are very different on low-inertia power systems, their limited capability to deal with the stability and control challenges of variable energy sources provide a challenging testing context for new ideas because problems would surface faster and are more critical than in large inertia systems. Thus, the novelty of this work is the focus on integrating social aspects to a comprehensive engineering modeling effort and the method presented in this section and applied on a case study. This will contribute to the electric energy transitions of locations having aggressive renewable energy goals (e.g., 100% renewable) as well as islanded and remote locations with low-inertia grids.
2.1. Modeling the Puerto Rico Generation Fleet
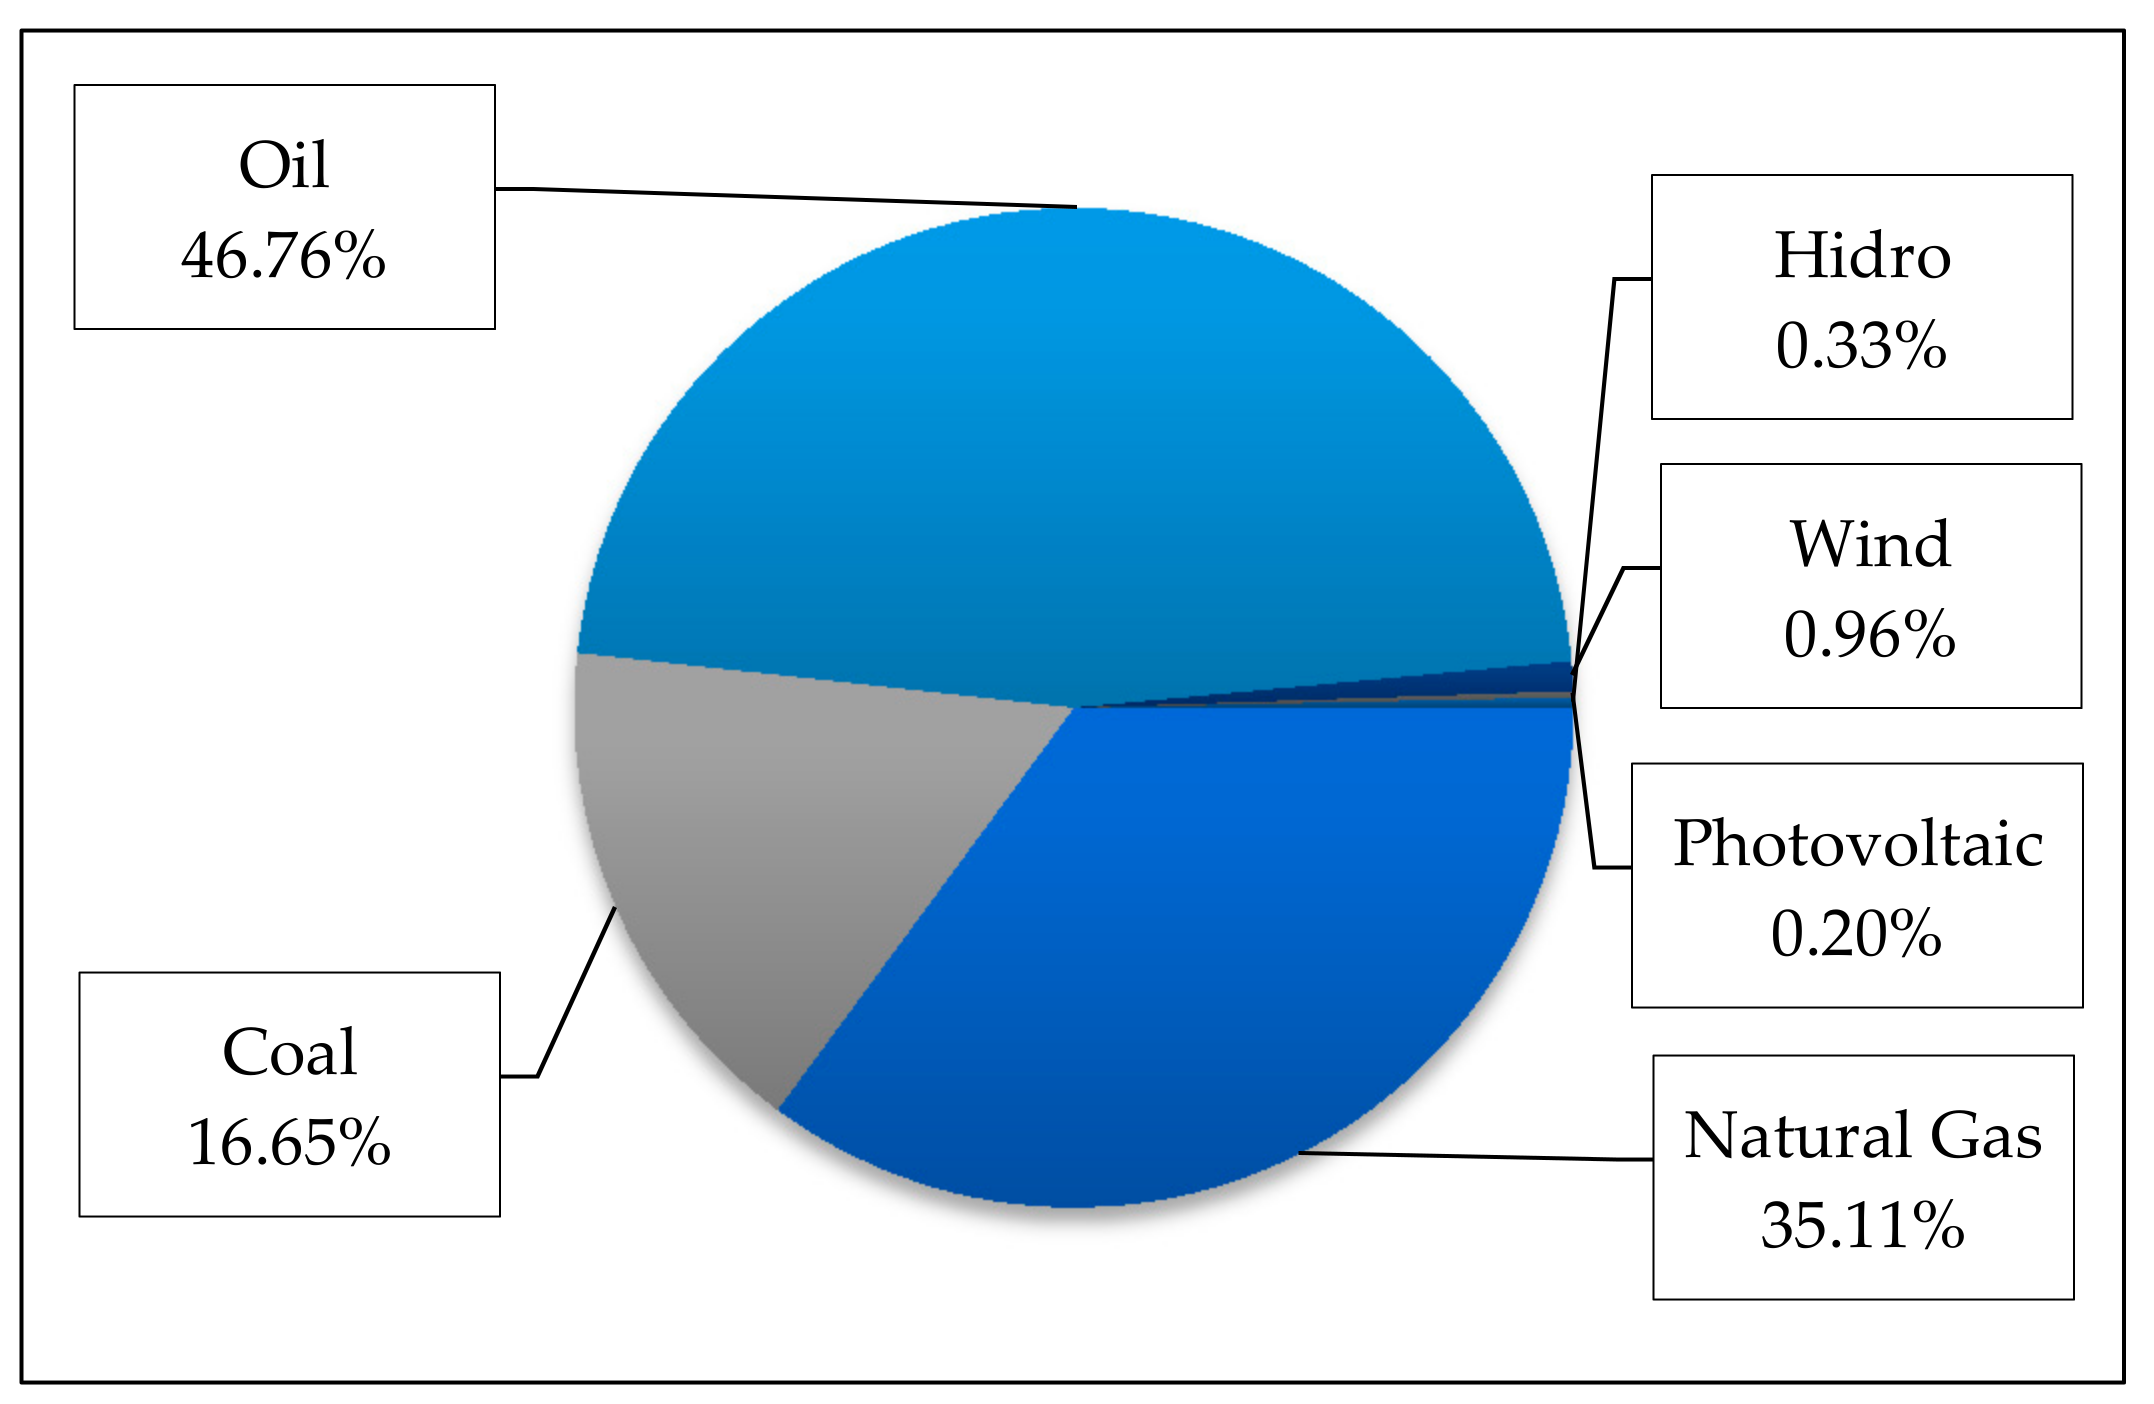
In Puerto Rico, the power system is dependent on imported fossil fuels to operate conventional generators on the island; the most common fuels used are No. 6 fuel oil, natural gas, coal, and diesel. Figure 3 shows the distribution of generating sources for the fiscal year (FY) 2014 [26]. This distribution was considered to keep correlation with the most current demand data publicly available from 2010 to 2014.
Some of the generators’ characteristics will be more critical than others depending on the type of study. For example, for dynamic analyses, the generator’s ramp rates are considered in order to simulate the transition from one power output to another in a given period. In planning studies, the power plant heat rate, a measure of an energy plant’s thermal efficiency in converting fuel to electricity, can be taken into account to evaluate future scenarios that optimize generators’ dispatch.
PREPA’s Integrated Resource Plan (IRP) from 2018 [27] was used as a data source on existing and currently available generators. Table 1 presents key data for the conventional generators used in the model and in simulations. The generators’ maximum capacity, the voltage level at terminals, and connection buses were considered. These generators were simulated as synchronous machines connected to the grid.
2.2. Modeling the Puerto Rico Power Network
The data needed to model the entire transmission and sub-transmission network was collected through meticulous research on the existing lines and transformers. On the one hand, the 230/115 kV transmission network was modeled using data from references [28,29]. On the other hand, the capacity and length of the 38 kV sub-transmission lines were obtained using georeferenced data from [30]. The main input parameters required by DIgSILENT PowerFactory and most of the power system analysis software to model transformers and lines are presented in Table 2 and Table 3.
During the execution of balanced AC power flows, the automatic voltage tap changing of transformers was considered to maintain appropriate voltage levels (0.95 p.u. < v < 1.05 p.u.) at the buses. According to each transformer setting, the tap-winding was selected on the high voltage side or the low voltage side. The upper and lower voltage level adjustments were set to +/− 10% for all transformers, and the voltage control was carried out using 1.25% of additional voltage per tap.
For power line modeling, rated voltages and current capacities were required. Additionally, in DIgSILENT PowerFactory, typical line models can be created using resistances and reactances in ohm/km. With these values, the power system lines with the same configuration and size could be generated using a typical line model, adjusting the line’s length in kilometers, the number of parallel lines, and a derating factor.
The distribution network model’s development considered the 13.2 and 8.32 kV levels for this study. These voltage levels represent almost half of the circuit miles in the distribution system of Puerto Rico [25,31]. The remaining existing distribution feeders are mostly 4.16 kV, which are not optimal for high DERs penetration in Puerto Rico [32]. Higher voltages are needed to maximize local, renewable energy use, supporting the assumption made in this work of integrating PV at 13.2 and 8.32 kV. The 4.16 kV loads were modeled as aggregated loads connected to the corresponding transmission substations.
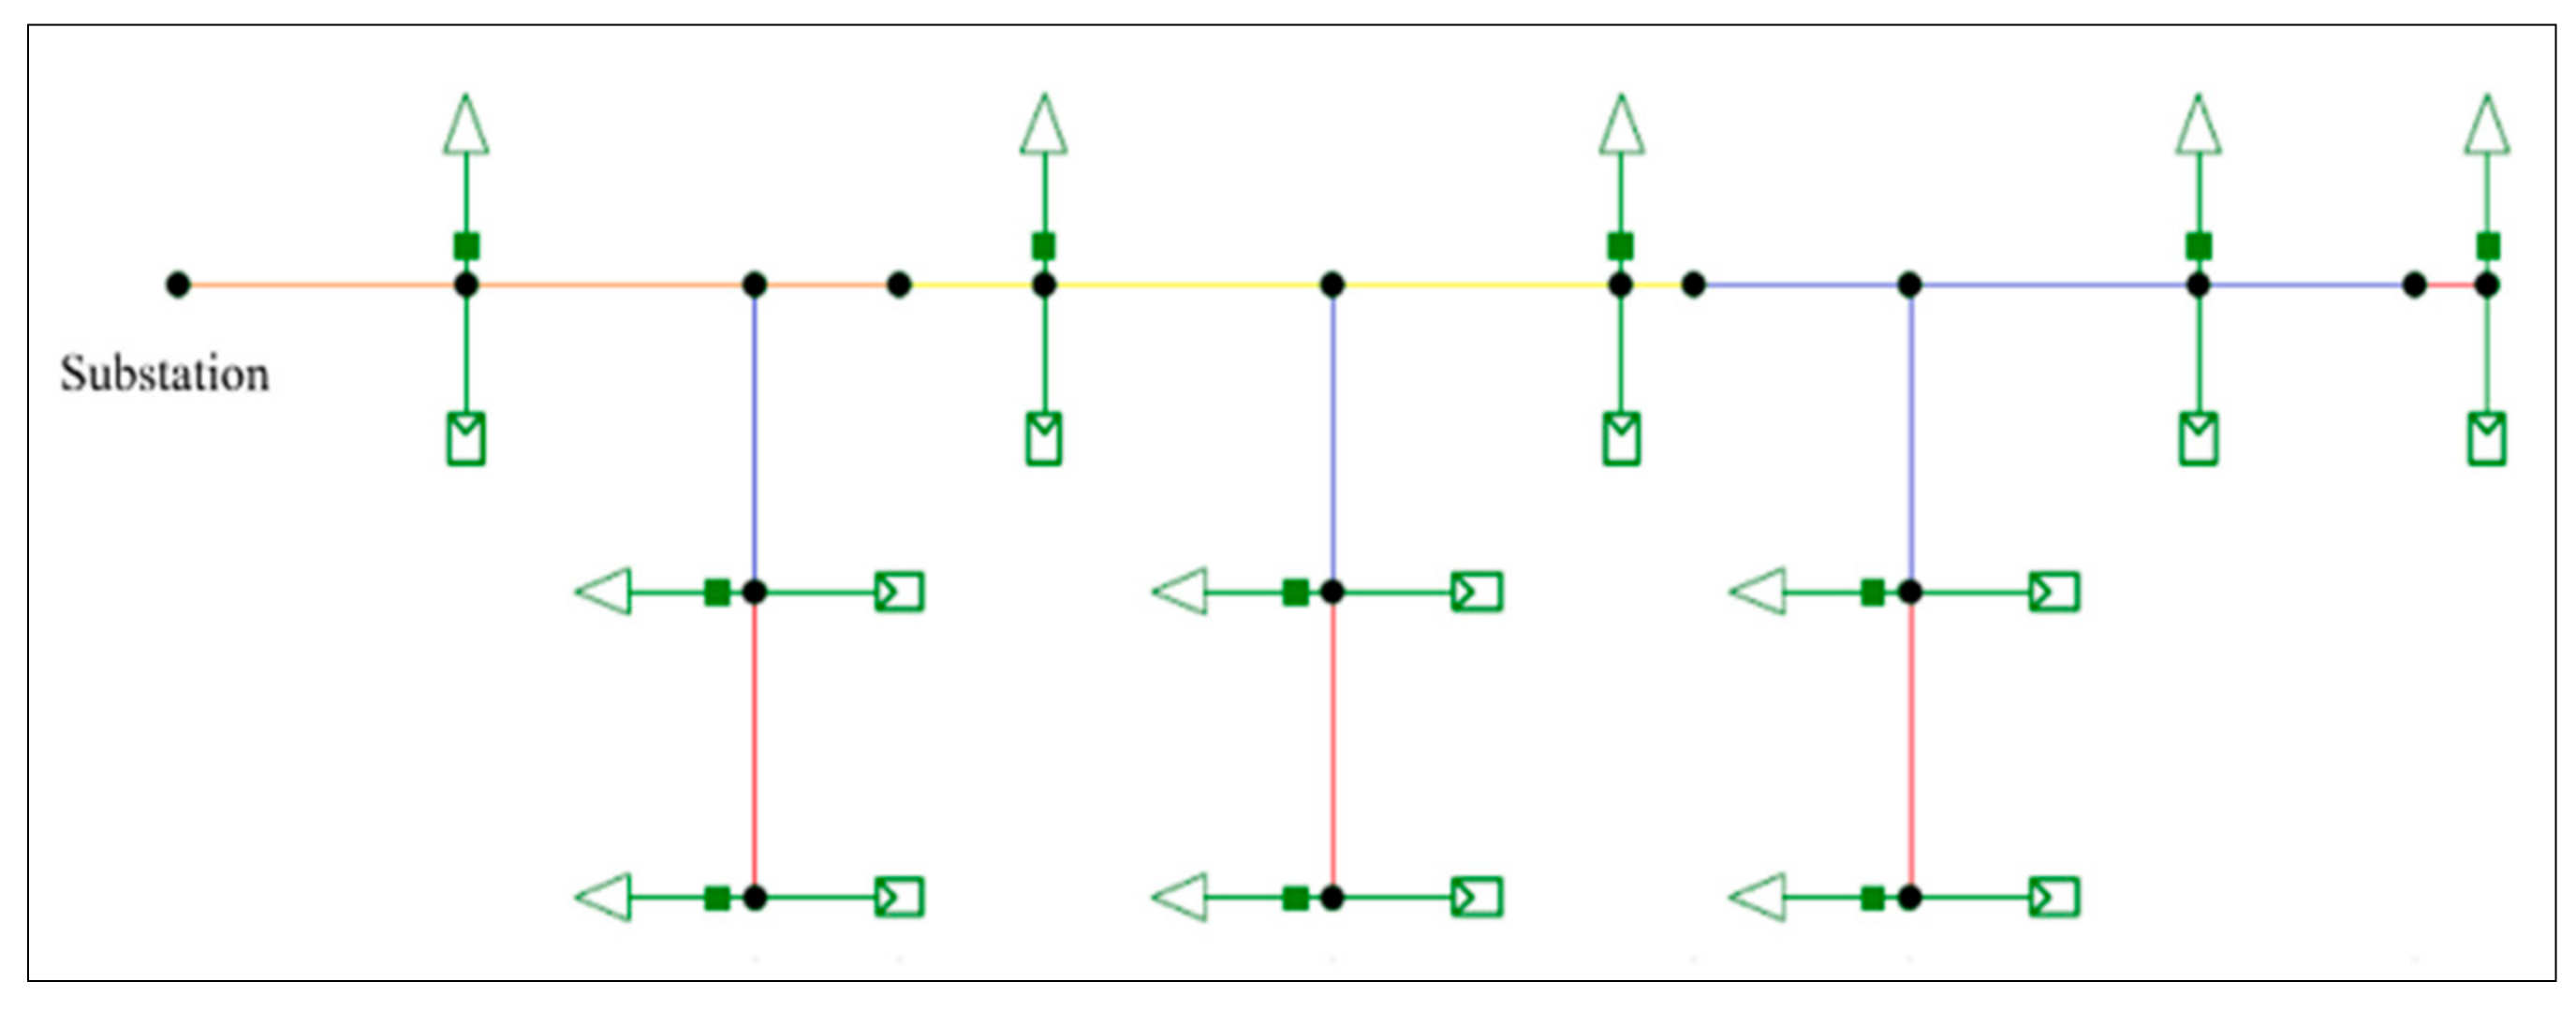
Although public information related to an existing distribution system might be minimal, representative feeder designs could be utilized as a general representation of the distribution system. For example, in this study, a typical feeder design used in a previous study was considered to model the distribution system [32]. The selected feeder represents about 35% of the distribution lines commonly found in Puerto Rico and could be operated at 13.2 or 8.32 kV [33]. The distribution line consisted of one main feeder with a total length of 10 km and three lateral branches connected at 2.5 km intervals along the main feeder with a total distance of 1.2 km each.
The main feeder has three different types of conductors. The first 3.25 km were modeled using a 556 ACSR conductor. A 266 ACSR conductor was used to represent the second 3.25 km section. Finally, the rest of the mainline was modeled using 1/0 ACSR with a final 0.75 km segment of 4 CU HD. On the other hand, the three lateral branches have 1/0 ACSR for the first half and 4 CU HD for the rest. The distribution feeders were connected to the low-voltage side of 115/13.2 kV, 115/8.32 kV, 38/13.2 kV, and 38/8.32 kV substations.
Buses along feeders were located at the transition points between conductors (i.e., the end of one type of conductor and the beginning of a new one). Other buses correspond to customer connections to the distribution system. The electricity consumed by customers was represented as load, while the energy provided by PV systems was modeled as power sources. Initially, DERs can be set with the actual power output for the validation process and subsequently modified for research purposes. Figure 4 shows the simulated feeder with load connections (as arrows) and PV systems (as rectangles). Both loads and PV systems were evenly connected to the main feeder and the three lateral branches. Similarly, customers’ electricity consumption and the energy production by PVs (if any) were also evenly distributed along the line.
Using a 556 ACSR conductor (rating of 730 A) as the highest-rated conductor, the simulated feeder’s calculated capacity was roughly 16 MVA for 13.2 kV connections and 11 MVA for 8.32 kV connections. The number of feeders connected to a substation depends on the transformer capacity. For security factors, one feeder was connected for every 10 MVA of transformer capacity. The above consideration was made for both the 13.2 and 8.32 kV levels. In this way, a total of 194 13.2 kV feeders and 52 8.32 kV feeders were simulated for the distribution system. A total of 246 distribution feeders, as shown in Figure 4, were created. The resulting model is accurate enough to study transmission-distribution interactions in the presence of DERs.
2.3. Modeling the Demand Profile
Power flow studies require not only to know electrical component capacities but also the electricity demand connected to each substation. Both tasks could be complex in isolated, low-inertia power systems with limited access to system data from utilities. However, for the demand profile in an island-type power system, the load consumption percentages for each of the buses in municipalities could be estimated from municipal, district, socio-economic, or community data. This section presents the result from a study completed on electricity use patterns in Puerto Rico to simulate the consumption of loads connected to every substation.
Electric utility customers are classified into residential, commercial, industrial, agriculture, public lighting, and other public authorities. Data related to customer class consumption are available, but the municipalities’ demand breakdown is not readily available, thus the use per municipality had to be determined. The distribution of the total energy demand among the substations was made using the regional load estimates and considering historical consumption data (from 2010 to 2014), provided by PREPA (the most recent electricity demand data reported by PREPA during the development of this study) [34]. Figure 5 shows the historical electricity consumption by class in Puerto Rico.
On average, the commercial sector has the highest consumption of electricity at almost 47%. The second and third positions are the residential class at 36% and the industrial class at 14.7%. Agriculture, public lighting, and other public authorities demand 2.1% of the total annual electricity. In addition to the above information, different municipal parameters were considered to calculate the electricity consumption by customer class within each municipality. Socio-economic and demographic variables like industrial activities, population, housing, and infrastructural projects are data of considerable significance that heavily influence the electricity consumption patterns of a power system [35]. Data from the census, local agencies and authorities, and government entities were used as influential factors for distributing the electricity consumption by classes (Figure 5) among the dispersed substations throughout the municipalities. For example, to estimate the distribution of 36% of the total electricity consumption by municipalities regarding the residential demand, it was assumed that the resident population in Puerto Rico’s municipalities is directly proportional to the electricity demand. On the other hand, to distribute 47% of the total electricity consumption by municipalities regarding the commercial demand, it was assumed that the average employment in Puerto Rico’s municipalities is also proportional to the electricity consumption. Table 4 shows the parameters previously mentioned for the allocation of demand by region.
2.4. Distributed PV Integration Modeling
To evaluate the impacts of high renewable penetrations in an existing power system, it is crucial to identify the available renewable sources in each region and whether there are favorable conditions to take advantage of those resources. In Puerto Rico, there are many ways to generate electricity through renewable energy resources. Biomass, micro-hydro, ocean, solar radiation, solar thermal, and wind are viable means of producing renewable energy on the island, demonstrated by research estimates [5]. The solar resource was identified as economically feasible, thus this work assumed PV systems as the optimal way to support the electricity supply in regular operation and after catastrophic events when the power system could be divided into mini regions. Puerto Rico receives a high insolation level, more than 20 MJ/m2 (average daily global insolation per year) in some areas, which means that the island has an excellent solar resource that can be exploited. Besides, PV systems do not produce noise (compared with wind generators) and are the least environmentally intrusive technology. Finally, although the required surface area to install PV systems could be a concern because of Puerto Rico’s size, the PV installation on rooftops is a practical way to address this concern [5].
Actual irradiance and temperature data collected from diverse Puerto Rico areas were used to estimate the PV output under different scenarios and irradiance conditions. The potential PV production was used to assign the installed capacity of PV systems around the main island. Each PV system’s installed capacity varied according to the evaluated scenario (PV penetration levels). Meanwhile, an irradiance study was developed to identify a typical PV system output during a sunny day and a cloudy day. Irradiance data was used to determine the PV output in each of the scenarios.
2.5. Potential PV Production Using the Electric Power System Model
Two factors are significant to determine the potential electricity production by PV systems in a given area. On the one hand, the average irradiance per year or insolation estimated on municipalities indicates how much electricity can be produced by PV systems. On the other hand, the available surface area represents another significant parameter to calculate the potential electricity production by PVs. The insolation in each municipality was obtained using the System Advisory Model (SAM) software of the National Renewable Energy Laboratory (NREL). For the available residential rooftop area, 2017 census data estimates were used, considering single unit-detached and single unit-attached housings [42]. According to SAM, the top 10 list of the municipalities with the highest average daily global insolation per year is shown in Table 5. Santa Isabel is the municipality with the highest average insolation in Puerto Rico.
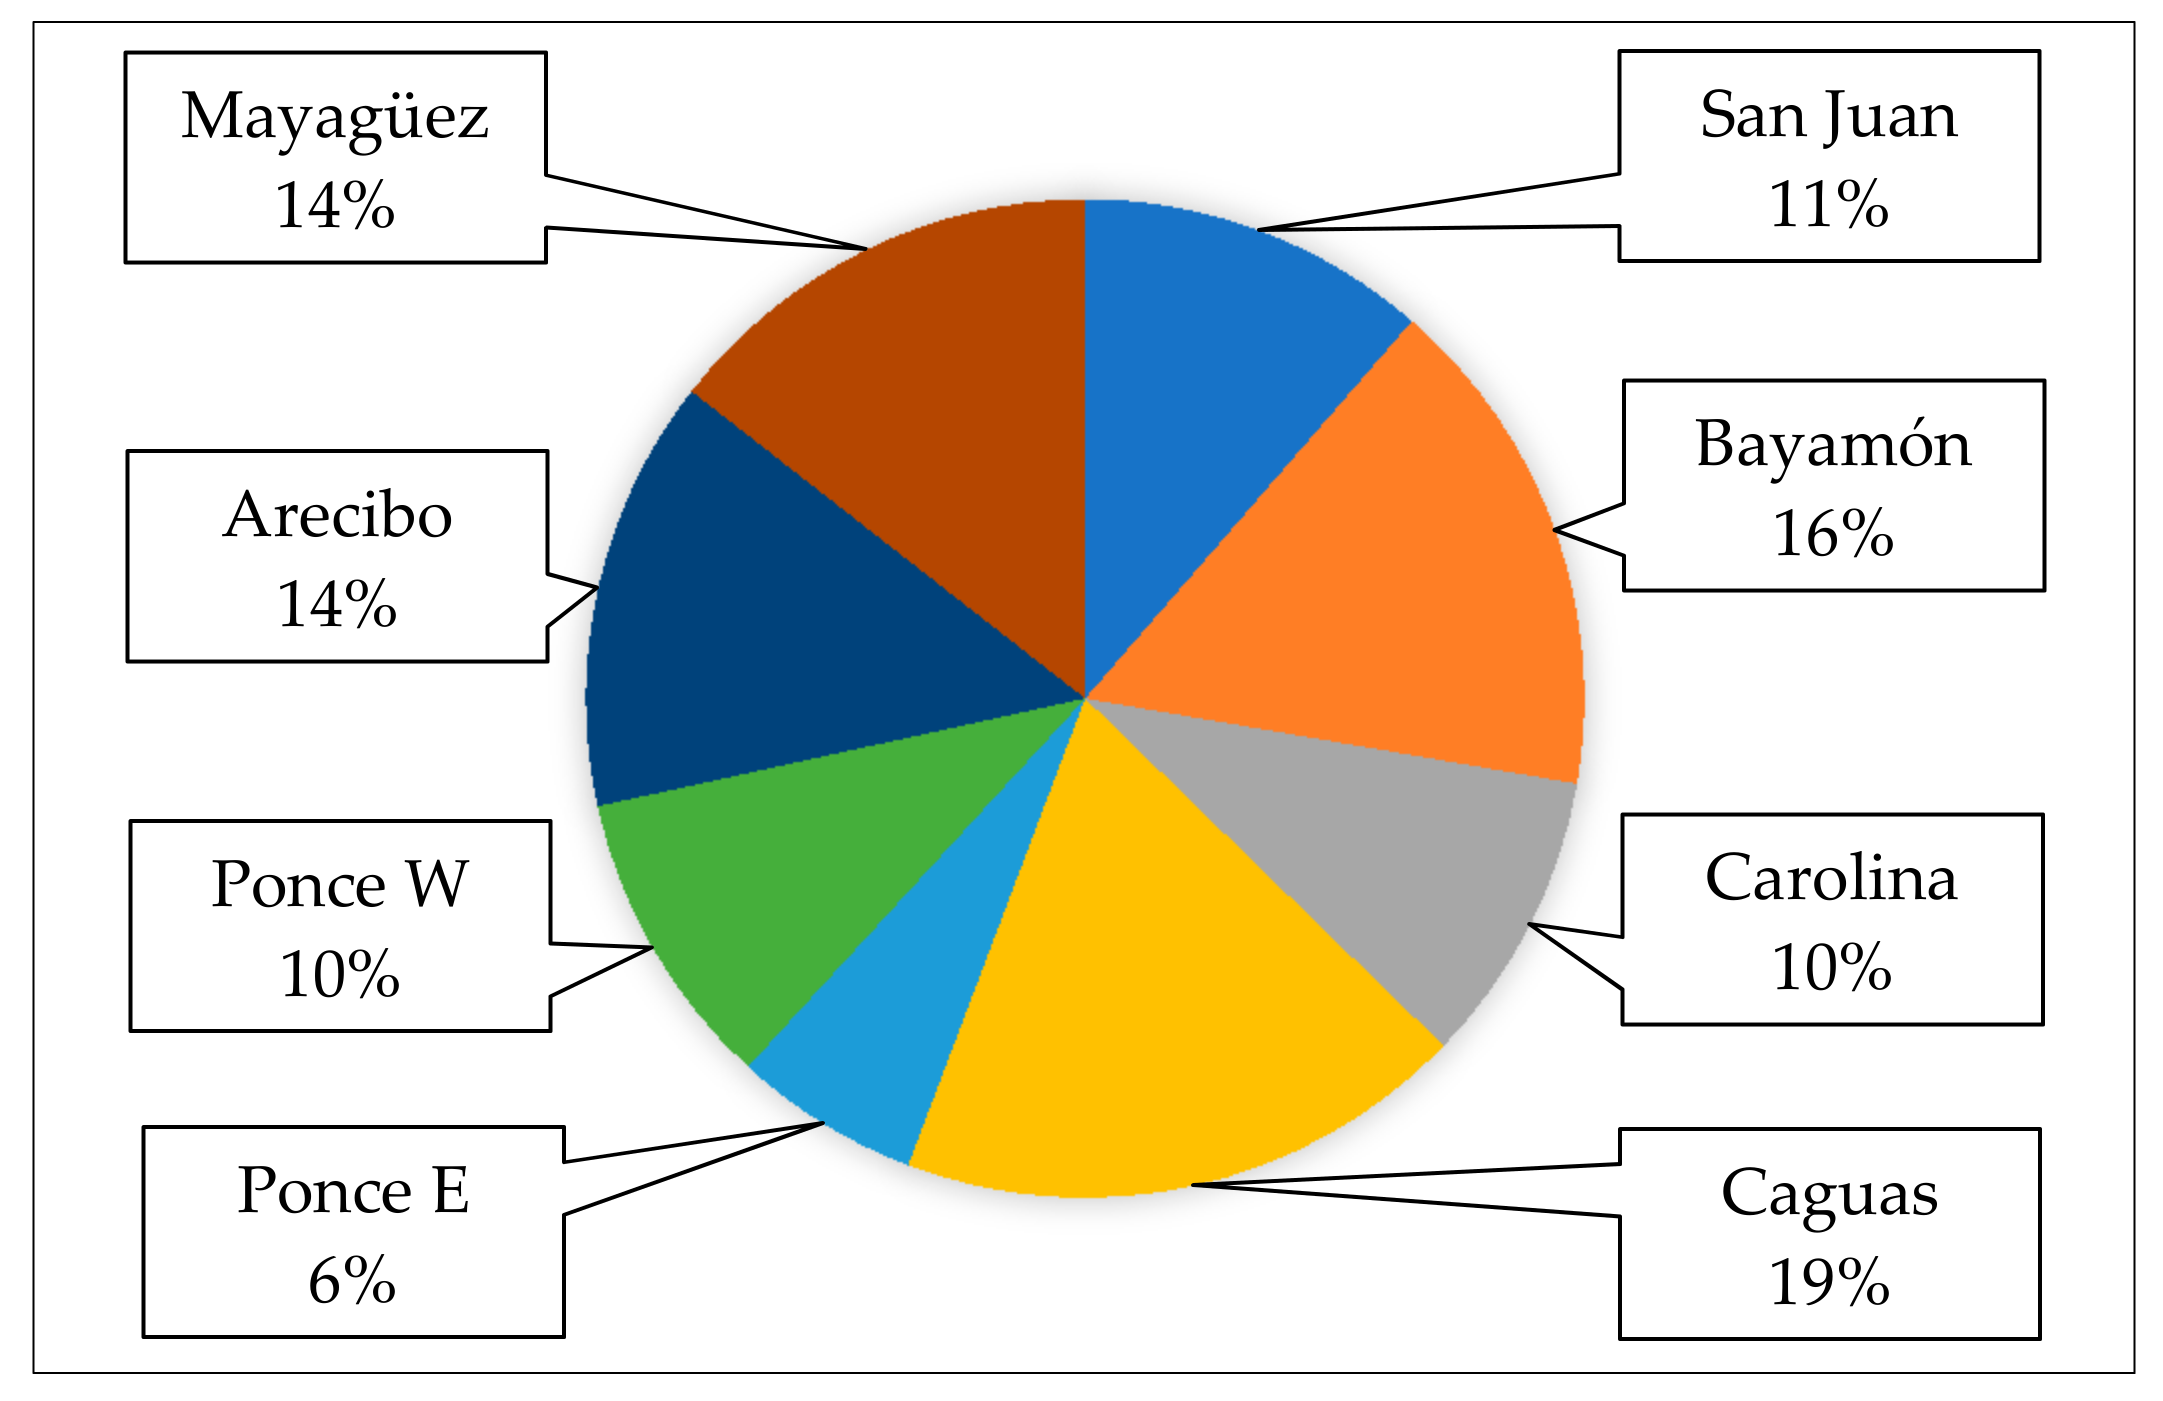
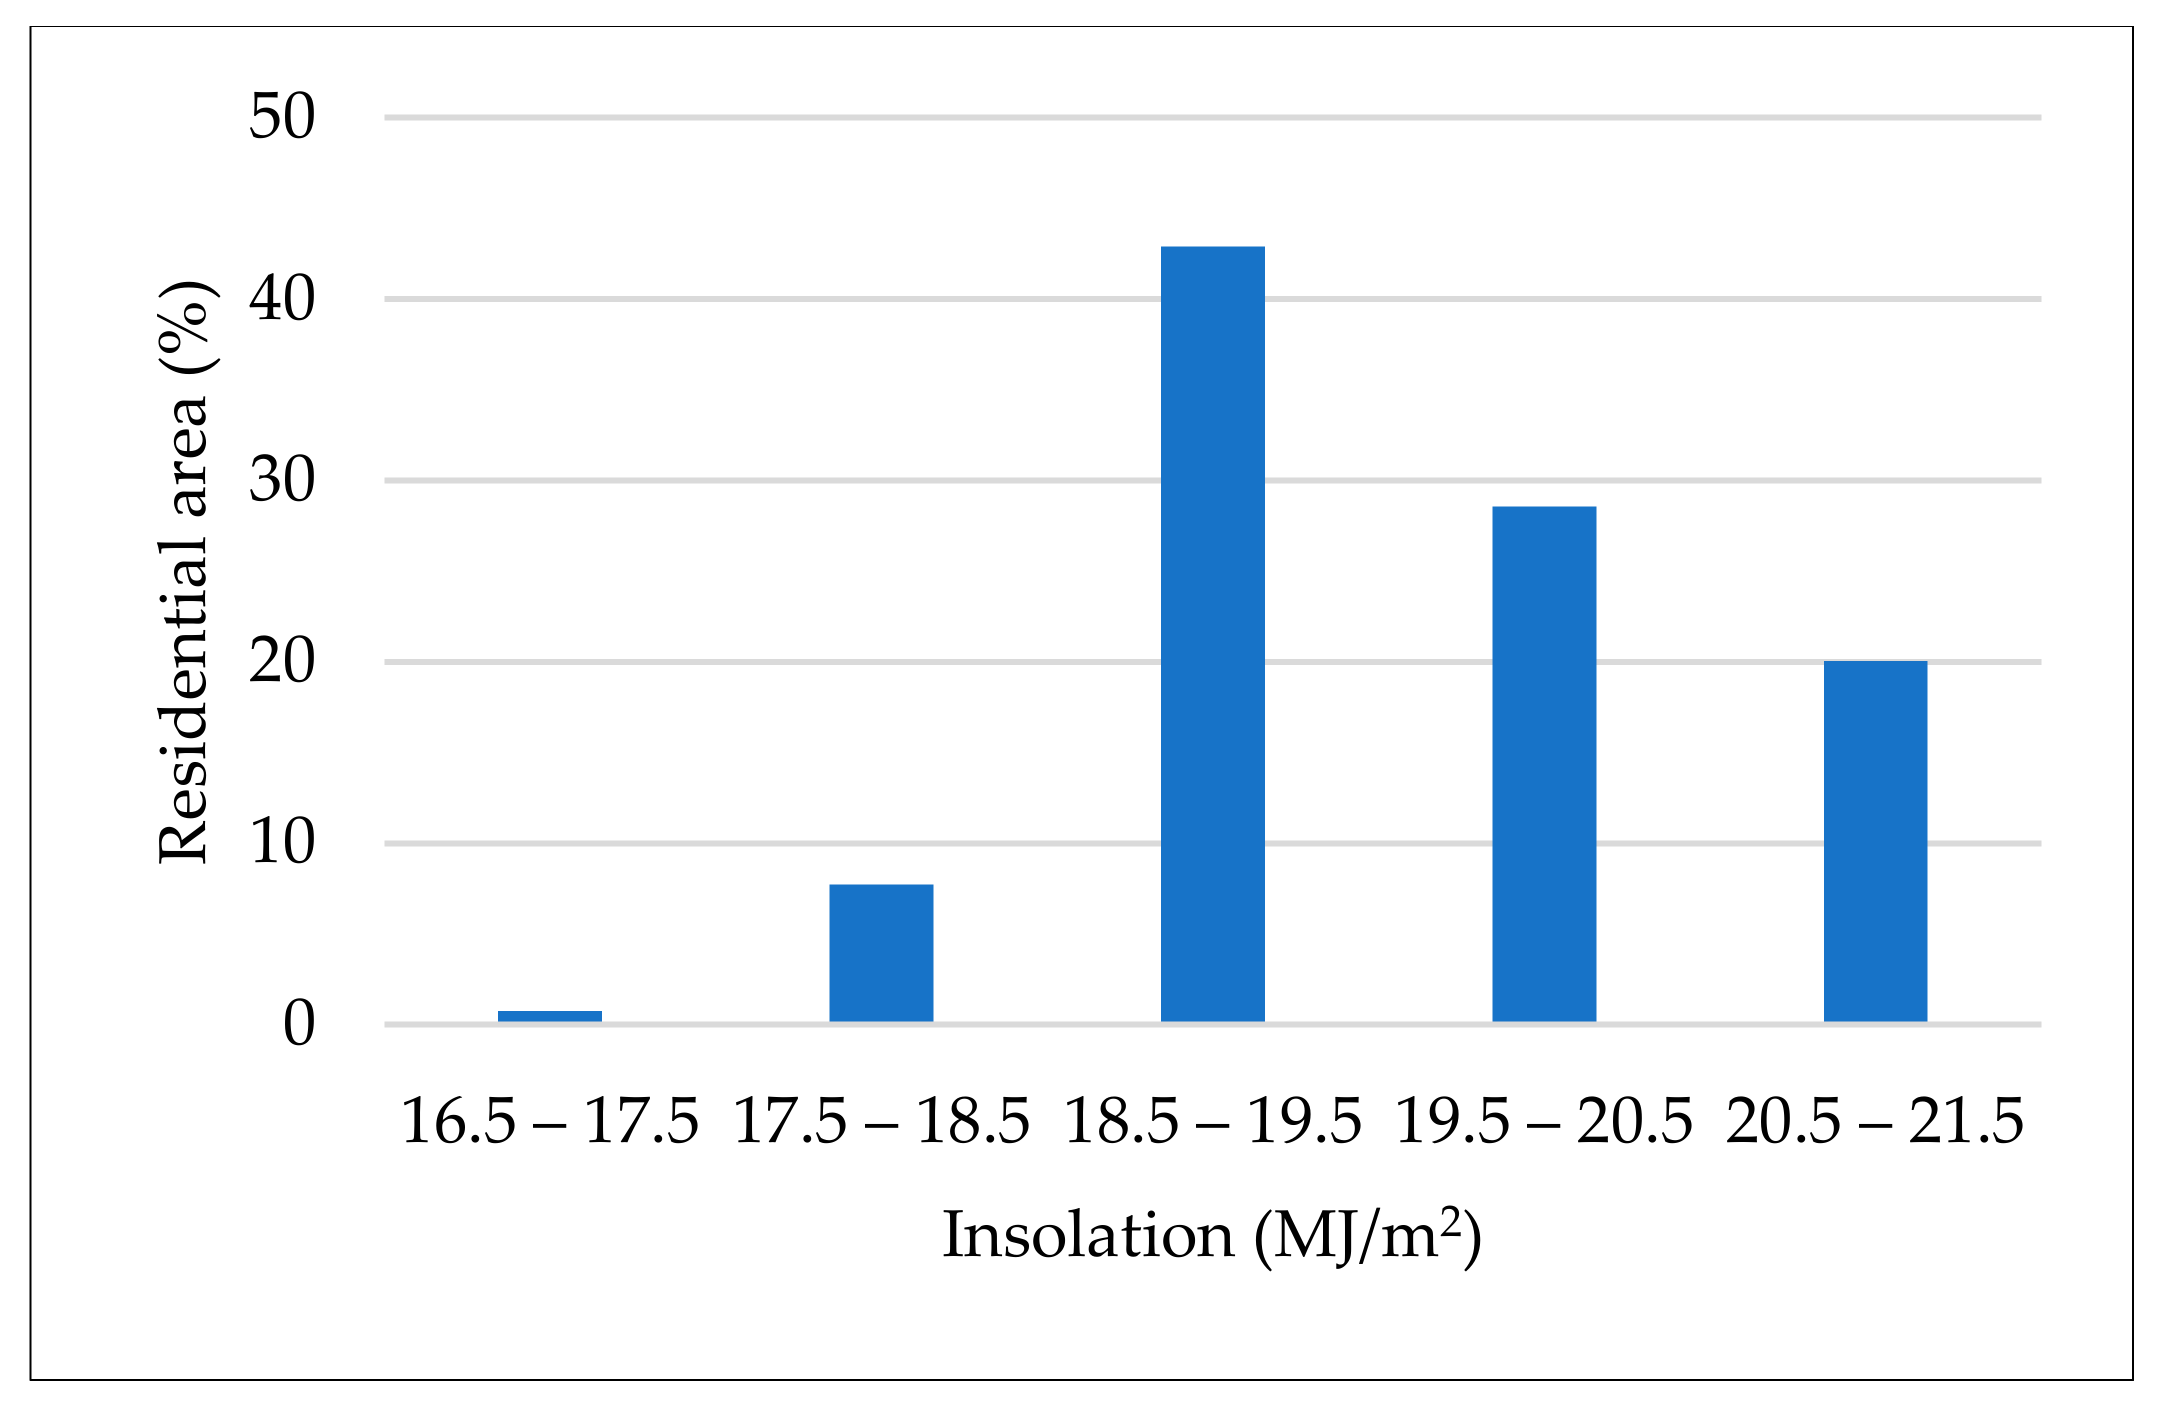
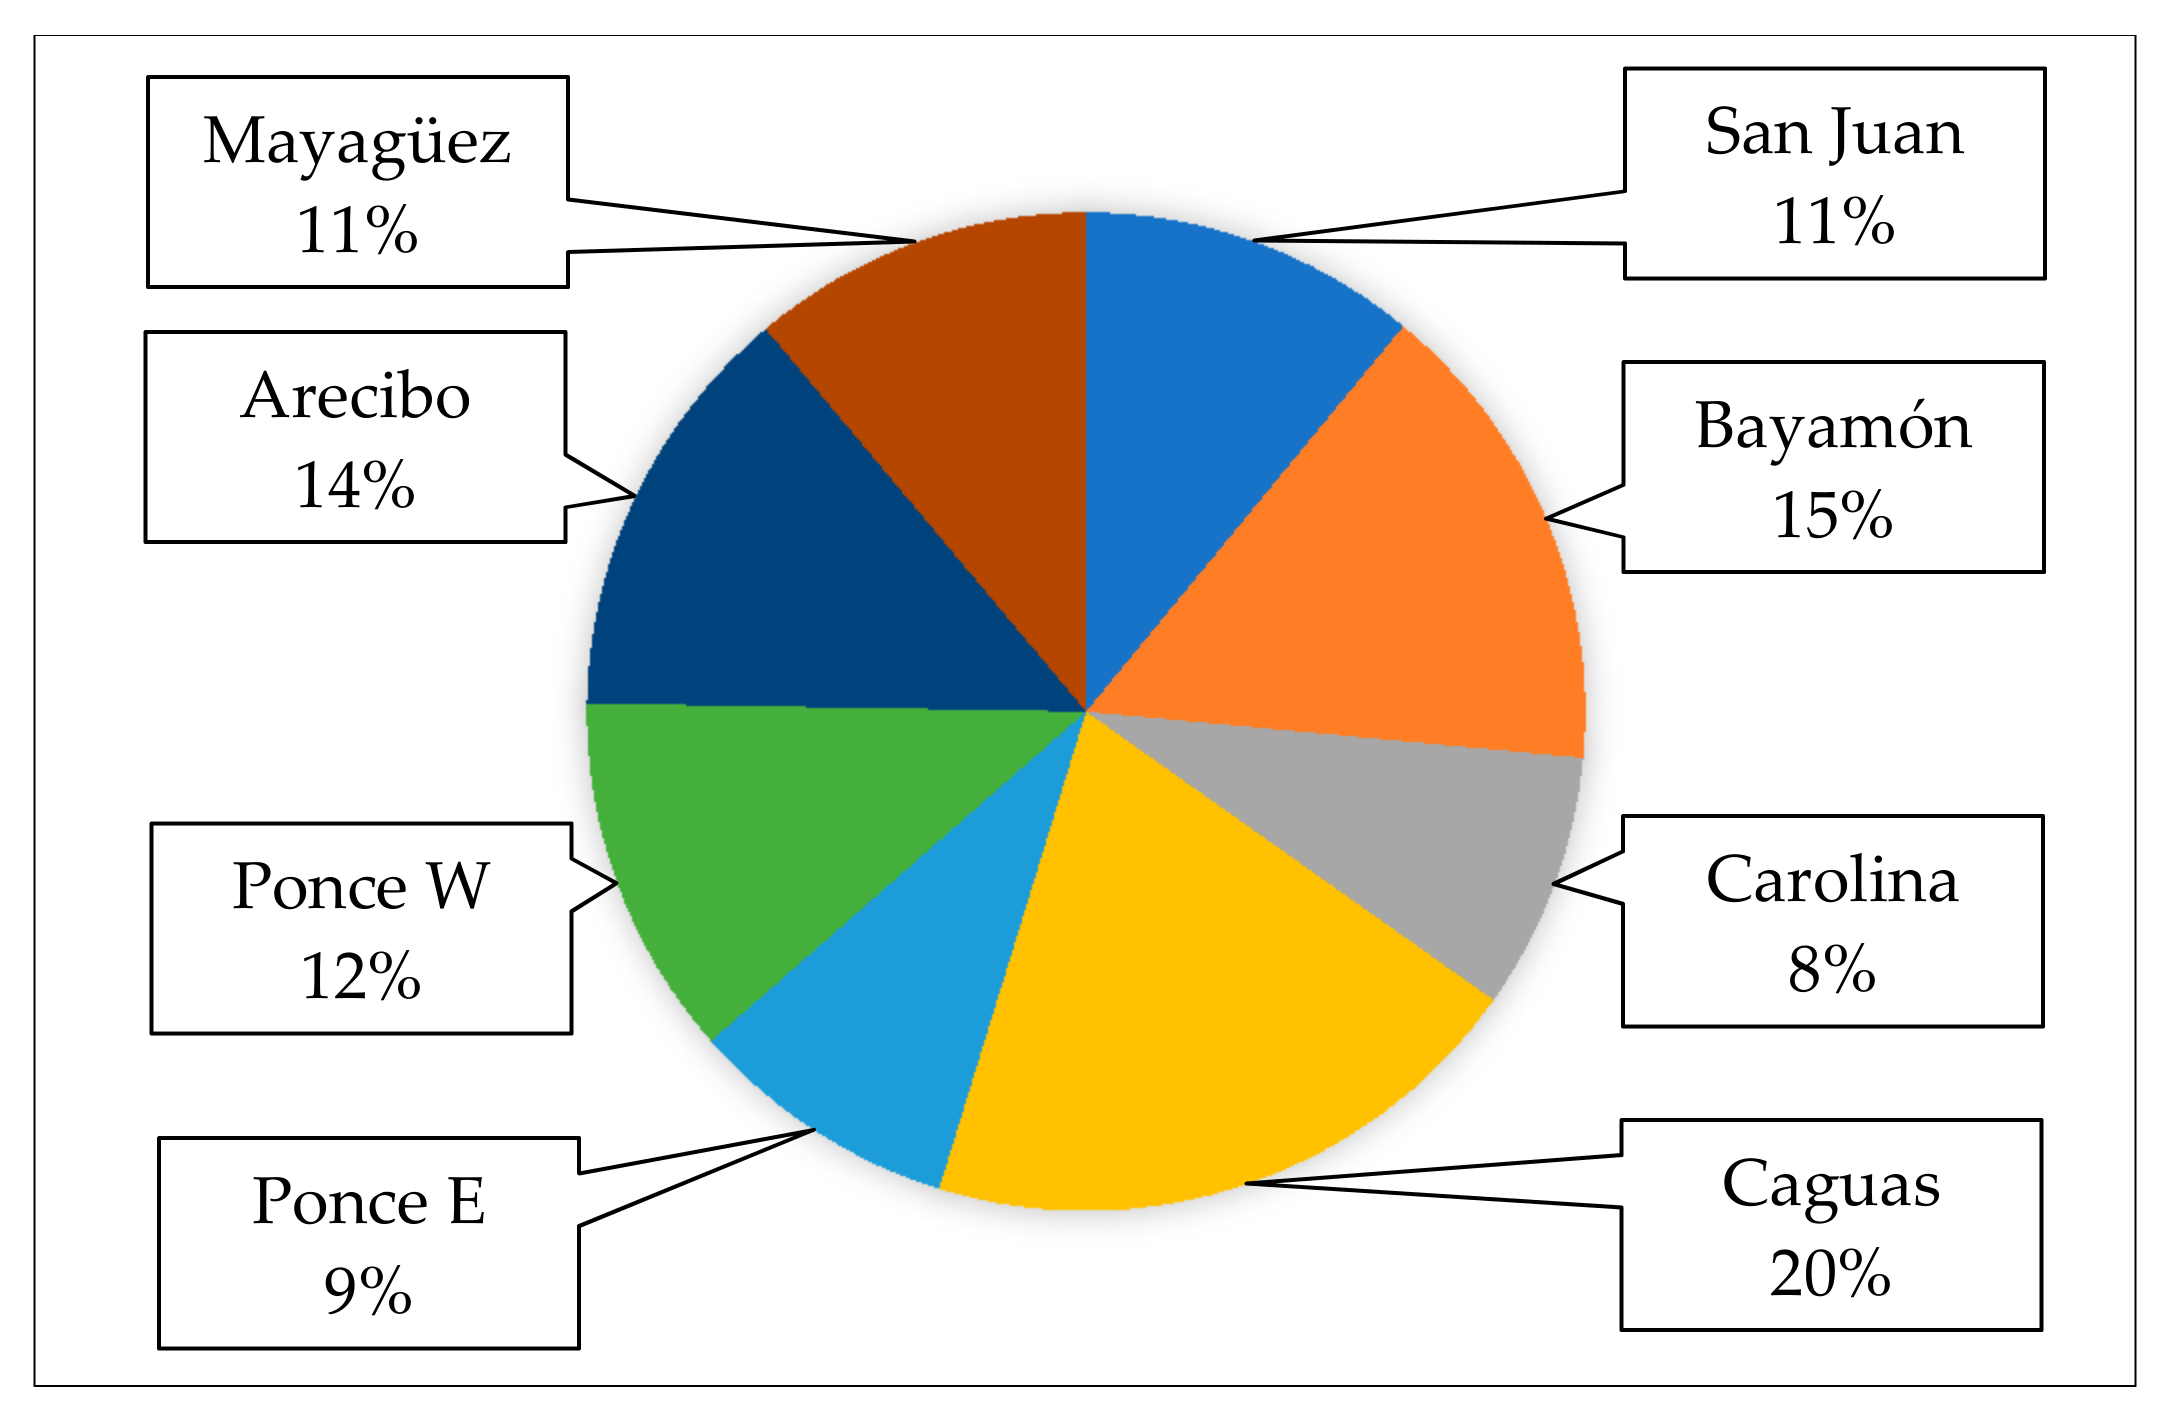
Residential rooftop areas were selected as a feasible surface to install PV modules without occupying limited land resources, a strategy previously proposed and currently pursued by industrial, commercial and residential clients [5]. The percentage of occupied housing units and an uncertainty factor of 50% (non-available areas due to weak roof infrastructures or equipment that prevent the PV installation or cause shadows) were applied to the total of household units. Furthermore, a typical residential housing unit area of 152 m2 was used for calculations. Figure 6 shows the distribution of the available residential rooftop area by region. Figure 7 presents a histogram of the average daily global irradiance per year received by the available residential rooftop area in Puerto Rico.
The potential energy obtained from the insolation in each one of the municipalities was calculated using Equation (1) [5,44]. Likewise, Equation (2) was used to calculate the potential electricity production by PV systems [5,45]. Additionally, typical characteristics for PV systems and additional equipment parameters considered for calculations are shown in Table 6.
where,
DPEI is Daily Potential Energy obtained by Insolation on the terrestrial surface (kWh/day),
DAI is Daily Average Irradiance per year (kWh/m2/day),
ARRA is Available Residential Rooftop Area (m2).
where,
DPEP is Daily Potential Electricity Production by PV systems (kWh/day),
DPEI is Daily Potential Energy obtained by Insolation on terrestrial surface (kWh/day),
ηrated is PV module efficiency,
TCη is Temperature coefficient (%/°C),
TC is Operating PV module temperature (°C),
TN is Operating PV module at Standard Test Conditions (25 °C),
ηinv is Inverter efficiency,
ηloss is Efficiency for losses.
2.6. PV Production Conditions for Different Times
As the insolation is not constant during the day, identifying cloudy and sunny days is required to evaluate each possible situation. Additionally, spatial variability of solar energy needs to be also considered because of the changing and inconsistent irradiance over the territory at the same time.
In this study, the National Solar Radiation Database, created by NREL, was the primary data source to gather annual irradiance information for five geographically dispersed locations in Puerto Rico: San Juan, Ceiba, Ponce, Aguadilla, and Mayagüez [46]. Since there is no irradiance data for each municipality, the assumption that a group of municipalities (areas) could have the same average irradiance at specific times was made as an acceptable initial approach to consider the spatial variability of solar radiation. This assumption is supported by a 2009 study on the potential of renewable energy in Puerto Rico [5]. The datasets used to model the irradiance in each area are shown in Table 7.
One-hour irradiance data was processed to identify sunny and cloudy days and to simulate different irradiance conditions for the same evaluated case. The sky clearness index k was used for the irradiance characterization. This index is defined as the ratio of instant global horizontal irradiance (IGHI) to the maximum theoretically possible extraterrestrial irradiance (IETI). Thus, the sky clearness index can be calculated through Equation (3), and the daily sky clearness index kD could be calculated using Equation (4) [47].
The daily sky clearness index was jointly used with the daily probability of persistence (POPD), proposed by [48], which indicates the stability level of a daily irradiance dataset for a fixed time interval. The higher the value of POPD, the smaller the irradiance variability. An algorithm was developed to process annual irradiance data and to facilitate the characterization of all days. The process to calculate the POPD with one-hour irradiance data are the following:
- Calculate the instantaneous clearness index k for each hour, as described in Equation (3), and round off at the first decimal place.
- Count the times of identical adjacent clearness index k.
- Divide the result obtained in step 2 by the number of hours from sunrise to sunset.
3. Results
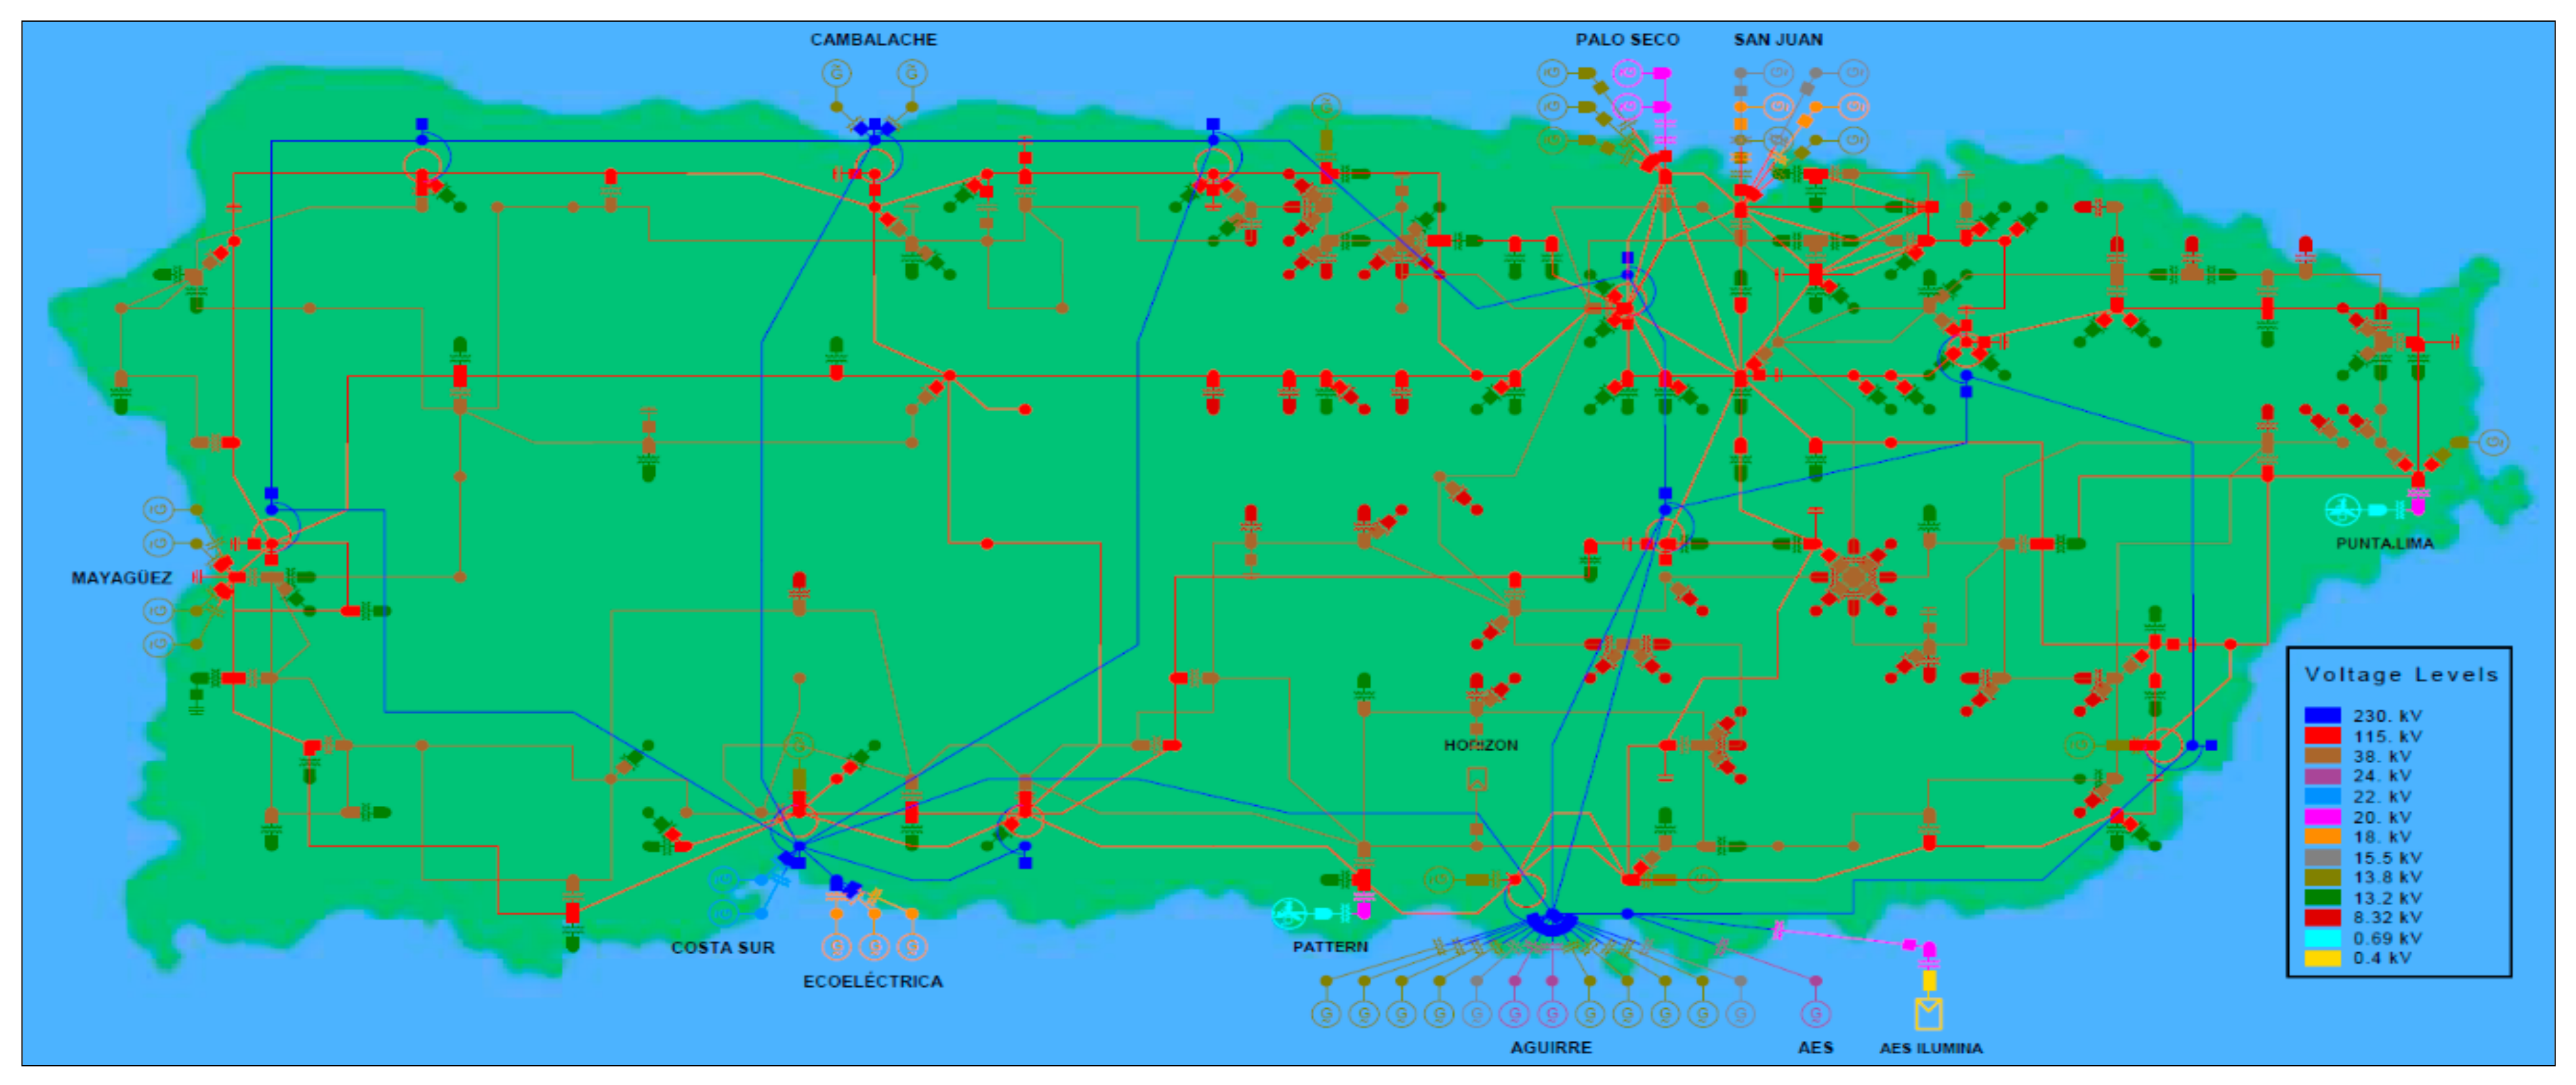
Following the methods described on Section 2 resulted in an electric power system model with a total of 4535 buses used to simulate the Puerto Rico power system. A summary of all the simulated power lines and transformer substations is presented in Table 9 and Table 10. Figure 8 shows the final version of the one-line diagram of the Puerto Rico power system. In this figure, voltage levels are identified by colors.
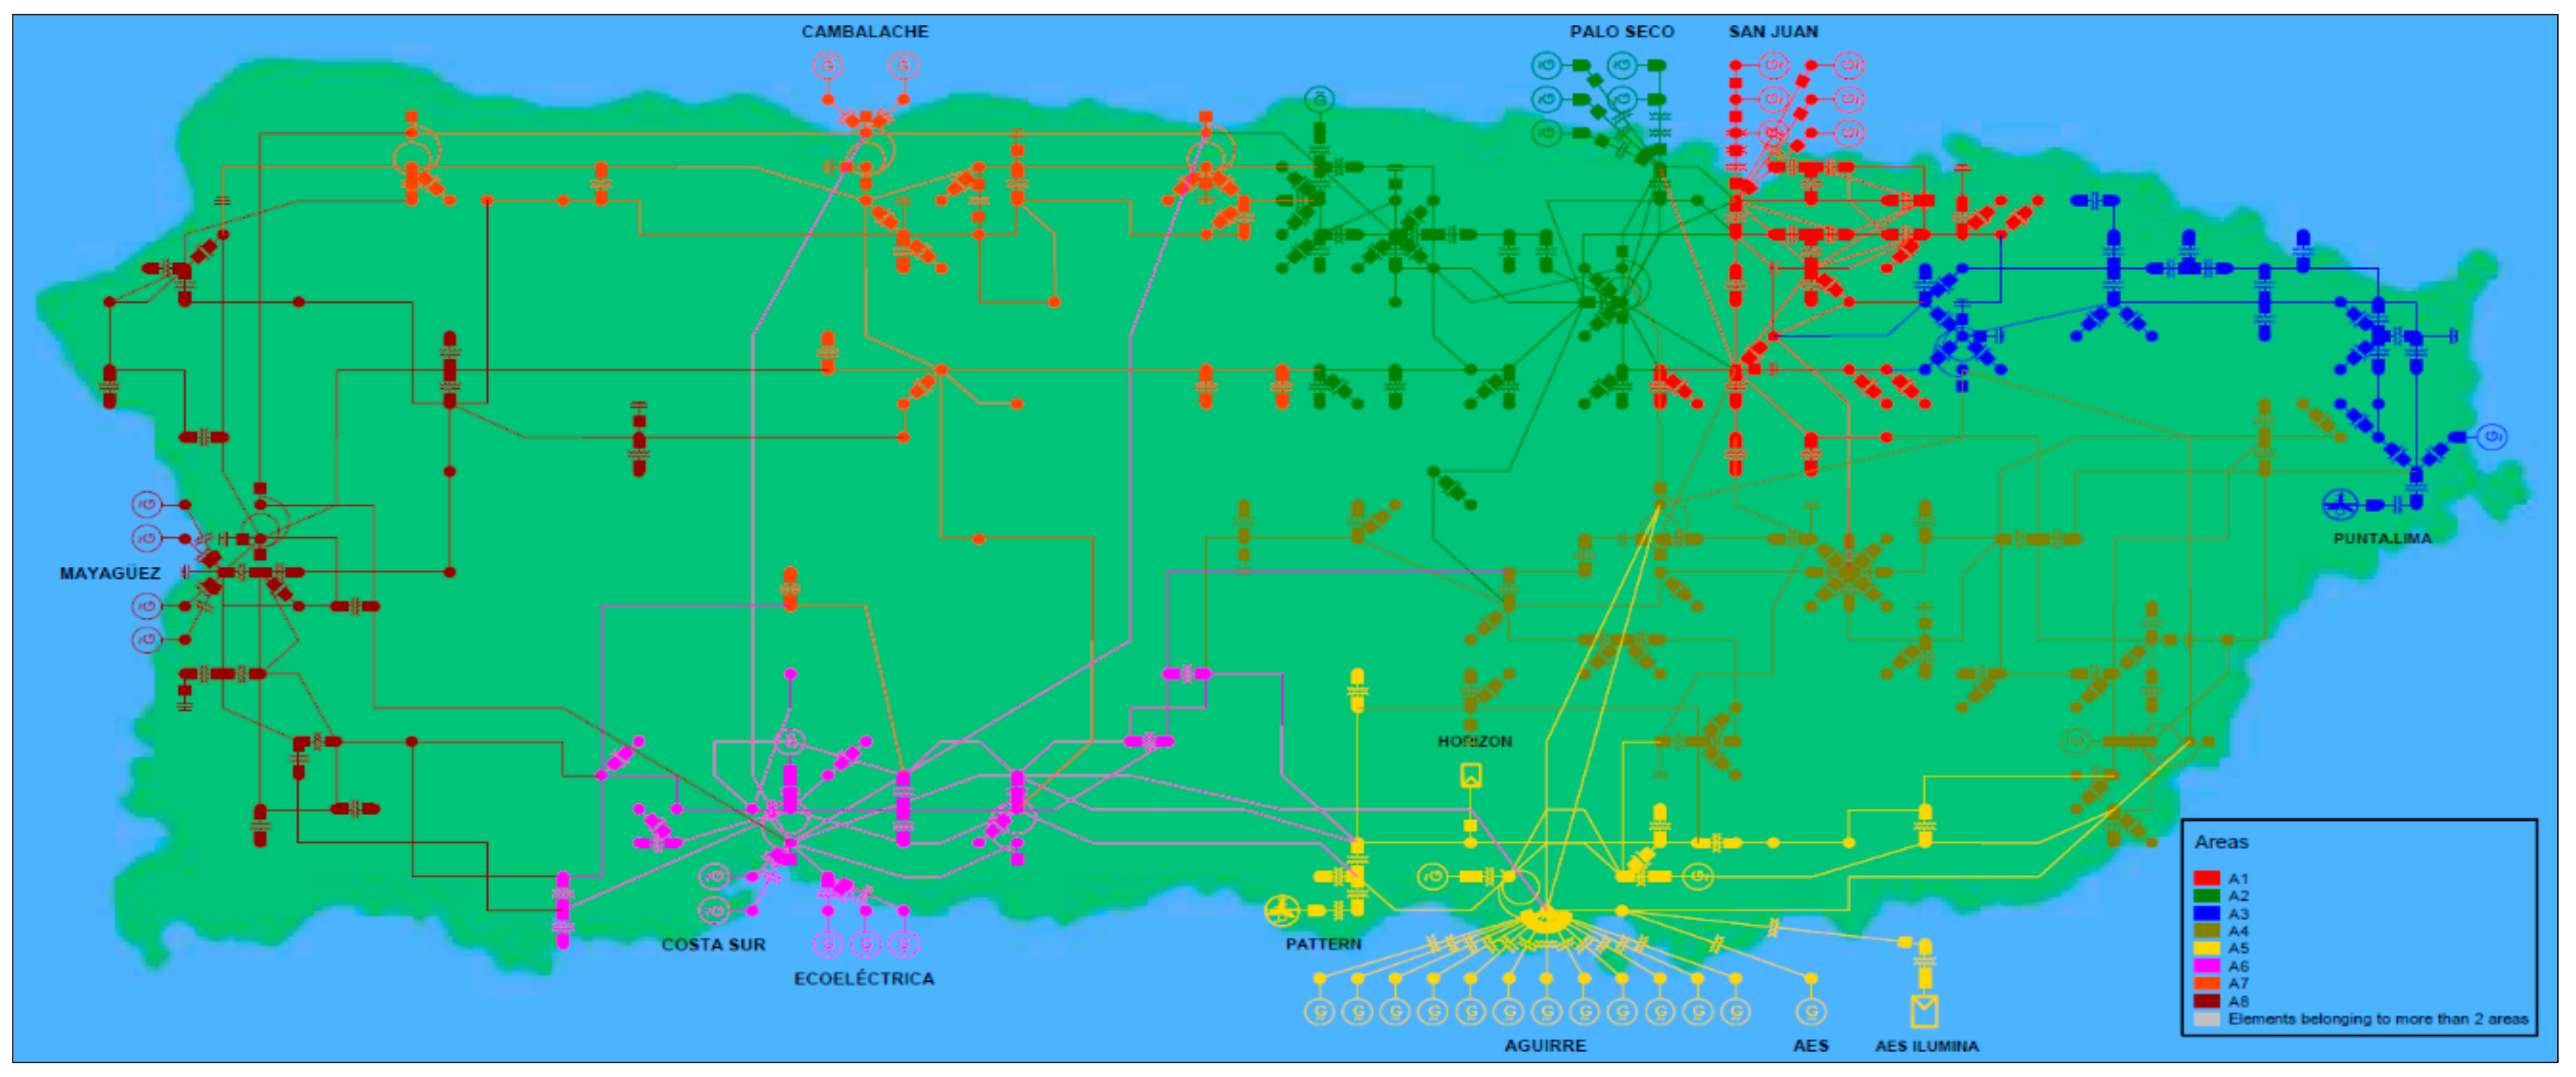
Additionally, the power system was divided into eight areas or regions, representing the actual operational divisions of PREPA. These regional divisions facilitate the analysis and presentation of overall results in this paper. The simulated power system divided by areas is shown in Figure 9. The smaller islands of Vieques and Culebra are energized through an submarine 38-kV line from Naguabo. Due to their low electricity consumption, they were not considered to simplify the simulations; however, this does not considerably affect the results.
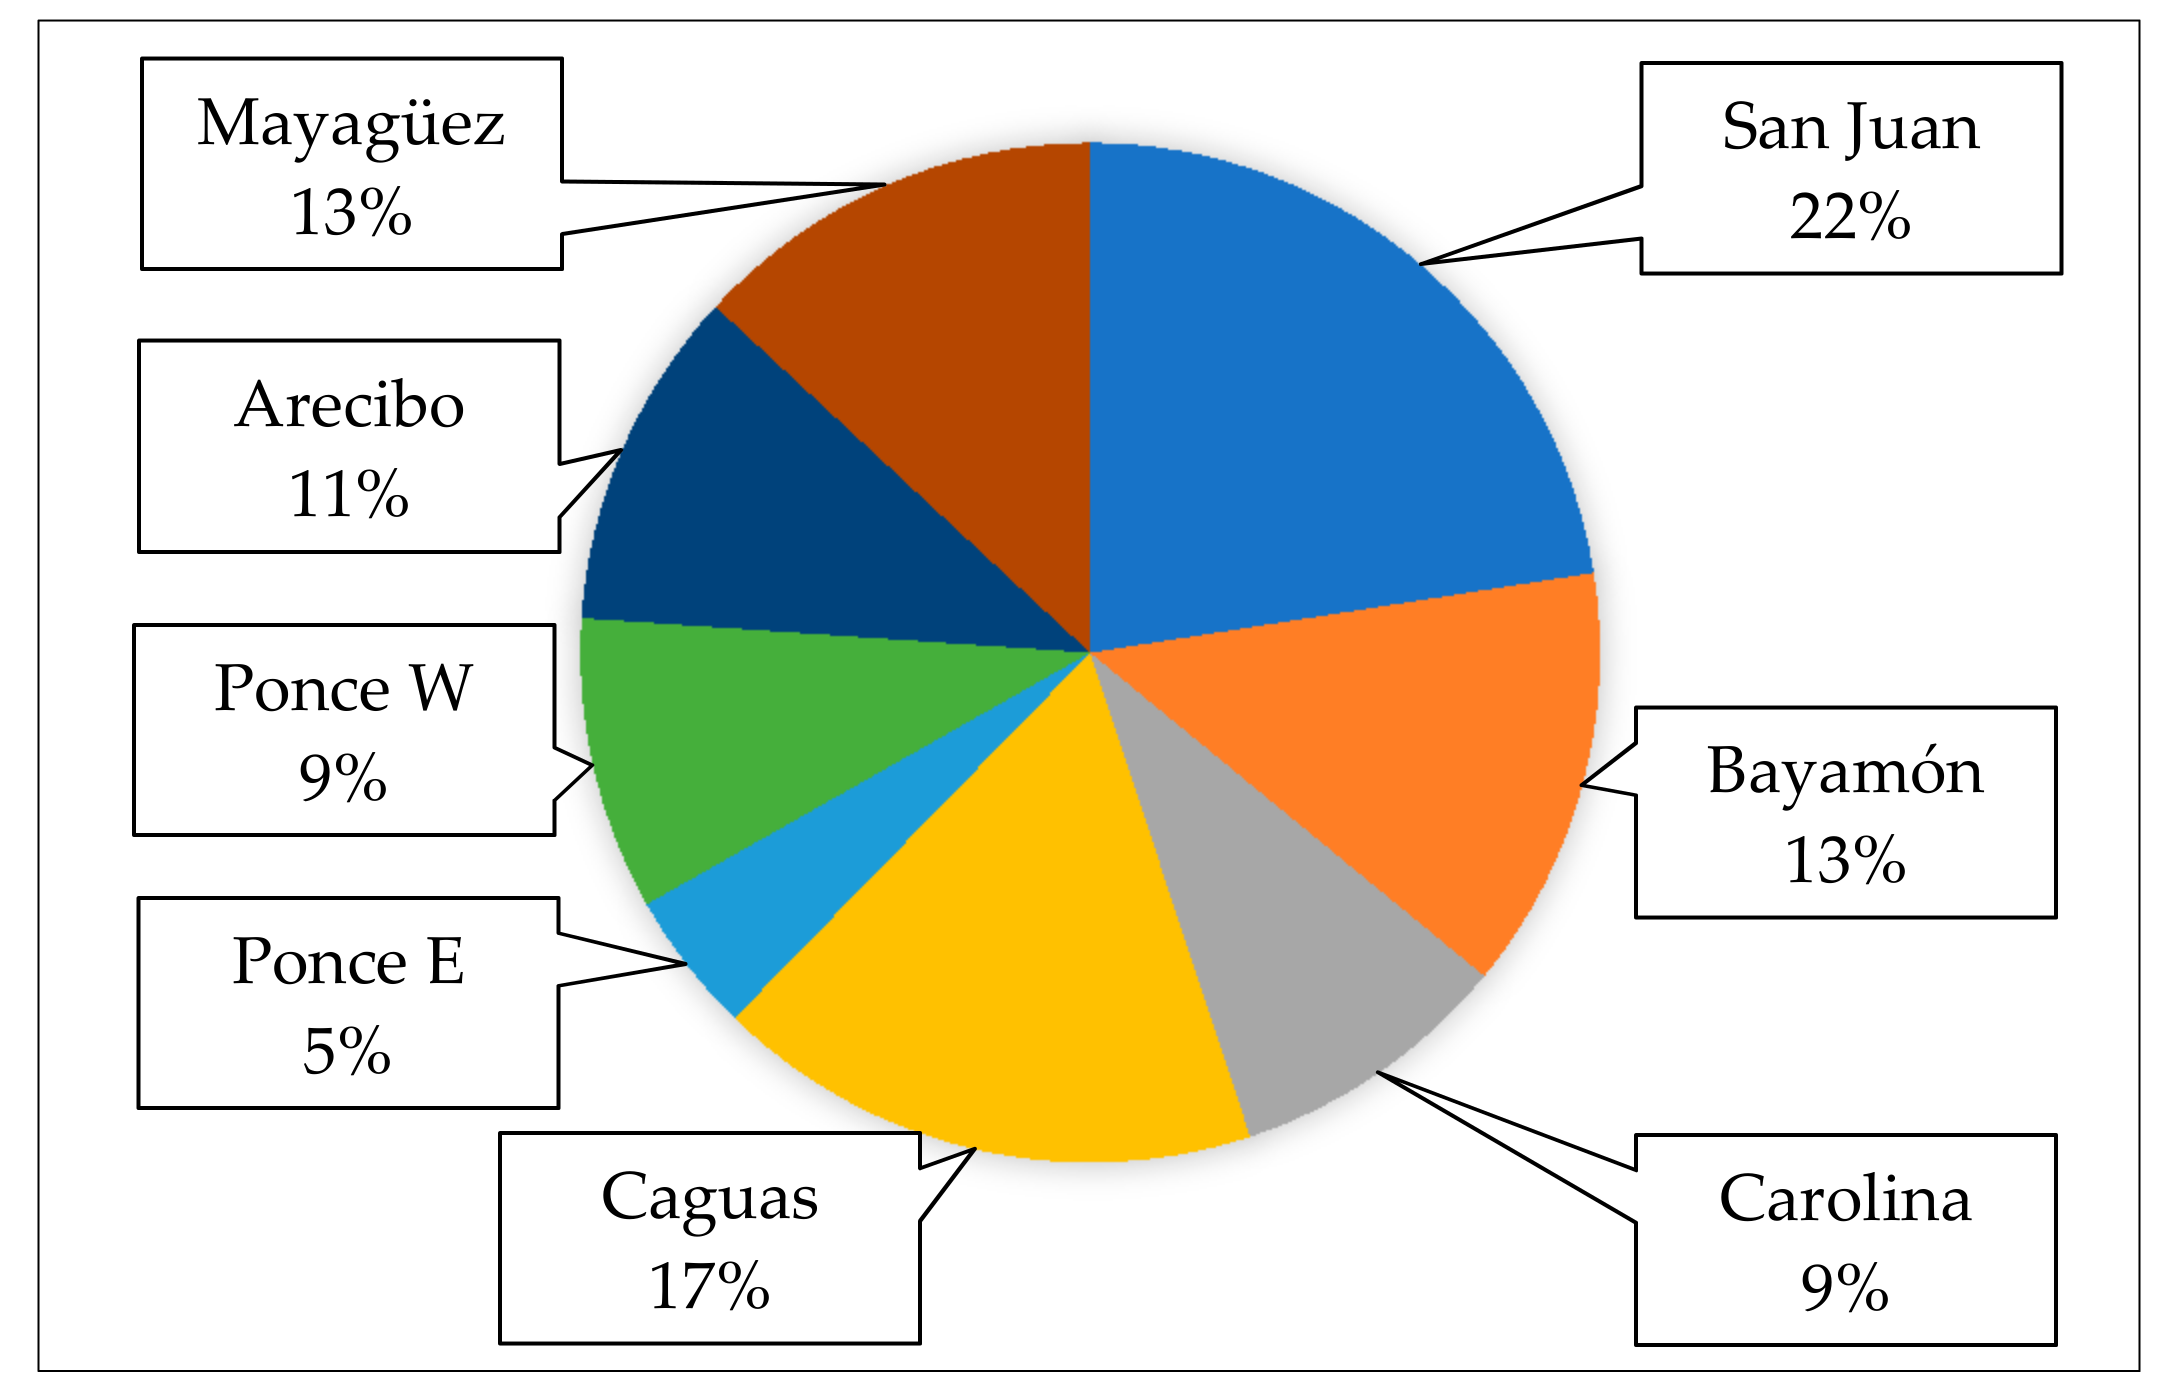
The resultant demand distribution of electricity consumption by regions is summarized in Figure 10. This graphic shows that just the San Juan region consumes almost a quarter of the total electricity demand of Puerto Rico. These percentages were used to assign the load (MW) connected to each substation, multiplying the peak load (depending on the evaluated case) times the factor calculated for each municipality. Compared to the most recent region’s demand distribution presented in [27], the distribution estimated through this work differs by 1.5% on average regarding all areas.
3.1. Validation of the Power System Model
Public data were used to simulate a typical system operation at 9 a.m., 12 p.m., and 3 p.m. to validate a base scenario of the simulated power system [27,34,50]. In order to calibrate the base scenario, the system loads and generation dispatch were adjusted to simulate usual conditions of the system. The daily peak load was calculated based on the average load factors reported by PREPA from 2010 to 2014 [34]. Then, this load factor was extrapolated, using the demand forecast of the PREPA’s 2019 IRP to obtain the 2019 peak load [27].
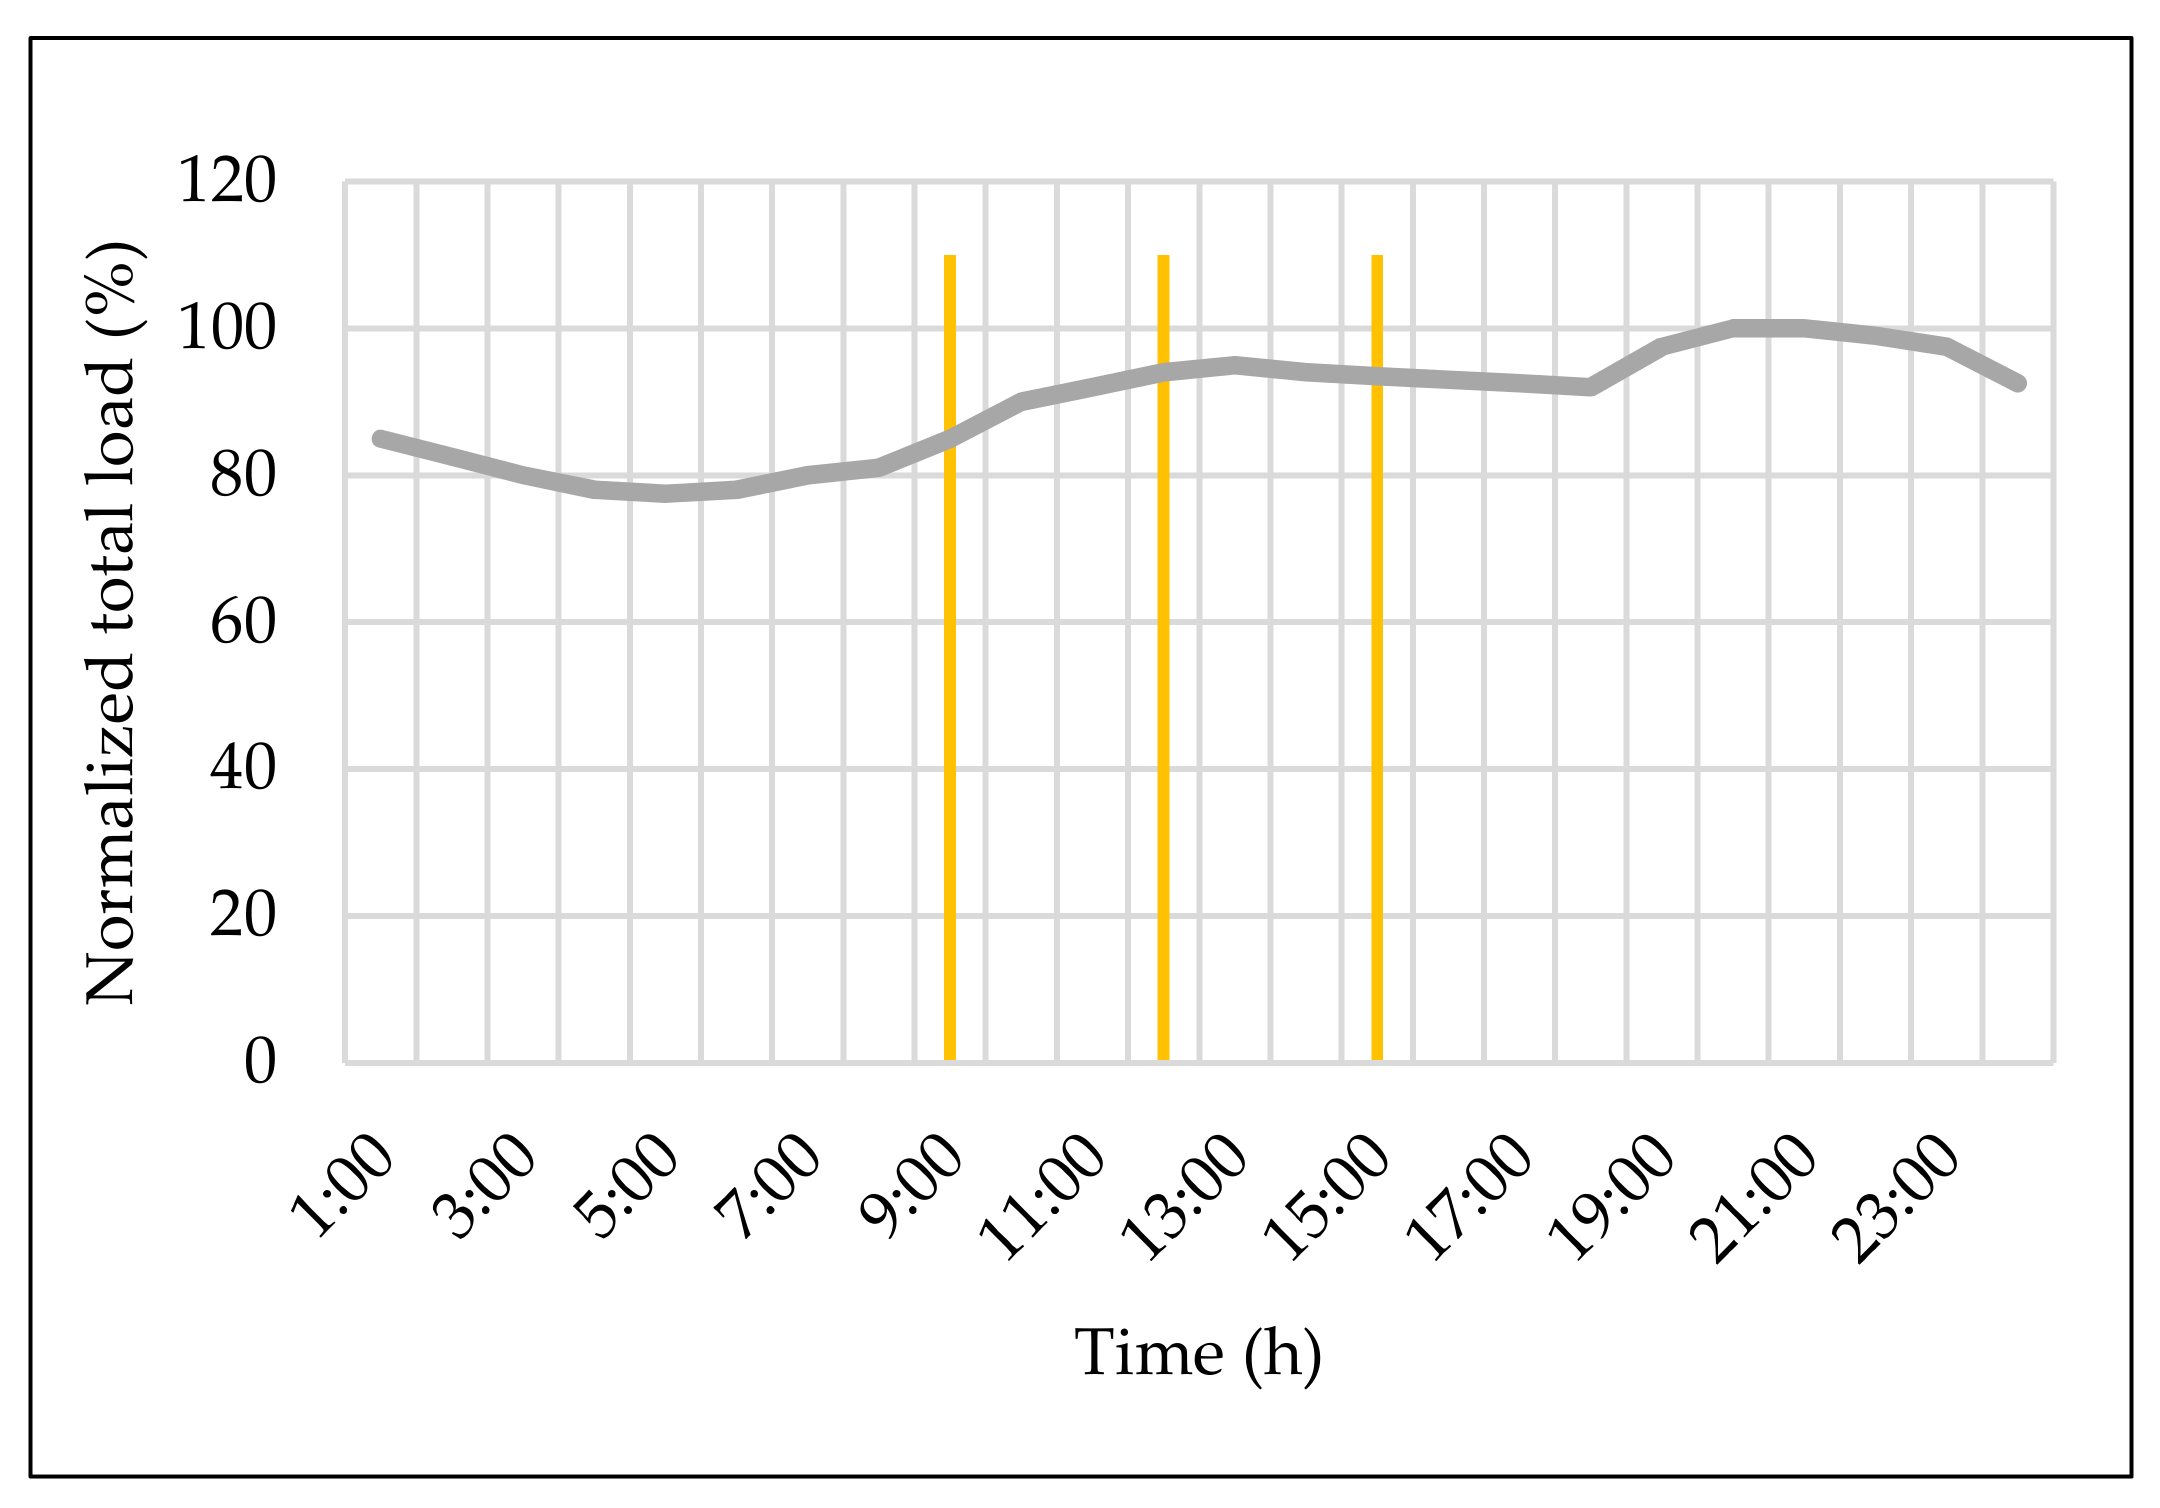
The demand forecast, used in the PREPA’s 2019 IRP, includes technical losses. In contrast, the work described in this paper did not consider technical losses in the calculated peak load because they are simulated for each electrical component. The estimated 2019 peak load was 2470.7 MW. Finally, the typical daily load profile of Puerto Rico, presented in Figure 11, was used to get the load level at 9 a.m. (2100 MW), 12 p.m. (2322 MW), and 3 p.m. (2310 MW).
For the base scenario’s validation, typical generation dispatches were used to carry out a power flow analysis and check if all electrical measurements (e.g., buses voltage, lines loading, and generating plants loading) were between acceptable security limits as occurs in regular operation [50]. The selected generation dispatches, which maintain the generation-demand balance, are shown in Table 11. In the simulation, Aguirre 1 ST generator was assigned as the slack generator that supplies as much real power and reactive power as required to maintain the generation-demand balance while keeping the voltage constant at its bus.
PV systems were set as zero power output for the validation process, representing the minimal energy currently supplied by PV-based DERs in Puerto Rico. In order to verify the model, we needed to develop a base scenario to be compared with previously validated models. This base scenario was simulated to mimic the conditions of the system more than ten years ago (when the renewable-based electricity production on the island was almost zero). In fact, the PV-based production has not greatly increased since then; it currently represents just under 5% of the total installed capacity of generation on the island. This emphasizes the need to prove the feasibility of integrating more renewable energy into the grid, especially since now there is a 100% renewable energy goal for 2050 [51].
Balanced AC power flows were executed considering automatic tap adjustment of transformers, automatic shunt adjustment, and reactive power limits. After running the power flows, results showed acceptable measurements in lines, transformers, generators, and most buses. Nevertheless, it was necessary to connect additional capacitor banks at some critical buses to obtain appropriate voltage values (0.95 p.u. < v < 1.05 p.u.). Capacitor banks were set to adjust their reactive production to support voltage regulation automatically. Table 12 shows the list of existing and added capacitor banks for base cases. These capacitor banks were considered in each one of the cases simulated through this research and represent the aggregate, estimated effect of regulating equipment already installed in Puerto Rico’s power system.
Results for the 230-kV level at noon are presented in Table 13. Similar results were observed in the other cases studied at 9 a.m. and 3 p.m. The lines AES.230—YABUCOA.230, AGUIRRE.230—A.BUENAS.230 (1 & 2), COSTA.SUR.230—CAMBALACHE.230, COSTA.SUR.230—MANATI.TC.230, and MAYAGÜEZ.230—COSTA.SUR.230 were the lines transmitting more electricity. The above represents a typical scenario because these lines are the north–south transmission lines that carry power from the major production facilities located on the south coast to the load centers in the north [25]. Furthermore, the base model developed in DIgSILENT for the transmission system was calibrated using a balanced model previously developed and validated in PowerWorld [28]. Thus, the base-case model yielded results close to actual data, and it is an appropriate representation to study the effects of high DER penetration in the combined transmission-distribution system of Puerto Rico.
3.2. Results of Potential PV Production Using the Electric Power System Model
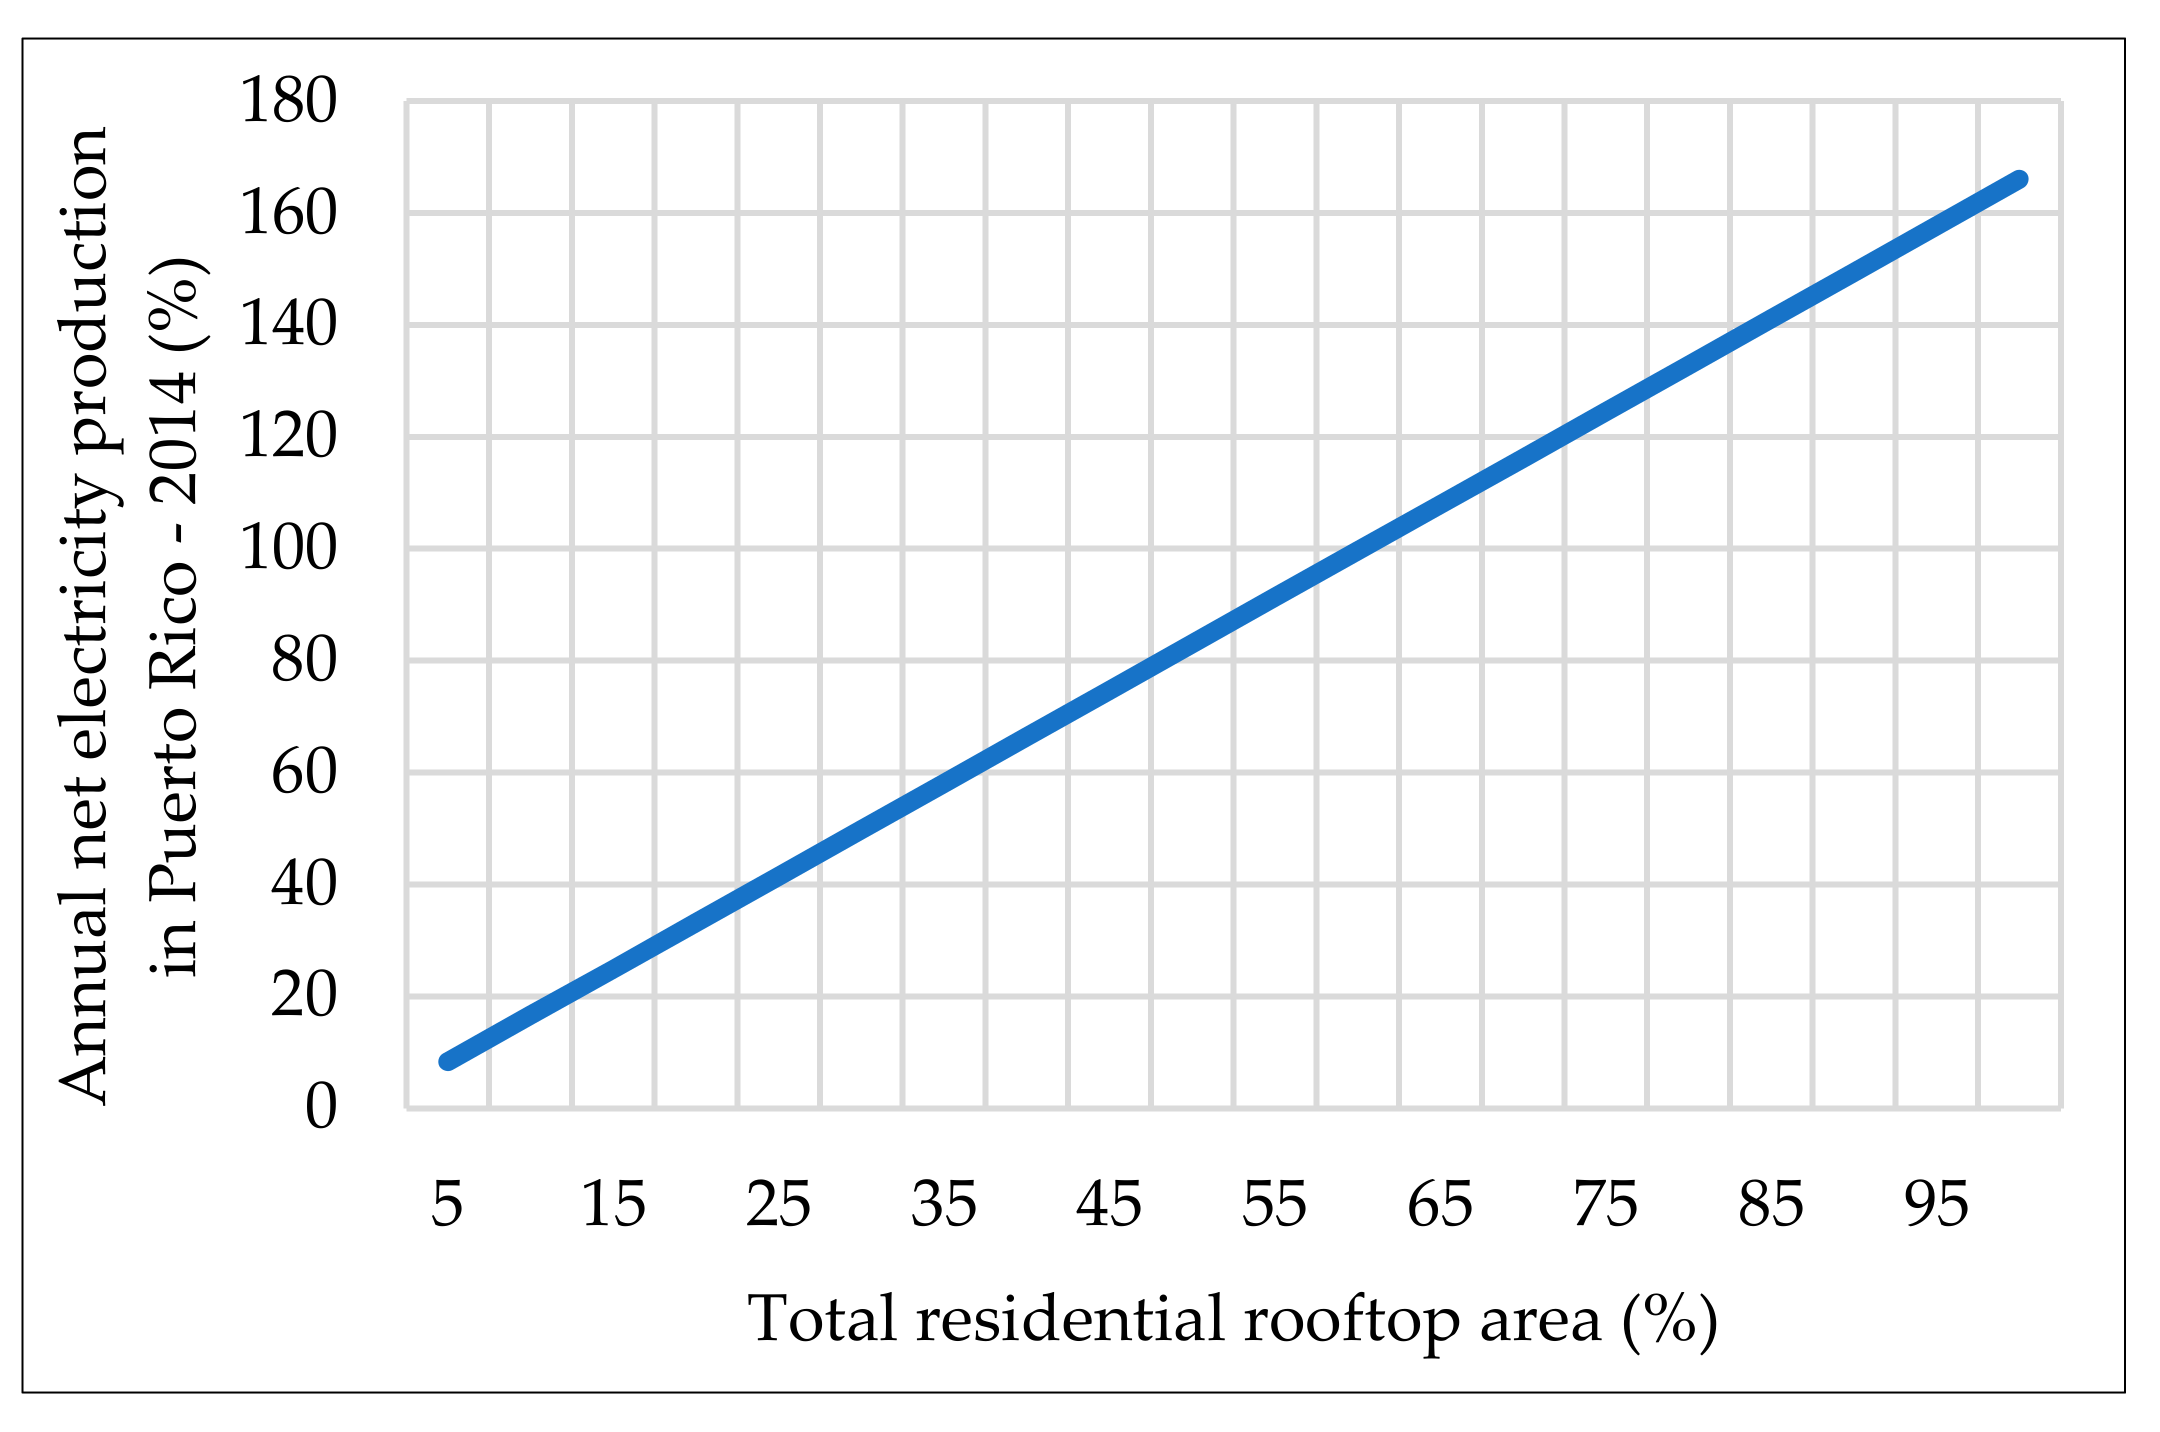
Figure 12 shows the amount of annual electricity that could be produced by PV systems installed on residential rooftop surfaces (based on the Puerto Rico annual net electric energy production in 2014 [34]). These results showed that Puerto Rico’s high insolation level is capable of displacing a large amount of conventional generation. This study, as well as another study by one of the authors completed in 2009, confirmed the availability and potential of residential rooftops to host large quantities of PV capacity and thus make a significant aggregate contribution to the archipelago’s energy mix. Finally, the potential contribution to the daily electricity generation based on PV systems installed on residential rooftops by region was calculated and is summarized in Figure 13.
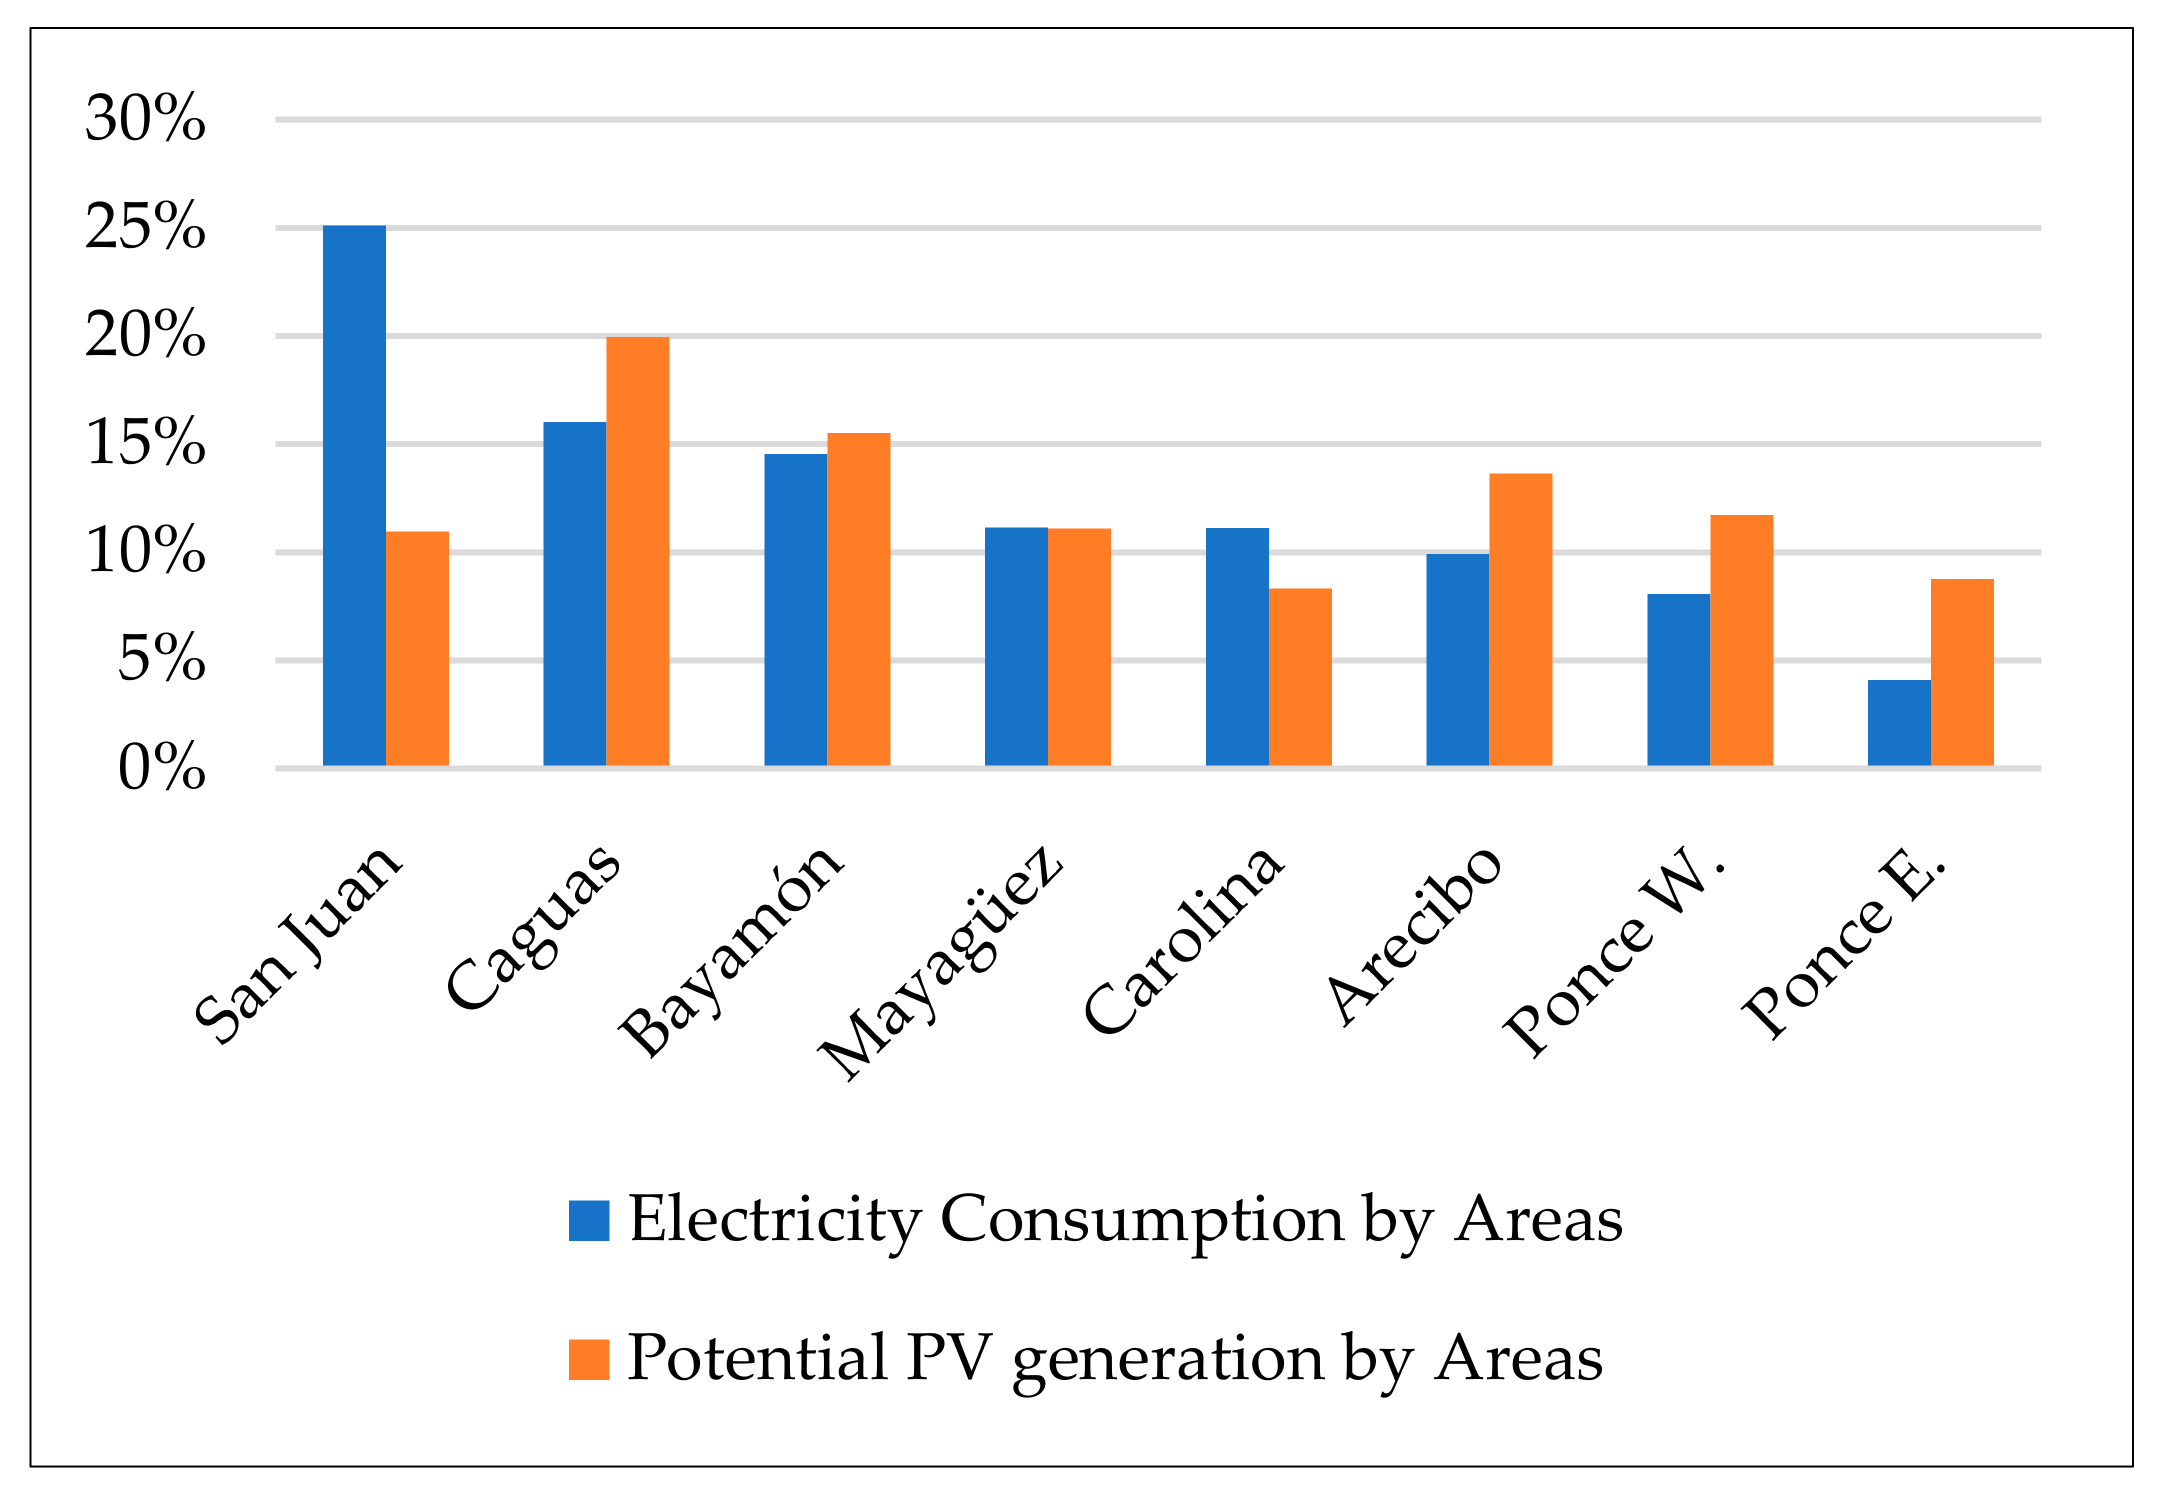
The allocation of distributed PV (DPV) systems is of particular interest in planning and operation studies. The relation between electricity consumption (as shown in Figure 10) and the potential PV production by areas (as presented in Figure 13) is shown in Figure 14. According to this graph, areas with higher energy use have a higher potential for PV generation. However, although the San Juan area consumes the highest percentage of electricity, the limited available residential-rooftop area (11% of the total available area, according to Figure 6) restricts further PV generation.
The resultant distribution of the potential PV production by municipalities in percentages obtained from this exercise was used to assign the potential installed capacity of PV projects dispersed around the island, multiplying the total PV production (depending on the level of PV penetration to be evaluated) times the factor calculated for each one of the municipalities. Then, the installed capacity calculated for each municipality was distributed among the distribution buses located in the corresponding area.
According to PREPA’s 2019 IRP, the total demand forecast in 2019 (without technical losses) is 16,162 GWh [10]. Using this value, different annual PV penetration levels and the total PV installed capacity for each case can be calculated. The evaluation of distinct renewable integration scenarios to the grid can support the ordered transition and adaptation of centralized, fossil-based existing grids towards a new electric grid that maximizes renewable and local energy use. For example, a summary of three possible cases to be studied in Puerto Rico is presented in Table 14. The total PV installed capacity was calculated considering five peak sun hours per day. This represents a capacity factor of 20%, which is a common practice for PV designers and contractors in Puerto Rico, as well planners. Even the utility, which has never been particularly supportive of renewables, accepted a 20% capacity factor for distributed PV systems in a study commissioned to Siemens on demand side resources [27].
3.3. Results of Potential PV Production for Different Times
A PV module’s nominal capacity is defined as the maximum power output under the following conditions: instant in-plane irradiance received of 1000 W/m2 and module temperature of 25 °C (these are the Standard Test Conditions, STC). A PV module’s maximum power output could be obtained from the I-V curves at the STC temperature and varying irradiance levels. These curves show that the relation between the maximum power output and irradiance is approximately linear. Therefore, the power production of PV systems could be assumed directly proportional to irradiance [52].
To calculate the PV production at a specific time, the total PV installed capacity in municipalities, calculated and described in Section 3.2, was multiplied by the irradiance factor depending on the case (irradiance that were determined through the process described in Section 2.6). For example, PV systems located in the San Juan area could represent 11% of the total PV installed capacity in Puerto Rico (Figure 13). In sunny conditions at 9 a.m., San Juan area could receive 525 Wh/m2 of irradiance; this means that PV systems could inject 52.5% of their installed capacity (considering STC conditions). Then, PV systems installed in the San Juan area, considering 20% of PV penetration (1771 MW of the total installed capacity in Puerto Rico and about 194 MW of total installed capacity in San Juan), would generate about 102 MW in sunny conditions at 9 a.m. when it receives 525 Wh/m2.
Results of the exercise above is presented in Table 15, which contains the PV generation for other times and areas regarding a 20% PV penetration scenario. PV production in Puerto Rico’s areas calculated for 30 and 40% scenarios at different times are shown in Table 16 and Table 17. These results could be used to study diverse PV distributions in each area and to analyze their impacts on the regular operation of the Puerto Rico power system. PV allocation is a critical factor in determining the corrective actions required for the existing infrastructure to reduce operational risks. In the same way, various system operation strategies, that support a well-organized transition to a more fossil-independent system, could be initially implemented, encouraging the DER integration, while the existing infrastructure transformation is planned and conducted.
4. Discussion
The process to build a comprehensive power system model not only considering technical data, but also social data was presented. The main objective is to attain a more integrative planning perspective for electric energy transitions. This work is applicable in locations where system data are not available, either because the utility does not cooperate with outside stakeholders, or because there are limited planning resources. For such instances, this paper presents a roadmap that can facilitate the planning work of diverse groups working towards an increased use of renewable energy.
As a case study that used the proposed integrative perspective, the generation, transmission, and distribution systems of Puerto Rico were modeled, yielding a powerful tool for evaluating DER effects on the regular operation of the electrical grid. It was necessary to do an exhaustive search about existing and available conventional generators, existing transmission lines, distribution lines, and transformers to model the whole system. A typical distribution feeder design, at either 13.2 or 8.32 kV, representing almost half of the circuit miles operating at the distribution system, was used to consider the interplay between the transmission and the distribution systems. This assumption was made considering that previous studies have identified voltages over 4.16 kV as most suitable for PV integration in Puerto Rico. Thus, the distribution part of a model to study the impacts of DERs on the bulk system operation should be mainly based on those feeders most likely to host large quantities of distributed PV. In total, 234 transformer substations and 4401 lines were modeled, simulating the power system as realistically as possible.
Undoubtedly, the lack of public information was the main challenge for the study of the entire system, primarily to represent the demand connected to each substation. Historical consumption data reported by the power system operator, municipal information, census data, socio-economic indicators, and planning information from the state government were considered to calculate an approximate distribution of the total energy demand among the substations. Additionally, the validation process was carried out through a power flow analysis using typical generation dispatches, the average daily energy demand at three different times, and the load distribution. Balanced AC power flows were executed to check if all electrical parameters (e.g., bus voltage, lines loading, and generating plants loading) were between acceptable security limits. In the same way, the model yielded results close to data corroborated in a previous (simpler) study, confirming the model’s validity because of the approximation of the power flow’s results with the actual system operation.
This work proved that Puerto Rico’s high insolation level could displace a large amount of conventional generation. Results showed that the annual net electricity generation in Puerto Rico could be produced by 60% of PV systems installed on residential rooftop surfaces (based on the Puerto Rico annual net electric energy production in 2014 [34]). There are other technical and social considerations needed to be addressed to fulfill that 60%; however, estimates show the potential of rooftop PV and serve as motivation to continue working towards an increased use of distributed PV. Furthermore, the contribution to the daily electricity generation based on PV systems installed on residential rooftops by region was calculated and presented in this work. The east-central area is the region that can generate the highest amount of electricity. However, all municipalities on the island can likewise participate in the transition of the existing fossil-dependent generation to a more diverse fuel portfolio, including renewable energy resources distributed close to demand centers.
Results of the potential PV production by areas at different times, based on irradiance information, daily weather data, and the available residential rooftop area, were presented in this work. This information shows that considering a 30% PV penetration scenario at noon on a sunny day, the electricity production by PV systems can reach almost the 2019 estimated daily peak (2470.7 MW). Even though this scenario can represent a challenge due to the existing low-inertia power plants in Puerto Rico, the design and application of strategies to take advantage of the significant amount of PV production during the day could support the grid’s transition. For example, the installation of storage and demand response programs could efficiently address the PV curtailment resulting from the existing system’s constraints. Additionally, these results could be used to study the optimal allocation of PV systems in each area and to evaluate their effects on the regular operation of the Puerto Rico power system. For instance, preliminary results of an ongoing study indicate that fewer alterations of the steady-state magnitudes occur with more distributed PV systems connected to a higher voltage level. Finally, by connecting the rooftop PV systems at 13.2 or 8.32 kV, the model will not have most of the technical difficulties previously identified for 4.16 kV feeders in Puerto Rico (such as problems with voltage regulators).
The novelty of this work is the focus on integrating social aspects to a comprehensive engineering modeling effort and the method itself applied on a case study. Electric power systems can produce both social justices and injustices, depending on a diversity of social and technology factors. Thus, a transition to a renewable-based power must be supported by appropriate physical and social infrastructures [23]. To achieve that, a balanced analysis of advantages and disadvantages must be completed. Some of the key issues that must be discussed: length and phases of the transition toward renewables; options of energy resources and technologies; positive/negative impacts; potential strategies and actions; funding sources; among others [23]. The comprehensive power system model presented in the paper, which was created using socio-economic data, would be a critical tool in the analysis and discussion among energy stakeholders with diverse backgrounds. Furthermore, low-inertia systems such as those in islanded or remote locations have an even more critical need to determine and analyze the social and technical consequences of integrating more renewable energy into their conventional grids. The reason being the high electricity costs usually found on those locations, and the need to move to cheaper and more resilient options. The process and integrative perspective used in this work could be adapted to those remote contexts, using as a guide the case study presented.
The method’s applicability goes beyond the specific case study of Puerto Rico. This work broadens the typical power system modeling to include planning and social considerations. The method used in this paper allows for interdisciplinary teams to work in the development of a model as part of broader design goals for a renewable-dominant energy system. For example, the identification of data sets is a critical interdisciplinary task since the socio-economic factors guide the power system modeling. The description of tools provided in the method would also help interdisciplinary teams discuss and select the specific analysis and design tools (these include spreadsheets, engineering reports, power system data, and simulation software, among others). The process followed in this work could also guide future research requiring models of the existing power systems under similar conditions and analyzing DER impacts (especially PV systems) on grid operation.
5. Conclusions
The paper shows the integrative/holistic process in building a model of a power system for the study of high penetration of distributed PV. Planning and social considerations are included in creating a realistic demand profile from census data and socio-economic sectors indicators. Although obtaining most data to model the entire system was a difficult task, public sources, reasonable assumptions considering historical data, and previous studies were used in order to get the best results possible. Furthermore, residential rooftop areas were selected as a feasible design option for PV system without occupying limited land resources. This selection aligns with the social and environmental preferences of most citizens in Puerto Rico. Finally, PV systems’ potential electricity production installed on rooftops was calculated using residential rooftop area data and the insolation obtained for municipalities.
Results showed that Puerto Rico and other tropical and subtropical islands have an excellent opportunity to increase renewable energy, especially distributed energy resources close to demand centers. DPV systems can also improve the response during emergencies by enabling the power system to be divided into mini regions that use local energy resources. The methodology presented in this paper can assist in analyzing the effects of the potential DPV systems production and suggesting power grid designs that mitigate DPV impacts on bulk power systems in remote and islanded systems. The model can also be used to study the interplay of transmission and distribution systems in order to design topologies that maximize the use of distributed and renewable energy sources. Studying this interplay is vital for an energy transition to achieve a balance between the large-scale transmission network and the smaller scale distribution systems with a high penetration of renewables.
The integrative engineering-social perspective in developing the model and the actions to manage data limitations are aspects that could be followed by others seeking a more holistic view of power infrastructure analysis. This integrative work is of particular importance and applicability in locations with aggressive renewable energy goals (e.g., 50 or 100% renewable energy), and where utility data are not readily available. The case study of Puerto Rico shows the capabilities of the method, while the distributed PV results present lessons for islanded and remote, rural systems with low inertia. On the other hand, a model like this one can be used to study the new role of large generators in supporting an increased use of distributed energy resources, and in some cases, a transition to a renewable-dominated power system. Tropical and subtropical regions of the world will find this paper useful, since most likely those places have similar insolation levels as the case study presented. Literature on the integration of renewable energy to the grid is dominated by studies of regions within large, interconnected power systems. However, comprehensive engineering work with social considerations that is related to isolated/islanded and remote locations is very limited. Thus, the comprehensive power system model and the method to produce it will also benefit electric energy planning on islanded and remote locations.
Finally, as future work, the model will be used by engineers and social scientists in crafting and analyzing plausible scenarios of renewable energy integration in a low-inertia power system. The holistic transmission-distribution model presented in this paper can also be used to address the challenges related to the electrification of transportation. Electric vehicles are expected to increase the energy use (load) at the distribution level, thus effective, integrated transmission-distribution models are needed. Through those integrated studies, electricity would be enabling a sustainable energy transition at all levels: generation, transmission, distribution, and load.
Author Contributions
Conceptualization, G.C.-P. and E.O.-C.; Methodology, G.C.-P.; Software, G.C.-P.; Validation, G.C.-P. and E.O.-C.; Formal analysis, G.C.-P.; Investigation, G.C.-P.; Resources, E.O.-C.; Data curation, G.C.-P.; Writing—original draft preparation, G.C.-P.; Writing—review and editing, E.O.-C.; Supervision, E.O.-C.; Project administration, E.O.-C.; Funding acquisition, E.O.-C. All authors have read and agreed to the published version of the manuscript.
Funding
This research was funded by the U.S. Department of Energy, grant number DE-SC0020281.
Data Availability Statement
Not applicable.
Acknowledgments
The authors thank Carlos Reyes, President & General Manager, EcoEléctrica, L.P., for access to part of the data used in this paper and for helpful comments. Special acknowledgments to Armando Figueroa-Acevedo for his essential contributions in the development of the Puerto Rico power system model.
Conflicts of Interest
The authors declare no conflict of interest.
Nomenclature
| ARRA | Available Residential Rooftop Area (m2) |
| BPS | Bulk power system |
| DAI | Daily Average Irradiance per year (kWh/m2/day) |
| DER | Distributed energy resources |
| DPEI | Daily Potential Energy obtained by Insolation on the terrestrial surface (kWh/day) |
| DPEP | Daily Potential Electricity Production by PV systems (kWh/day) |
| DPV | Distributed PV |
| GT | Gas turbine |
| IRP | Integrated Resource Plan |
| NREL | National Renewable Energy Laboratory |
| PREPA | Puerto Rico Electric Power Authority |
| PV | Photovoltaic |
| SAM | System Advisory Model |
| ST | Steam turbine |
| STC | Standard testing conditions |
| TC | Transmission center |
| TC | Operating PV module temperature (°C) |
| TCη | Temperature coefficient (%/°C) |
| TN | Operating PV module at Standard Test Conditions (25 °C) |
| ηinv | Inverter efficiency |
| ηloss | Efficiency for losses |
| ηrated | PV module efficiency |
References
- O’Neill-Carrillo, E.; Irizarry-Rivera, A.; Ortiz, C.; Pérez-Lugo, M. The Role of Engineers as Policy Entrepreneurs toward Energy Transformations. In Proceedings of the ASEE 123rd Annual Conference, New Orleans, LA, USA, 26–29 June 2016. [Google Scholar]
- Jans, L.; Bouman, T.; Fielding, K. A Part of the Energy\“In Crowd\”: Changing People’s Energy Behavior via Group-Based Approaches. IEEE Power Energy Mag. 2018, 16, 35–41. [Google Scholar] [CrossRef]
- O’Neill-Carrillo, E.; Mercado, E.; Luhring, O.; Jordan, I.; Irizarry-Rivera, A. Community Energy Projects in the Caribbean: Advancing Socio-Economic Development and Energy Transitions. IEEE Technol. Soc. Mag. 2019, 38, 44–55. [Google Scholar] [CrossRef]
- Kuleta, G. How Resilient Is the Caribbean Basin’s Energy Sector? Energy Advis. (Lat. Am. Advis.) 2017, 1, 6. [Google Scholar]
- Irizarry Rivera, A.A.; Colucci-Ríos, J.A.; O’Neill-Carrillo, E. Achievable Renewable Energy Targets for Puerto Rico’s Renewable Energy Portfolio Standard; Puerto Rico State Energy Office: Mayagüez, PR, USA, 2009. [Google Scholar]
- Figueroa-Acevedo, A.L. Power System Operational Reserves Requirements with Significant Renewable Generation in Puerto Rico. Master’s Thesis, University of Puerto Rico-Mayagüez, Mayagüez, PR, USA, 2013. [Google Scholar]
- Sauer, P.; Pai, M.A. Power System Dynamics and Stability, 1st ed.; Prentice Hall: Saddle River, NJ, USA, 1997. [Google Scholar]
- Venkatraman, R.; Khaitan, S.K.; Ajjarapu, V. A combined transmission-distribution system dynamic model with grid-connected DG inverter. In Proceedings of the 2017 IEEE Power & Energy Society General Meeting, Chicago, IL, USA, 16–20 July 2017; pp. 1–5. [Google Scholar]
- Palmintier, B.; Hale, E.; Hodge, B.M.; Baker, K.; Hansen, T.M. Experiences integrating transmission and distribution simulations for DERs with the Integrated Grid Modeling System (IGMS). In Proceedings of the 2016 Power Systems Computation Conference (PSCC), Genoa, Italy, 20–24 June 2016; pp. 1–7. [Google Scholar]
- Aristidou, P.; Van Cutsem, T. Dynamic Simulations of Combined Transmission and Distribution Systems using Decomposition and Localization. In Proceedings of the IEEE PES PowerTech Conference, Grenoble, France, 16–20 June 2013; pp. 1–6. [Google Scholar]
- Jain, H.; Rahimi, K.; Tbaileh, A.; Robert, P.; Tech, V. Integrated Transmission & Distribution System Modeling and Analysis: Need & Advantages. In Proceedings of the 2016 IEEE Power and Energy Society General Meeting (PESGM), Boston, MA, USA, 17–21 July 2016; pp. 1–5. [Google Scholar]
- Lew, D.; Asano, M.; Boemer, J.; Colton, C.; Focken, U.; Hydzik, R.; Motley, A. The Power of Small: The Effects of Distributed Energy Resources on System Reliability. IEEE Power Energy Mag. 2017, 15, 50–60. [Google Scholar] [CrossRef]
- Western Electricity Coordinating Council Modeling and Validation Work Group. WECC Solar Plant Dynamic Modeling Guidelines; Western Electricity Coordinating Council: Salt Lake City, UT, USA, 2014. [Google Scholar]
- Jiang, Y.; Zang, M.; Li, S. Model Reduction for Fast Assessment of Grid Impact of High Penetration PV. In Proceedings of the 19th International Conference on Intelligent System Application to Power Systems (ISAP), San Antonio, TX, USA, 17–20 September 2017; pp. 1–6. [Google Scholar]
- Lammert, G.; Yamashita, K.; Pabón Ospina, L.D.; Renner, H.; Martínez Villanueva, S.; Pourbeik, P.; Ciausiu, F.-E.; Braun, M. Modelling and dynamic performance of inverter based generation in power system studies: An international questionnaire survey. In Proceedings of the 24th International Conference & Exhibition on Electricity Distribution (CIRED), Glasgow, Scotland, 12–15 June 2017. [Google Scholar]
- Zhao, W.; Shi, X.; Guo, Q.; Sun, H.; Xu, F.; Li, Z.; Niu, T.; Wang, B. Voltage security analysis with high PVs penetration considering the interaction of transmission and distribution grids: Case studies. In Proceedings of the IEEE PES Asia-Pacific Power and Energy Energy Engineering Conference (APPEEC), Brisbane, Australia, 15–18 November 2015; pp. 1–5. [Google Scholar]
- Konishi, R.; Takenobu, Y.; Takahashi, M.; Hayashi, Y. Optimal allocation of photovoltaic systems and energy storage systems considering constraints of both transmission and distribution systems. In Proceedings of the IEEE Power and Energy Society Innovative Smart Grid Technologies Conference, Washington, DC, USA, 23–26 April 2017; pp. 1–5. [Google Scholar]
- Santos-Martin, D.; Lemon, S.; Watson, J.D.; Wood, A.R.; Miller, A.J.V.; Watson, N.R. Impact of solar photovoltaics on the low-voltage distribution network in New Zealand. IET Gener. Transm. Distrib. 2016, 10, 1–9. [Google Scholar]
- Distributed Energy Resources Task Force. Technical Report: Distributed Energy Resources: Connection Modeling and Reliability Considerations; North American Electrical Reliability Corporation: Atlanta, GA, USA, 2017. [Google Scholar]
- Montenegro, D.; Bello, M.; York, B.; Smith, J. Utilising observability analysis to cluster smart inverters on secondary circuits for residential deployment. CIRED-Open Access Proc. J. 2017, 2017, 2572–2575. [Google Scholar] [CrossRef] [Green Version]
- Smith, J.W.; Dugan, R.; Sunderman, W. Distribution modeling and analysis of high penetration PV. In Proceedings of the IEEE Power and Energy Society General Meeting, Detroit, MI, USA, 24–28 July 2011; pp. 1–7. [Google Scholar]
- Van Cutsem, T.; Milanović, J. Contribution to Bulk System Control and Stability by Distributed Energy Resources Connected at Distribution Network; Report PES-TR22; IEEE Power & Energy Society: Piscataway, NJ, USA, 2017. [Google Scholar]
- O’Neill-Carrillo, E.; Rivera-Quiñones, M.A. Energy Policies in Puerto Rico and their Impact on the Likelihood of a Resilient and Sustainable Electric Power Infrastructure. Cent. J. 2018, 30, 147–171. [Google Scholar]
- Newlun, C.J.; Currie, F.M.; O’Neill-Carrillo, E.; Aponte Bezares, E.; Byrne, R.H. Energy Resource Planning for Puerto Rico’s Future Electrical System. In Proceedings of the IEEE PES T&D Conference and Exposition, Chicago, IL, USA, 12–15 October 2020. [Google Scholar]
- URS Corporation. Fortieth Annual Report on the Electric Property of the Puerto Rico Electric Power Authority; URS Corporation: San Juan, PR, USA, 2013. [Google Scholar]
- Oficina Estatal de Política Pública Energética de Puerto Rico. Estado de Situación Energética del País Informe Anual 2014; Portal Oficial del Gobierno de Puerto Rico: San Juan, PR, USA, 2014. [Google Scholar]
- Siemens Industry. Puerto Rico Integrated Resource Plan 2018–2019; Siemens PTI Report Number: RPT-015-19; Siemens Industry: Schenectady, NY, USA, 2019. [Google Scholar]
- Martinez Navedo, T. Voltage Stability Assessment of an Island Power System as a Function of Load Model. Master’s Thesis, University of Puerto Rico-Mayagüez, Mayagüez, PR, USA, 2003. [Google Scholar]
- Negociado de Energía de Puerto Rico-Sistema de Transmisión de la AEE. Available online: https://energia.pr.gov/portfolio-item/transmision/ (accessed on 7 June 2021).
- Área de Tecnologías de Información-PREPA Infrastructure. Available online: https://gis.pr.gov/descargaGeodatos/Infraestructuras/Pages/Electricidad.aspx (accessed on 7 June 2021).
- Puerto Rico Electric Power Authority. 2019 Fiscal Plan for the Puerto Rico Electric Power Authority; Puerto Rico Electric Power Authority: San Juan, PR, USA, 2019. [Google Scholar]
- Irizarry-Silvestrini, M.F. Evaluation of Photovoltaic Distributed Generation on the Voltage Profile of Distribution Feeders. Master’s Thesis, University of Puerto Rico-Mayagüez, Mayagüez, PR, USA, 2011. [Google Scholar]
- Lopez, N. Voltage Regulation and Reactive Power Services from Rooftop Photovoltaic Systems for Distributed Generation Rates. Master’s Thesis, University of Puerto Rico-Mayagüez, Mayagüez, PR, USA, 2017. [Google Scholar]
- Producción y Consumo de Energía Eléctrica en Puerto Rico. Available online: https://estadisticas.pr/en/inventario-de-estadisticas/produccion_consumo_energia_elec (accessed on 1 June 2021).
- Al-Alawi, S.M.; Islam, S.M. Principles of electricity demand forecasting. Part 1: Methodologies. Power Eng. J. 1996, 10, 139–143. [Google Scholar] [CrossRef]
- United States Census Bureau—Population Division. Annual Estimates of the Resident Population for Puerto Rico Municipalities: 1 April 2010 to 1 July 2017 (PRM-EST2017-ANNRES); U.S. Department of Commerce: Washington, DC, USA, 2018.
- Industrial Composition by Municipalities. Available online: https://estadisticas.pr/en/inventario-de-estadisticas/composicion-industrial-por-municipios (accessed on 1 June 2021).
- Censo de Industrias Manufactureras en Puerto Rico. Available online: https://estadisticas.pr/index.php/en/inventario-de-estadisticas/censo-de-industrias-manufactureras-en-puerto-rico (accessed on 1 June 2021).
- Municipal Public Lighting Per Square Mile in Puerto Rico. Available online: http://energia.pr.gov/datos/luminaria/ (accessed on 15 July 2019).
- US Department of Agriculture (USDA). Census of Agriculture 2012—Puerto Rico; National Agricultural Statistics Service: Washington, DC, USA, 2012.
- Total Municipal Electricity Consumption Per Square Mile in Puerto Rico. Available online: http://energia.pr.gov/datos/consumo-total-area/ (accessed on 15 July 2019).
- United States Census Bureau. 2013–2017 American Community Survey 5-Year Estimates—Housing Characteristics; U.S. Department of Commerce: Washington, DC, USA, 2019.
- National Renewable Energy Laboratory—System Advisory Model (SAM). Available online: https://sam.nrel.gov/ (accessed on 1 June 2021).
- Santiago, S. Review of System Design and Sizing Tools. In Practical Handbook of Photovoltaics: Fundamentals and Applications; Agustin, M., Tom, M., Luis, C., Eds.; Elsevier Inc.: Amsterdam, The Netherlands, 2012. [Google Scholar]
- Luque, A.; Hegedus, S. Handbook of Photovoltaic Science and Engineering; Wiley: Wileyoboken, NJ, USA, 2003. [Google Scholar]
- National Renewable Energy Laboratory—National Solar Radiation Data Base. Available online: https://rredc.nrel.gov/solar/old_data/nsrdb/1991-%0A2010/hourly/list_by_state.html (accessed on 6 October 2019).
- Iqbal, M. An Introduction to Solar Radiation; Elsevier Inc.: New York City, NY, USA, 1983. [Google Scholar]
- Kang, B.O.; Tam, K.-S. A new characterization and classification method for daily sky conditions based on ground-based solar irradiance measurement data. Sol. Energy 2013, 94, 102–118. [Google Scholar] [CrossRef]
- Sung, T.; Yoon, S.Y.; Kim, K.C. A Mathematical Model of Hourly Solar Radiation in Varying Weather Conditions for a Dynamic Simulation of the Solar Organic Rankine Cycle. Energies 2015, 6, 7058–7069. [Google Scholar] [CrossRef]
- Departamento de Operaciones. Informe de la Generación Diaria del Sistema Eléctrico; Autoridad de Energía Eléctrica de Puerto Rico: San Juan, Puerto Rico, 2016. [Google Scholar]
- Telos Energy. Puerto Rico Distributed Energy Resource Integration Study; Telos Energy: Saratoga Springs, NY, USA, 2020. [Google Scholar]
- Shahatha, M.; Mohammed, J.; Mohammed, S. Practical Evaluation of Solar Irradiance Effect on PV Performance. Energy Sci. Technol. 2013, 6, 36–40. [Google Scholar]
Figure 1.
Time scales for electric power system studies (Based on [7]).
Figure 1.
Time scales for electric power system studies (Based on [7]).

Figure 2.
Steps for modeling and evaluation of isolated electric power systems with potential electricity production from PV-based DERs.
Figure 2.
Steps for modeling and evaluation of isolated electric power systems with potential electricity production from PV-based DERs.

Figure 3.
Distribution of generating sources for FY 2014.

Figure 4.
Distribution feeder considered for both 13.2 and 8.32 kV levels.

Figure 5.
Historical PREPA electricity consumption (from 2010 to 2014) by customer classes.

Figure 6.
Available residential rooftop area by region in Puerto Rico in 2017.

Figure 7.
Histogram of the average daily global irradiance per year received by the available residential rooftop area in Puerto Rico in 2017.
Figure 7.
Histogram of the average daily global irradiance per year received by the available residential rooftop area in Puerto Rico in 2017.

Figure 8.
One-line diagram of the Puerto Rico electric power system (230 kV—blue; 115 kV—red; 38 kV—brown; 13.2 kV—green; 8.32 kV—burgundy).
Figure 8.
One-line diagram of the Puerto Rico electric power system (230 kV—blue; 115 kV—red; 38 kV—brown; 13.2 kV—green; 8.32 kV—burgundy).

Figure 9.
One-line diagram of the Puerto Rico electric power system divided by regions.

Figure 10.
Resultant distribution of electricity consumption in Puerto Rico by region (based on available data from 2010 to 2014).
Figure 10.
Resultant distribution of electricity consumption in Puerto Rico by region (based on available data from 2010 to 2014).

Figure 11.
Typical weekday normalized load shape in Puerto Rico (Data from [27]).
Figure 11.
Typical weekday normalized load shape in Puerto Rico (Data from [27]).

Figure 12.
Annual electricity production by PV systems installed on residential rooftop surface (based on the Puerto Rico annual net electric energy production in 2014).
Figure 12.
Annual electricity production by PV systems installed on residential rooftop surface (based on the Puerto Rico annual net electric energy production in 2014).

Figure 13.
Resultant distribution of the potential electricity production by PV systems installed on residential rooftop surface by region in Puerto Rico in 2017.
Figure 13.
Resultant distribution of the potential electricity production by PV systems installed on residential rooftop surface by region in Puerto Rico in 2017.

Figure 14.
Relation between electricity consumption (based on available data from 2010 to 2014) and potential PV production by areas in Puerto Rico in 2017.
Figure 14.
Relation between electricity consumption (based on available data from 2010 to 2014) and potential PV production by areas in Puerto Rico in 2017.


Table 1.
Existing conventional generators in Puerto Rico.
| Name | Type of Fuel | Heat Rate at Max Capacity (BTU/kWh) | Up and Down Ramp Rate (MW/h) | Max Capacity (MW) |
|---|---|---|---|---|
| AES ST | Coal | 9791 | 0 | 454 |
| AGUIRRE 1 ST | No. 6 fuel oil | 9600 | 300 | 450 |
| AGUIRRE 2 ST | No. 6 fuel oil | 9700 | 300 | 450 |
| AGUIRRE GT21 & GT22 | Diesel | 14,400 | 120 | 42 |
| AGUIRRECC 1 CT 1 | Diesel | 11,140 | 300 | 50 |
| AGUIRRECC 1 CT 2 | Diesel | 11,140 | 300 | 50 |
| AGUIRRECC 1 CT 3 | Diesel | 11,140 | 300 | 50 |
| AGUIRRECC 1 CT 4 | Diesel | 11,140 | 300 | 50 |
| AGUIRRECC 1 ST | Diesel | 11,140 | 300 | 96 |
| AGUIRRECC 2 CT 1 | Diesel | 11,140 | 300 | 50 |
| AGUIRRECC 2 CT 2 | Diesel | 11,140 | 300 | 50 |
| AGUIRRECC 2 CT 3 | Diesel | 11,140 | 300 | 50 |
| AGUIRRECC 2 CT 4 | Diesel | 11,140 | 300 | 50 |
| AGUIRRECC 2 ST | Diesel | 11,140 | 300 | 96 |
| CAMBALACHE 2 GT | Diesel | 11,549 | 120 | 83 |
| CAMBALACHE 3 GT | Diesel | 11,549 | 120 | 83 |
| COSTA SUR 5 ST | Natural gas | 9747 | 300 | 410 |
| COSTA SUR 6 ST | Natural gas | 9747 | 300 | 410 |
| COSTASUR GT11 & GT12 | Diesel | 14,400 | 120 | 42 |
| DAGUAO GT11 & GT12 | Diesel | 14,400 | 120 | 42 |
| ECOELECTRICACC CT 1 | Natural gas | 7497 | 600 | 157.5 |
| ECOELECTRICACC CT 2 | Natural gas | 7497 | 600 | 157.5 |
| ECOELECTRICACC ST | Natural gas | 7497 | 600 | 192 |
| JOBOS GT11 & GT12 | Diesel | 14,400 | 120 | 42 |
| MAYAGÜEZ 1 GT | Diesel | 9320 | 360 | 55 |
| MAYAGÜEZ 2 GT | Diesel | 9320 | 360 | 55 |
| MAYAGÜEZ 3 GT | Diesel | 9320 | 360 | 55 |
| MAYAGÜEZ 4 GT | Diesel | 9320 | 360 | 55 |
| PALO SECO 3 ST | No. 6 fuel oil | 9725 | 180 | 216 |
| PALO SECO 4 ST | No. 6 fuel oil | 9725 | 180 | 216 |
| PALOSECO GT11 & GT12 | Diesel | 14,400 | 120 | 42 |
| PALOSECO GT21 & GT22 | Diesel | 14,400 | 120 | 42 |
Table 2.
Input parameters to model transformers.
| Parameter | Units |
|---|---|
| Technology (Three Phase/Single Phase/Single Wire Earth Return) | NA |
| Rated Power | MVA |
| Nominal Frequency | Hz |
| Rated High Voltage | kV |
| Rated Low Voltage | kV |
| High-Voltage Side Vector Group (Y/YN/Z/ZN/D) | NA |
| Low-Voltage Side Vector Group (Y/YN/Z/ZN/D) | NA |
| Phase Shift | Degree |
| Positive and Negative Sequence Resistance | p.u. |
| Positive and Negative Sequence Reactance | p.u. |
| Zero Sequence Resistance | p.u. |
| Zero Sequence Reactance | p.u. |
| Automatic Tap Changing (Yes/No) | NA |
| Tap Position | NA |
| Additional Voltage per Tap | % |
| Voltage Setpoint | p.u. |
| Upper Voltage Bound | p.u. |
| Lower Voltage Bound | p.u. |
| Parallel Transformers | Unit |
| Rating Factor | % |
Table 3.
Input parameters to model lines.
| Parameter | Units |
|---|---|
| Rated Voltage | kV |
| Rated Current | kA |
| Nominal Frequency | Hz |
| System Type (AC/DC) | NA |
| No. of Phases (1/2/3) | NA |
| No. of Neutral (0/1) | NA |
| Positive and Negative Resistance | Ohm/km |
| Positive and Negative Reactance | Ohm/km |
| Zero Sequence Resistance | Ohm/km |
| Zero Sequence Reactance | Ohm/km |
| Length of line | km |
| No. Parallel Lines | Units |
| Derating Factor | % |
Table 4.
Parameters considered to the calculation of electricity consumption by municipalities.
| Customer Class | Parameter |
|---|---|
| Residential | Annual estimates of the resident population: 2010 to 2014 [36]. |
| Commercial | Trimestral average employment: 2010 to 2014 [37]. |
| Industrial | Annual production workers: 2011 to 2015 [38]. |
| Public lighting | Municipal public lighting per square mile: 2010 to 2014 [39]. |
| Agriculture | Total cropland (cropland-harvested and cropland-pasture): 2012 [40]. |
| Other public authorities | Total municipal facilities electricity consumption per square mile: 2010 to 2014 [41]. |
Table 5.
Top 10 list of the municipalities with the highest average daily global insolation per year (Data from [43]).
Table 5.
Top 10 list of the municipalities with the highest average daily global insolation per year (Data from [43]).
| Municipality | Area | Latitude (DD) | Longitude (DD) | Global Horizontal Insolation (W/m2) |
|---|---|---|---|---|
| Santa Isabel | A5 | 17.97 | −66.42 | 241.58 |
| Loiza | A3 | 18.41 | −65.86 | 241.17 |
| Guánica | A6 | 17.97 | −66.90 | 239.92 |
| Fajardo | A3 | 18.33 | −65.65 | 239.50 |
| San Juan | A1 | 18.45 | −66.06 | 239.50 |
| Hatillo | A7 | 18.49 | −66.82 | 238.67 |
| Guayama | A5 | 17.97 | −66.10 | 238.25 |
| Luquillo | A3 | 18.37 | −65.70 | 238.25 |
| Cataño | A2 | 18.45 | −66.10 | 237.83 |
| Arecibo | A7 | 18.49 | −66.70 | 237.42 |
Table 6.
Typical PV and equipment parameters.
| Parameter | Value |
|---|---|
| ηrated | 0.14 |
| TCη (%/°C) | 0.40 |
| TC (°C) | 25 |
| ηinv | 0.95 |
| ηloss | 0.95 |
Table 7.
Datasets from NREL used for each area.
| Area | Used Dataset |
| San Juan | San Juan |
| Bayamón | San Juan |
| Carolina | San Juan |
| Caguas | Ceiba |
| Ponce E. | Ponce |
| Ponce W. | Ponce |
| Arecibo | Aguadilla |
| Mayagüez | Mayagüez |
Table 8.
Classification parameters of daily irradiance using kD and POPD indexes.
| kD | POPD | Description | Type of Day |
|---|---|---|---|
| ≥0.5 | ≥0.5 | Sunny with steady sky conditions for almost the entire day. | Sunny |
| <0.5 | <0.5 | Cloudy with high levels of fluctuation for the entire day. | Cloudy |
Table 9.
Summary of the simulated electrical lines.
| Process | Voltage Level (kV) | Number of Lines |
|---|---|---|
| Transmission | 230 | 17 |
| 115 | 102 | |
| Sub-transmission | 38 | 100 |
| Distribution | 13.2 | 3298 |
| 8.32 | 884 | |
| Total | NA | 4401 |
Table 10.
Summary of the simulated transformer substations.
| Type of Transformer Substation (kV/kV) | Number of Substations |
|---|---|
| 230/115 | 11 |
| 230/24 | 3 |
| 230/22 | 2 |
| 230/20 | 1 |
| 230/18 | 3 |
| 230/15.5 | 2 |
| 230/13.8 | 10 |
| 115/38 | 44 |
| 115/20 | 4 |
| 115/18 | 2 |
| 115/15.5 | 2 |
| 115/13.8 | 15 |
| 115/13.2 | 56 |
| 115/8.32 | 4 |
| 38/13.2 | 27 |
| 38/8.32 | 48 |
| Total | 234 |
Table 11.
Typical generation dispatches used for the validation process.
| Name | Generation at 9:00 A.M. (MW) | Generation at 12:00 P.M. (MW) | Generation at 3:00 P.M. (MW) |
|---|---|---|---|
| AES ST | 454 | 454 | 454 |
| AGUIRRE 1 ST | 290 | 360 | 360 |
| COSTA SUR 5 ST | 270 | 330 | 330 |
| COSTA SUR 6 ST | 270 | 330 | 330 |
| ECOELECTRICACC CT 1 | 154.6 | 144 | 144 |
| ECOELECTRICACC CT 2 | 154.6 | 144 | 144 |
| ECOELECTRICACC ST | 154.6 | 144 | 144 |
| PALO SECO 3 ST | 40 | 75.5 | 75.5 |
| PALO SECO 4 ST | 40 | 75.5 | 75.5 |
| SAN JUAN 7 ST | 71 | 86.5 | 86.5 |
| SAN JUAN 8 ST | 71 | 86.5 | 86.5 |
| SAN JUANCC 6 CT | 130 | 150 | 150 |
| SAN JUANCC 6 ST | 43 | 49 | 49 |
| Total (MW) | 242.8 | 2429 | 2429 |
Table 12.
List of existing and added capacitor banks in the simulated power system.
| Terminal | Status | Municipality | Nom. Volt. (kV) | Qmax (MVAR) |
|---|---|---|---|---|
| MONACILLOS.115 | Added | San Juan | 115 | 50 |
| BERWIND.38 | Existing | San Juan | 38 | 43 |
| H.REY.115 | Existing | San Juan | 115 | 43 |
| TOA.BAJA.38 | Added | Toa Baja | 38 | 20 |
| S.LLANA.115 | Existing | Carolina | 115 | 38 |
| S.LLANA.115 | Added | Carolina | 115 | 38 |
| FAJARDO.115 | Existing | Fajardo | 115 | 29 |
| A.BUENAS.115 | Added | Aguas Buenas | 115 | 50 |
| AIBONITO.38 | Added | Aibonito | 38 | 30 |
| CAGUAS.115 | Existing | Caguas | 115 | 43 |
| CAYEY.115 | Existing | Cayey | 115 | 32 |
| HUMACAO.115 | Added | Humacao | 115 | 50 |
| OROCOVIS.38 | Added | Orocovis | 38 | 20 |
| S.LORENZO.38 | Added | San Lorenzo | 38 | 30 |
| YABUCOA.115 | Existing | Yabucoa | 115 | 38 |
| CAMBALACHE.PLT.115 | Added | Arecibo | 115 | 50 |
| CAMBALACHE.38 | Existing | Arecibo | 38 | 9 |
| BARCELONETA.115 | Existing | Barceloneta | 115 | 36 |
| MANATI.115 | Existing | Manatí | 115 | 43 |
| VICTORIA.115 | Existing | Aguadilla | 115 | 36 |
| ACACIAS.13.2—S1—30 MVA | Existing | Hormigueros | 13.2 | 9 |
| LARES.38 | Added | Lares | 38 | 30 |
| MAYAGÜEZ.115 | Added | Mayagüez | 115 | 30 |
| MAYAGÜEZ.PLT.115 | Existing | Mayagüez | 115 | 53 |
Table 13.
Power flow in 230-kV lines at 12 p.m. for the base scenario.
| Line Name (From Terminal i to Terminal j) | Volt. Mag.—i (p.u.) | Volt. Mag.—j (p.u.) | Loading (%) | Current Mag. (kA) |
|---|---|---|---|---|
| A.BUENAS.230—BAYAMON.TC.230 | 0.98 | 0.98 | 10.92 | 0.25 |
| AES.230—YABUCOA.230 | 1.01 | 0.98 | 28.59 | 0.66 |
| AGUIRRE.230—A.BUENAS.230 (1) | 1.00 | 0.98 | 23.16 | 0.54 |
| AGUIRRE.230—A.BUENAS.230 (2) | 1.00 | 0.98 | 23.20 | 0.54 |
| AGUIRRE.230—AES.230 | 1.00 | 1.01 | 21.42 | 0.50 |
| BAYAMON.230—MANATI.230 | 0.98 | 0.98 | 15.97 | 0.18 |
| COSTA.SUR.230—AGUIRRE.230 | 1.01 | 1.00 | 14.87 | 0.18 |
| COSTA.SUR.230—CAMBALACHE.230 | 1.01 | 0.97 | 44.62 | 0.52 |
| COSTA.SUR.230—ECOELECTRIC.230 | 1.01 | 1.02 | 66.07 | 1.19 |
| COSTA.SUR.230—MANATI.TC.230 | 1.01 | 0.98 | 40.27 | 0.47 |
| COSTA.SUR.230—PONCE.230 | 1.01 | 1.01 | 57.75 | 0.33 |
| MANATI.230—CAMBALACHE.230 | 0.98 | 0.97 | 10.27 | 0.12 |
| MAYAGÜEZ.230—COSTA.SUR.230 | 0.96 | 1.01 | 51.55 | 0.60 |
| MAYAGÜEZ.230—MORA.230 | 0.96 | 0.96 | 8.90 | 0.10 |
| MORA.230—CAMBALACHE.230 | 0.96 | 0.97 | 14.31 | 0.17 |
| S.LLANA.230—A.BUENAS.230 | 0.97 | 0.98 | 19.12 | 0.44 |
| YABUCOA.230—S.LLANA.230 | 0.98 | 0.97 | 19.05 | 0.22 |
| TOTAL | NA | NA | NA | 7.00 |
Table 14.
Scenarios of PV penetration evaluated for all studies.
| Scenario | Annual PV Penetration (%) | Annual PV Penetration (MWh) | Total PV Installed Capacity (MW) | Area Needed (m2) |
|---|---|---|---|---|
| 1 | 20 | 3,232,400 | 1771 | 19,274,780 |
| 2 | 30 | 4,848,600 | 2657 | 28,912,171 |
| 3 | 40 | 6,464,800 | 3542 | 38,549,561 |
Table 15.
Potential PV production by area (20% of PV penetration).
| Area | Active Power (MW) | |||||
|---|---|---|---|---|---|---|
| Sunny Days | Cloudy Days | |||||
| 9 A.M. | 12 P.M. | 3 P.M. | 9 A.M. | 12 P.M. | 3 P.M. | |
| San Juan | 102 | 182 | 157 | 52 | 82 | 41 |
| Bayamón | 132 | 266 | 213 | 38 | 69 | 130 |
| Carolina | 70 | 132 | 118 | 14 | 75 | 22 |
| Caguas | 152 | 289 | 251 | 37 | 77 | 184 |
| Ponce E. | 71 | 153 | 132 | 31 | 76 | 41 |
| Ponce W. | 99 | 207 | 168 | 22 | 82 | 98 |
| Arecibo | 121 | 223 | 185 | 24 | 130 | 46 |
| Mayagüez | 60 | 152 | 115 | 38 | 101 | 38 |
| Total | 806 | 1605 | 1341 | 256 | 693 | 599 |
Table 16.
Potential PV production by area (30% of PV penetration).
| Area | Active Power (MW) | |||||
|---|---|---|---|---|---|---|
| Sunny Days | Cloudy Days | |||||
| 9 A.M. | 12 P.M. | 3 P.M. | 9 A.M. | 12 P.M. | 3 P.M. | |
| San Juan | 153 | 273 | 236 | 78 | 123 | 61 |
| Bayamón | 198 | 399 | 320 | 57 | 103 | 195 |
| Carolina | 105 | 198 | 177 | 21 | 113 | 33 |
| Caguas | 227 | 434 | 377 | 56 | 116 | 276 |
| Ponce E. | 106 | 229 | 199 | 47 | 115 | 61 |
| Ponce W. | 148 | 311 | 253 | 33 | 123 | 147 |
| Arecibo | 182 | 335 | 278 | 36 | 196 | 69 |
| Mayagüez | 90 | 227 | 173 | 56 | 152 | 57 |
| Total | 1209 | 2407 | 2011 | 384 | 1040 | 899 |
Table 17.
Potential PV production by area (40% of PV penetration).
| Area | Active Power (MW) | |||||
|---|---|---|---|---|---|---|
| Sunny Days | Cloudy Days | |||||
| 9 A.M. | 12 P.M. | 3 P.M. | 9 A.M. | 12 P.M. | 3 P.M. | |
| San Juan | 204 | 364 | 315 | 104 | 163 | 81 |
| Bayamón | 264 | 532 | 427 | 76 | 137 | 260 |
| Carolina | 140 | 264 | 235 | 27 | 151 | 43 |
| Caguas | 303 | 579 | 503 | 75 | 155 | 368 |
| Ponce E. | 142 | 306 | 265 | 63 | 153 | 82 |
| Ponce W. | 197 | 414 | 337 | 44 | 164 | 197 |
| Arecibo | 242 | 446 | 370 | 47 | 261 | 92 |
| Mayagüez | 120 | 303 | 231 | 75 | 202 | 76 |
| Total | 1612 | 3210 | 2682 | 512 | 1386 | 1198 |
Publisher’s Note: MDPI stays neutral with regard to jurisdictional claims in published maps and institutional affiliations. |
© 2021 by the authors. Licensee MDPI, Basel, Switzerland. This article is an open access article distributed under the terms and conditions of the Creative Commons Attribution (CC BY) license (https://creativecommons.org/licenses/by/4.0/).
Share and Cite
MDPI and ACS Style
Cuello-Polo, G.; O’Neill-Carrillo, E. Power System Modeling for the Study of High Penetration of Distributed Photovoltaic Energy. Designs 2021, 5, 62. https://0-doi-org.brum.beds.ac.uk/10.3390/designs5040062
AMA Style
Cuello-Polo G, O’Neill-Carrillo E. Power System Modeling for the Study of High Penetration of Distributed Photovoltaic Energy. Designs. 2021; 5(4):62. https://0-doi-org.brum.beds.ac.uk/10.3390/designs5040062
Chicago/Turabian StyleCuello-Polo, Gustavo, and Efraín O’Neill-Carrillo. 2021. "Power System Modeling for the Study of High Penetration of Distributed Photovoltaic Energy" Designs 5, no. 4: 62. https://0-doi-org.brum.beds.ac.uk/10.3390/designs5040062