Comparison of Various Obesity-Related Indices for Identification of Metabolic Syndrome: A Population-Based Study from Taiwan Biobank

 and
and
Abstract
:1. Introduction
2. Materials and Methods
2.1. Data Source and Study Population
2.2. Definition of MetS
2.3. Calculations of Obesity-Related Indices
- BMI = weight (kg)/height2 (m)
- WHtR = WC (cm)/height (cm)
- WHR = WC (cm)/HC (cm)
- ABSI = WC (m)/[BMI2/3(kg/m2) × height1/2(m)]
- AVI = [2 × WC2(cm) + 0.7×(WC−HC)2(cm)]/1000
- BAI = [HC (m)/height2/3(m)]−18
- BRI = 364.2−365.5[1−π−2WC2(m)Height−2(m)]1/2
- CI = 0.109−1WC (m)[Weight (kg)/Height (m)]−1/2
- VAI male = [WC (cm)/39.68−1.88 × BMI (kg/m2)] × [TG (mmol/L)/1.03] × [1.31/HDL (mmol/L)]
- VAI female = [WC (cm)/36.58−1.89 × BMI (kg/m2)] × [TG (mmol/L)/0.81] × [1.52/HDL (mmol/L)]
- TyG index = Ln [fasting TG (mg/dL) × fasting plasma glucose (mg/dL)/2]
2.4. Statistical Analysis
3. Results
3.1. Characteristics of the Study Population
3.2. ORs for MetS Risk Across Quartiles of Each Obesity-Related Index
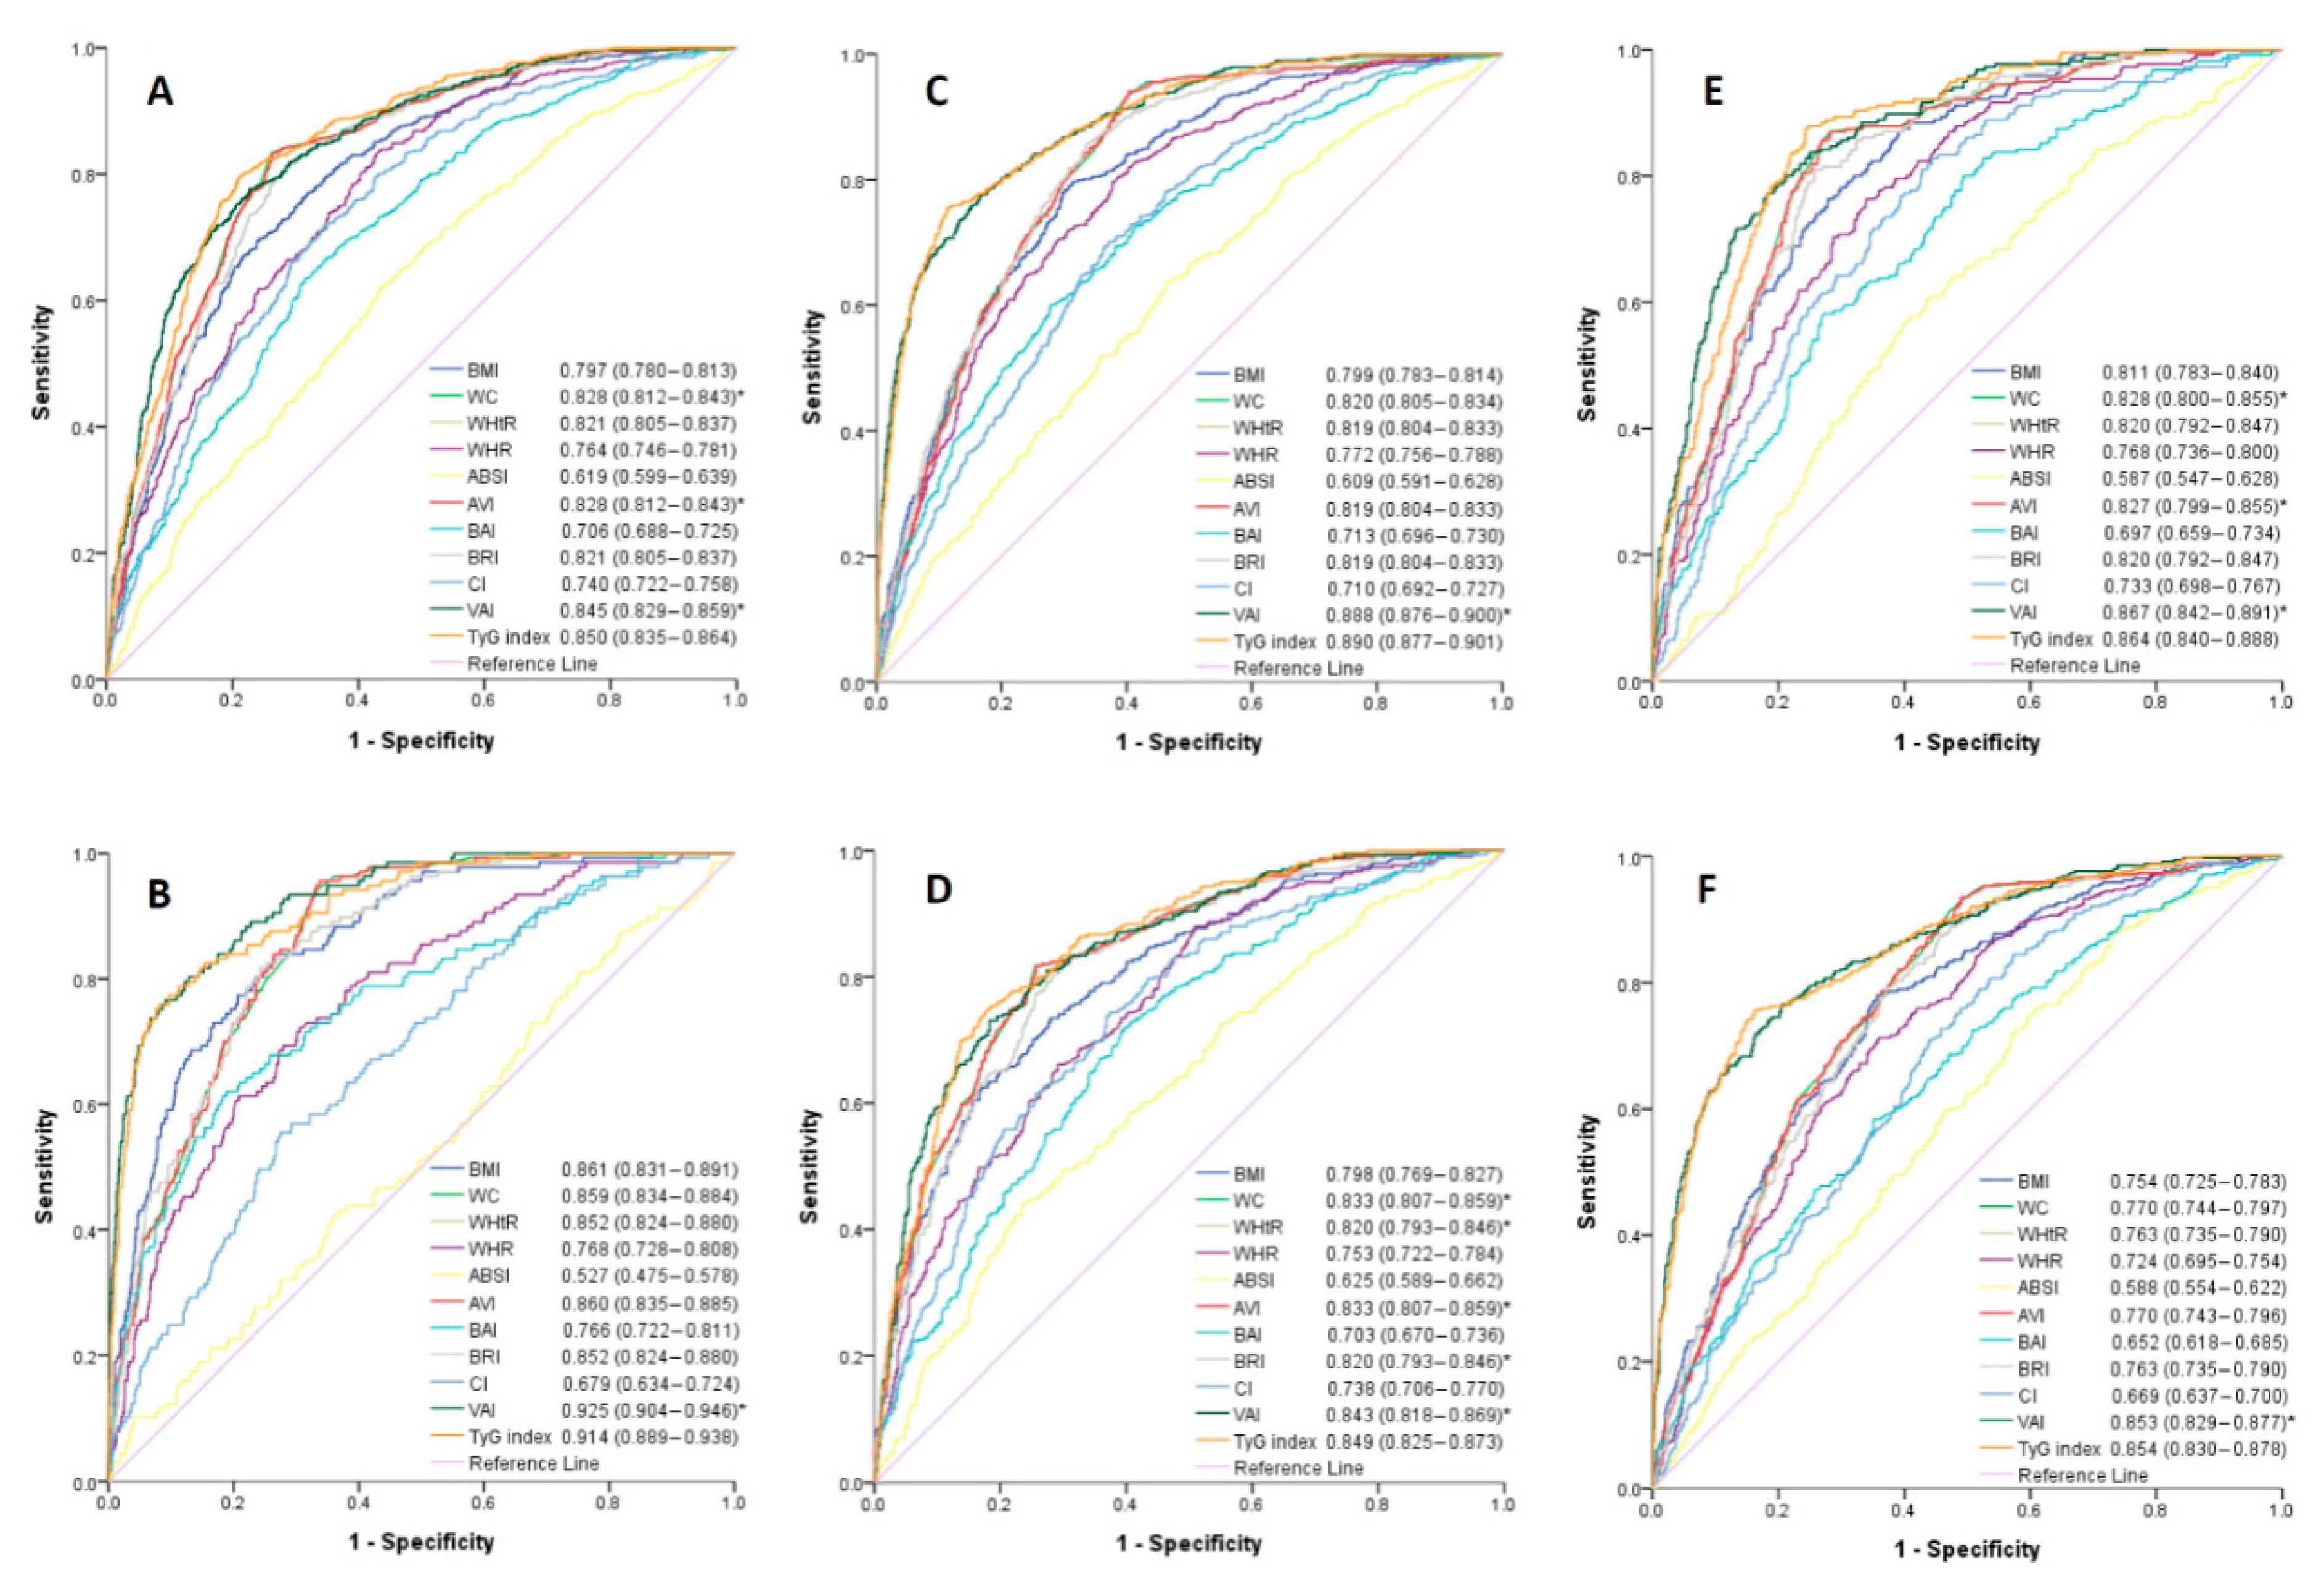
3.3. ROC Curve Analysis for the Obesity-Related Indices in Identifying MetS
4. Discussion
5. Conclusions
Supplementary Materials
Author Contributions
Funding
Conflicts of Interest
References
- Eckel, R.H.; Grundy, S.M.; Zimmet, P.Z. The metabolic syndrome. Lancet 2005, 365, 1415–1428. [Google Scholar] [CrossRef]
- Li, W.; Wang, D.; Wang, X.; Gong, Y.; Cao, S.; Yin, X.; Zhuang, X.; Shi, W.; Wang, Z.; Lu, Z. The association of metabolic syndrome components and diabetes mellitus: Evidence from china national stroke screening and prevention project. BMC Public Health 2019, 19, 192. [Google Scholar] [CrossRef] [PubMed]
- Zhang, X.; Lerman, L.O. The metabolic syndrome and chronic kidney disease. Transl. Res. 2017, 183, 14–25. [Google Scholar] [CrossRef] [PubMed] [Green Version]
- Li, X.; Li, X.; Lin, H.; Fu, X.; Lin, W.; Li, M.; Zeng, X.; Gao, Q. Metabolic syndrome and stroke: A meta-analysis of prospective cohort studies. J. Clin. Neurosci. 2017, 40, 34–38. [Google Scholar] [CrossRef] [PubMed]
- Mottillo, S.; Filion, K.B.; Genest, J.; Joseph, L.; Pilote, L.; Poirier, P.; Rinfret, S.; Schiffrin, E.L.; Eisenberg, M.J. The metabolic syndrome and cardiovascular risk a systematic review and meta-analysis. J. Am. Coll. Cardiol. 2010, 56, 1113–1132. [Google Scholar] [CrossRef] [PubMed] [Green Version]
- Ju, S.Y.; Lee, J.Y.; Kim, D.H. Association of metabolic syndrome and its components with all-cause and cardiovascular mortality in the elderly: A meta-analysis of prospective cohort studies. Medicine 2017, 96, e8491. [Google Scholar] [CrossRef] [PubMed]
- Ranasinghe, P.; Mathangasinghe, Y.; Jayawardena, R.; Hills, A.P.; Misra, A. Prevalence and trends of metabolic syndrome among adults in the asia-pacific region: A systematic review. BMC Public Health 2017, 17, 101. [Google Scholar] [CrossRef] [Green Version]
- Yeh, C.J.; Chang, H.Y.; Pan, W.H. Time trend of obesity, the metabolic syndrome and related dietary pattern in taiwan: From nahsit 1993–1996 to nahsit 2005–2008. Asia Pac. J. Clin. Nutr. 2011, 20, 292–300. [Google Scholar]
- Matsuzawa, Y.; Funahashi, T.; Nakamura, T. The concept of metabolic syndrome: Contribution of visceral fat accumulation and its molecular mechanism. J. Atheroscler. Thromb. 2011, 18, 629–639. [Google Scholar] [CrossRef] [Green Version]
- Rothney, M.P.; Catapano, A.L.; Xia, J.; Wacker, W.K.; Tidone, C.; Grigore, L.; Xia, Y.; Ergun, D.L. Abdominal visceral fat measurement using dual-energy x-ray: Association with cardiometabolic risk factors. Obesity 2013, 21, 1798–1802. [Google Scholar] [CrossRef]
- Nazare, J.A.; Smith, J.; Borel, A.L.; Aschner, P.; Barter, P.; Van Gaal, L.; Tan, C.E.; Wittchen, H.U.; Matsuzawa, Y.; Kadowaki, T.; et al. Usefulness of measuring both body mass index and waist circumference for the estimation of visceral adiposity and related cardiometabolic risk profile (from the INSPIRE ME IAA study). Am. J. Cardiol. 2015, 115, 307–315. [Google Scholar] [CrossRef] [PubMed]
- Kawamoto, R.; Kikuchi, A.; Akase, T.; Ninomiya, D.; Kumagi, T. Usefulness of waist-to-height ratio in screening incident metabolic syndrome among japanese community-dwelling elderly individuals. PLoS ONE 2019, 14, e0216069. [Google Scholar] [CrossRef] [PubMed]
- Gharipour, M.; Sarrafzadegan, N.; Sadeghi, M.; Andalib, E.; Talaie, M.; Shafie, D.; Aghababaie, E. Predictors of metabolic syndrome in the iranian population: Waist circumference, body mass index, or waist to hip ratio? Cholesterol 2013, 2013, 198384. [Google Scholar] [CrossRef] [PubMed] [Green Version]
- Guerrero-Romero, F.; Rodriguez-Moran, M. Abdominal volume index. An anthropometry-based index for estimation of obesity is strongly related to impaired glucose tolerance and type 2 diabetes mellitus. Arch. Med. Res. 2003, 34, 428–432. [Google Scholar] [CrossRef]
- Thomas, D.M.; Bredlau, C.; Bosy-Westphal, A.; Mueller, M.; Shen, W.; Gallagher, D.; Maeda, Y.; McDougall, A.; Peterson, C.M.; Ravussin, E.; et al. Relationships between body roundness with body fat and visceral adipose tissue emerging from a new geometrical model. Obesity (Silver Spring) 2013, 21, 2264–2271. [Google Scholar] [CrossRef] [PubMed] [Green Version]
- Rico-Martin, S.; Calderon-Garcia, J.F.; Sanchez-Rey, P.; Franco-Antonio, C.; Martinez Alvarez, M.; Sanchez Munoz-Torrero, J.F. Effectiveness of body roundness index in predicting metabolic syndrome: A systematic review and meta-analysis. Obes. Rev. 2020, 21, e13023. [Google Scholar] [CrossRef]
- Mantzoros, C.S.; Evagelopoulou, K.; Georgiadis, E.I.; Katsilambros, N. Conicity index as a predictor of blood pressure levels, insulin and triglyceride concentrations of healthy premenopausal women. Horm. Metab. Res. 1996, 28, 32–34. [Google Scholar] [CrossRef]
- Bawadi, H.; Abouwatfa, M.; Alsaeed, S.; Kerkadi, A.; Shi, Z. Body shape index is a stronger predictor of diabetes. Nutrients 2019, 11, 1018. [Google Scholar] [CrossRef] [Green Version]
- Baveicy, K.; Mostafaei, S.; Darbandi, M.; Hamzeh, B.; Najafi, F.; Pasdar, Y. Predicting metabolic syndrome by visceral adiposity index, body roundness index and a body shape index in adults: A cross-sectional study from the iranian rancd cohort data. Diabetes Metab. Syndr. Obes. 2020, 13, 879–887. [Google Scholar] [CrossRef] [Green Version]
- Guerrero-Romero, F.; Simental-Mendia, L.E.; Gonzalez-Ortiz, M.; Martinez-Abundis, E.; Ramos-Zavala, M.G.; Hernandez-Gonzalez, S.O.; Jacques-Camarena, O.; Rodriguez-Moran, M. The product of triglycerides and glucose, a simple measure of insulin sensitivity. Comparison with the euglycemic-hyperinsulinemic clamp. J. Clin. Endocrinol. Metab. 2010, 95, 3347–3351. [Google Scholar] [CrossRef] [Green Version]
- Yu, X.; Wang, L.; Zhang, W.; Ming, J.; Jia, A.; Xu, S.; Li, Q.; Ji, Q. Fasting triglycerides and glucose index is more suitable for the identification of metabolically unhealthy individuals in the chinese adult population: A nationwide study. J. Diabetes Investig. 2019, 10, 1050–1058. [Google Scholar] [CrossRef] [PubMed] [Green Version]
- Fan, C.T.; Lin, J.C.; Lee, C.H. Taiwan biobank: A project aiming to aid taiwan’s transition into a biomedical island. Pharmacogenomics 2008, 9, 235–246. [Google Scholar] [CrossRef] [PubMed]
- Lin, J.C.; Fan, C.T.; Liao, C.C.; Chen, Y.S. Taiwan biobank: Making cross-database convergence possible in the big data era. Gigascience 2018, 7, 1–4. [Google Scholar] [CrossRef] [PubMed] [Green Version]
- Levey, A.S.; Stevens, L.A.; Schmid, C.H.; Zhang, Y.L.; Castro, A.F., III; Feldman, H.I.; Kusek, J.W.; Eggers, P.; Van Lente, F.; Greene, T.; et al. A new equation to estimate glomerular filtration rate. Ann. Intern. Med. 2009, 150, 604–612. [Google Scholar] [CrossRef]
- National Cholesterol Education Program (NCEP) Expert Panel on Detection, Evaluation, and Treatment of High Blood Cholesterol in Adults (Adult Treatment Panel III). Third report of the national cholesterol education program (NCEP) expert panel on detection, evaluation, and treatment of high blood cholesterol in adults (adult treatment panel III) final report. Circulation 2002, 106, 3143–3421. [Google Scholar] [CrossRef]
- Krakauer, N.Y.; Krakauer, J.C. A new body shape index predicts mortality hazard independently of body mass index. PLoS ONE 2012, 7, e39504. [Google Scholar] [CrossRef]
- Bergman, R.N.; Stefanovski, D.; Buchanan, T.A.; Sumner, A.E.; Reynolds, J.C.; Sebring, N.G.; Xiang, A.H.; Watanabe, R.M. A better index of body adiposity. Obesity (Silver Spring) 2011, 19, 1083–1089. [Google Scholar] [CrossRef]
- Valdez, R. A simple model-based index of abdominal adiposity. J. Clin. Epidemiol. 1991, 44, 955–956. [Google Scholar] [CrossRef]
- Amato, M.C.; Giordano, C.; Galia, M.; Criscimanna, A.; Vitabile, S.; Midiri, M.; Galluzzo, A.; AlkaMeSy Study, G. Visceral adiposity index: A reliable indicator of visceral fat function associated with cardiometabolic risk. Diabetes Care 2010, 33, 920–922. [Google Scholar] [CrossRef] [Green Version]
- DeLong, E.R.; DeLong, D.M.; Clarke-Pearson, D.L. Comparing the areas under two or more correlated receiver operating characteristic curves: A nonparametric approach. Biometrics 1988, 44, 837–845. [Google Scholar] [CrossRef]
- Kwon, H.; Pessin, J.E. Adipokines mediate inflammation and insulin resistance. Front. Endocrinol. 2013, 4, 71. [Google Scholar] [CrossRef] [PubMed] [Green Version]
- Nusrianto, R.; Tahapary, D.L.; Soewondo, P. Visceral adiposity index as a predictor for type 2 diabetes mellitus in asian population: A systematic review. Diabetes Metab. Syndr. 2019, 13, 1231–1235. [Google Scholar] [CrossRef] [PubMed]
- Amato, M.C.; Pizzolanti, G.; Torregrossa, V.; Misiano, G.; Milano, S.; Giordano, C. Visceral adiposity index (vai) is predictive of an altered adipokine profile in patients with type 2 diabetes. PLoS ONE 2014, 9, e91969. [Google Scholar] [CrossRef] [PubMed] [Green Version]
- Stepanek, L.; Horakova, D.; Cibickova, L.; Vaverkova, H.; Karasek, D.; Nakladalova, M.; Zapletalova, J. Can visceral adiposity index serve as a simple tool for identifying individuals with insulin resistance in daily clinical practice? Medicina 2019, 55. [Google Scholar]
- Lee, S.H.; Kwon, H.S.; Park, Y.M.; Ha, H.S.; Jeong, S.H.; Yang, H.K.; Lee, J.H.; Yim, H.W.; Kang, M.I.; Lee, W.C.; et al. Predicting the development of diabetes using the product of triglycerides and glucose: The chungju metabolic disease cohort (CMC) study. PLoS ONE 2014, 9, e90430. [Google Scholar] [CrossRef] [PubMed]
- Zheng, R.; Mao, Y. Triglyceride and glucose (tyg) index as a predictor of incident hypertension: A 9-year longitudinal population-based study. Lipids Health Dis 2017, 16, 175. [Google Scholar] [CrossRef] [Green Version]
- Tack, C.J.; Smits, P.; Willemsen, J.J.; Lenders, J.W.; Thien, T.; Lutterman, J.A. Effects of insulin on vascular tone and sympathetic nervous system in NIDDM. Diabetes 1996, 45, 15–22. [Google Scholar] [CrossRef] [Green Version]
- Fonseca, V.A. Insulin resistance, diabetes, hypertension, and renin-angiotensin system inhibition: Reducing risk for cardiovascular disease. J. Clin. Hypertens. 2006, 8, 713–722. [Google Scholar] [CrossRef]
- Generoso, G.; Bensenor, I.M.; Santos, R.D.; Santos, I.S.; Goulart, A.C.; Jones, S.R.; Kulkarni, K.R.; Blaha, M.J.; Toth, P.P.; Lotufo, P.A.; et al. Association between high-density lipoprotein subfractions and low-grade inflammation, insulin resistance, and metabolic syndrome components: The elsa-brasil study. J. Clin. Lipidol. 2018, 12, 1290–1297. [Google Scholar] [CrossRef]
- Li, R.; Li, Q.; Cui, M.; Yin, Z.; Li, L.; Zhong, T.; Huo, Y.; Xie, P. Clinical surrogate markers for predicting metabolic syndrome in middle-aged and elderly chinese. J. Diabetes Investig. 2018, 9, 411–418. [Google Scholar] [CrossRef] [Green Version]
- Shin, K.A.; Kim, Y.J. Usefulness of surrogate markers of body fat distribution for predicting metabolic syndrome in middle-aged and older korean populations. Diabetes Metab. Syndr. Obes. 2019, 12, 2251–2259. [Google Scholar] [CrossRef] [PubMed] [Green Version]
- Hardy, O.T.; Czech, M.P.; Corvera, S. What causes the insulin resistance underlying obesity? Curr. Opin. Endocrinol. Diabetes Obes. 2012, 19, 81–87. [Google Scholar] [CrossRef] [PubMed] [Green Version]
- Karastergiou, K.; Smith, S.R.; Greenberg, A.S.; Fried, S.K. Sex differences in human adipose tissues—the biology of pear shape. Biol. Sex. Differ. 2012, 3, 13. [Google Scholar] [CrossRef] [PubMed] [Green Version]
- Stevens, J.; Katz, E.G.; Huxley, R.R. Associations between gender, age and waist circumference. Eur. J. Clin. Nutr. 2010, 64, 6–15. [Google Scholar] [CrossRef] [Green Version]
- Fujita, M.; Sato, Y.; Nagashima, K.; Takahashi, S.; Hata, A. Predictive power of a body shape index for development of diabetes, hypertension, and dyslipidemia in japanese adults: A retrospective cohort study. PLoS ONE 2015, 10, e0128972. [Google Scholar] [CrossRef]
- Lear, S.A.; Humphries, K.H.; Kohli, S.; Chockalingam, A.; Frohlich, J.J.; Birmingham, C.L. Visceral adipose tissue accumulation differs according to ethnic background: Results of the multicultural community health assessment trial (m-chat). Am. J. Clin. Nutr. 2007, 86, 353–359. [Google Scholar] [CrossRef]


| Men (n = 2335) | Female (n = 2665) | |||||
|---|---|---|---|---|---|---|
| Characteristics | MetS (−) | MetS (+) | p-Value | MetS (−) | MetS (+) | p-Value |
| n (%) | 1819 (77.9) | 516 (22.1) | 2187 (82.1) | 478 (17.9) | ||
| Age (year) | 49.0 ± 11.1 | 51.8 ± 10.5 | <0.001 | 48.4 ± 10.2 | 54.8 ± 9.3 | <0.001 |
| Systolic BP (mmHg) | 116.9 ± 14.7 | 128.0 ± 16.6 | <0.001 | 108.8 ± 15.6 | 127.1 ± 17.7 | <0.001 |
| Diastolic BP (mmHg) | 73.9 ± 10.0 | 80.8 ± 11.0 | <0.001 | 66.4 ± 9.5 | 74.9 ± 11.0 | <0.001 |
| Current smoking (%) | 17.4 | 25.6 | <0.001 | 1.1 | 2.3 | 0.047 |
| Exercise habits (%) | 46.9 | 45.3 | 0.535 | 41.9 | 47.7 | 0.010 |
| Laboratory parameters | ||||||
| Uric acid (mg/dL) | 6.3 ± 1.3 | 6.9 ± 1.5 | <0.001 | 4.7 ± 1.0 | 5.6 ± 1.3 | <0.001 |
| HbA1C (%) | 5.7 ± 0.7 | 6.3 ± 1.2 | <0.001 | 5.6 ± 0.5 | 6.4 ± 1.2 | <0.001 |
| Fasting glucose (mg/dL) | 96.5 ± 17.4 | 112.0 ± 30.1 | <0.001 | 90.5 ± 10.8 | 108.9 ± 29.1 | <0.001 |
| Total cholesterol (mg/dL) | 192.3 ± 34.3 | 195.5 ± 38.5 | 0.082 | 194.9 ± 35.7 | 205.0 ± 39.6 | <0.001 |
| TG (mg/dL) | 114.0 ± 68.5 | 212.7 ± 151.2 | <0.001 | 87.3 ± 47.1 | 179.0 ± 119.3 | <0.001 |
| HDL-C (mg/dL) | 51.3 ± 11.1 | 41.3 ± 8.5 | <0.001 | 61.3 ± 12.9 | 47.4 ± 9.2 | <0.001 |
| LDL-C (mg/dL) | 123.9 ± 31.6 | 121.6 ± 34.2 | 0.162 | 119.4 ± 31.7 | 127.9 ± 35.1 | <0.001 |
| eGFR (mL/min/1.73 m2) | 97.5 ± 14.7 | 94.8 ± 16.1 | <0.001 | 106.6 ± 12.8 | 100.2 ± 14.5 | <0.001 |
| Obesity-related indices | ||||||
| BMI (kg/m2) | 24.4 ± 2.9 | 27.8 ± 3.3 | <0.001 | 22.8 ± 3.1 | 26.5 ± 3.5 | <0.001 |
| WC (cm) | 85.7 ± 7.6 | 95.3 ± 7.6 | <0.001 | 79.1 ± 8.3 | 89.3 ± 8.5 | <0.001 |
| WHtR | 0.5077 ± 0.0455 | 0.5640 ± 0.0441 | <0.001 | 0.5036 ± 0.0561 | 0.5727 ± 0.0576 | <0.001 |
| WHR | 0.8870 ± 0.0510 | 0.9364 ± 0.0479 | <0.001 | 0.8371 ± 0.0631 | 0.9003 ± 0.0592 | <0.001 |
| ABSI | 0.0786 ± 0.0038 | 0.0802 ± 0.0037 | <0.001 | 0.0787 ± 0.0052 | 0.0807 ± 0.0054 | <0.001 |
| AVI | 14.9 ± 2.6 | 18.3 ± 3.0 | <0.001 | 12.8 ± 2.6 | 16.2 ± 3.2 | <0.001 |
| BAI | 26.1 ± 2.8 | 28.3 ± 3.1 | <0.001 | 30.0 ± 3.5 | 33.0 ± 4.2 | <0.001 |
| BRI | 3.54 ± 0.88 | 4.68 ± 0.96 | <0.001 | 3.49 ± 1.10 | 4.89 ± 1.32 | <0.001 |
| CI | 1.23 ± 0.06 | 1.28 ± 0.56 | <0.001 | 1.21 ± 0.08 | 1.28 ± 0.08 | <0.001 |
| VAI | 1.35 ± 1.01 | 3.21 ± 2.87 | <0.001 | 1.26 ± 0.96 | 3.44 ± 3.12 | <0.001 |
| TyG index | 8.48 ± 0.50 | 9.20 ± 0.54 | <0.001 | 8.19 ± 0.44 | 9.02 ± 0.56 | <0.001 |
| Components of MetS | ||||||
| Central obesity (%) | 26.3 | 83.3 | <0.001 | 43.3 | 95.6 | <0.001 |
| High BP (%) | 25.2 | 68.8 | <0.001 | 11.8 | 60.0 | <0.001 |
| Low HDL-C (%) | 9.7 | 54.7 | <0.001 | 16.1 | 71.8 | <0.001 |
| High TG (%) | 17.8 | 69.8 | <0.001 | 5.3 | 57.5 | <0.001 |
| Dysglycemia (%) | 20.1 | 69.8 | <0.001 | 8.8 | 59.0 | <0.001 |
| All | Men | Women | ||||
|---|---|---|---|---|---|---|
| Unadjusted OR | Adjusted OR | Unadjusted OR | Adjusted OR | Unadjusted OR | Adjusted OR | |
| BMI | ||||||
| Q1 | 1 | 1 | 1 | 1 | 1 | 1 |
| Q2 | 3.757 (2.544−5.546) | 3.271 (2.190−4.885) | 6.461 (3.543−11.782) | 6.233 (3.375−11.511) | 4.140 (2.322−7.383) | 3.208 (1.766−5.826) |
| Q3 | 9.614 (6.662−13.874) | 8.211 (5.606−12.028) | 13.438 (7.508−24.052) | 13.789 (7.595−25.034) | 9.813 (5.673−16.974) | 6.034 (3.416−10.656) |
| Q4 | 30.539 (21.339−43.707) | 28.172 (19.295−41.134) | 43.547 (24.548−77.249) | 49.268 (27.242−89.103) | 31.872 (18.677−54.389) | 18.232 (10.438−31.849) |
| WC | ||||||
| Q1 | 1 | 1 | 1 | 1 | 1 | 1 |
| Q2 | 7.205 (4.264−12.175) | 6.982 (4.100−11.891) | 6.060 (2.953−12.437) | 5.693 (2.749−11.792) | 0.962 (0.406−2.282) * | 0.763 (0.317−1.841) * |
| Q3 | 15.262 (9.119−25.542) | 14.156 (8.346−24.013) | 17.041 (8.587−33.817) | 16.246 (8.094−32.606) | 17.559 (9.167−33.634) | 12.948 (6.640−25.246) |
| Q4 | 59.523 (35.914−98.653) | 61.112 (36.123−103.390) | 65.446 (33.233−128.881) | 66.175 (33.122−132.210) | 40.734 (21.428−77.437) | 21.584 (11.105−41.949) |
| WHtR | ||||||
| Q1 | 1 | 1 | 1 | 1 | 1 | 1 |
| Q2 | 6.561 (3.844−11.197) | 5.358 (3.118−9.207) | 3.806 (2.080−6.964) | 3.661 (1.982−6.760) | 4.657 (2.148−10.096) | 3.476 (1.582−7.638) |
| Q3 | 24.319 (14.604−40.499) | 18.637 (11.106−31.275) | 14.015 (7.991−24.579) | 13.385 (7.550−23.729) | 24.541 (11.945−50.421) | 15.773 (7.574−32.844) |
| Q4 | 67.034 (40.434−111.133) | 47.220 (28.172−79.148) | 43.680 (25.087−76.055) | 42.257 (23.899−74.718) | 58.995 (28.891−120.466) | 28.357 (13.588−59.176) |
| WHR | ||||||
| Q1 | 1 | 1 | 1 | 1 | 1 | 1 |
| Q2 | 2.341 (1.703−3.219) | 2.096 (1.507−2.914) | 3.865 (2.371−6.301) | 3.774 (2.296−6.204) | 3.203 (1.908−5.378) | 2.665 (1.563−4.543) |
| Q3 | 6.103 (4.556−8.176) | 5.221 (3.819−7.136) | 9.789 (6.162−15.552) | 8.681 (5.400−13.958) | 7.924 (4.882−12.860) | 5.325 (3.219−8.809) |
| Q4 | 14.155 (10.647−18.817) | 11.474 (8.385−15.701) | 19.825 (12.561−31.289) | 18.116 (11.307−29.027) | 21.453 (13.393−34.363) | 11.420 (6.944−18.782) |
| ABSI | ||||||
| Q1 | 1 | 1 | 1 | 1 | 1 | 1 |
| Q2 | 1.602 (1.275−2.013) | 1.375 (1.080−1.751) | 1.691 (1.230−2.327) | 1.676 (1.205−2.333) | 1.568 (1.133−2.172) | 1.192 (0.836−1.700) * |
| Q3 | 2.300 (1.849−2.861) | 1.796 (1.421−2.271) | 2.297 (1.686−3.129) | 2.074 (1.498−2.872) | 2.162 (1.581−2.957) | 1.672 (1.186−2.356) |
| Q4 | 3.014 (2.434−3.731) | 2.135 (1.688−2.702) | 3.246 (2.402−4.387) | 2.772 (2.000−3.843) | 2.924 (2.158−3.963) | 1.591 (1.125−2.249) |
| AVI | ||||||
| Q1 | 1 | 1 | 1 | 1 | 1 | 1 |
| Q2 | 7.658 (4.702−12.471) | 7.220 (4.400−11.849) | 5.453 (2.829−10.509) | 5.082 (2.611−9.893) | 1.822 (0.835−3.978) * | 1.446 (0.651−3.208) * |
| Q3 | 16.626 (10.355−26.693) | 15.323 (9.423−24.917) | 16.510 (8.829−30.873) | 15.882 (8.394−30.052) | 21.692 (11.339−41.498) | 16.350 (8.417−31.762) |
| Q4 | 57.011 (35.757−90.899) | 56.690 (34.853−92.208) | 56.437 (30.409−104.743) | 57.456 (30.498−108.241) | 48.899 (25.703−93.026) | 26.343 (13.567−51.150) |
| BAI | ||||||
| Q1 | 1 | 1 | 1 | 1 | 1 | 1 |
| Q2 | 2.239 (1.762−2.847) | 2.611 (2.019−3.376) | 2.197 (1.512−3.193) | 2.231 (1.514−3.286) | 1.730 (1.180−2.538) | 1.265 (0.840−1.905) * |
| Q3 | 2.437 (1.921−3.091) | 3.329 (2.548−4.350) | 4.286 (3.011−6.099) | 3.958 (2.740−5.718) | 3.089 (2.161−4.417) | 1.787 (1.216−2.627) |
| Q4 | 4.776 (3.810−5.988) | 7.167 (5.404−9.506) | 7.153 (5.069−10.092) | 6.397 (4.455−9.186) | 7.205 (5.132−10.115) | 3.482 (2.404−5.045) |
| BRI | ||||||
| Q1 | 1 | 1 | 1 | 1 | 1 | 1 |
| Q2 | 6.478 (3.794−11.059) | 5.286 (3.075−9.087) | 3.481 (1.929−6.281) | 3.329 (1.828−6.065) | 4.627 (2.134−10.032) | 3.456 (1.573−7.593) |
| Q3 | 24.336 (14.614−40.524) | 18.646 (11.112−31.290) | 13.141 (7.617−22.669) | 12.493 (7.162−21.793) | 24.797 (12.070−50.942) | 15.922 (7.647−33.152) |
| Q4 | 66.926 (40.369−110.954) | 47.134 (28.120−79.004) | 40.480 (23.644−69.306) | 39.027 (22.439−67.878) | 59.089 (28.935−120.666) | 28.257 (13.541−58.965) |
| CI | ||||||
| Q1 | 1 | 1 | 1 | 1 | 1 | 1 |
| Q2 | 2.105 (1.578−2.807) | 1.683 (1.248−2.268) | 2.927 (1.915−4.474) | 2.755 (1.786−4.249) | 2.706 (1.790−4.091) | 1.958 (1.266−3.027) |
| Q3 | 4.955 (3.799−6.461) | 3.806 (2.882−5.027) | 5.766 (3.855−8.625) | 5.444 (3.595−8.244) | 5.303 (3.589−7.835) | 3.663 (2.424−5.533) |
| Q4 | 9.111 (7.034−11.803) | 5.940 (4.509−7.826) | 13.122 (8.865−19.422) | 11.649 (7.718−17.582) | 8.606 (5.875−12.607) | 4.152 (2.746−6.276) |
| VAI | ||||||
| Q1 | 1 | 1 | 1 | 1 | 1 | 1 |
| Q2 | 5.698 (3.322−9.774) | 5.265 (3.034−9.136) | 5.406 (2.800−10.440) | 5.533 (2.832−10.810) | 9.720 (3.445−27.427) | 7.010 (2.438−20.156) |
| Q3 | 14.342 (8.559−24.032) | 12.501 (7.354−21.251) | 12.449 (6.624−23.396) | 13.547 (7.092−25.875) | 23.562 (8.586−64.657) | 15.629 (5.572−43.835) |
| Q4 | 96.894 (58.439−160.652) | 89.441 (53.092−150.676) | 71.236 (38.366−132.268) | 87.431 (45.876−166.629) | 187.779 (69.450−507.713) | 130.431 (47.352−359.274) |
| TyG index | ||||||
| Q1 | 1 | 1 | 1 | 1 | 1 | 1 |
| Q2 | 6.641 (3.679−11.986) | 5.355 (2.939−9.757) | 5.169 (2.589−10.321) | 5.410 (2.681−10.917) | 7.112 (2.764−18.299) | 4.991 (1.909−13.047) |
| Q3 | 16.292 (9.226−28.768) | 13.213 (7.391−23.621) | 15.564 (8.079−29.983) | 16.726 (8.571−32.640) | 16.497 (6.625−41.083) | 9.952 (3.913−25.310) |
| Q4 | 128.485 (73.550−224.451) | 152.608 (85.593−272.093) | 76.152 (39.903−145.331) | 104.850 (53.364−206.009) | 160.309 (65.637−391.533) | 101.466 (40.691−235.015) |
| AUC (95% Confidence Interval) | Cutoff Value | Sensitivity (%) | Specificity (%) | Youden Index | |
|---|---|---|---|---|---|
| BMI | 0.797 (0.780−0.813) | 26.0 | 69.8 | 75.7 | 0.454 |
| WC | 0.828 (0.812−0.843) * | 89.8 | 83.3 | 73.7 | 0.571 |
| WHtR | 0.821 (0.805−0.837) | 0.53 | 81.2 | 71.6 | 0.528 |
| WHR | 0.764 (0.746−0.781) | 0.894 | 83.9 | 56.4 | 0.403 |
| ABSI | 0.619 (0.599−0.639) | 0.079 | 62.0 | 56.5 | 0.185 |
| AVI | 0.828 (0.812−0.843) * | 16.2 | 83.3 | 73.7 | 0.570 |
| BAI | 0.706 (0.688−0.725) | 27.2 | 63.4 | 68.4 | 0.318 |
| BRI | 0.821 (0.805−0.837) | 3.94 | 81.2 | 71.6 | 0.528 |
| CI | 0.740 (0.722−0.758) | 1.25 | 72.1 | 65.2 | 0.372 |
| VAI | 0.845 (0.829−0.859) * | 1.74 | 77.7 | 77.2 | 0.549 |
| TyG index | 0.850 (0.835−0.864) | 8.83 | 79.7 | 78.9 | 0.585 |
| AUC (95% Confidence Interval) | Cutoff Value | Sensitivity (%) | Specificity (%) | Youden Index | |
|---|---|---|---|---|---|
| BMI | 0.799 (0.783−0.814) | 23.9 | 78.4 | 69.8 | 0.482 |
| WC | 0.820 (0.805−0.834) | 80.1 | 93.3 | 60.0 | 0.533 |
| WHtR | 0.819 (0.804−0.833) | 0.521 | 85.8 | 66.4 | 0.522 |
| WHR | 0.772 (0.756−0.788) | 0.852 | 79.7 | 62.2 | 0.419 |
| ABSI | 0.609 (0.591−0.628) | 0.079 | 63.8 | 53.4 | 0.172 |
| AVI | 0.819 (0.804−0.833) | 13.0 | 94.1 | 59.6 | 0.537 |
| BAI | 0.713 (0.696−0.730) | 31.7 | 60.0 | 72.2 | 0.322 |
| BRI | 0.819 (0.804−0.833) | 3.77 | 85.8 | 66.4 | 0.522 |
| CI | 0.710 (0.692−0.727) | 1.23 | 69.4 | 63.5 | 0.329 |
| VAI | 0.888 (0.876−0.900) * | 1.83 | 77.6 | 83.2 | 0.608 |
| TyG index | 0.890 (0.877−0.901) | 8.70 | 75.5 | 88.6 | 0.641 |
Publisher’s Note: MDPI stays neutral with regard to jurisdictional claims in published maps and institutional affiliations. |
© 2020 by the authors. Licensee MDPI, Basel, Switzerland. This article is an open access article distributed under the terms and conditions of the Creative Commons Attribution (CC BY) license (http://creativecommons.org/licenses/by/4.0/).
Share and Cite
Chiu, T.-H.; Huang, Y.-C.; Chiu, H.; Wu, P.-Y.; Chiou, H.-Y.C.; Huang, J.-C.; Chen, S.-C. Comparison of Various Obesity-Related Indices for Identification of Metabolic Syndrome: A Population-Based Study from Taiwan Biobank. Diagnostics 2020, 10, 1081. https://0-doi-org.brum.beds.ac.uk/10.3390/diagnostics10121081
Chiu T-H, Huang Y-C, Chiu H, Wu P-Y, Chiou H-YC, Huang J-C, Chen S-C. Comparison of Various Obesity-Related Indices for Identification of Metabolic Syndrome: A Population-Based Study from Taiwan Biobank. Diagnostics. 2020; 10(12):1081. https://0-doi-org.brum.beds.ac.uk/10.3390/diagnostics10121081
Chicago/Turabian StyleChiu, Tai-Hua, Ya-Chin Huang, Hsuan Chiu, Pei-Yu Wu, Hsin-Ying Clair Chiou, Jiun-Chi Huang, and Szu-Chia Chen. 2020. "Comparison of Various Obesity-Related Indices for Identification of Metabolic Syndrome: A Population-Based Study from Taiwan Biobank" Diagnostics 10, no. 12: 1081. https://0-doi-org.brum.beds.ac.uk/10.3390/diagnostics10121081