
A Comprehensive Machine Learning Framework for the Exact Prediction of the Age of Onset in Familial and Sporadic Alzheimer’s Disease

 ,
,  ,
, 
Abstract
:1. Introduction
2. Materials and Methods
2.1. Subjects
2.1.1. E280A Pedigree
2.1.2. The Cohort of Sporadic Cases
2.2. Variants Associated with ADAOO
2.3. ADAOO Prediction Using ML
3. Results
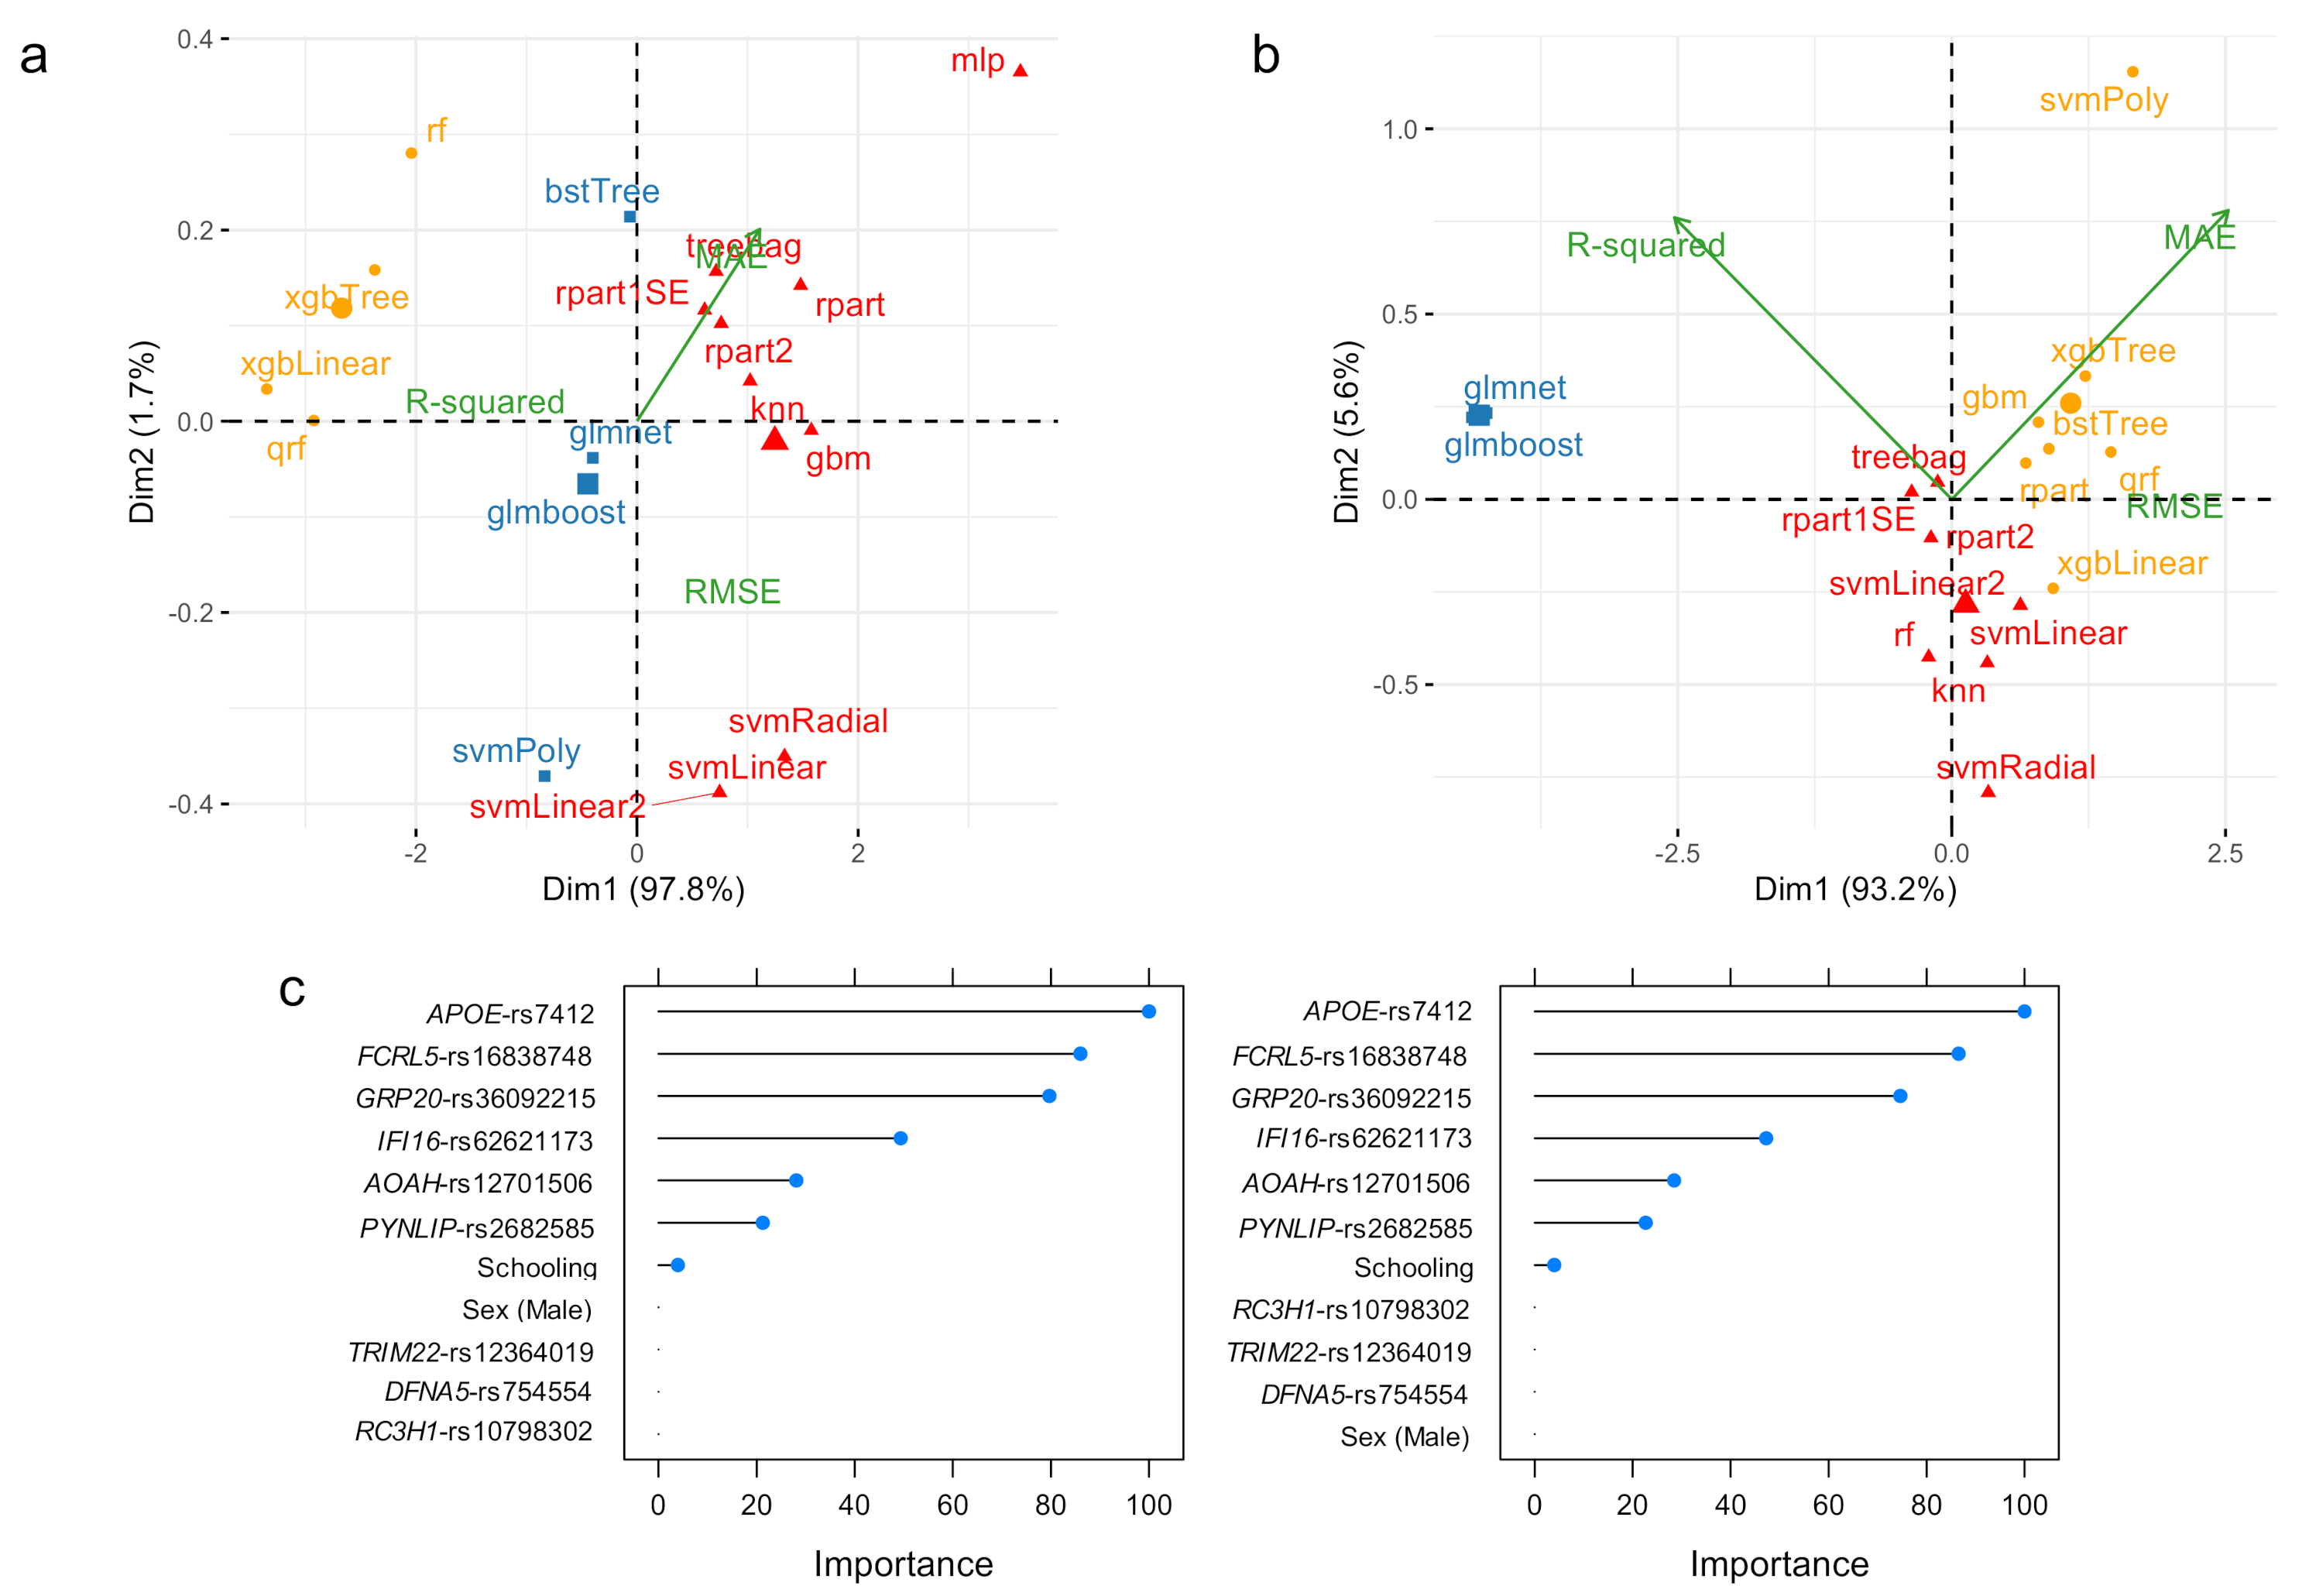
3.1. ADAOO Prediction in the fAD E280A Pedigree
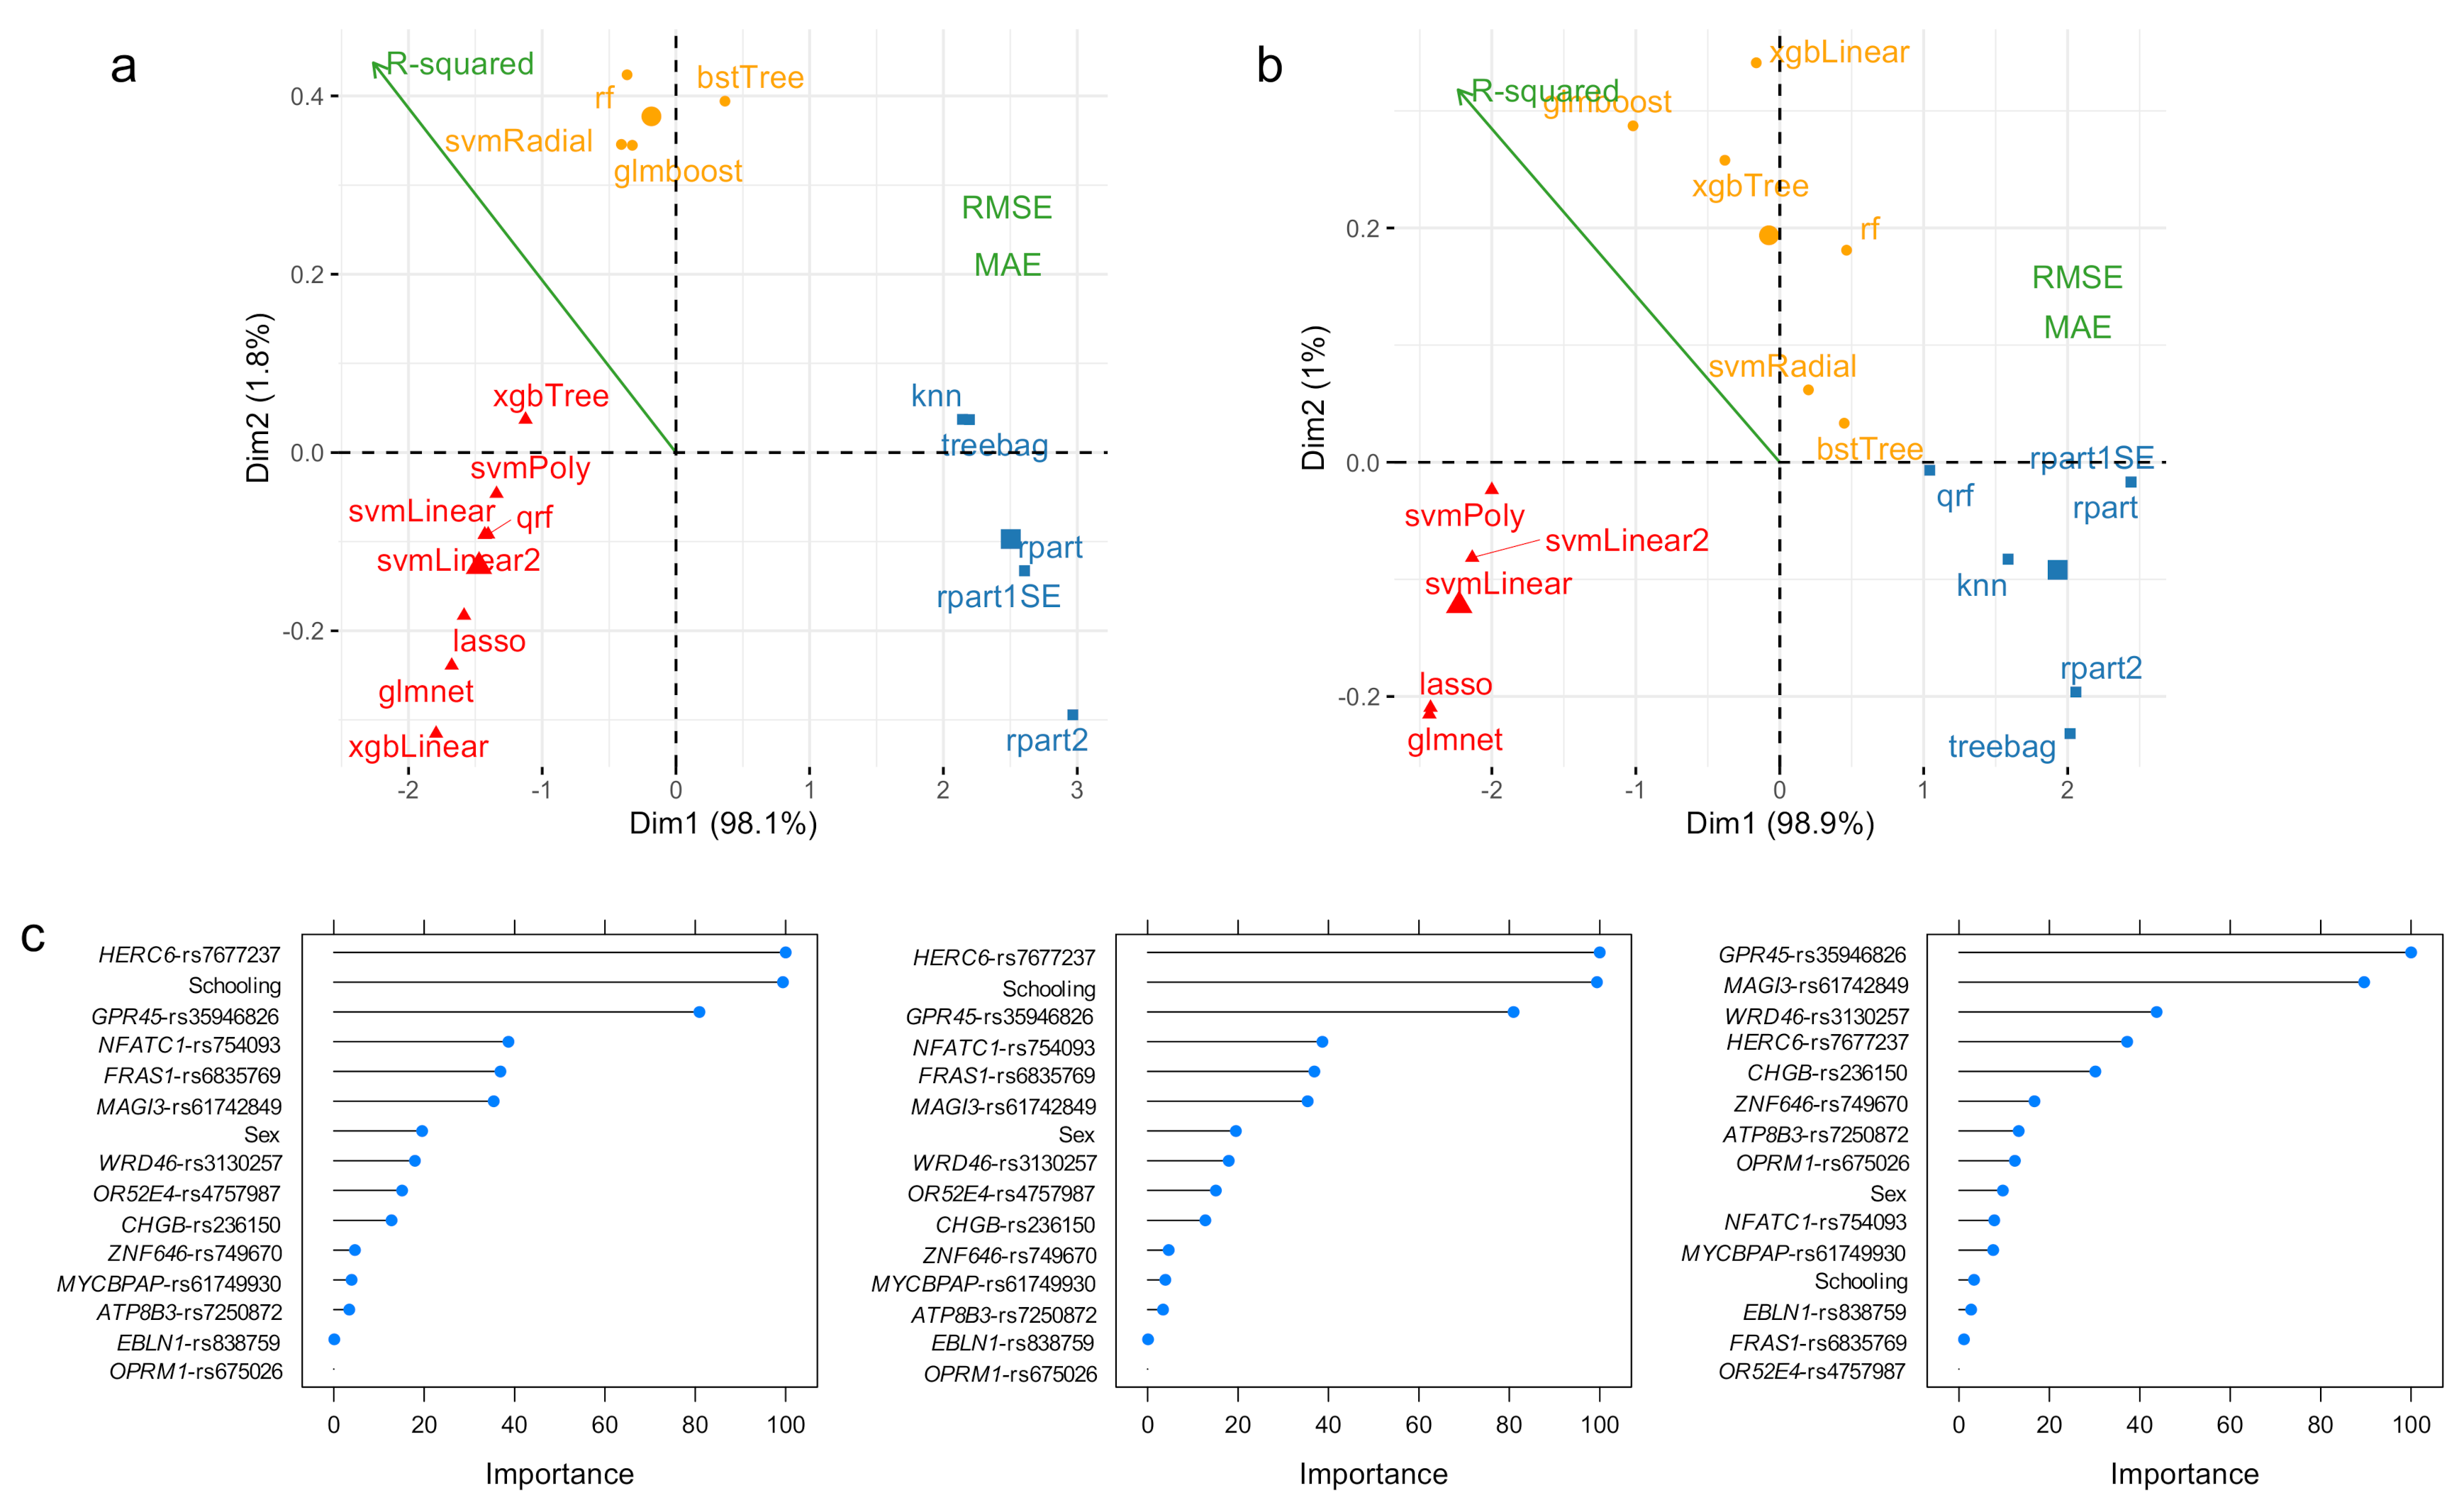
3.2. ADAOO Prediction in the Sporadic AD
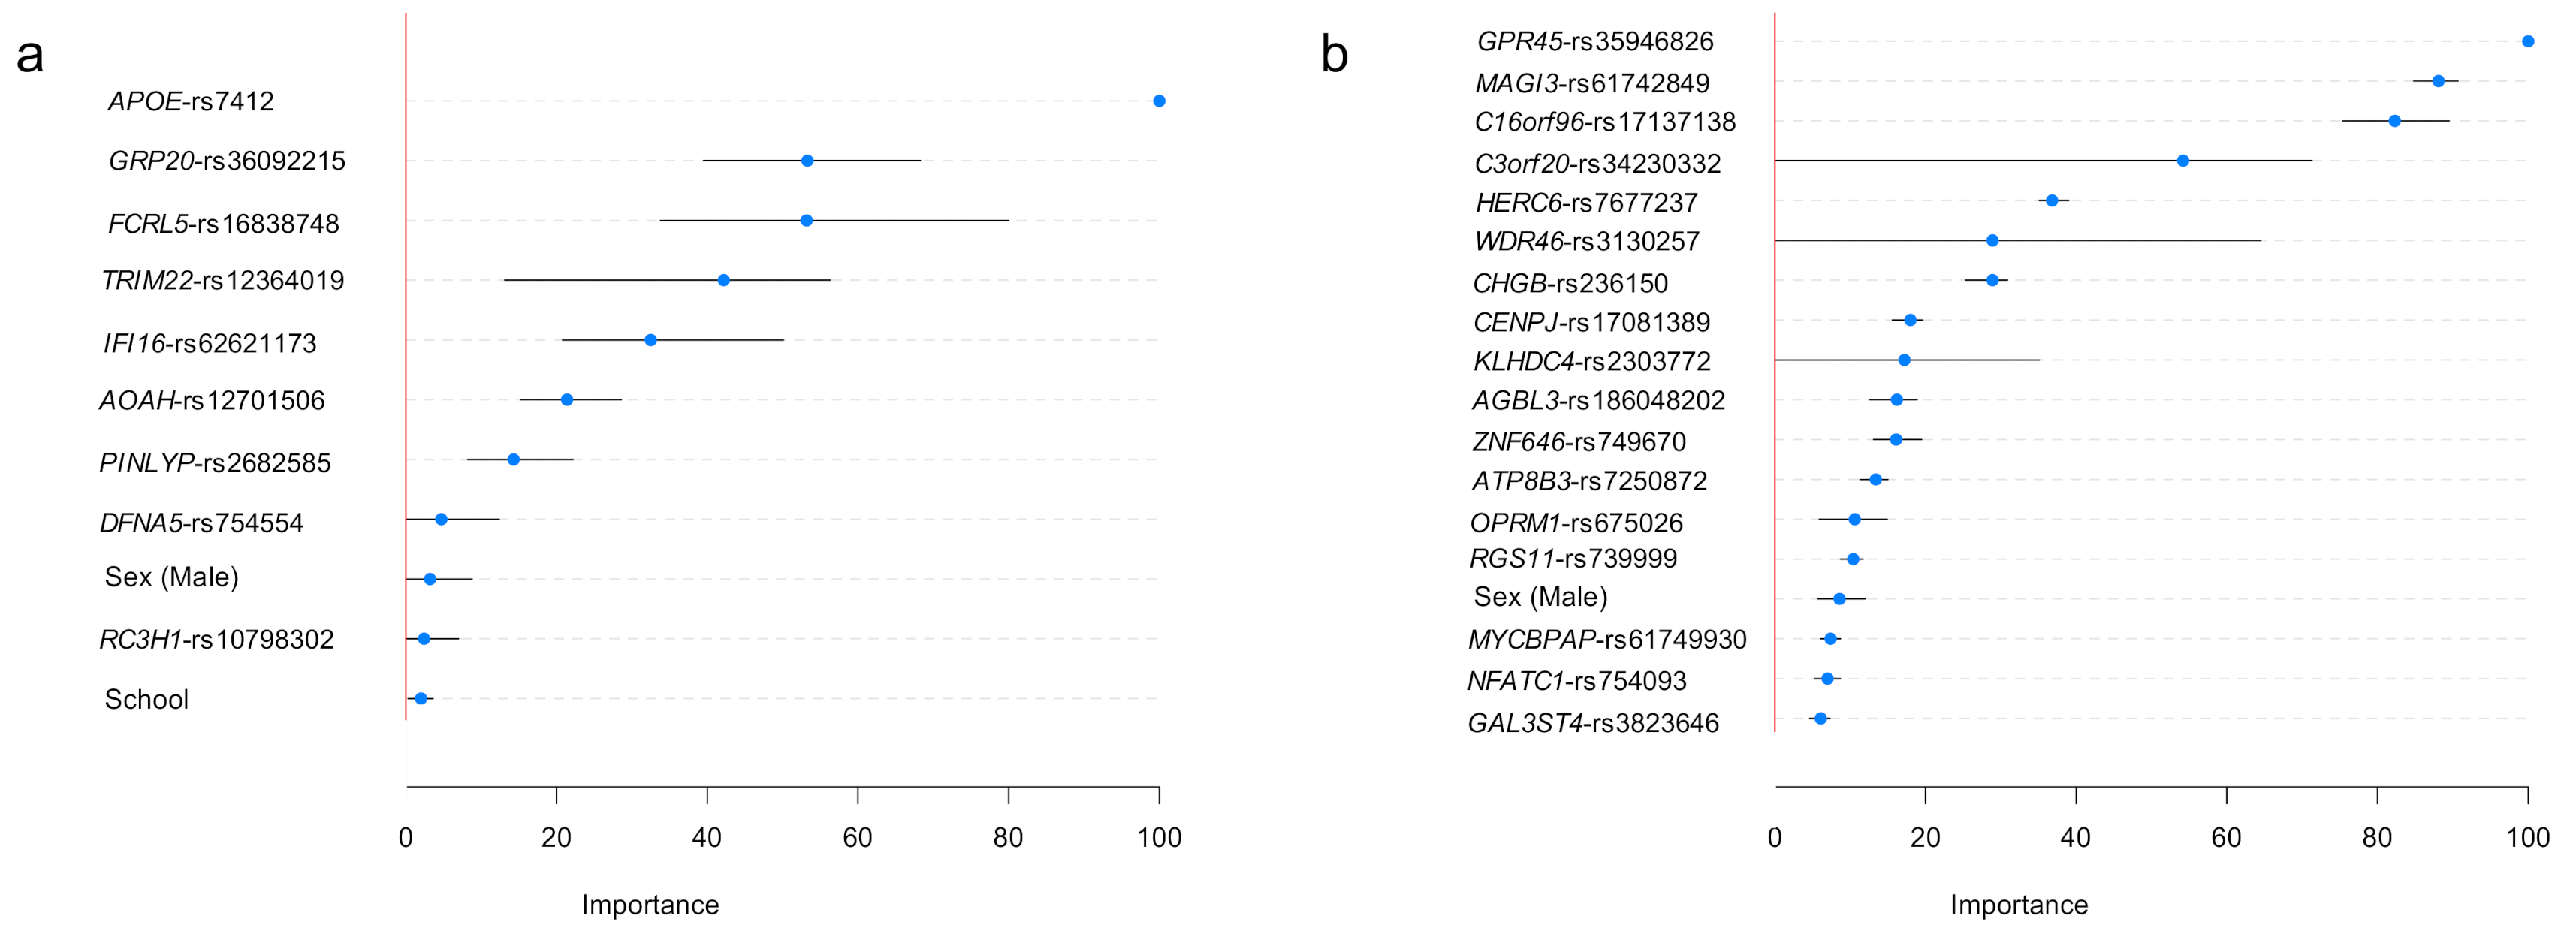
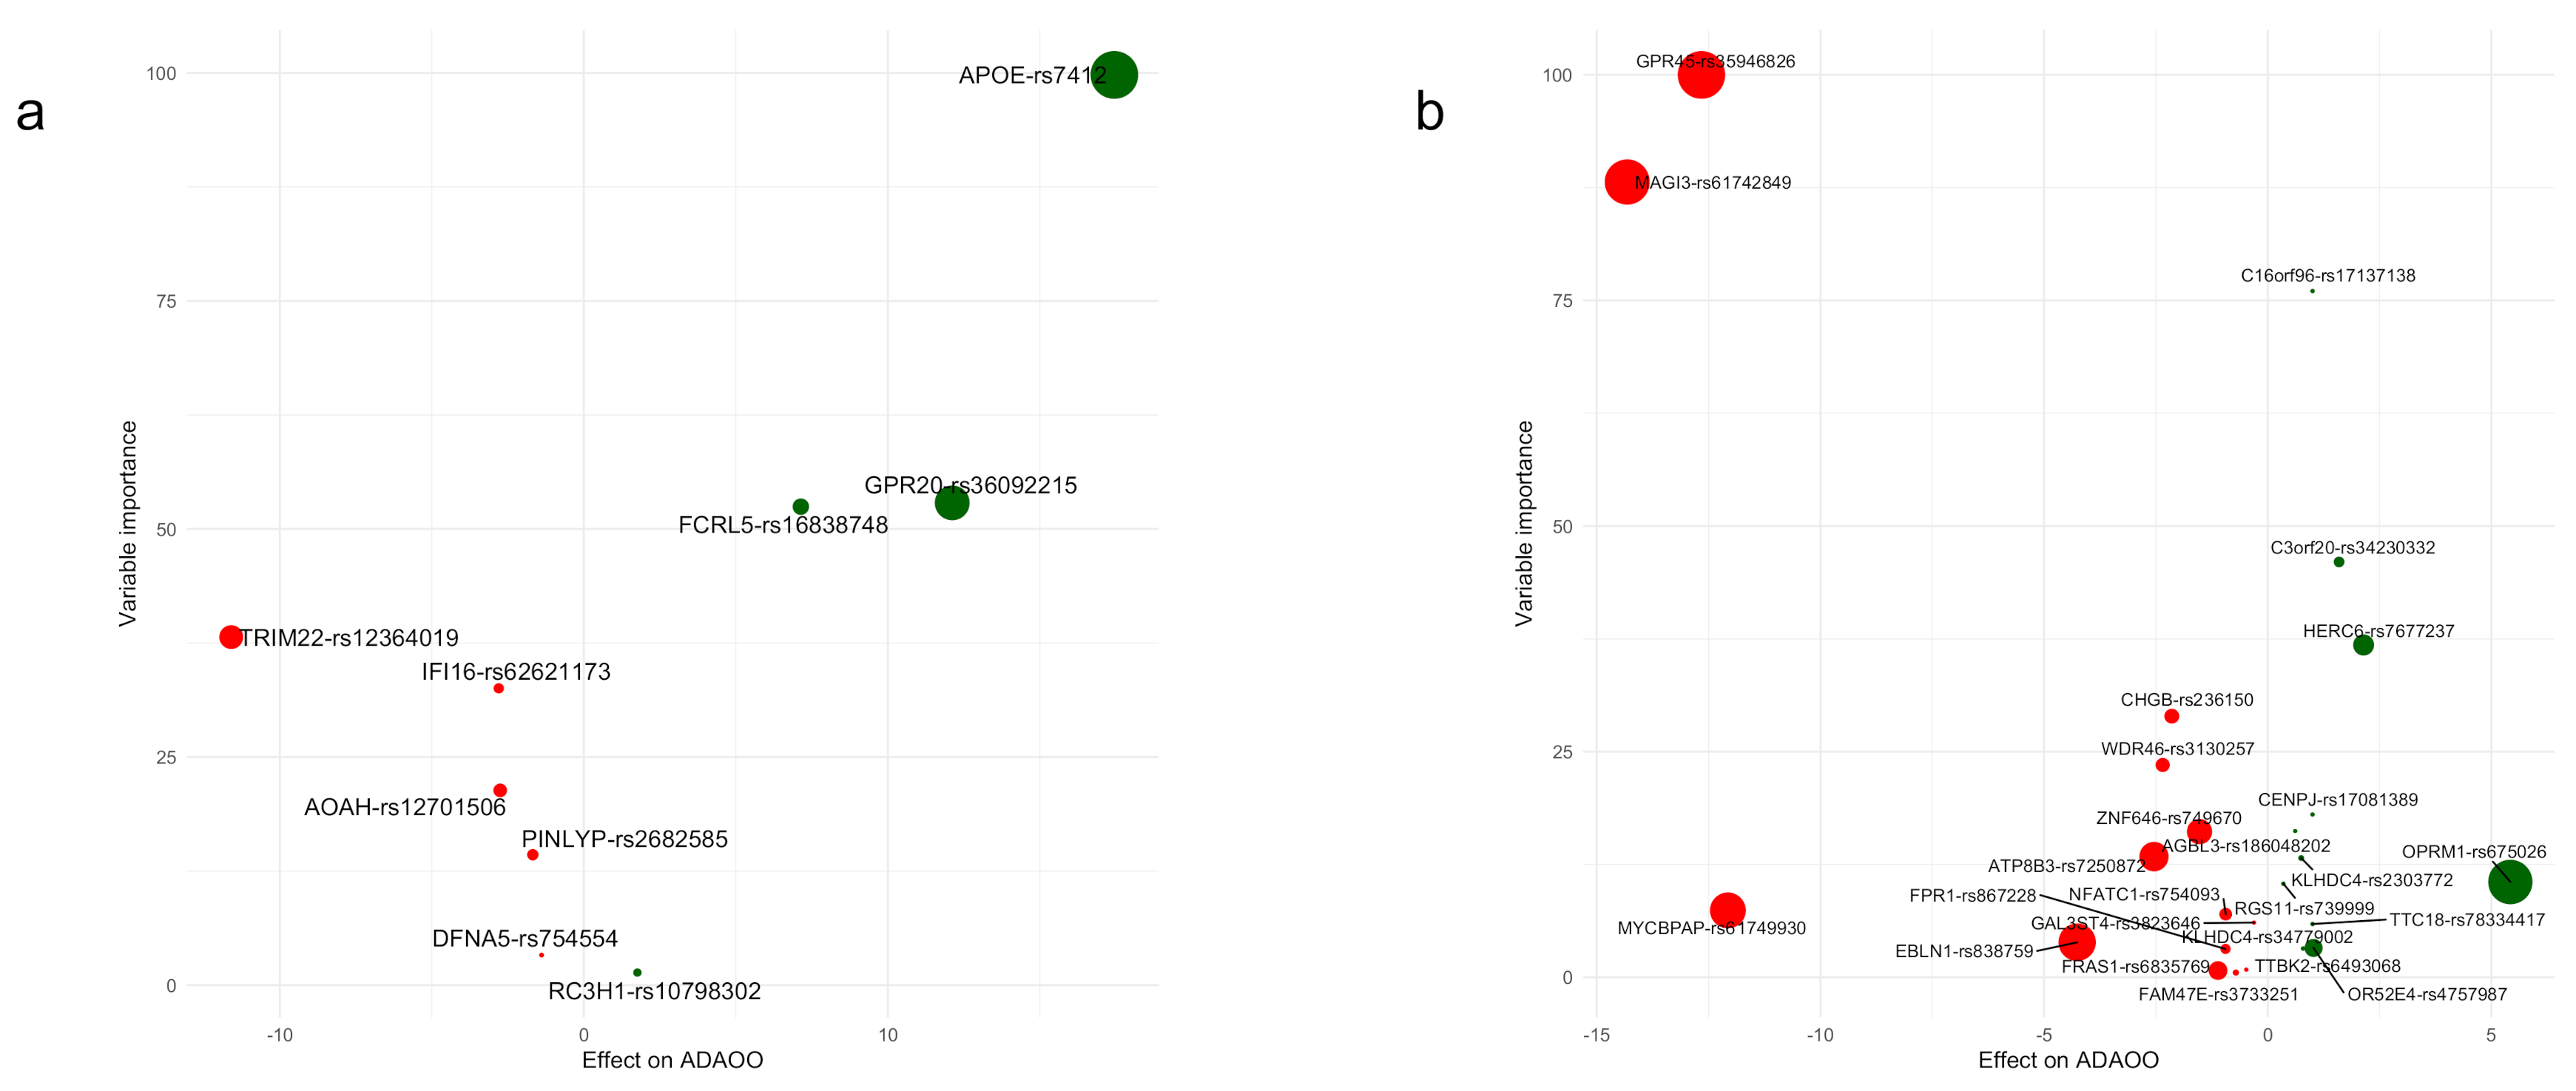
3.3. Variable Importance: Stability and Relationship with
4. Discussion
Supplementary Materials
Author Contributions
Funding
Institutional Review Board Statement
Informed Consent Statement
Data Availability Statement
Acknowledgments
Conflicts of Interest
References
- Caruso, A.; Nicoletti, F.; Mango, D.; Saidi, A.; Orlando, R.; Scaccianoce, S. Stress as risk factor for Alzheimer’s disease. Pharmacol. Res. 2018, 132, 130–134. [Google Scholar] [CrossRef]
- Fonteijn, H.M.; Modat, M.; Clarkson, M.J.; Barnes, J.; Lehmann, M.; Hobbs, N.Z.; Scahill, R.I.; Tabrizi, S.J.; Ourselin, S.; Fox, N.C.; et al. An event-based model for disease progression and its application in familial Alzheimer’s disease and Huntington’s disease. Neuroimage 2012, 60, 1880–1889. [Google Scholar] [CrossRef] [PubMed]
- Ghanemi, A. Alzheimer’s disease therapies: Selected advances and future perspectives. Alex. J. Med. 2015, 51, 1–3. [Google Scholar] [CrossRef] [Green Version]
- Sancesario, G.M.; Bernardini, S. Alzheimer’s disease in the omics era. Clin. Biochem. 2018, 59, 9–16. [Google Scholar] [CrossRef]
- Barber, I.S.; Braae, A.; Clement, N.; Patel, T.; Guetta-Baranes, T.; Brookes, K.; Medway, C.; Chappell, S.; Guerreiro, R.; Bras, J.; et al. Mutation analysis of sporadic early-onset Alzheimer’s disease using the NeuroX array. Neurobiol. Aging 2017, 49, 215-e1. [Google Scholar] [CrossRef] [Green Version]
- Bialopiotrowicz, E.; Kuzniewska, B.; Kachamakova-Trojanowska, N.; Barcikowska, M.; Kuznicki, J.; Wojda, U. Cell cycle regulation distinguishes lymphocytes from sporadic and familial Alzheimer’s disease patients. Neurobiol. Aging 2011, 32, 2319-e13. [Google Scholar] [CrossRef] [PubMed]
- Cruchaga, C.; Del-Aguila, J.L.; Saef, B.; Black, K.; Fernandez, M.V.; Budde, J.; Ibanez, L.; Deming, Y.; Kapoor, M.; Tosto, G.; et al. Polygenic risk score of sporadic late-onset Alzheimer’s disease reveals a shared architecture with the familial and early-onset forms. Alzheimer’s Dement. 2018, 14, 205–214. [Google Scholar] [CrossRef]
- Reiman, E.M.; Langbaum, J.B.; Tariot, P.N.; Lopera, F.; Bateman, R.J.; Morris, J.C.; Sperling, R.A.; Aisen, P.S.; Roses, A.D.; Welsh-Bohmer, K.A.; et al. CAP-advancing the evaluation of preclinical Alzheimer disease treatments. Nat. Rev. Neurol. 2016, 12, 56. [Google Scholar] [CrossRef] [Green Version]
- Feigin, V.L.; Nichols, E.; Alam, T.; Bannick, M.S.; Beghi, E.; Blake, N.; Culpepper, W.J.; Dorsey, E.R.; Elbaz, A.; Ellenbogen, R.G.; et al. Global, regional, and national burden of neurological disorders, 1990–2016: A systematic analysis for the Global Burden of Disease Study 2016. Lancet Neurol. 2019, 18, 459–480. [Google Scholar] [CrossRef] [Green Version]
- Prince, M.; Bryce, R.; Albanese, E.; Wimo, A.; Ribeiro, W.; Ferri, C.P. The global prevalence of dementia: A systematic review and metaanalysis. Alzheimer’s Dement. 2013, 9, 63–75. [Google Scholar] [CrossRef]
- Wimo, A.; Guerchet, M.; Ali, G.C.; Wu, Y.T.; Prina, A.M.; Winblad, B.; Jönsson, L.; Liu, Z.; Prince, M. The worldwide costs of dementia 2015 and comparisons with 2010. Alzheimer’s Dement. 2017, 13, 1–7. [Google Scholar] [CrossRef] [PubMed]
- Association, A. 2018 Alzheimer’s disease facts and figures. Alzheimer’s Dement. 2018, 14, 367–429. [Google Scholar] [CrossRef]
- Dubois, B.; Feldman, H.H.; Jacova, C.; Cummings, J.L.; DeKosky, S.T.; Barberger-Gateau, P.; Delacourte, A.; Frisoni, G.; Fox, N.C.; Galasko, D.; et al. Revising the definition of Alzheimer’s disease: A new lexicon. Lancet Neurol. 2010, 9, 1118–1127. [Google Scholar] [CrossRef]
- Musardo, S.; Marcello, E. Synaptic dysfunction in Alzheimer’s disease: From the role of amyloid β-peptide to the α-secretase ADAM10. Eur. J. Pharmacol. 2017, 817, 30–37. [Google Scholar] [CrossRef] [PubMed]
- Selkoe, D.J.; Hardy, J. The amyloid hypothesis of Alzheimer’s disease at 25 years. EMBO Mol. Med. 2016, 8, 595–608. [Google Scholar] [CrossRef] [PubMed]
- Dorfman, V.B.; Pasquini, L.; Riudavets, M.; López-Costa, J.J.; Villegas, A.; Troncoso, J.C.; Lopera, F.; Castaño, E.M.; Morelli, L. Differential cerebral deposition of IDE and NEP in sporadic and familial Alzheimer’s disease. Neurobiol. Aging 2010, 31, 1743–1757. [Google Scholar] [CrossRef] [PubMed] [Green Version]
- Haass, C.; De Strooper, B. The presenilins in Alzheimer’s disease—Proteolysis holds the key. Science 1999, 286, 916–919. [Google Scholar] [CrossRef] [PubMed]
- Jiao, B.; Tang, B.; Liu, X.; Xu, J.; Wang, Y.; Zhou, L.; Zhang, F.; Yan, X.; Zhou, Y.; Shen, L. Mutational analysis in early-onset familial Alzheimer’s disease in Mainland China. Neurobiol. Aging 2014, 35, 1957-e1. [Google Scholar] [CrossRef]
- Yuan, X.Z.; Sun, S.; Tan, C.C.; Yu, J.T.; Tan, L. The Role of ADAM10 in Alzheimer’s Disease. J. Alzheimer’s Dis. 2017, 58, 303–322. [Google Scholar] [CrossRef] [PubMed]
- Xu, W.; Tan, L.; Yu, J.T. The Role of PICALM in Alzheimer’s Disease. Mol. Neurobiol. 2015, 52, 399–413. [Google Scholar] [CrossRef] [PubMed]
- Baig, S.; Joseph, S.A.; Tayler, H.; Abraham, R.; Owen, M.J.; Williams, J.; Kehoe, P.G.; Love, S. Distribution and expression of picalm in alzheimer disease. J. Neuropathol. Exp. Neurol. 2010, 69, 1071–1077. [Google Scholar] [CrossRef] [Green Version]
- Cruchaga, C.; Karch, C.M.; Jin, S.C.; Benitez, B.A.; Cai, Y.; Guerreiro, R.; Harari, O.; Norton, J.; Budde, J.; Bertelsen, S.; et al. Rare coding variants in the phospholipase D3 gene confer risk for Alzheimer’s disease. Nature 2014, 505, 550–554. [Google Scholar] [CrossRef] [PubMed] [Green Version]
- Hooli, B.V.; Lill, C.M.; Mullin, K.; Qiao, D.; Lange, C.; Bertram, L.; Tanzi, R.E. PLD3 gene variants and Alzheimer’s disease. Nature 2015, 520, E7–E8. [Google Scholar] [CrossRef]
- Ulland, T.K.; Colonna, M. TREM2—A key player in microglial biology and Alzheimer disease. Nat. Rev. Neurol. 2018, 14, 667–675. [Google Scholar] [CrossRef] [PubMed]
- Carmona, S.; Zahs, K.; Wu, E.; Dakin, K.; Bras, J.; Guerreiro, R. The role of TREM2 in Alzheimer’s disease and other neurodegenerative disorders. Lancet Neurol. 2018, 17, 721–730. [Google Scholar] [CrossRef]
- Gratuze, M.; Leyns, C.E.G.; Holtzman, D.M. New insights into the role of TREM2 in Alzheimer’s disease. Mol. Neurodegener. 2018, 13, 1–16. [Google Scholar] [CrossRef] [Green Version]
- Wetzel-Smith, M.K.; Hunkapiller, J.; Bhangale, T.R.; Srinivasan, K.; Maloney, J.A.; Atwal, J.K.; Sa, S.M.; Yaylaoglu, M.B.; Foreman, O.; Ortmann, W.; et al. A rare mutation in UNC5C predisposes to late-onset Alzheimer’s disease and increases neuronal cell death. Nat. Med. 2014, 20, 1452–1457. [Google Scholar] [CrossRef] [PubMed] [Green Version]
- Piaceri, I.; Nacmias, B.; Sorbi, S. Genetics of familial and sporadic Alzheimer’s disease. Front. Biosci. 2013, 5, 167–177. [Google Scholar] [CrossRef] [Green Version]
- Vélez, J.I.; Chandrasekharappa, S.C.; Henao, E.; Martinez, A.F.; Harper, U.; Jones, M.; Solomon, B.D.; Lopez, L.; Garcia, G.; Aguirre-Acevedo, D.C.; et al. Pooling/bootstrap-based GWAS (pbGWAS) identifies new loci modifying the age of onset in PSEN1 p.Glu280Ala Alzheimer’s disease. Mol. Psychiatry 2013, 18, 568–575. [Google Scholar] [CrossRef] [Green Version]
- Vélez, J.I.; Lopera, F.; Creagh, P.K.; Piñeros, L.B.; Das, D.; Cervantes-Henríquez, M.L.; Acosta-López, J.E.; Isaza-Ruget, M.A.; Espinosa, L.G.; Easteal, S.; et al. Targeting Neuroplasticity, Cardiovascular, and Cognitive-Associated Genomic Variants in Familial Alzheimer’s Disease. Mol. Neurobiol. 2019, 56, 3235–3243. [Google Scholar] [CrossRef] [Green Version]
- Vélez, J.I.; Lopera, F.; Patel, H.R.; Johar, A.S.; Cai, Y.; Rivera, D.; Tobón, C.; Villegas, A.; Sepulveda-Falla, D.; Lehmann, S.G.; et al. Mutations modifying sporadic Alzheimer’s disease age of onset. Am. J. Med. Genet. Part B Neuropsychiatr. Genet. 2016, 171, 1116–1130. [Google Scholar] [CrossRef] [PubMed]
- Vélez, J.I.; Lopera, F.; Sepulveda-Falla, D.; Patel, H.R.; Johar, A.S.; Chuah, A.; Tobón, C.; Rivera, D.; Villegas, A.; Cai, Y.; et al. APOE∗E2 allele delays age of onset in PSEN1 E280A Alzheimer’s disease. Mol. Psychiatry 2016, 21, 916–924. [Google Scholar] [CrossRef] [PubMed] [Green Version]
- Vélez, J.I.; Lopera, F.; Silva, C.T.; Villegas, A.; Espinosa, L.G.; Vidal, O.M.; Mastronardi, C.A.; Arcos-Burgos, M. Familial Alzheimer’s Disease and Recessive Modifiers. Mol. Neurobiol. 2020, 57, 1035–1043. [Google Scholar] [CrossRef] [Green Version]
- Vélez, J.I.; Rivera, D.; Mastronardi, C.A.; Patel, H.R.; Tobón, C.; Villegas, A.; Cai, Y.; Easteal, S.; Lopera, F.; Arcos-Burgos, M.A. Mutation in DAOA Modifies the Age of Onset in PSEN1 E280A Alzheimer’s Disease. Neural. Plast. 2016. [Google Scholar] [CrossRef] [Green Version]
- Naj, A.C.; Schellenberg, G.D. Genomic variants, genes, and pathways of Alzheimer’s disease: An overview. Am. J. Med. Genet. Part B Neuropsychiatr. Genet. 2017, 174, 5–26. [Google Scholar] [CrossRef]
- Reitz, C.; Mayeux, R. Use of genetic variation as biomarkers for alzheimer’s disease. Proc. Ann. N. Y. Acad. Sci. 2009, 1180, 75. [Google Scholar] [CrossRef] [Green Version]
- Acosta-Baena, N.; Sepulveda-Falla, D.; Lopera-Gómez, C.M.; Jaramillo-Elorza, M.C.; Moreno, S.; Aguirre-Acevedo, D.C.; Saldarriaga, A.; Lopera, F. Pre-dementia clinical stages in presenilin 1 E280A familial early-onset Alzheimer’s disease: A retrospective cohort study. Lancet Neurol. 2011, 10, 213–220. [Google Scholar] [CrossRef]
- Braak, H.; Del Tredici, K. Where, when, and in what form does sporadic Alzheimer’s disease begin? Curr. Opin. Neurol. 2012, 25, 708–714. [Google Scholar] [CrossRef] [PubMed]
- Lopera, F.; Ardilla, A.; Martínez, A.; Madrigal, L.; Arango-Viana, J.C.; Lemere, C.A.; Arango-Lasprilla, J.C.; Hincapié, L.; Arcos-Burgos, M.; Ossa, J.E.; et al. Clinical features of early-onset Alzheimer disease in a large kindred with an E280A presenilin-1 mutation. J. Am. Med. Assoc. 1997, 277, 793–799. [Google Scholar] [CrossRef]
- Kessler, R.C.; Angermeyer, M.; Anthony, J.C.; DE Graaf, R.; Demyttenaere, K.; Gasquet, I.; DE Girolamo, G.; Gluzman, S.; Gureje, O.; Haro, J.M.; et al. Lifetime prevalence and age-of-onset distributions of mental disorders in the World Health Organization’s World Mental Health Survey Initiative. World Psychiatry 2007, 6, 168. [Google Scholar]
- Kessler, R.C.; Amminger, G.P.; Aguilar-Gaxiola, S.; Alonso, J.; Lee, S.; Üstün, T.B. Age of onset of mental disorders: A review of recent literature. Curr. Opin. Psychiatry 2007, 20, 359. [Google Scholar] [CrossRef]
- Beyer, K.; Lao, J.I.; Latorre, P.; Ariza, A. Age at onset: An essential variable for the definition of genetic risk factors for sporadic Alzheimer’s disease. Ann. N. Y. Acad. Sci. 2005, 1057, 260–278. [Google Scholar] [CrossRef] [PubMed]
- Kamboh, M.I.; Barmada, M.M.; Demirci, F.Y.; Minster, R.L.; Carrasquillo, M.M.; Pankratz, V.S.; Younkin, S.G.; Saykin, A.J.; Sweet, R.A.; Feingold, E.; et al. Genome-wide association analysis of age-at-onset in Alzheimer’s disease. Mol. Psychiatry 2012, 17, 1340–1346. [Google Scholar] [CrossRef] [Green Version]
- Naj, A.C.; Jun, G.; Reitz, C.; Kunkle, B.W.; Perry, W.; Park, Y.S.; Beecham, G.W.; Rajbhandary, R.A.; Hamilton-Nelson, K.L.; Wang, L.S.; et al. Effects of multiple genetic loci on age at onset in late-onset Alzheimer disease: A genome-wide association study. JAMA Neurol. 2014, 71, 1394–1404. [Google Scholar] [CrossRef] [Green Version]
- Arcos-Burgos, M.; Muenke, M. Genetics of population isolates. Clin. Genet. 2002, 61, 233–247. [Google Scholar] [CrossRef]
- Bravo, M.L.; Valenzuela, C.Y.; Arcos-Burgos, O.M. Polymorphisms and phyletic relationships of the Paisa community from Antioquia (Colombia). Gene Geogr. Comput. Bull. Hum. Gene Freq. 1996, 10, 11–17. [Google Scholar]
- Kuhn, M. Package ‘caret’—Classification and Regression Training. R Package Version 6.0-86. 2020. Available online: https://cran.r-project.org/package=caret (accessed on 21 January 2021).
- Kuhn, M. Building predictive models in R using the caret package. J. Stat. Softw. 2008, 28, 1–26. [Google Scholar] [CrossRef] [Green Version]
- Hall, A.; Pekkala, T.; Polvikoski, T.; van Gils, M.; Kivipelto, M.; Lötjönen, J.; Mattila, J.; Kero, M.; Myllykangas, L.; Mäkelä, M.; et al. Prediction models for dementia and neuropathology in the oldest old: The Vantaa 85+ cohort study. Alzheimer’s Res. Ther. 2019, 11, 1–12. [Google Scholar] [CrossRef] [PubMed] [Green Version]
- Qiu, R.G.; Qiu, J.L.; Badr, Y. Predictive modeling of the severity/progression of Alzheimer’s diseases. In Proceedings of the 2017 IEEE International Conference on Grey Systems and Intelligent Services (GSIS 2017), Stockholm, Sweden, 8–11 August 2017. [Google Scholar]
- Wang, T.; Qiu, R.G.; Yu, M. Predictive Modeling of the Progression of Alzheimer’s Disease with Recurrent Neural Networks. Sci. Rep. 2018, 8, 9161. [Google Scholar] [CrossRef] [PubMed] [Green Version]
- Nori, V.S.; Hane, C.A.; Crown, W.H.; Au, R.; Burke, W.J.; Sanghavi, D.M.; Bleicher, P. Machine learning models to predict onset of dementia: A label learning approach. Alzheimer’s Dement. Transl. Res. Clin. Interv. 2019, 5, 918–925. [Google Scholar] [CrossRef] [PubMed]
- Porto, A.; Peralta, J.M.; Blackburn, N.B.; Blangero, J. Reliability of genomic predictions of complex human phenotypes. BMC Proc. 2018, 12, 157–161. [Google Scholar] [CrossRef]
- Spiliopoulou, A.; Nagy, R.; Bermingham, M.L.; Huffman, J.E.; Hayward, C.; Vitart, V.; Rudan, I.; Campbell, H.; Wright, A.F.; Wilson, J.F.; et al. Genomic prediction of complex human traits: Relatedness, trait architecture and predictive meta-models. Hum. Mol. Genet. 2015, 24, 4167–4182. [Google Scholar] [CrossRef] [Green Version]
- Dey, A. Machine Learning Algorithms: A Review. Int. J. Comput. Sci. Inf. Technol. 2016, 7, 1174–1179. [Google Scholar]
- Dhall, D.; Kaur, R.; Juneja, M. Machine learning: A review of the algorithms and its applications. Proc. ICRIC 2020, 2019, 47–63. [Google Scholar]
- Shatte, A.B.R.; Hutchinson, D.M.; Teague, S.J. Machine learning in mental health: A scoping review of methods and applications. Psychol. Med. 2019, 49, 1426–1448. [Google Scholar] [CrossRef] [PubMed] [Green Version]
- Stamate, D.; Kim, M.; Proitsi, P.; Westwood, S.; Baird, A.; Nevado-Holgado, A.; Hye, A.; Bos, I.; Vos, S.J.B.; Vandenberghe, R.; et al. A metabolite-based machine learning approach to diagnose Alzheimer-type dementia in blood: Results from the European Medical Information Framework for Alzheimer disease biomarker discovery cohort. Alzheimer’s Dement. Transl. Res. Clin. Interv. 2019, 5, 933–938. [Google Scholar] [CrossRef]
- Bryan, R.N. Machine learning applied to Alzheimer disease. Radiology 2016. [Google Scholar] [CrossRef] [PubMed] [Green Version]
- Fisher, C.K.; Smith, A.M.; Walsh, J.R.; Simon, A.J.; Edgar, C.; Jack, C.R.; Holtzman, D.; Russell, D.; Hill, D.; Grosset, D.; et al. Machine learning for comprehensive forecasting of Alzheimer’s Disease progression. Sci. Rep. 2019, 9, 1–14. [Google Scholar]
- Liu, L.; Zhao, S.; Chen, H.; Wang, A. A new machine learning method for identifying Alzheimer’s disease. Simul. Model. Pract. Theory 2020, 99, 102023. [Google Scholar] [CrossRef]
- Fulton, L.V.; Dolezel, D.; Harrop, J.; Yan, Y.; Fulton, C.P. Classification of alzheimer’s disease with and without imagery using gradient boosted machines and resnet-50. Brain Sci. 2019, 9, 212. [Google Scholar] [CrossRef] [Green Version]
- Khan, A.; Usman, M. Early diagnosis of Alzheimer’s disease using machine learning techniques: A review paper. In Proceedings of the 7th International Joint Conference on Knowledge Discovery, Knowledge Engineering and Knowledge Management (IC3K 2015), Lisbon, Portugal, 12–14 November 2015. [Google Scholar]
- Londono, A.C.; Castellanos, F.X.; Arbelaez, A.; Ruiz, A.; Aguirre-Acevedo, D.C.; Richardson, A.M.; Easteal, S.; Lidbury, B.A.; Arcos-Burgos, M.; Lopera, F. An 1H-MRS framework predicts the onset of Alzheimer’s disease symptoms in PSEN1 mutation carriers. Alzheimer’s Dement. 2014, 10, 552–561. [Google Scholar] [CrossRef]
- De Velasco Oriol, J.; Vallejo, E.E.; Estrada, K.; Taméz Peña, J.G.; The Alzheimer’s Disease Neuroimaging Initiative. Benchmarking machine learning models for late-onset Alzheimer’s disease prediction from genomic data. BMC Bioinform. 2019, 20, 1–17. [Google Scholar] [CrossRef]
- Palmqvist, S.; Janelidze, S.; Quiroz, Y.T.; Zetterberg, H.; Lopera, F.; Stomrud, E.; Su, Y.; Chen, Y.; Serrano, G.E.; Leuzy, A.; et al. Discriminative Accuracy of Plasma Phospho-tau217 for Alzheimer Disease vs Other Neurodegenerative Disorders. JAMA J. Am. Med. Assoc. 2020, 324, 772–781. [Google Scholar] [CrossRef] [PubMed]
- Grassi, M.; Perna, G.; Caldirola, D.; Schruers, K.; Duara, R.; Loewenstein, D.A. A clinically-translatable machine learning algorithm for the prediction of Alzheimer’s disease conversion in individuals with mild and premild cognitive impairment. J. Alzheimer’s Dis. 2018, 61, 1555–1573. [Google Scholar] [CrossRef] [PubMed]
- Moradi, E.; Pepe, A.; Gaser, C.; Huttunen, H.; Tohka, J. Machine learning framework for early MRI-based Alzheimer’s conversion prediction in MCI subjects. Neuroimage 2015, 104, 398–412. [Google Scholar] [CrossRef] [PubMed] [Green Version]
- Ezzati, A.; Zammit, A.R.; Harvey, D.J.; Habeck, C.; Hall, C.B.; Lipton, R.B. Optimizing Machine Learning Methods to Improve Predictive Models of Alzheimer’s Disease. J. Alzheimer’s Dis. 2019, 71, 1027–1036. [Google Scholar] [CrossRef] [PubMed]
- Ding, Y.; Sohn, J.H.; Kawczynski, M.G.; Trivedi, H.; Harnish, R.; Jenkins, N.W.; Lituiev, D.; Copeland, T.P.; Aboian, M.S.; Aparici, C.M.; et al. A deep learning model to predict a diagnosis of Alzheimer disease by using 18 F-FDG PET of the brain. Radiology 2019, 290, 456–464. [Google Scholar] [CrossRef]
- Jo, T.; Nho, K.; Saykin, A.J. Deep Learning in Alzheimer’s Disease: Diagnostic Classification and Prognostic Prediction Using Neuroimaging Data. Front. Aging Neurosci. 2019, 11, 220. [Google Scholar] [CrossRef] [Green Version]
- Fleisher, A.S.; Chen, K.; Quiroz, Y.T.; Jakimovich, L.J.; Gomez, M.G.; Langois, C.M.; Langbaum, J.B.S.; Ayutyanont, N.; Roontiva, A.; Thiyyagura, P.; et al. Florbetapir PET analysis of amyloid-β deposition in the presenilin 1 E280A autosomal dominant Alzheimer’s disease kindred: A cross-sectional study. Lancet Neurol. 2012, 11, 1057–1065. [Google Scholar] [CrossRef] [Green Version]
- Reiman, E.M.; Langbaum, J.B.S.; Fleisher, A.S.; Caselli, R.J.; Chen, K.; Ayutyanont, N.; Quiroz, Y.T.; Kosik, K.S.; Lopera, F.; Tariot, P.N. Alzheimers prevention initiative: A plan to accelerate the evaluation of presymptomatic treatments. J. Alzheimer’s Dis. 2011, 26 (Suppl. S3), 321–329. [Google Scholar] [CrossRef]
- Reiman, E.M.; Quiroz, Y.T.; Fleisher, A.S.; Chen, K.; Velez-Pardo, C.; Jimenez-Del-Rio, M.; Fagan, A.M.; Shah, A.R.; Alvarez, S.; Arbelaez, A.; et al. Brain imaging and fluid biomarker analysis in young adults at genetic risk for autosomal dominant Alzheimer’s disease in the presenilin 1 E280A kindred: A case-control study. Lancet Neurol. 2012, 11, 1048–1056. [Google Scholar] [CrossRef] [Green Version]
- Petersen, R.C.; Smith, G.E.; Waring, S.C.; Ivnik, R.J.; Tangalos, E.G.; Kokmen, E. Mild cognitive impairment: Clinical characterization and outcome. Arch. Neurol. 1999, 56, 303–308. [Google Scholar] [CrossRef]
- Aguirre-Acevedo, D.C.; Jaimes-Barragán, F.; Henao, E.; Tirado, V.; Muñoz, C.; Reiman, E.M.; Tariot, P.N.; Langbaum, J.B.; Lopera, F. Diagnostic accuracy of CERAD total score in a Colombian cohort with mild cognitive impairment and Alzheimer’s disease affected by E280A mutation on presenilin-1 gene. Int. Psychogeriatr. 2016, 28, 503. [Google Scholar] [CrossRef] [PubMed]
- American Psychiatric Association. Diagnostic and Statistical Manual of Mental Disorders, 4th ed.; American Psychiatric Association: Washington, DC, USA, 2000. [Google Scholar]
- Segura, V.; Vilhjálmsson, B.J.; Platt, A.; Korte, A.; Seren, Ü.; Long, Q.; Nordborg, M. An efficient multi-locus mixed-model approach for genome-wide association studies in structured populations. Nat. Genet. 2012, 44, 825. [Google Scholar] [CrossRef] [PubMed] [Green Version]
- Benjamini, Y.; Hochberg, Y. Controlling the False Discovery Rate: A Practical and Powerful Approach to Multiple Testing. J. R. Stat. Soc. Ser. B 1995, 57, 289–300. [Google Scholar] [CrossRef]
- Vélez, J.I.; Correa, J.C.; Arcos-Burgos, M. A New Method for Detecting Significant p-values with Applications to Genetic Data. Rev. Colomb. Estadística 2014, 37, 69–78. [Google Scholar] [CrossRef]
- R Core Team. R: A Language and Environment for Statistical Computing. 2021. Available online: https://www.R-project.org/ (accessed on 21 January 2021).
- MacQueen, J. Some methods for classification and analysis of multivariate observations. In Proceedings of the Fifth Berkeley Symposium on Mathematical Statistics and Probability; University of California Press: Berkeley, CA, USA, 1967. [Google Scholar]
- Ringnér, M. What is principal component analysis? Nat. Biotechnol. 2008, 26, 303–304. [Google Scholar] [CrossRef]
- Lever, J.; Krzywinski, M.; Altman, N. Points of Significance: Principal component analysis. Nat. Methods 2017, 14, 7. [Google Scholar] [CrossRef] [Green Version]
- Charrad, M.; Ghazzali, N.; Boiteau, V.; Niknafs, A. Nbclust: An R package for determining the relevant number of clusters in a data set. J. Stat. Softw. 2014, 61, 1–36. [Google Scholar] [CrossRef] [Green Version]
- Dinno, A. Paran: Horn’s Test of Principal Components/Factors. R Package Version 1.5.2. 2018. Available online: https://cran.r-project.org/web/packages/paran/index.html (accessed on 2 March 2021).
- Efron, B. Bootstrap Methods: Another Look at the Jackknife. In Breakthroughs in Statistics; Springer: New York, NY, USA, 1979. [Google Scholar]
- Efron, B.; Tibshirani, R. Bootstrap methods for standard errors, confidence intervals, and other measures of statistical accuracy. Stat. Sci. 1986, 1, 54–75. [Google Scholar] [CrossRef]
- Tenev, A.; Markovska-Simoska, S.; Kocarev, L.; Pop-Jordanov, J.; Müller, A.; Candrian, G. Machine learning approach for classification of ADHD adults. Int. J. Psychophysiol. 2014, 93, 162–166. [Google Scholar] [CrossRef] [PubMed]
- Kautzky, A.; Vanicek, T.; Philippe, C.; Kranz, G.S.; Wadsak, W.; Mitterhauser, M.; Hartmann, A.; Hahn, A.; Hacker, M.; Rujescu, D.; et al. Machine learning classification of ADHD and HC by multimodal serotonergic data. Transl. Psychiatry 2020, 10, 1–9. [Google Scholar]
- Jamal, S.; Khubaib, M.; Gangwar, R.; Grover, S.; Grover, A.; Hasnain, S.E. Artificial Intelligence and Machine learning based prediction of resistant and susceptible mutations in Mycobacterium tuberculosis. Sci. Rep. 2020, 10, 1–16. [Google Scholar]
- Goldenberg, S.L.; Nir, G.; Salcudean, S.E. A new era: Artificial intelligence and machine learning in prostate cancer. Nat. Rev. Urol. 2019, 16, 391–403. [Google Scholar] [CrossRef] [PubMed]
- Zhu, W.; Xie, L.; Han, J.; Guo, X. The application of deep learning in cancer prognosis prediction. Cancers 2020, 12, 603. [Google Scholar] [CrossRef] [PubMed] [Green Version]
- Kourou, K.; Exarchos, T.P.; Exarchos, K.P.; Karamouzis, M.V.; Fotiadis, D.I. Machine learning applications in cancer prognosis and prediction. Comput. Struct. Biotechnol. J. 2015, 13, 8–17. [Google Scholar] [CrossRef] [Green Version]
- Agrebi, S.; Larbi, A. Use of artificial intelligence in infectious diseases. In Artificial Intelligence in Precision Health; Academic Press: Cambridge, MA, USA, 2020. [Google Scholar]
- Bhardwaj, T.; Somvanshi, P. Machine learning toward infectious disease treatment. In Machine Intelligence and Signal Analysis; Springer: Singapore, 2019. [Google Scholar]
- Vidal, O.M.; Acosta-Reyes, J.; Padilla, J.; Navarro-Lechuga, E.; Bravo, E.; Viasus, D.; Arcos-Burgos, M.; Vélez, J.I. Chikungunya outbreak (2015) in the colombian caribbean: Latent classes and gender differences in virus infection. PLoS Negl. Trop. Dis. 2020, 14, e0008281. [Google Scholar] [CrossRef]
- Golriz Khatami, S.; Mubeen, S.; Hofmann-Apitius, M. Data science in neurodegenerative disease: Its capabilities, limitations, and perspectives. Curr. Opin. Neurol. 2020, 33, 249. [Google Scholar] [CrossRef]
- Mihaescu, R.; Detmar, S.B.; Cornel, M.C.; Van Der Flier, W.M.; Heutink, P.; Hol, E.M.; Rikkert, M.G.M.O.; Van Duijn, C.M.; Janssens, A.C.J.W. Translational research in genomics of Alzheimer’s disease: A review of current practice and future perspectives. J. Alzheimer’s Dis. 2010, 20, 967–980. [Google Scholar] [CrossRef] [Green Version]
- Freudenberg-Hua, Y.; Li, W.; Davies, P. The role of genetics in advancing precision medicine for Alzheimer’s Disease—A narrative review. Front. Med. 2018, 5, 108. [Google Scholar] [CrossRef] [Green Version]
- Hampel, H.; Vergallo, A.; Perry, G.; Lista, S. The Alzheimer Precision Medicine Initiative. J. Alzheimer’s Dis. 2019, 68, 1–24. [Google Scholar] [CrossRef] [PubMed]
- Collins, F.S.; Varmus, H. A new initiative on precision medicine. N. Engl. J. Med. 2015, 372, 793–795. [Google Scholar] [CrossRef] [PubMed] [Green Version]
- Sabau, M.; Bungau, S.; Buhas, C.L.; Carp, G.; Daina, L.G.; Judea-Pusta, C.T.; Buhas, B.A.; Jurca, C.M.; Daina, C.M.; Tit, D.M. Legal medicine implications in fibrinolytic therapy of acute ischemic stroke. BMC Med. Ethics 2019, 20, 1–9. [Google Scholar] [CrossRef]
- Dindelegan, C.; Faur, D.; Purza, L.; Bumbu, A.; Sabau, M. Distress in neurocognitive disorders due to Alzheimer’s disease and stroke. Exp. Ther. Med. 2020, 20, 2501–2509. [Google Scholar] [CrossRef] [PubMed]
- Bone, D.; Goodwin, M.S.; Black, M.P.; Lee, C.C.; Audhkhasi, K.; Narayanan, S. Applying Machine Learning to Facilitate Autism Diagnostics: Pitfalls and Promises. J. Autism Dev. Disord. 2015, 45, 1121–1136. [Google Scholar] [CrossRef] [PubMed] [Green Version]


| Cohort | Chr | Marker | Position a | Gene | Change | b | PFDR |
|---|---|---|---|---|---|---|---|
| E280A | 19 | rs7412 | 45,412,079 | APOE | p.Arg176Cys | 17.45 (0.48) | 2.13 × 10⁻³⁰ |
| (n = 71) | 8 | rs36092215 | 142,367,246 | GPR20 | p.Arg260Cys | 12.12 (0.54) | 6.58 × 10⁻²² |
| 11 | rs12364019 | 5,730,343 | TRIM22 | p.Arg321Lys | −11.64 (0.79) | 1.15 × 10⁻¹⁴ | |
| 1 | rs16838748 | 157,508,997 | FCRL5 | p.Asn427Lys | 7.14 (0.68) | 8.61 × 10⁻¹⁰ | |
| 7 | rs12701506 | 36,566,020 | AOAH | c | −2.75 (0.30) | 5.69 × 10⁻⁸ | |
| 19 | rs2682585 | 44,081,288 | PINLYP | p.His6Arg | −1.68 (0.21) | 1.67 × 10⁻⁶ | |
| 1 | rs62621173 | 159,021,506 | IFI16 | p.Ser512Phe | −2.80 (0.37) | 8.63 × 10⁻⁶ | |
| 1 | rs10798302 | 173,987,798 | RC3H1 | d | 1.76 (0.27) | 1.86 × 10⁻⁴ | |
| 7 | rs754554 | 24,758,818 | DFNA5 | p.Pro142Thr | −1.39 (0.28) | 3.62 × 10⁻² | |
| Sporadic | 2 | rs35946826 | 105,859,249 | GPR45 | p.Leu312fs | −12.67 (0.148) | 3.08 × 10−36 |
| (n = 54) | 1 | rs61742849 | 114,226,143 | MAGI3 | p.Gly1318fs | −14.32 (0.199) | 4.38 × 10⁻³⁴ |
| 6 | rs675026 | 154,414,563 | OPRM1 | p.Ala442fs | 5.42 (0.079) | 1.15 × 10⁻³³ | |
| 10 | rs838759 | 22,498,468 | EBLN1 | p.Gly149fs | −4.26 (0.092) | 3.90 × 10⁻²⁸ | |
| 17 | rs61749930 | 48,594,691 | MYCBPAP | p.Arg124fs | −12.08 (0.286) | 6.06 × 10⁻²⁷ | |
| 19 | rs7250872 | 1,811,603 | ATP8B3 | p.Gly45fs | −2.54 (0.088) | 9.57 × 10⁻²² | |
| 16 | rs749670 | 31,088,625 | ZNF646 | p.Lys328fs | −1.52 (0.067) | 1.35 × 10⁻¹⁸ | |
| 4 | rs7677237 | 89,306,659 | HERC6 | p.Met123fs | 2.14 (0.122) | 3.58 × 10⁻¹⁵ | |
| 4 | rs6835769 | 79,284,694 | FRAS1 | p.Ala817fs | −1.11 (0.074) | 2.74 × 10⁻¹³ | |
| 11 | rs4757987 | 5,906,205 | OR52E4 | p.Arg228fs | 1.02 (0.07) | 6.86 × 10⁻¹³ | |
| 20 | rs236150 | 5,903,141 | CHGB | p.Lys117fs | −2.14 (0.181) | 2.12 × 10⁻¹⁰ | |
| 6 | rs3130257 | 33,256,471 | WDR46 | p.Thr40fs | −2.35 (0.209) | 7.92 × 10⁻¹⁰ | |
| 18 | rs754093 | 77,246,406 | NFATC1 | p.Cys751fs | −0.94 (0.094) | 1.34 × 10⁻⁸ | |
| 3 | rs34230332 | 14,725,878 | C3orf20 | p.Leu84fs | 1.59 (0.185) | 4.81 × 10⁻⁷ | |
| 19 | rs867228 | 52,249,211 | FPR1 | p.Glu346fs | −0.94 (0.115) | 1.34 × 10⁻⁶ | |
| 4 | rs3733251 | 77,192,838 | FAM47E | p.Arg166fs | −0.71 (0.127) | 2.07 × 10⁻³ | |
| 16 | rs2303772 | 87,795,580 | KLHDC4 | p.Leu56fs | 0.75 (0.135) | 2.75 × 10⁻³ | |
| 16 | rs739999 | 319,511 | RGS11 | p.Met416fs | 0.35 (0.075) | 3.48 × 10⁻² | |
| 16 | rs34779002 | 87,782,396 | KLHDC4 | p.Gly74fs | 0.78 (0.172) | 4.00 × 10⁻² | |
| 15 | rs6493068 | 43,170,793 | TTBK2 | p.Asp9fs | −0.48 (0.107) | 4.27 × 10⁻² | |
| 16 | rs17137138 | 4,606,743 | C16orf96 | p.Val85fs | 1.00 (0.223) | 4.40 × 10⁻² | |
| 7 | rs3823646 | 99,757,612 | GAL3ST4 | p.Lys468fs | −0.31 (0.069) | 4.47 × 10⁻² | |
| 13 | rs17081389 | 25,487,001 | CENPJ | p.Pro55fs | 1.00 (0.223) | 4.61 × 10⁻² | |
| 10 | rs78334417 | 75,071,618 | TTC18 | p.Pro450fs | 1.00 (0.223) | 4.84 × 10⁻² | |
| 7 | rs186048202 | 134,678,273 | AGBL3 | p.Arg52fs | 0.61 (0.139) | 4.91 × 10⁻² |
| ML Algorithm | Performance Measure | |||||
|---|---|---|---|---|---|---|
| RMSE | R2 | MAE | ||||
| Training | Testing | Training | Testing | Training | Testing | |
| glmboost | 3.51 | 3.73 | 0.62 | 0.65 | 2.41 | 2.86 |
| bstTree | 3.67 | 6.75 | 0.59 | 0.08 | 3.00 | 4.52 |
| gbm | 4.90 | 6.68 | 0.27 | 0.09 | 3.86 | 4.52 |
| glmnet | 3.59 | 3.85 | 0.62 | 0.64 | 2.51 | 2.89 |
| knn | 4.53 | 6.35 | 0.39 | 0.05 | 3.56 | 4.13 |
| mlp | 6.30 | 6.62 | 0.07 | 0.43 | 5.64 | 5.78 |
| qrf | 1.35 | 7.24 | 0.95 | 0.03 | 0.69 | 4.65 |
| rf | 2.14 | 6.17 | 0.91 | 0.12 | 1.70 | 3.93 |
| rpart | 4.73 | 6.36 | 0.31 | 0.07 | 3.95 | 4.51 |
| rpart1SE | 4.18 | 5.89 | 0.46 | 0.18 | 3.35 | 4.11 |
| rpart2 | 4.28 | 6.02 | 0.43 | 0.15 | 3.43 | 4.11 |
| svmLinear | 4.74 | 6.80 | 0.43 | 0.07 | 2.97 | 4.21 |
| svmLinear2 | 4.74 | 6.80 | 0.43 | 0.07 | 2.97 | 4.21 |
| svmPoly | 3.46 | 7.30 | 0.66 | 0.14 | 1.86 | 5.13 |
| svmRadial | 5.21 | 6.50 | 0.35 | 0.02 | 3.43 | 3.96 |
| treebag | 4.26 | 6.02 | 0.45 | 0.16 | 3.47 | 4.20 |
| xgbLinear | 0.85 | 7.14 | 0.98 | 0.06 | 0.37 | 4.28 |
| xgbTree | 1.79 | 7.12 | 0.90 | 0.08 | 1.28 | 4.65 |
| ML Algorithm | Performance Measure | |||||
|---|---|---|---|---|---|---|
| RMSE | R2 | MAE | ||||
| Training | Testing | Training | Testing | Training | Testing | |
| bstTree | 3.33 | 5.22 | 0.83 | 0.44 | 2.56 | 3.75 |
| glmboost | 2.32 | 3.08 | 0.92 | 0.84 | 1.96 | 2.47 |
| glmnet | 0.25 | 0.52 | 1.00 | 0.99 | 0.17 | 0.39 |
| knn | 5.37 | 6.75 | 0.48 | 0.16 | 3.90 | 4.98 |
| lasso | 0.40 | 0.52 | 1.00 | 1.00 | 0.31 | 0.42 |
| qrf | 0.87 | 5.86 | 0.99 | 0.30 | 0.40 | 4.57 |
| rf | 2.47 | 5.09 | 0.94 | 0.49 | 1.86 | 4.15 |
| rpart | 5.53 | 7.69 | 0.38 | 0.00 | 4.46 | 6.37 |
| rpart1SE | 5.53 | 7.69 | 0.38 | 0.00 | 4.46 | 6.37 |
| rpart2 | 5.92 | 6.98 | 0.29 | 0.03 | 4.63 | 5.75 |
| svmLinear | 0.61 | 1.11 | 0.99 | 0.97 | 0.57 | 0.83 |
| svmLinear2 | 0.61 | 1.11 | 0.99 | 0.97 | 0.57 | 0.83 |
| svmPoly | 0.75 | 1.33 | 0.99 | 0.96 | 0.70 | 1.07 |
| svmRadial | 2.57 | 4.70 | 0.93 | 0.51 | 1.57 | 3.64 |
| treebag | 5.22 | 7.02 | 0.48 | 0.02 | 4.13 | 5.54 |
| xgbLinear | 0.03 | 4.61 | 1.00 | 0.67 | 0.02 | 3.32 |
| xgbTree | 1.13 | 3.98 | 0.98 | 0.70 | 0.93 | 3.19 |
Publisher’s Note: MDPI stays neutral with regard to jurisdictional claims in published maps and institutional affiliations. |
© 2021 by the authors. Licensee MDPI, Basel, Switzerland. This article is an open access article distributed under the terms and conditions of the Creative Commons Attribution (CC BY) license (https://creativecommons.org/licenses/by/4.0/).
Share and Cite
Vélez, J.I.; Samper, L.A.; Arcos-Holzinger, M.; Espinosa, L.G.; Isaza-Ruget, M.A.; Lopera, F.; Arcos-Burgos, M. A Comprehensive Machine Learning Framework for the Exact Prediction of the Age of Onset in Familial and Sporadic Alzheimer’s Disease. Diagnostics 2021, 11, 887. https://0-doi-org.brum.beds.ac.uk/10.3390/diagnostics11050887
Vélez JI, Samper LA, Arcos-Holzinger M, Espinosa LG, Isaza-Ruget MA, Lopera F, Arcos-Burgos M. A Comprehensive Machine Learning Framework for the Exact Prediction of the Age of Onset in Familial and Sporadic Alzheimer’s Disease. Diagnostics. 2021; 11(5):887. https://0-doi-org.brum.beds.ac.uk/10.3390/diagnostics11050887
Chicago/Turabian StyleVélez, Jorge I., Luiggi A. Samper, Mauricio Arcos-Holzinger, Lady G. Espinosa, Mario A. Isaza-Ruget, Francisco Lopera, and Mauricio Arcos-Burgos. 2021. "A Comprehensive Machine Learning Framework for the Exact Prediction of the Age of Onset in Familial and Sporadic Alzheimer’s Disease" Diagnostics 11, no. 5: 887. https://0-doi-org.brum.beds.ac.uk/10.3390/diagnostics11050887