1. Introduction
The determination of the antibodies against SARS-CoV-2 could be useful in epidemiological studies, for estimating the spread of the infection and the lethality rate, in the serological diagnosis of individuals with mild or moderate symptoms, and those who are asymptomatic, in the first screening of convalescent patients for plasma collection and in monitoring of the antibody response of vaccinated subjects.
The long-term time course of the antibody response in COVID-19 disease is not yet fully determined. Some studies show a significant decrease in antibody concentrations within 3–4 months from the onset of symptoms [
1,
2,
3]. Other reports find constant or only slightly decreased levels, starting from 4 months and up to 10 months from the symptoms’ onset [
4,
5,
6,
7], even when specific neutralizing antibodies [
8] were measured. In particular, the time course of the antibody response seems variable, also according to the method used [
7,
9]. On the other hand, antibodies seem to persist through 4–6 months in vaccinated subjects [
10,
11].
The aim of this work is to evaluate the performance of two methods for the determination of antibodies to SARS-CoV-2, in patients with a long-term time course and in a little cohort of subjects vaccinated with the Comirnaty vaccine. Moreover, the effectiveness of the transformation of the antibodies concentrations into the international reference standard, for the harmonization of the assays, was evaluated.
2. Materials and Methods
We recruited symptomatic subjects who presented at the dell’Angelo Hospital (Mestre, Italy) in March 2020, affected by COVID-19 according to both clinical and laboratory criteria. Forty-eight patients with known date of symptoms’ onset were included in the study (41 males, 7 females, median age 62.3 years, minimum 28, maximum 87). The median time from the onset of symptoms was 26 days (minimum 3, maximum 368). A total of 108 blood specimens were collected. Number of specimens per patient and other patients’ characteristics are reported in
Table 1.
Moreover, serum samples were collected from 20 healthcare workers after 14 days from the first dose, 14 days and 3 months after a second dose of Comirnaty vaccine (BNT162b2, BioNTech/Pfizer, Mainz, Germany/New York, NY, USA). All subjects underwent periodical nasopharyngeal swab testing (every 2 or 3 weeks) and had a negative result to the antibody determination prior to vaccine administration.
The specimens were collected in polyethylene tubes (BD Vacutainer®; Becton Dickinson, CA, USA) containing clot activator and gel separator, and were centrifuged at 1500× g for 10 min and the sera were stored at −80 °C until the assay. IgG were measured with an ELISA method, the “anti-SARS-CoV-2 QuantiVac ELISA IgG” (Euroimmun, Lubeck, Germany) and a two-step chemiluminescence microparticle immunoassays for the determination of IgG against RBD (receptor binding domain) “SARS-CoV-2 IgG anti-RBD” (SNIBE, Shenzhen, China).
Both the assays were performed according to the manufacturer’s instructions. Briefly, in the ELISA Euroimmun method 100 µL of the calibrators, controls or diluted samples were added per well and incubated for 1 h at 37 °C. After washing, in each well 100 µL of enzyme conjugate and, after incubation for 30 min at 37 °C, 100 µL of chromogen/substrate solution were added. The plate was incubated for 30 min at room temperature, the reaction was stopped and the color reaction was read at 450 nm. The concentrations of the antibodies against the S1 protein were determined through the interpolation with a six-point calibration curve (from 1 to 120 relative units/mL). Results < 8 RU/mL were considered as negative, results > 8 RU/mL and ≤ 11 RU/mL were considered as indeterminate and >11 RU/mL aPlease verify changes to this titles positive.
The IgG anti-RBD method measures antibodies against receptor binding domain of the S1 protein and was carried out on the analyser Maglumi 800 (SNIBE, Shenzen, China). A nine-point master curve was used (from 1 to 100 arbitrary units/mL), periodically adjusted by a 2-point calibration. Results ≥ 1 AU/mL were considered as positive.
The good analytical characteristics of the two methods and the satisfactory correlation with the neutralization tests were previously evaluated and confirmed [
12,
13,
14]. The concentrations were measured taking into consideration the previously determined reportable range of the respective methods [
15].
The respective cut-offs were determined by the manufacturers on the basis of a specificity of 99.8%, and confirmed by independent studies [
13,
14].
The units of the respective assays were established by the manufactures and are specific for each method.
An international reference serum standard for SARS-CoV-2 antibody testing, expressed as binding antibodies units, has been developed by the National Institute for Biological Standards and Control (NIBSC) [
16]. The reference standard (WHO 20/136) has been used to calibrate antibody testing systems against an international reference protocol. Correction factors versus the international standard were determined for both assays (4.33 for Maglumi and 3.2 for ELISA).
The statistical analyses were performed with MedCalc © Software, version 7.4.2.0 (MedCalc Software, Mariakerke, Belgium).
3. Results
The overall concordance rate between the methods was 89.8% (kappa statistics, 0.54; 95% CI, 0.30–0.78).
The results of the patients’ specimens were subdivided into seven groups, for which the qualitative performance was evaluated (
Table 2).
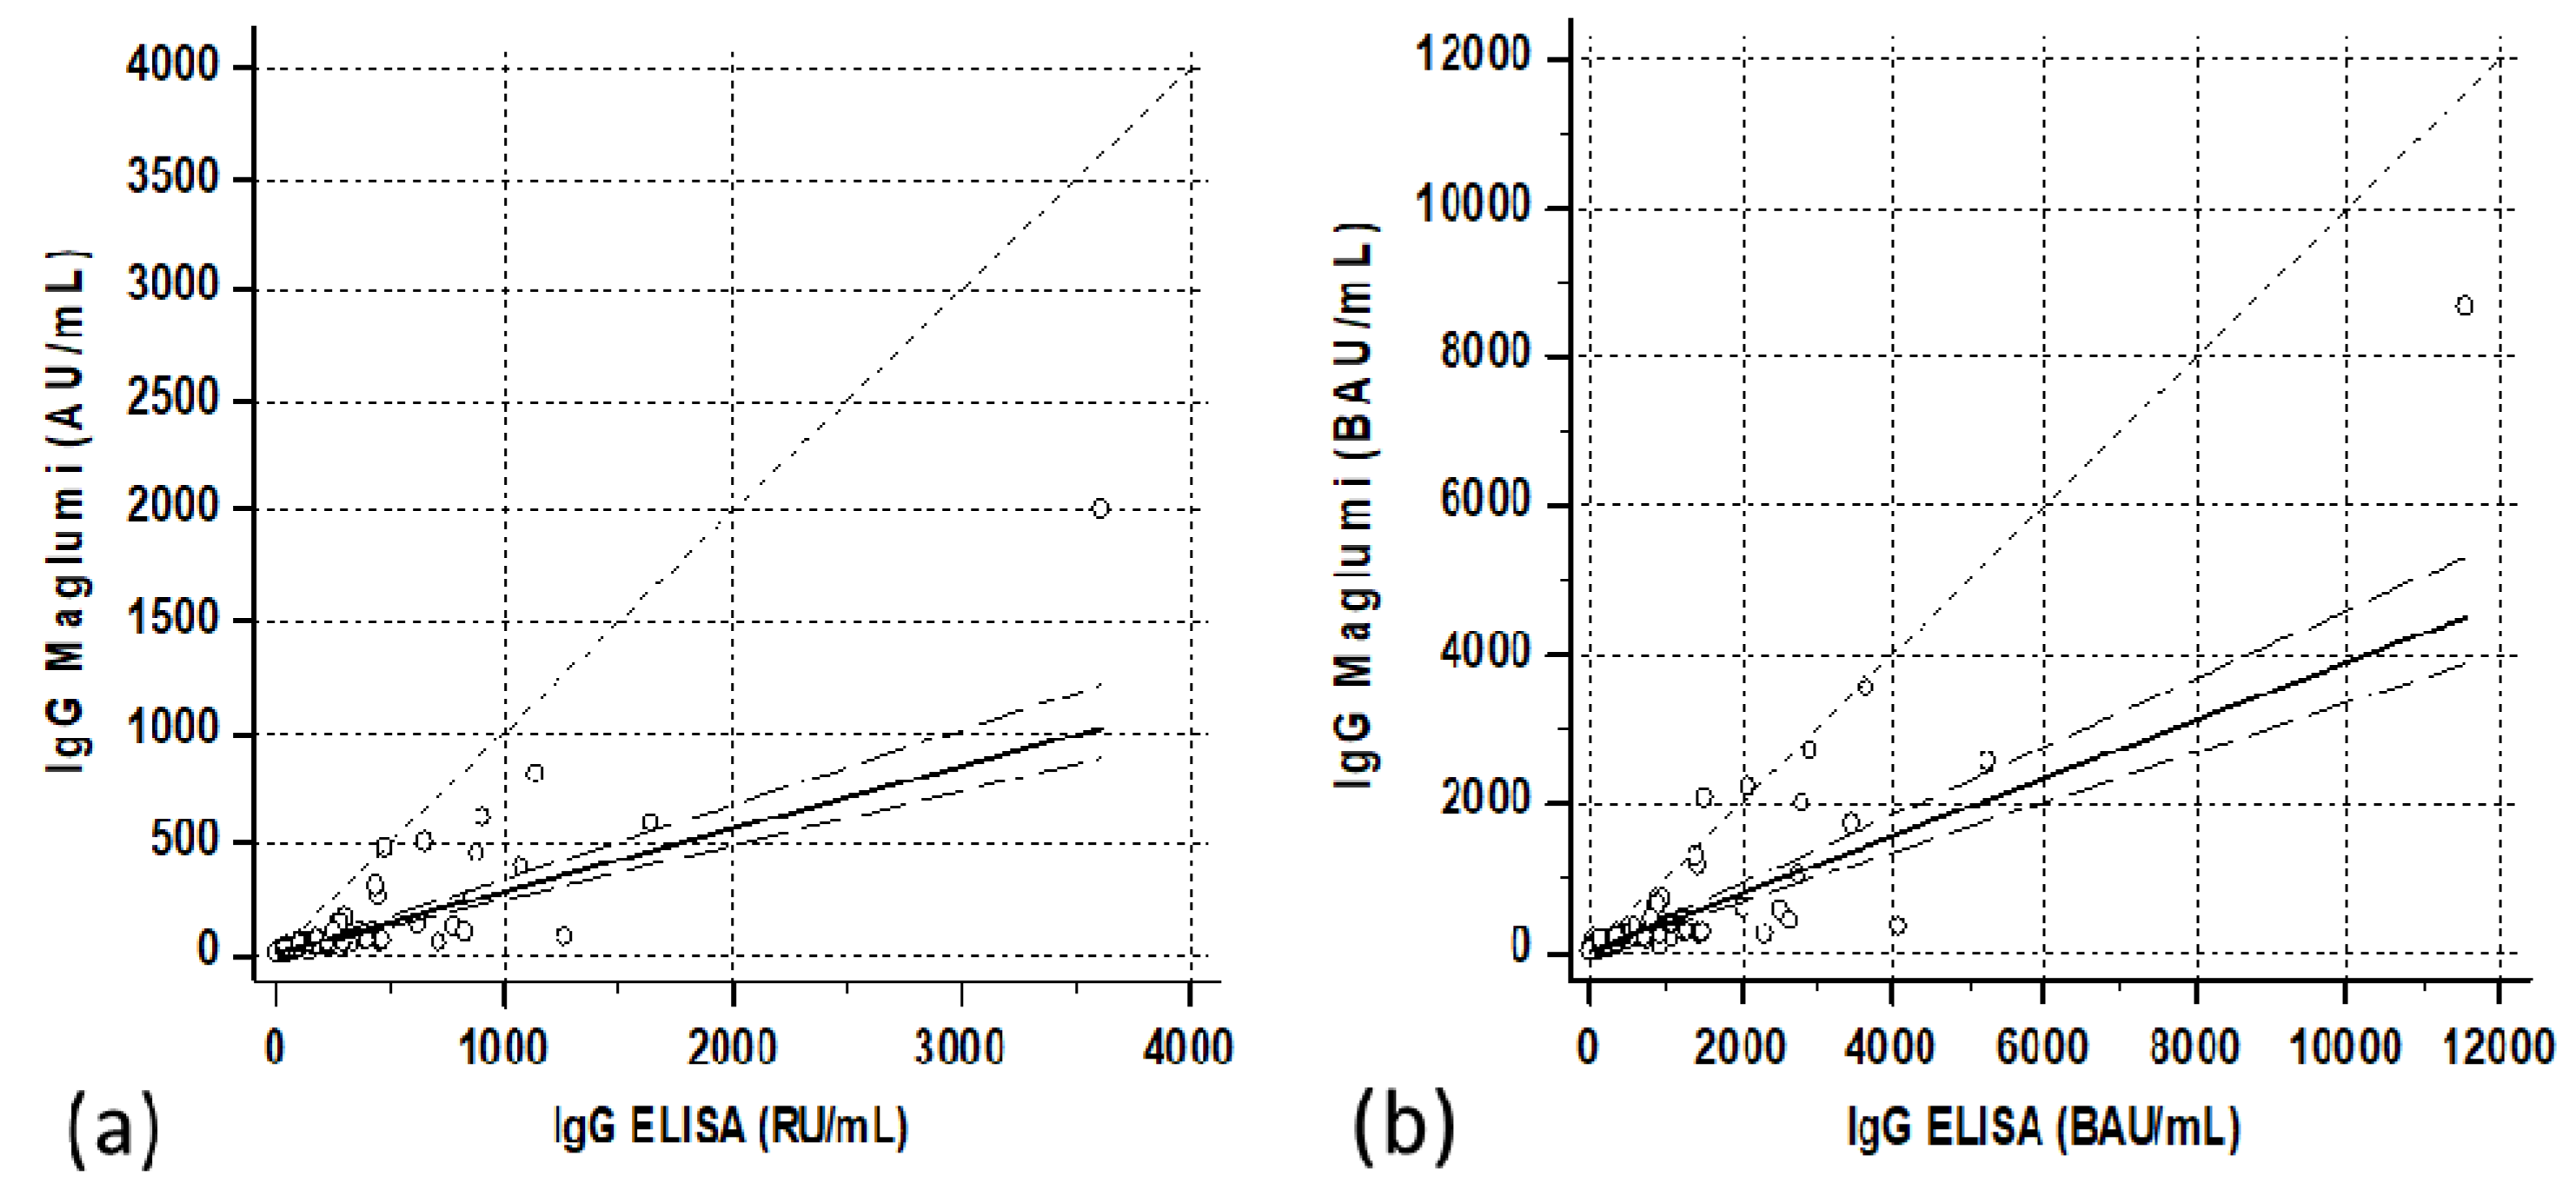
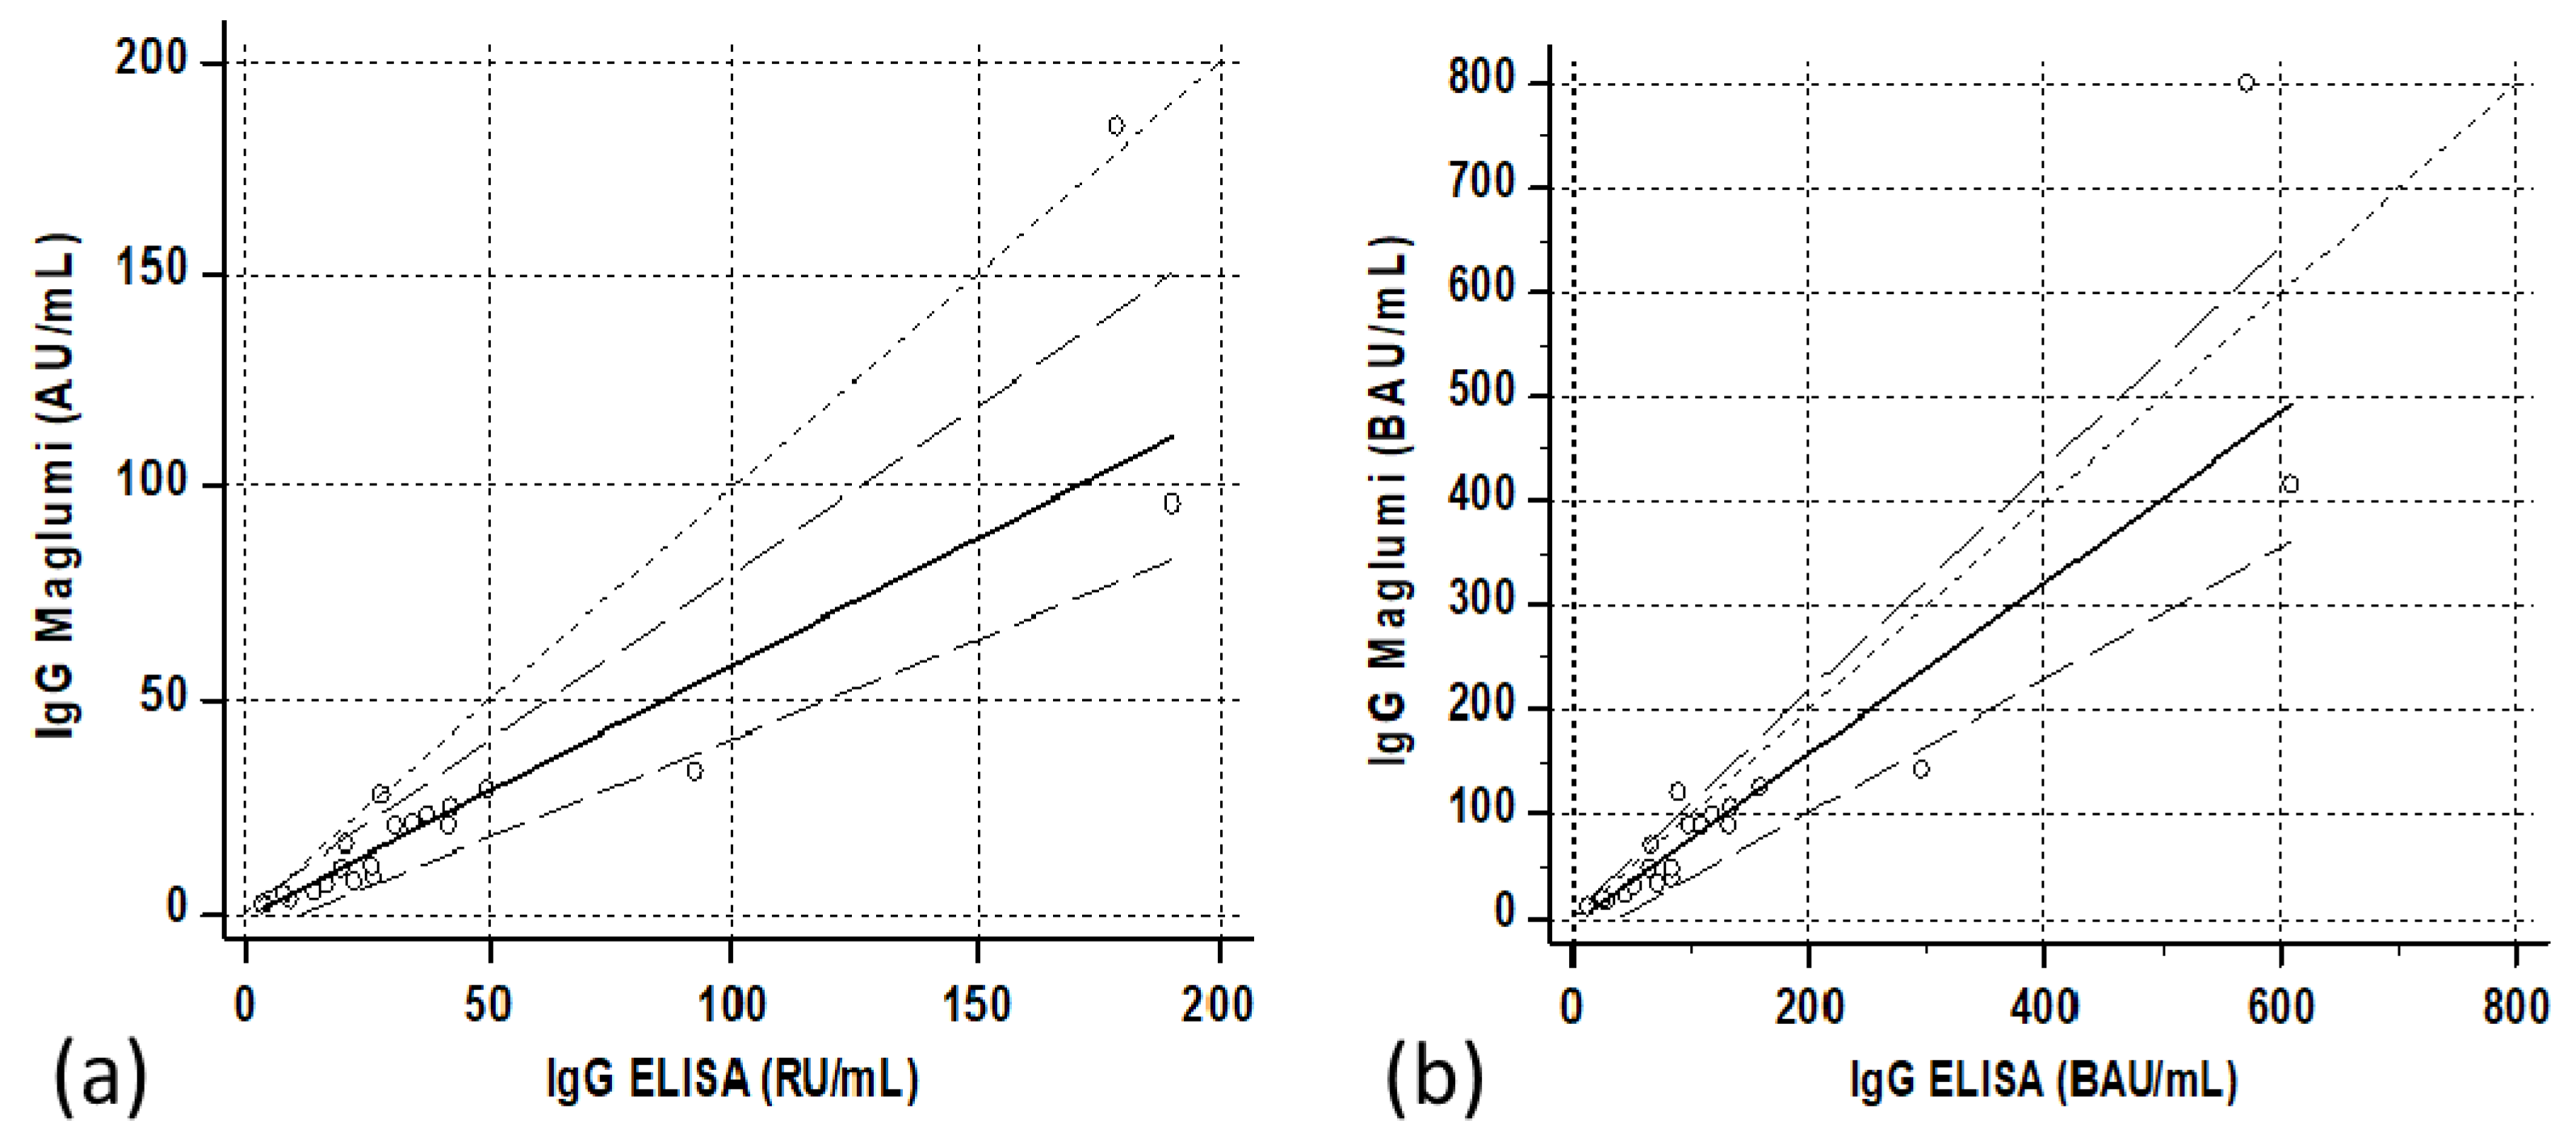
The quantitative relationship showed a satisfactory correlation, although with a relatively scattered distribution of cases. Passing–Bablock regression resulted in “Maglumi= 0.284 (0.24/0.33) + 0.581 (−0.21/2.64) ELISA” (
Figure 1a). In parenthesis were reported the confidence interval of intercepts and slopes.
The differences in the concentrations between the groups were statistically significant for both the methods (Kruskal–Wallis test
p = 0.00002 for both Maglumi and ELISA,
Table 2).
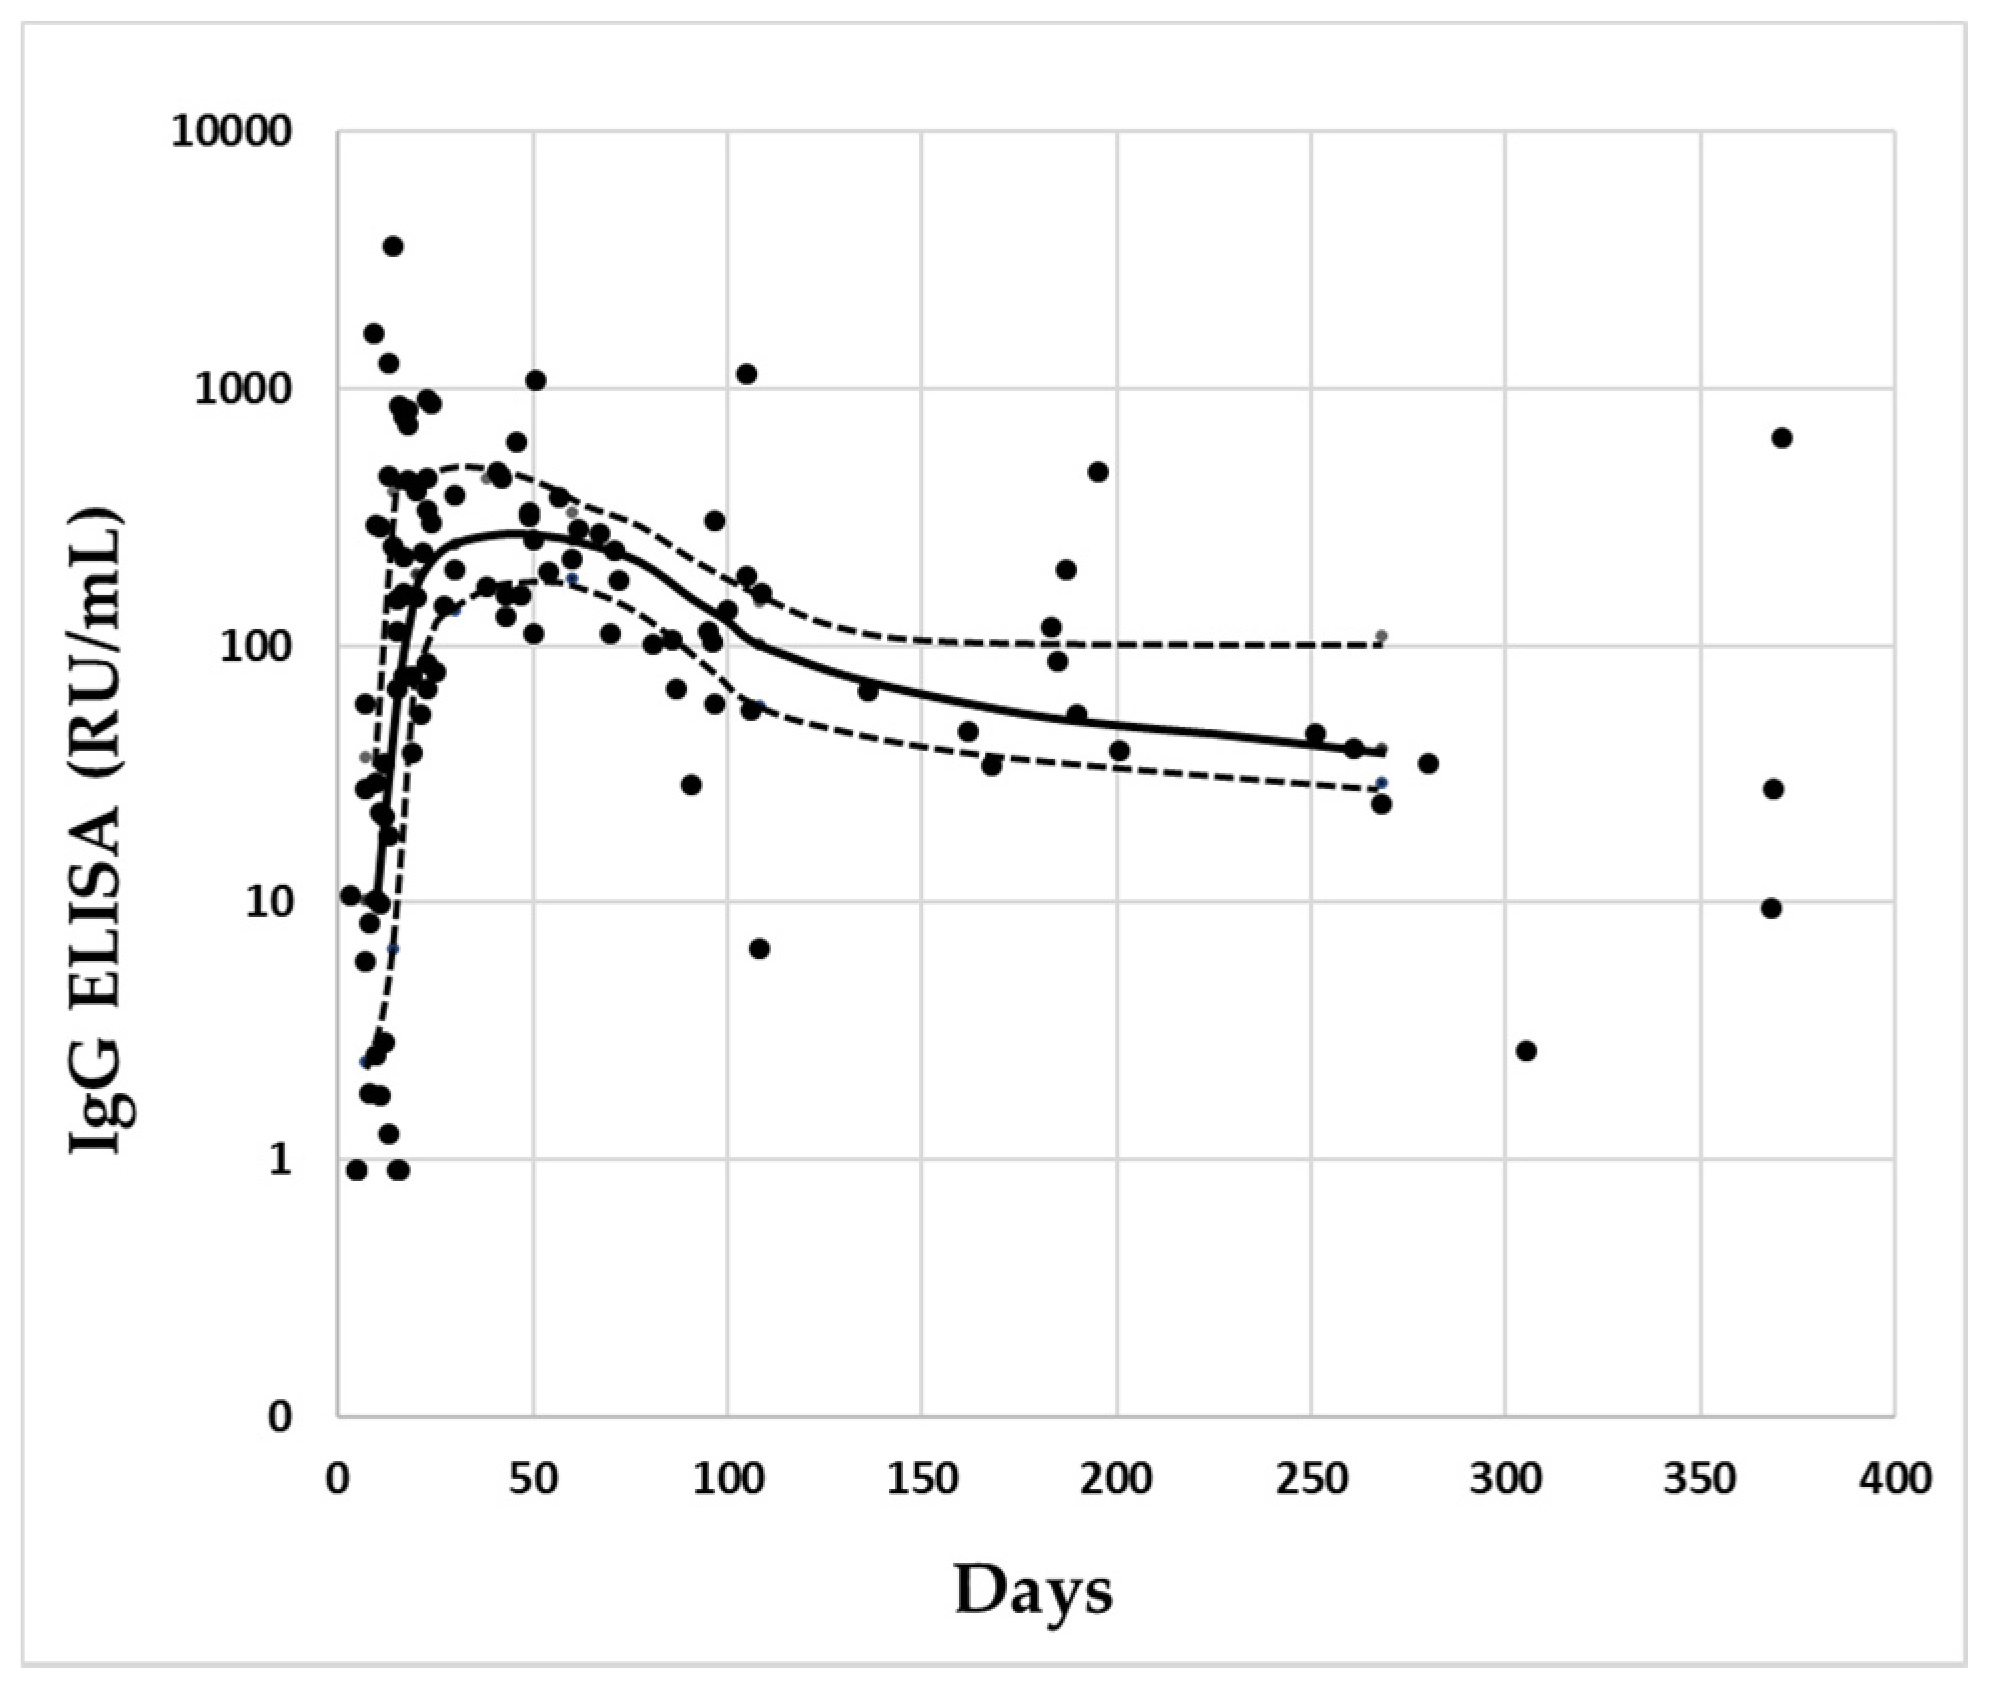
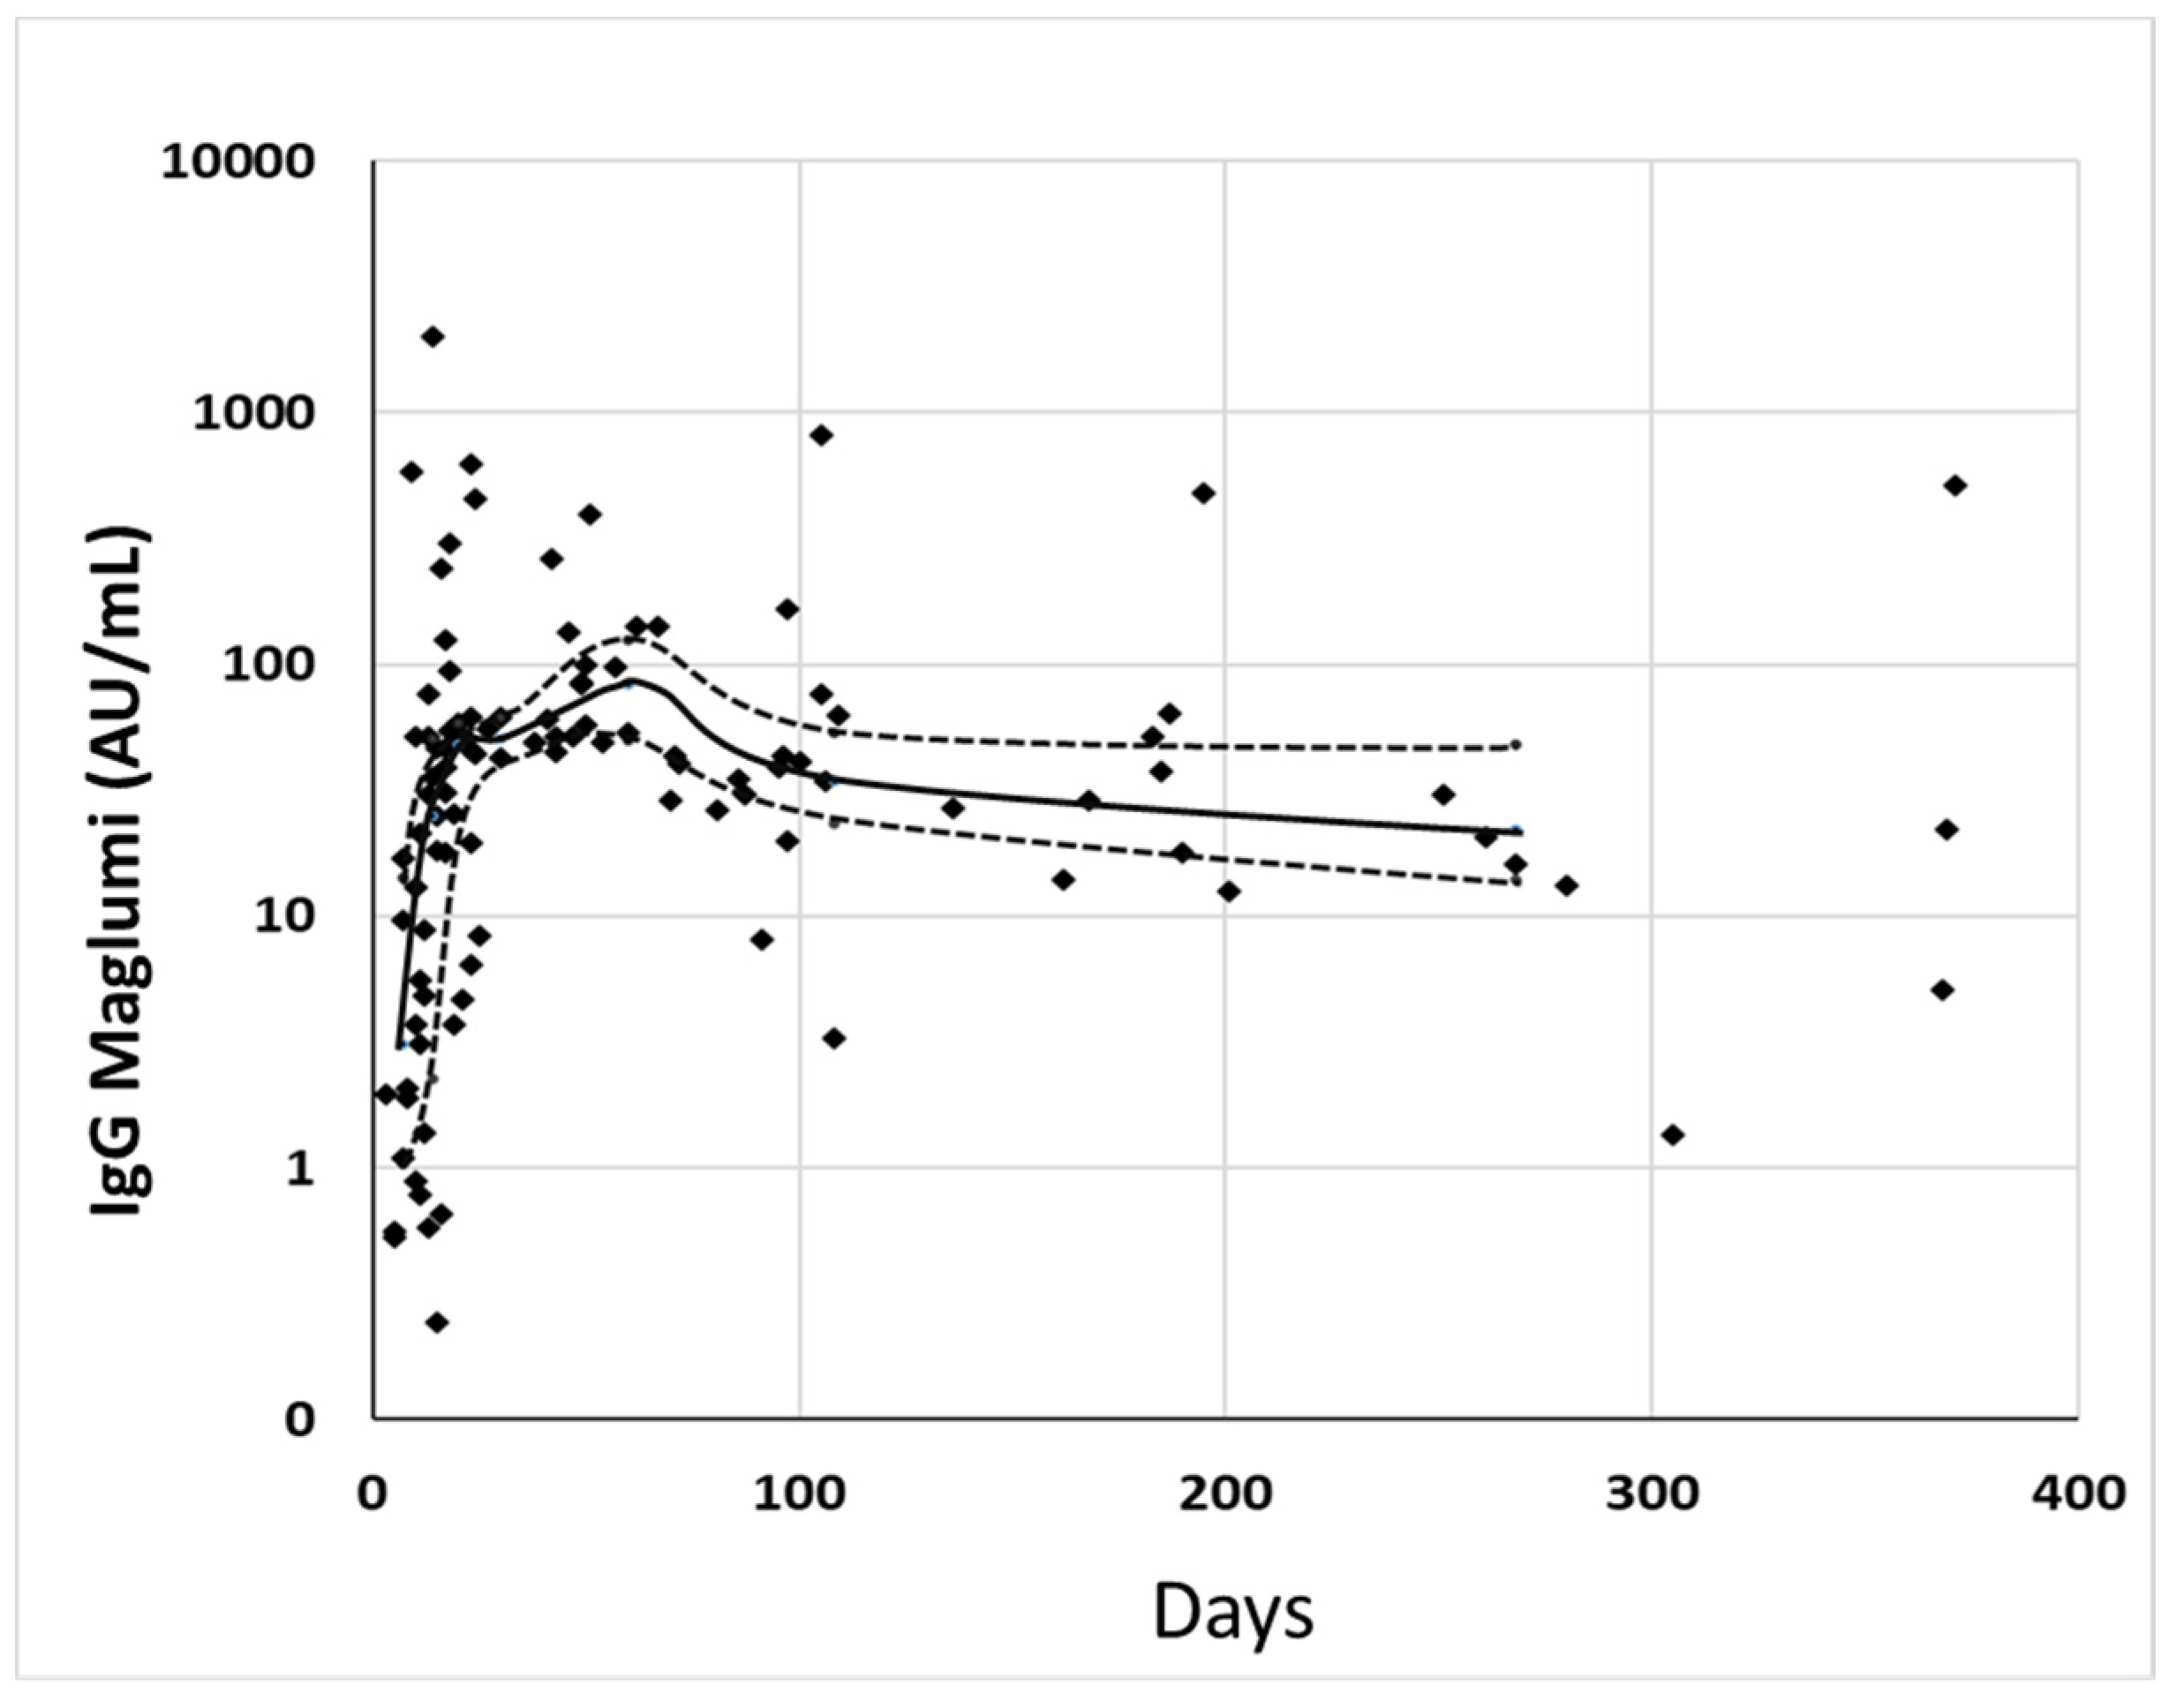
The antibodies’ levels showed a similar time course with the two methods. After a rapid increase, the concentrations began to decrease slightly, after about 80–100 days (
Figure 2 and
Figure 3).
The ELISA method showed a sensitivity (calculated as the percentage of cases over the cut-off, with respect to the overall and clinically true positive cases of each group) of about 87% after 180 days, while the sensitivity of Maglumi remained at 100%.
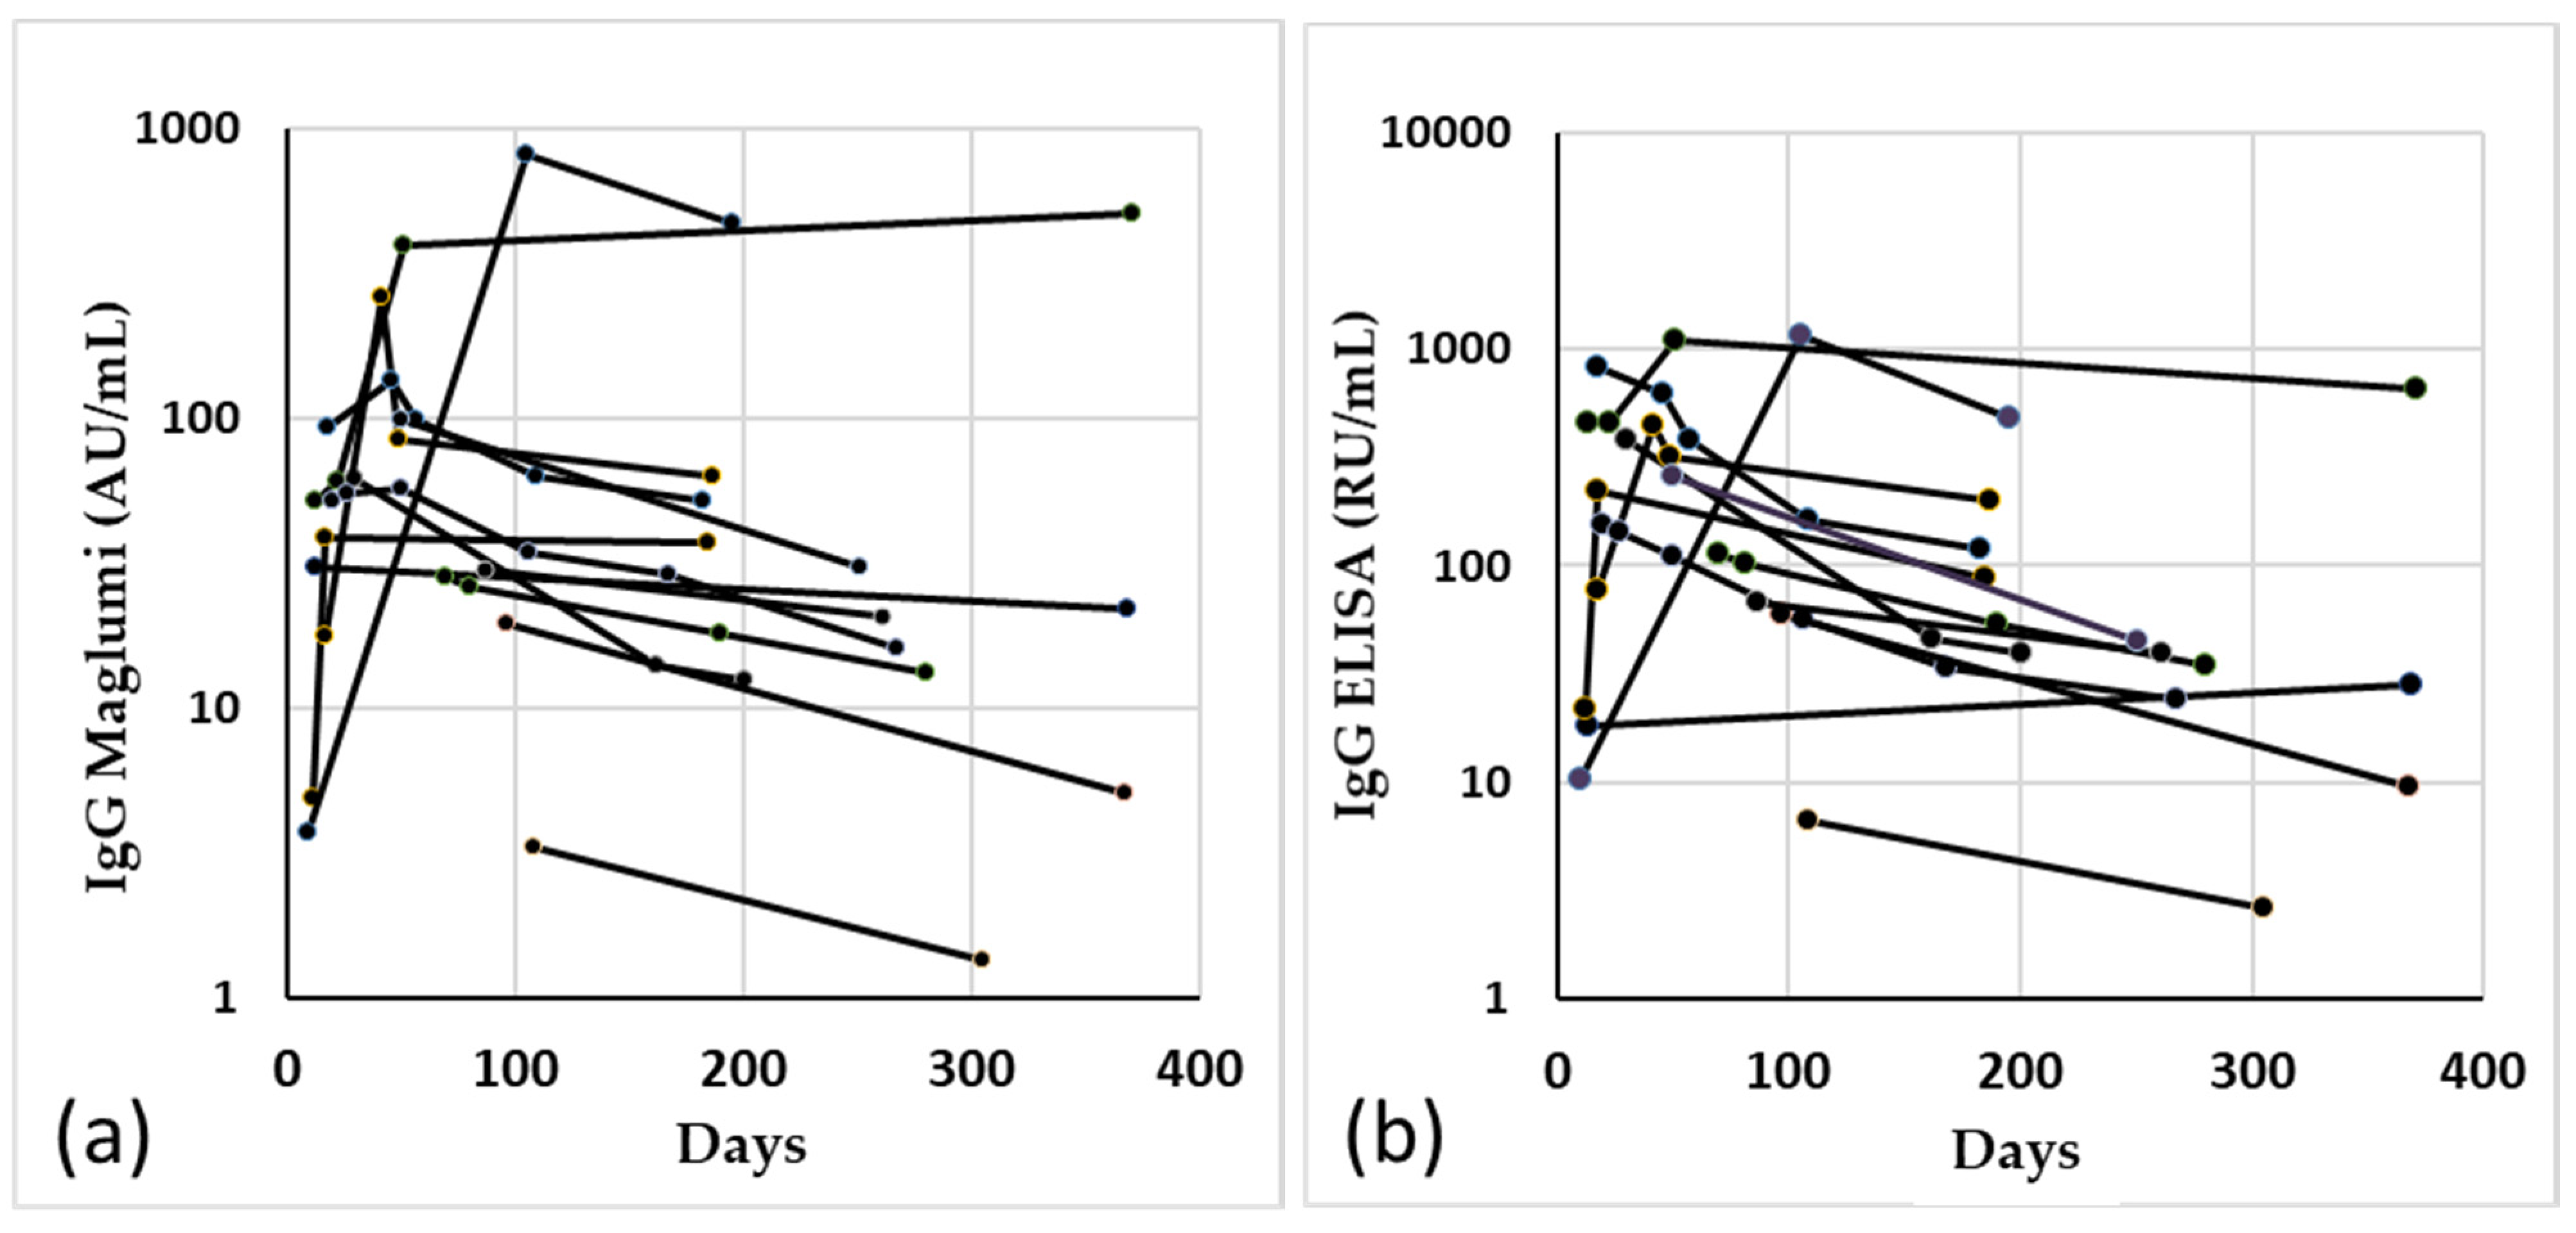
The results of the determination with the two methods, in the 13 patients with more than one blood collection, at least up to 180 days after the onset of symptoms, are shown in
Figure 4.
All the vaccinated subjects were positive 15 days after the first inoculum with the Maglumi method, while with the ELISA method, 4/22 cases had a negative result.
Fifteen days after the booster, all the samples were positive with both the methods, and the concentrations resulted in an amount that was more than 20 times larger than the first withdrawal (
Table 3).
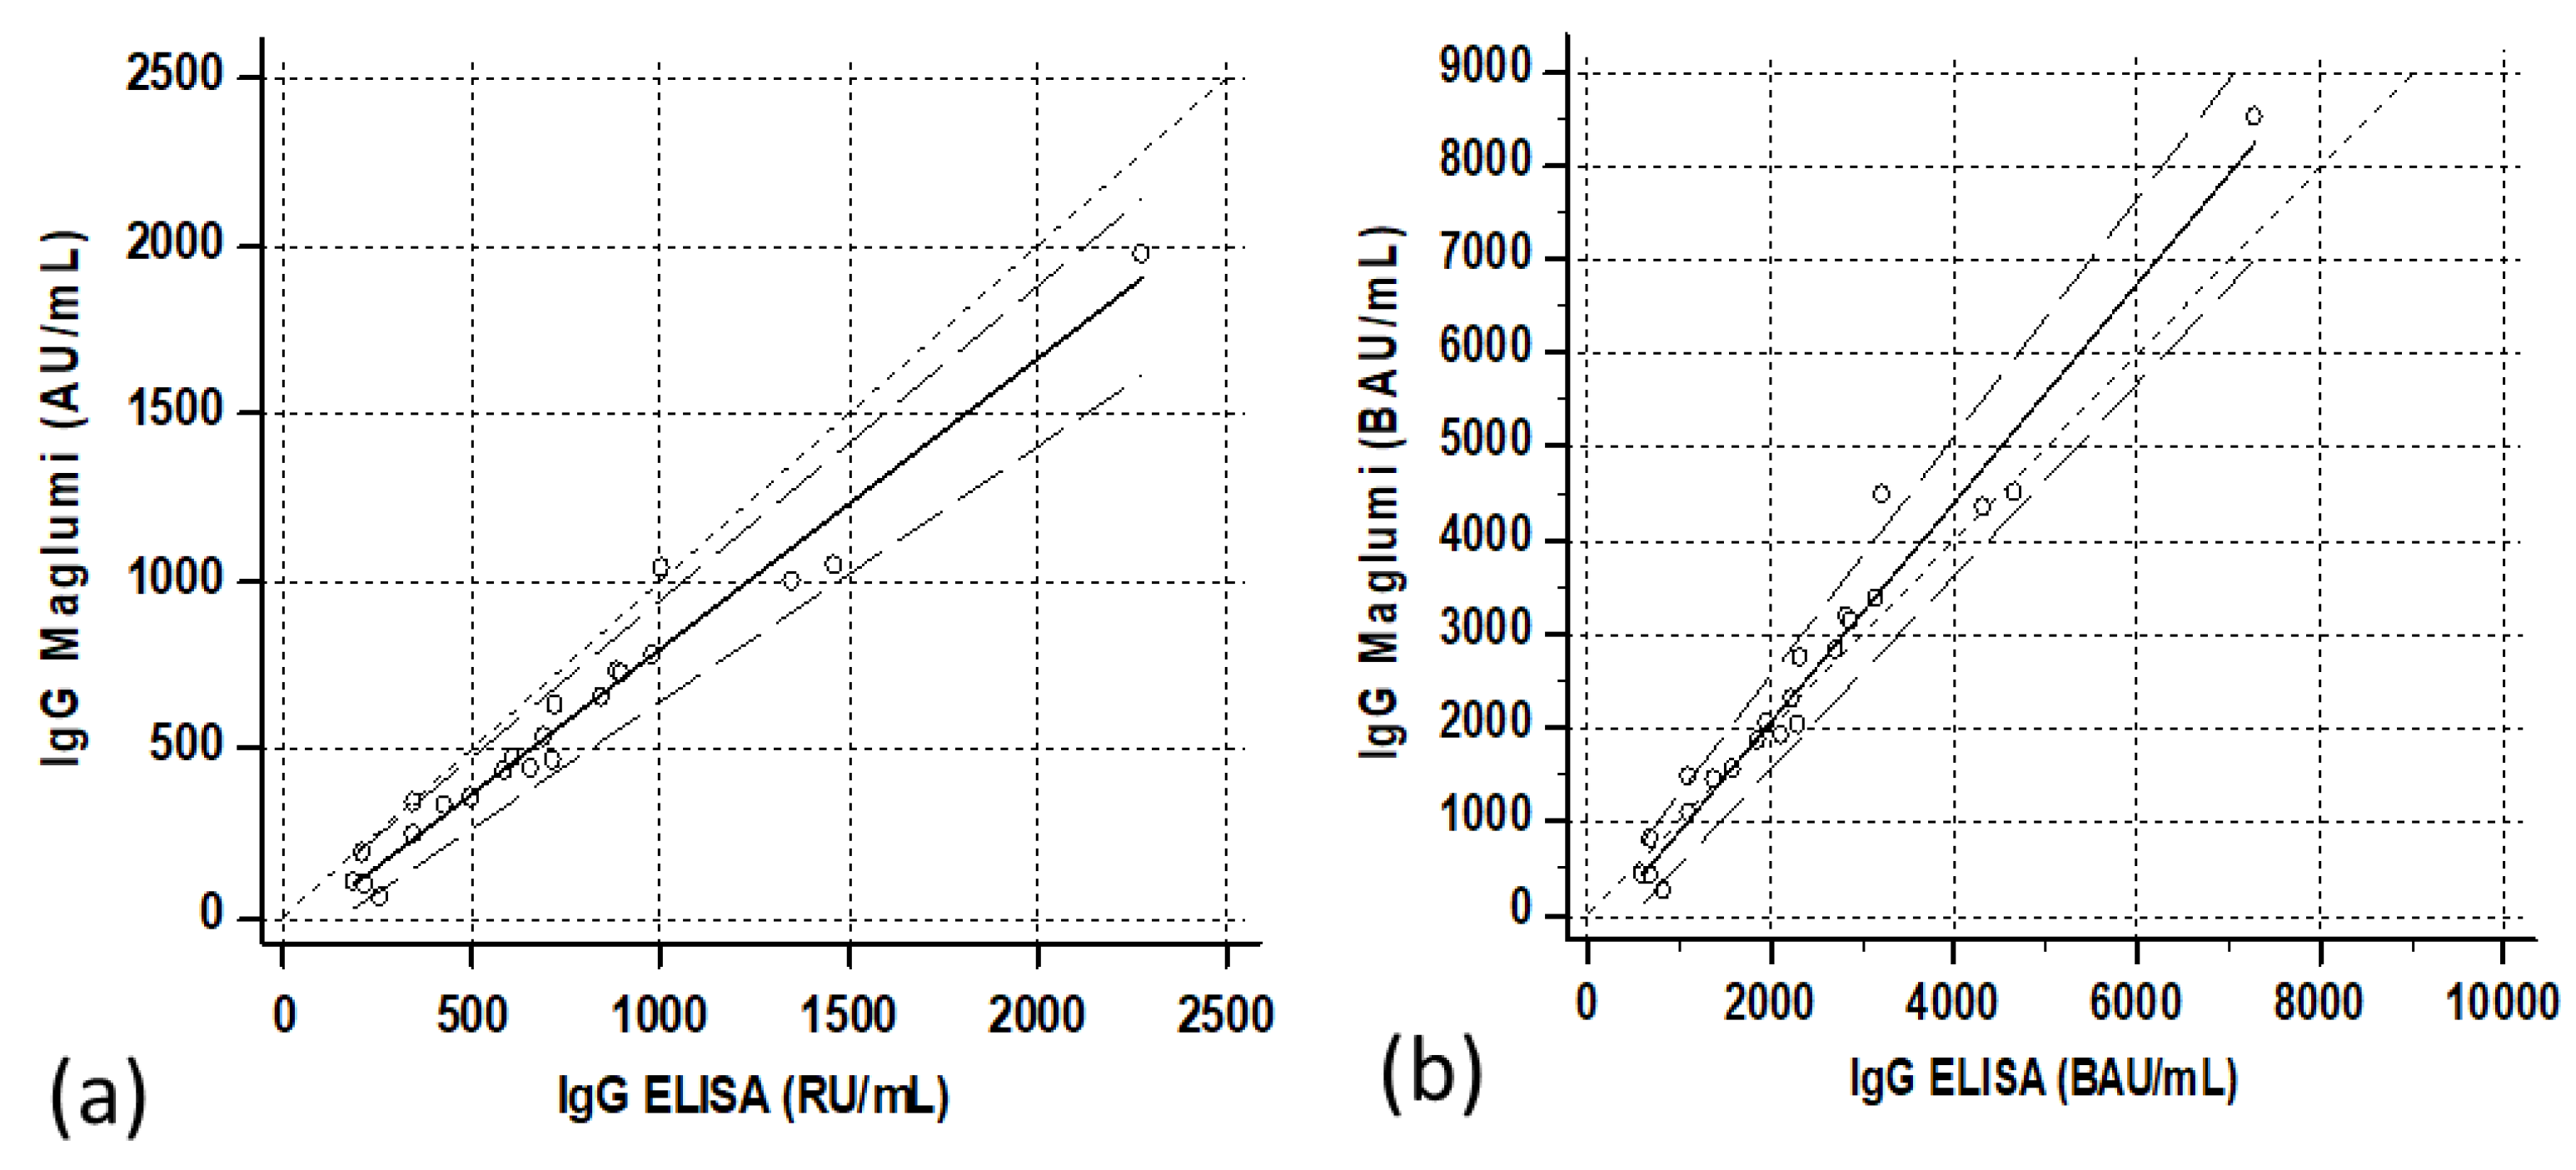
The correlations between the two methods were satisfactory, especially after the second dose (
Figure 5a and
Figure 6a). The Passing–Bablock regressions were as follows: Maglumi = −0.89 (−6.1/+1.2) + 0.59 (0.47/0.78) ELISA for the specimens after the first dose, and Maglumi = −52.4 (−107/+19.2) + 0.85 (0.74/0.92) ELISA for the specimens after the second administration.
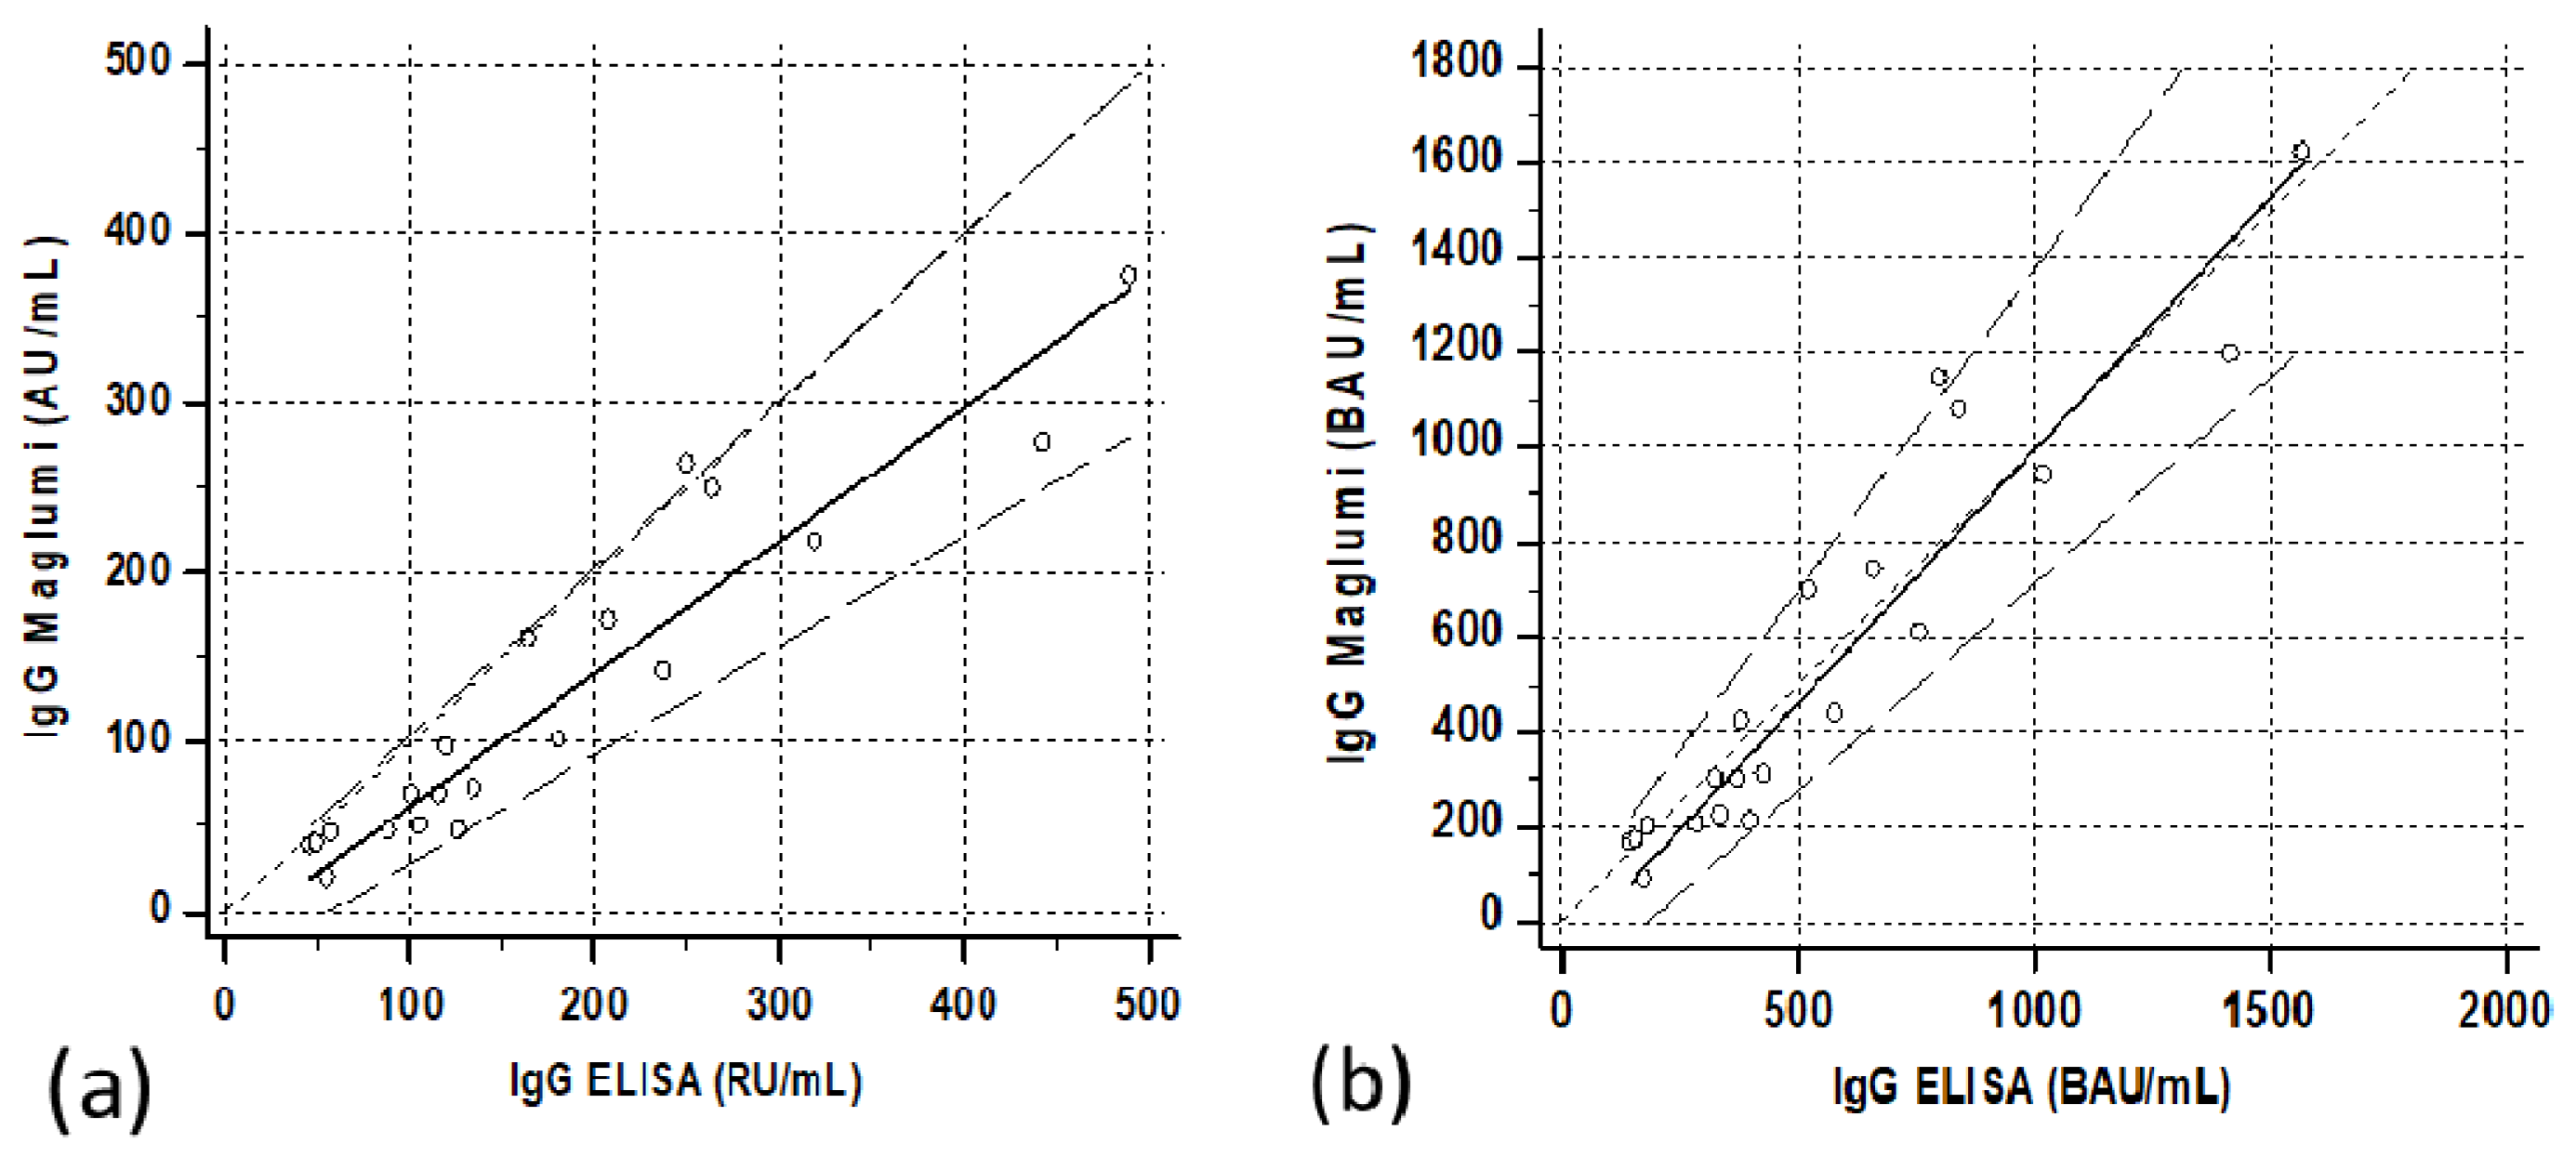
Three months after the second dose, the levels of antibodies drastically decreased (
Table 3). The median of the percentage of the concentrations, compared to those found 15 days after the second dose, was 21% (10°–90° perc 11–33%) with Maglumi, and 24.4% (10°–90° perc 13–33%) with ELISA.
The Passing–Bablock regression between the two methods was as follows: Maglumi = −16.2 (−37.5/+5.7) + 0.78 (0.65/0.98) ELISA (
Figure 7a).
The correlations between the two methods after transformation into binding arbitrary units (BAU) resulted in Maglumi = 2.45 (−1.6/+10.6) + 0.39 (0.33/0.46) ELISA in patients, Maglumi = −5.1 (−26.8/+5.0) + 0.82 (0.64/1.07) ELISA in subjects vaccinated after the first dose and Maglumi = −227.9 (−464/+69.9) + 1.14 (0.99/1.25) ELISA in subjects vaccinated after the second dose. Three months after the second dose, the correlation was Maglumi = −72.8 (−166.8/+24) + 1.07 (0.88/1.35) ELISA (
Figure 1b,
Figure 5b,
Figure 6b and
Figure 7b).
4. Discussion
In this study, the performance of two assays, for the determination of antibodies against SARS-CoV-2 in patients, up to 10–12 months from the onset of symptoms, were compared. With both the methods, the antibodies concentrations tended to decline after a few months, but the levels persisted relatively high up to nearly a year after the symptoms (
Table 2). Our data, especially those obtained with Maglumi, were roughly in accord with a model of the IgG anti-S decay in patients, which established a half-life of 229 days [
17]. The positivity rates remained at 100% with the Maglumi method, while they dropped to 87% with the ELISA method.
In the vaccinated subjects, the presence of high concentrations of antibodies was already detectable after the first dose, but after the booster, they showed a significant increase, about 20 times compared to the first administration and, on average, 3 times the maximum concentrations reached by the patients after about two months from the onset of symptoms. These results are in agreement with previous findings for the method used [
12,
18,
19]. However, in the vaccinated subjects the decrease in antibody concentrations was more rapid, given that 3 months after the second vaccination, they were reduced to less than a quarter. The correlations between the two methods have always been acceptable. However, in the patients the results were scattered and the ELISA method showed concentrations 3–4 times higher than those of Maglumi, while in the vaccinated subjects the concentrations between the two methods were closer and much better correlated. Moreover, the conversion of the results into BAU units improved the relationship between the two methods. However, only in the vaccinated subjects, there was no evidence of proportional error after the conversion, while in the patients, the difference between the two methods remained significant. The methods measured antibodies directed against the Spike 1 protein, but Maglumi determines antibodies against the receptor domain more specifically. This difference may partly justify the results in the patients. Considering that only the anti-Spike antibodies should be expressed in vaccinated patients, it could be speculated that the greater heterogeneity of the antibodies patterns in patients can cause the less close correlation between the two methods found in these subjects. The decrease in concentrations a few months after vaccination does not necessarily mean a reduction in protection. It is in fact possible that the protection is not directly proportional to the mere presence of antibodies, given the persistence of T-cell memory after infection [
5]. In conclusion, both the methods had comparable behaviors, both in patients and in vaccinated subjects. In both cases, the antibody concentrations peaked and then decreased. However, in the vaccinated subjects, the peak reached a much higher level than in the patients, and the decrease was more rapid. Three months after the second injection, they showed concentrations comparable to those of patients after more than 6 months from the onset of the disease. A peculiar finding of the study was the failure of the conversion to binding antibodies units in harmonizing the two methods only in patients’ specimens. Further studies will be required to clarify this different behavior between patients and vaccinated subjects.
Author Contributions
Conceptualization, R.D. and P.C.; sample collection, R.D., I.B. and H.A.; methodology, M.S., I.B. and H.A; formal analysis, R.D.; writing—original draft preparation, R.D.; writing—review and editing, R.D., M.S., H.A. and P.C.; supervision, P.C. All authors have read and agreed to the published version of the manuscript.
Funding
This research received no external funding.
Institutional Review Board Statement
The study was conducted according to the guidelines of the Declaration of Helsinki and approved by the Ethics Committee of ULSS3 Serenissima (approval n 149/A CESC; approve date, May 2020).
Acknowledgments
We acknowledge Medical Systems and Euroimmun for kindly supplying reagents without any influence in study design and data analysis.
Conflicts of Interest
The authors declare no conflict of interest.
References
- Ibarrondo, F.J.; Fulcher, J.A.; Goodman-Meza, D.; Elliott, J.; Hofmann, C.; Hausner, M.A.; Ferbas, K.G.; Tobin, N.H.; Aldrovandi, G.M.; Yang, O.O. Rapid Decay of Anti-SARS-CoV-2 Antibodies in Persons with Mild Covid-19. N. Engl. J. Med. 2020, 383, 1085–1087. [Google Scholar] [CrossRef] [PubMed]
- Kutsuna, S.; Asai, Y.; Matsunaga, A. Loss of Anti-SARS-CoV-2 Antibodies in Mild Covid-19. N. Engl. J. Med. 2020, 383, 1695–1696. [Google Scholar] [CrossRef] [PubMed]
- Long, Q.; Tang, X.; Shi, Q.; Li, Q.; Deng, H.; Yuan, J.; Fulcher, J.A.; Goodman-Meza, D. Clinical and immunological assessment of asymptomatic SARS-CoV-2 infections. Nat. Med. 2020, 26, 1200–1204. [Google Scholar] [CrossRef] [PubMed]
- Gudbjartsson, D.F.; Norddahl, G.L.; Melsted, P.; Gunnarsdottir, K.; Holm, H.; Eythorsson, E.; Arnthorsson, A.O.; Helgason, D.; Bjarnadottir, K.; Ingvarssonet, R.F. Humoral Immune Response to SARS-CoV-2 in Iceland. N. Engl. J. Med. 2020, 383, 1724–1734. [Google Scholar] [CrossRef] [PubMed]
- Dan, J.M.; Mateus, J.; Kato, Y.; Hastie, K.M.; Yu, E.D.; Faliti, C.E.; Grifoni, A.; Ramirez, S.I.; Haupt, S.; Frazier, A.; et al. Immunological memory to SARS-CoV-2 assessed for up to 8 months after infection. Science 2021, 371, eabf4063. [Google Scholar] [CrossRef] [PubMed]
- Dispinseri, S.; Secchi, M.; Pirillo, M.F.; Tolazzi, M.; Borghi, M.; Brigatti, C.; De Angelis, M.L.; Baratella, M.; Bazzigaluppi, E.; Venturi, G.; et al. Neutralizing antibody responses to SARS-CoV-2 in symptomatic COVID-19 is persistent and critical for survival. Nat. Commun. 2021, 12, 2670. [Google Scholar] [CrossRef] [PubMed]
- Favresse, J.; Eucher, C.; Elsen, M.; Gillot, C.; Van Eeckhoudt, S.; Dogné, J.M.; Douxfils, J. Persistence of Anti-SARS-CoV-2 Antibodies Depends on the Analytical Kit: A Report for Up to 10 Months after Infection. Microorganisms 2021, 9, 556. [Google Scholar] [CrossRef] [PubMed]
- Lau, E.H.Y.; Tsang, O.T.Y.; Hui, D.S.C.; Kwan, M.Y.W.; Chan, W.H.; Chiu, S.S.; Ko, R.L.W.; Chan, K.H.; Cheng, S.M.S.; Perera, R.A.P.M.; et al. Neutralizing antibody titres in SARS-CoV-2 infections. Nat. Commun. 2021, 12, 63. [Google Scholar] [CrossRef] [PubMed]
- Dittadi, R.; Afshar, H.; Carraro, P. Two SARS-CoV-2 IgG immunoassays comparison and time-course profile of antibodies response. Diagn. Microbiol. Infect. Dis. 2021, 99, 115297. [Google Scholar] [CrossRef] [PubMed]
- Doria-Rose, N.; Suthar, M.S.; Makowski, M.; O’Connell, S.; McDermott, A.B.; Flach, B.; Ledgerwood, J.E.; Mascola, J.R.; Graham, B.S.; Lin, B.C.; et al. mRNA-1273 Study Group. Antibody Persistence through 6 Months after the Second Dose of mRNA-1273 Vaccine for Covid-19. N. Engl. J. Med. 2021, 384, 2259–2261. [Google Scholar] [CrossRef] [PubMed]
- Widge, A.T.; Rouphael, N.G.; Jackson, L.A.; Anderson, E.J.; Roberts, P.C.; Makhene, M.; Chappell, J.D.; Denison, M.R.; Stevens, L.J.; Pruijssers, A.J.; et al. mRNA-1273 Study Group. Durability of Responses after SARS-CoV-2 mRNA-1273 Vaccination. N. Engl. J. Med. 2021, 384, 80–82. [Google Scholar] [CrossRef] [PubMed]
- Müller, L.; Andrée, M.; Moskorz, W. Age-dependent immune response to the BioNtech/Pfizer BNT162b2 COVID-19 vaccination. Clin. Infect. Dis. 2021. [Google Scholar] [CrossRef]
- Rubio-Acero, R.; Castelletti, N.; Fingerle, V.; Olbrich, L.; Bakuli, A.; Wölfel, R.; Girl, P.; Müller, K.; Jochum, S.; Strobl, M.; et al. In Search of the SARS-CoV-2 Protection Correlate: Head-to-Head Comparison of Two Quantitative S1 Assays in Pre-characterized Oligo-/Asymptomatic Patients. Infect. Dis. Ther. 2021, 16, 1–14. [Google Scholar] [CrossRef]
- Padoan, A.; Bonfante, F.; Cosma, C.; Di Chiara, C.; Sciacovelli, L.; Pagliari, M.; Bortolami, A.; Costenaro, P.; Musso, G.; Basso, D.; et al. Analytical and clinical performances of a SARS-CoV-2 S-RBD IgG assay: Comparison with neutralization titers. Clin. Chem. Lab. Med. 2021, 59, 1444–1452. [Google Scholar] [CrossRef] [PubMed]
- Dittadi, R.; Bertoli, I.; Carraro, P. Reportable range of quantitative assays for SARS-CoV-2 antibodies determination: An overlooked issue? Ann. Clin. Biochem. 2021, 29, 47. [Google Scholar] [CrossRef]
- Mattiuzzo, P.; Bentley, E.M.; Hassal, M.; Routley, S.; Richardson, S.; Bernasconi, V.; Kristiansen, P.; Harvala, H.; Roberts, D.; Semple, M.G.; et al. Establishment of the WHO International Standard and Reference Panel for Anti-SARS-CoV-2 Antibody; WHO Expert Committee on Biological Standardization: Geneva, Switzerland, 2020; WHO/BS/2020.2403. [Google Scholar]
- Wheatley, A.K.; Juno, J.A.; Wang, J.J.; Selva, K.J.; Reynaldi, A.; Tan, H.X.; Lee, W.S.; Wragg, K.M.; Kelly, H.G.; Esterbauer, R.; et al. Evolution of immune responses to SARS-CoV-2 in mild-moderate COVID-19. Nat. Commun. 2021, 12, 1162. [Google Scholar] [CrossRef] [PubMed]
- Padoan, A.; Dall’Olmo, L.; Rocca, F.D.; Barbaro, F.; Cosma, C.; Basso, D.; Cattelan, A.; Cianci, V.; Plebani, M. Antibody response to first and second dose of BNT162b2 in a cohort of characterized healthcare workers. Clin. Chim. Acta 2021, 519, 60–63. [Google Scholar] [CrossRef] [PubMed]
- Lo Sasso, B.; Giglio, R.V.; Vidali, M.; Scazzone, C.; Bivona, G.; Gambino, C.M.; Ciaccio, A.M.; Agnello, L.; Ciaccio, M. Evaluation of Anti-SARS-Cov-2 S-RBD IgG Antibodies after COVID-19 mRNA BNT162b2 Vaccine. Diagnostics 2021, 11, 1135. [Google Scholar] [CrossRef] [PubMed]
Figure 1.
Correlations between ELISA (QuantiVac ELISA IgG, Euroimmun) and Maglumi (IgG anti-RBD, SNIBE) SARS-CoV-2 IgG levels in patients’ specimens. The trend lines represent the Passing–Bablock correlation. (a) Concentrations expressed in the respective units of each manufacturer [Maglumi= 0.581 (−0.21/2.64) ELISA + 0.284 (0.24/0.33)]. (b) Concentrations expressed as binding antibodies units (BAU) [Maglumi = 2.45 (−1.6/+10.6) +0.39 (0.33/0.46) ELISA].
Figure 2.
Distribution of IgG levels of the single specimens measured by ELISA in relation to the days since the onset of symptoms. In abscissa are reported the days from the onset of symptoms, in ordinate are reported the concentrations of IgG. The solid line connects the median concentrations of IgG for each class of cases, and the dotted line connects the respective 25–75° percentile. Black circles represent the singles specimens.
Figure 3.
Distribution of IgG levels of the single specimens measured by Maglumi in relation to the days since the onset of symptoms. In abscissa are reported the days from the onset of symptoms, in ordinate are reported the concentrations of IgG. The solid line connects the median concentrations of IgG for each class of cases, and the dotted line connects the respective 25–75° percentile. Black circles represent the singles specimens.
Figure 4.
Spaghetti plot of the 13 patients with more than one withdrawal in more than 180 days from the onset of symptoms, measured by Maglumi (a) and ELISA (b).
Figure 4.
Spaghetti plot of the 13 patients with more than one withdrawal in more than 180 days from the onset of symptoms, measured by Maglumi (a) and ELISA (b).
Figure 5.
Correlation between ELISA and Maglumi methods in vaccinated subjects after the first dose. The trend lines represent the Passing–Bablock correlation. (a) Concentrations expressed in the respective units of each manufacturer [Maglumi= −0.89 (−6.1/+1.2) + 0.59 (0.47/0.78) ELISA. (b) Concentrations expressed as binding antibodies units [Maglumi = −5.1 (−26.8/+5.0) + 0.82 (0.64/1.07) ELISA]. Regression line (solid line), confidence interval lines (dashed lines) and identity line (dotted line) are displayed. Circles represent the single cases.
Figure 6.
Correlation between ELISA and Maglumi methods in vaccinated subjects 15 days after the second dose. The trend lines represent the Passing–Bablock correlation. (a) Concentrations expressed in the respective units of each manufacturer [Maglumi= −52.4 (−107/+19.2) + 0.85 (0.74/0.92)]. (b) Concentrations expressed as binding antibodies units [Maglumi = −227.9 (−464/ + 69.9) + 1.14 (0.99/1.25) ELISA]. Regression line (solid line), confidence interval lines (dashed lines) and identity line (dotted line) are displayed. Circles represent the single cases.
Figure 7.
Correlation between ELISA and Maglumi methods in vaccinated subjects 3 months after the second dose. The trend lines represent the Passing–Bablock correlation. (a) Concentrations expressed in the respective units of each manufacturer [Maglumi= −16.2 (−37.5/+5.7) + 0.78 (0.65/0.98) ELISA]. (b) Concentrations expressed as binding antibodies units [Maglumi = −72.8 (−166.8/+24) + 1.07 (0.88/1.35) ELISA]. Regression line (solid line), confidence interval lines (dashed lines) and identity line (dotted line) are displayed. Circles represent the single cases.
Table 1.
Characteristics of the studied patients.
Table 1.
Characteristics of the studied patients.
| Symptoms at the Onset of Disease | Frequency (%) |
|---|
| Fever | 75.0 |
| Cough | 60.4 |
| Dyspnea | 29.2 |
| Nausea | 8.3 |
| Asthenia | 6.3 |
| Others | 10.5 |
| Disease severity | n of patients |
| Mild | 9 |
| Moderate | 16 |
| Severe | 11 |
| Critical | 12 |
| n of specimens | n of patients |
| 1 | 19 |
| 2 | 12 |
| 3 | 7 |
| 4 | 7 |
| 5 | 2 |
| 6 | 1 |
Table 2.
Sensitivity and antibodies levels of ELISA (QuantiVac ELISA IgG, Euroimmun) and Maglumi (IgG anti-RBD, SNIBE) methods in the different patient’s specimens subdivided in time frames according to the day from the onset of symptoms.
Table 2.
Sensitivity and antibodies levels of ELISA (QuantiVac ELISA IgG, Euroimmun) and Maglumi (IgG anti-RBD, SNIBE) methods in the different patient’s specimens subdivided in time frames according to the day from the onset of symptoms.
| | Positivity Rate | ELISA Levels (RU/mL) | Maglumi Levels (AU/mL) |
|---|
| Days from Symptoms’ Onset | n of Specimens | ELISA | Maglumi | 25 Percentile | Median | 75 Percentile | 25 Percentile | Median | 75 Percentile |
|---|
| ≤11 * | 17 | 41.2% | 76.5% | 2.4 | 10.3 | 37.1 | 1.0 | 3.1 | 14.1 |
| 12–16 * | 15 | 73.3% | 80.0% | 6.7 | 68.1 | 404.0 | 2.3 | 24.9 | 50.6 |
| 17–22 | 14 | 100.0% | 100.0% | 76.8 | 191.5 | 438.0 | 25.6 | 48.8 | 58.1 |
| 23–43 | 16 | 100.0% | 100.0% | 137.5 | 250.5 | 448.5 | 43.2 | 50.5 | 61.5 |
| 46–72 | 15 | 100.0% | 100.0% | 183.2 | 259.2 | 330.2 | 49.8 | 82.7 | 126.0 |
| 81–162 * | 16 | 93.7% | 100.0% | 57.8 | 102.6 | 149.0 | 23.1 | 34.6 | 53.1 |
| 168–371 * | 15 | 86.7% | 100.0% | 29.4 | 39.6 | 110.3 | 13.9 | 22.2 | 48.1 |
Table 3.
Concentrations of antibodies anti SARS-CoV-2 in the vaccinated subjects measured by ELISA (QuantiVac ELISA IgG, Euroimmun) and Maglumi (IgG anti-RBD, SNIBE) methods, expressed both in the respective units of each manufacturer and in binding antibodies units.
Table 3.
Concentrations of antibodies anti SARS-CoV-2 in the vaccinated subjects measured by ELISA (QuantiVac ELISA IgG, Euroimmun) and Maglumi (IgG anti-RBD, SNIBE) methods, expressed both in the respective units of each manufacturer and in binding antibodies units.
| | ELISA Levels | Maglumi Levels |
|---|
| | | Median | Interquartile Range | Median | Interquartile Range |
|---|
| Manufacturer-defined units/mL | 15 days after the first dose | 27.2 | 16.4–42 | 18.1 | 6.6–27.7 |
| 15 days after the second dose | 704.5 | 388.5–940 | 499 | 335.9–756.8 |
| 3 months after the second dose | 129.6 | 95.2–244 | 84.6 | 47.7–195 |
| Binding antibody units/mL (WHO) | 15 days after the first dose | 87 | 58.1–113.8 | 78.4 | 30.8–113 |
| 15 days after the second dose | 2254 | 1243–3008 | 2160 | 1454–3277 |
| 3 months after the second dose | 366.1 | 206.7–844 | 414.7 | 305–781 |
| Publisher’s Note: MDPI stays neutral with regard to jurisdictional claims in published maps and institutional affiliations. |
© 2021 by the authors. Licensee MDPI, Basel, Switzerland. This article is an open access article distributed under the terms and conditions of the Creative Commons Attribution (CC BY) license (https://creativecommons.org/licenses/by/4.0/).


