1. Introduction
In recent years, the demand for high-quality wireless connectivity has steadily increased. This increasing demand is a result of emerging applications and services, such as autonomous vehicles, IoT devices, online video streaming, and augmented reality, that are integrated into the multiverse of NFTs [
1,
2]. This massive demand leads to an increase in data traffic and causes problems for the mobile network infrastructure. Since 2011, data traffic on mobile networks has increased 300-fold, growing 42% per year. By the end of 2027, the total volume is predicted to reach 370 exabytes [
3]. The prediction shows a rapid acceleration in the massive use of IoT in smart cities, with 51% of all connections in the mobile network by 2027, leading to relevant discussions on the adoption of the IoE concept, which is gaining traction along with fifth- and sixth-generation networks [
3,
4]. The Internet of Things (IoT) is the fastest growing category, expected to generate massive network traffic and potentially account for half of global connectivity. Within this segment, home automation apps will have the largest share at 48% of devices, and autonomous cars will see the largest growth over time [
5]. This accelerated growth has a direct impact on telecommunication networks, causing congestion that affects the quality of service and experience if there is no planning. Therefore, determining the traffic on the network is extremely important to allow for planning and to support the network at critical moments. For temporary events such as concerts and sporting events, it is easier to calculate and predict the instantaneous traffic than in situations where the mobile network load fluctuates and depends on time and space or due to an environmental disaster [
6]. In this context, the use of unmanned aerial vehicles (UAVs) mounted on base stations (UAV-BS) can serve to complete the existing mobile network structure [
7], provide wireless communication services to blocked users, increase the capacity of the mobile system [
8], minimize coverage gaps, and help reduce the sudden increase in demand that is one of the main problems leading to congestion during hotspot events [
9]. Unlike fixed infrastructures, UAVs can provide time-limited services on demand due to their flexibility, rapid deployment without constraints, and low cost compared to traditional services [
10,
11]. UAVs can be used to bring communications to areas where there is no infrastructure and as network backup to improve fault tolerance [
12]. In areas of environmental disaster, UAVs can be used as the primary equipment to support rescue and as a communication tool to expedite self-rescue [
13]. Standardization activities are already underway, regulated by 3GPP, to provide promising services using UAV BSs for the mobile network [
14].
In addition, integrating UAVs with the next-generation 5G mobile system can be an excellent solution for users and applications that rely on low latency and high throughput, improving the quality of experience (QoE) in the region [
15]. The combination of these two technologies can be beneficial for telecommunication networks. For example, the low consumption of 5G operations can help with the power shortage that exists on the UAV side, and networks can become more secure through the use of encryption in 5G. UAVs can help in the deployment of 5G in regions where network deployment will be gradual or is non-existent, and in planning in regions where there are only previous generation networks that face congestion issues [
16]. The use of UAVs to support next-generation 5G/6G networks is extremely important to improve the quality of the mobile system by increasing the coverage area and providing high-quality Internet in regions where the mobile network is poor.
In this paper, we propose an intelligent system based on machine learning using UAV-BS as a base station to support the mobile communication network, which is affected by the impact of the congestion caused by the high density of users. The proposal aims to solve problems in regions where congestion is mainly caused by the temporal and spatial fluctuation of users. This fluctuation directly affects the prediction of the load generated by the network due to the nonlinearity of the data. We used the random forest and generalized regression neural networks (GRNN) models to perform real-time predictions and identify overloaded macrocells. The models are appropriate for the type of data and provide high accuracy in predicting the affected regions. We calculated the number of UAV BSs needed and then used the K-means algorithm to find the optimal positioning of the UAV-BSs to thereby reduce the power consumption of the UAVs by improving the energy efficiency and improving the quality in the coverage area of the overloaded macrocell by reducing the blockage of users.
Our contributions to this paper can be summarized as follows:
We propose an intelligent system based on the prediction of the load generated by the mobile network, which is to be supported by an aerial mesh network that minimizes macrocell congestion. The proposed system performs preplanning of the number of UAV-BS to be supported and two strategies are used to evaluate the number of devices against QoS. The system also performs the calculation to find the optimal placement of each UAV-BS that minimizes energy consumption.
We present the case study through simulation with numerical results, showing the advantages and efficiency of the proposed intelligent system.
The prediction model used for the region studied in this paper can be used in other regions, as it needs to be trained for the new database.
The intelligent system presented in this article is not limited to cases where demand fluctuates. It can also be used to solve congestion problems during transient events with prior planning in areas where telecommunication service is expensive due to adverse conditions or network unavailability. The rest of the paper is organized as follows: Related work is the focus of
Section 2, where the research related to the proposed topic is briefly presented.
Section 3 discusses the system model. In
Section 4, the LPA and UCPA algorithms are explained and we present how the prediction of the load generated by the network was performed, the models, the database, the metrics and the strategies to calculate the number of UAV-BSs, and the algorithm to position the UAV-BSs.
Section 5 presents the simulation and case study. The numerical results, analysis, and discussion on the performance of the proposed method are presented in
Section 6.
Section 7 concludes this paper with the main conclusions.
2. Related Work
UAVs are taking over important roles in society, especially in the field of telecommunications, where they are the main solution when temporary support and a relatively low cost–benefit ratio are required. Works such as [
6,
17] try to minimize the UAV battery cost, which increases efficiency and uptime. One of the most common solutions to this problem is to optimize the trajectory and find the optimal positioning of the UAV to increase energy efficiency. In [
18], a method for tracking an energy-efficient trajectory is proposed to minimize the energy consumption of UAV BSs. This solution improves UAV communication and mobility by meeting reliability and latency requirements for IoT applications and users in hard-to-reach areas. Authors [
19] present an intelligent positioning mechanism for UAV BSs. The SUAP system is used to improve the operation of mobile networks in emergencies. The placement of UAV-BS was modeled as an optimization problem to obtain the necessary network resources and provide temporary connectivity to improve system performance. In the work [
20], a route-planning method was developed for UAVs deployed in areas with limited network coverage for applications that stream data. Unlike other planning, this requires the QoS served by the UAVs to preserve bandwidth. A mathematical model was presented to formulate a combinatorial optimization problem that attempts to minimize the flight cost of the UAVs covering the area of interest to be minimized. The heuristic method derives the number of UAVs and determines their flight path, minimizing energy consumption and improving link throughput. Similarly, the authors [
21] propose the 3D deployment of a group of UAVs, called AAPs, for uplink communications while considering inter-cell interference and energy consumption. The positioning problem is divided into two parts: the vertical one, which is analytically derived from the inter-cell interference and the energy consumption of the AAP, and the second part, the horizontal positioning, which is treated with a circular packing problem that is solved with a multilevel regular polygon algorithm that maximizes the packing density of the coverage area of APP and also determines a necessary upper bound on the number of APPs that can be deployed in a circular area.
We can find real-time solutions to problems that are extremely difficult to solve. In [
22], an efficient strategy for optimal UAV positioning in terrain with real obstacles is developed. The strategy is adaptable to the degree of line of sight, depending on the average real-time position. The work proves that proper global positioning is sufficient to determine the linear search path of the target area. The proposal showed superior performance gains compared to strategies based on probabilistic models. For real-time problems, the authors [
23] proposed an autonomous solution for 3D UAV locations without the need to use GPS or other detectable mobile signals transmitted by the UAV. The method uses existing mobile infrastructure to allow the UAV to determine its location based on the positioning of four neighboring base stations. Heuristics were used for the solution to determine the optimal boundary. This approach uses supervised learning and reinforcement learning to solve the problem in real time, which is extremely important for such applications, unlike other techniques such as optimization, which have difficulty working in real time. In [
24], a form of computational learning is presented to achieve UAV self-organization in a wireless communication system. The approach uses the strategy of parameter mutation combined with virtual force to achieve flexibility in the instantaneous motions of UAVs to achieve significant improvements in key performance indicators. The work of [
25] proposes an approach to minimize the time to detect power outages in the main grid and provide on-demand coverage based on UAV-BSs. The proposal uses UAV-BSs and a Q-learning algorithm to autonomously detect coverage gaps and then deploy wireless communication devices considering wireless backhaul and user demand. Machine learning assisted the UAV BSs to eliminate the human-in-the-loop (HiTL) model to optimize the 3D placement of UAV-BS at different angular positions and maximize the number of associated users. In [
26], a UAV control system that follows Bézier curves is proposed to improve the approach to groups of users on the ground by increasing the coverage as the user moves. The proposed algorithm is based on a mixed-integer nonconvex programming formulation for an NP-complete coverage problem. The solution not only optimized the positions of UAVs in 3D space in polynomial time but also managed to assign flight paths by solving the assignment problem with Bézier curves. The authors in [
27] study the problem of energy consumption in networks of cell-connected UAVs by considering the urban communication environment, UAV power consumption, mission duration, UAV path, and station-based communication to minimize UAV power consumption by ensuring stable connectivity throughout the flight in the coverage area. The proposal presents efficient results based on graph theory by applying the convex optimization technique and shortest path algorithm with dynamic weighting to the graph. The above studies present different solutions to solve the problem of optimal UAV positioning, coverage area, and energy efficiency of UAVs to improve communication with users and applications in the communication network.
In the literature, several studies propose the use of machine learning to perform the optimization or prediction of certain variables such as the distribution of users, the positioning of UAVs, the use of the channel, and the congestion of the network to improve the scheduling and deployment of UAVs to offer a more efficient temporary infrastructure. In [
28], an algorithm is presented that aims to optimize the positioning and transmission power of UAV-BS and also improve energy efficiency, minimizing the number of users not served by the network. The proposal uses a Q-learning-based algorithm where the reward can be adjusted and a balance between the number of unserved users and energy consumption is achieved. The main goal is to make the UAV-BS adaptive and enable it to make autonomous decisions to achieve better coverage, reduce interference, and achieve energy efficiency. In [
29], visible light communications (VLC) is enabled by a new UAV deployment framework to dynamically optimize the placement and assignment of users to UAVs based on a VLC network. The proposal seeks to minimize transmission power while meeting the lighting and communication requirements of individual users. The solution uses an algorithm based on gated recurrent units (GRU) and convolutional neural networks (CNNs) to predict the illumination distribution in the long-term history to find the optimal position for UAV deployment and efficiently improve user communication and illumination. In [
30], a solution using UAV-BSs is developed for transient user demand problems that overload the mobile network due to limited infrastructure capacity during peak hours in tourist regions. The solution defines the effective coverage area and the vertical derivative of the UAV altitude. Then, the automatic UAV-BS deployment algorithm determines the minimum number of UAV-BSs and their optimal positioning while improving user communications. Ref. [
31] presents a solution to find the ideal location of UAVs in a heterogeneous network to support the base station serving ground users. The proposal formulates multiple UAV placement of multiple UAVs, resource allocation, and user assignment as an optimization problem to maximize the sum rate of all users under constrained QoS requirements. In [
32], an artificial intelligence (AI) is proposed to overcome the challenges posed by random fluctuations of the wireless channel, blockages, and user mobility in a UAV-assisted network (UAWN). The solution uses multiple UAVs simultaneously as a base station that can randomly adapt to the hovering environment. Moreover, AI helps iterate the UAVs in the swarm for cooperative optimization of the system and effectively improves resource allocation, path design, and network performance. On the other hand, a new approach based on machine learning methods for predicting the location of mobile users using UAVs is presented in [
33]. The solution uses partial location information collected and stored in each UAV to train the deep neural network and perform the prediction. In this paper, a Lyapunov-based optimization framework is developed to decompose the original problem based on the prediction results. Then, an iterative optimization scheme is developed along with successive convex approximation techniques to solve the subproblems and efficiently improve the service coverage for users. Recently, the authors of [
34] presented a new proposal for the predictive use of UAVs as a temporary base station to complete the terrestrial mobile communication network when the downlink is overloaded. An approach based on a weighted expectation maximization algorithm is proposed to estimate user distribution and traffic demand. To ensure the information exchange between BS and the UAV, a contract theory is derived analytically and implemented considering the necessary constraints. The proposal formulates an optimization problem for the optimal deployment of UAVs in the hotspot area such that the utility of the congested BS is maximized and UAV operators can provide efficient communication services to hotspot users. As shown in the above work, several solutions are presented that aim to solve the main problems that hinder both the service provided by UAVs and the communication networks, directly affecting users and service providers.
Our work can be considered as an alternative to the coverage problems and overhead caused by the fluctuation of user demand in next-generation 5G networks. In contrast to the presented work, this paper proposes an intelligent system for regions that need to improve user coverage and services offered by concessionaires without having to set up new fixed structures. Our research presents a system that offers mobile base stations that take into account the temporal and spatial flow of users in the region, so that UAV-BSs will be able to support in strategic locations where the user density is higher, such as the peak hours presented in [
35]. The advantage of a system that takes into account time and space is the flexibility that the concessionaire can have in deploying the mobile structure only when necessary, avoiding the idling that occurs with fixed structures in regions where the user density is dependent, for example, diurnal.
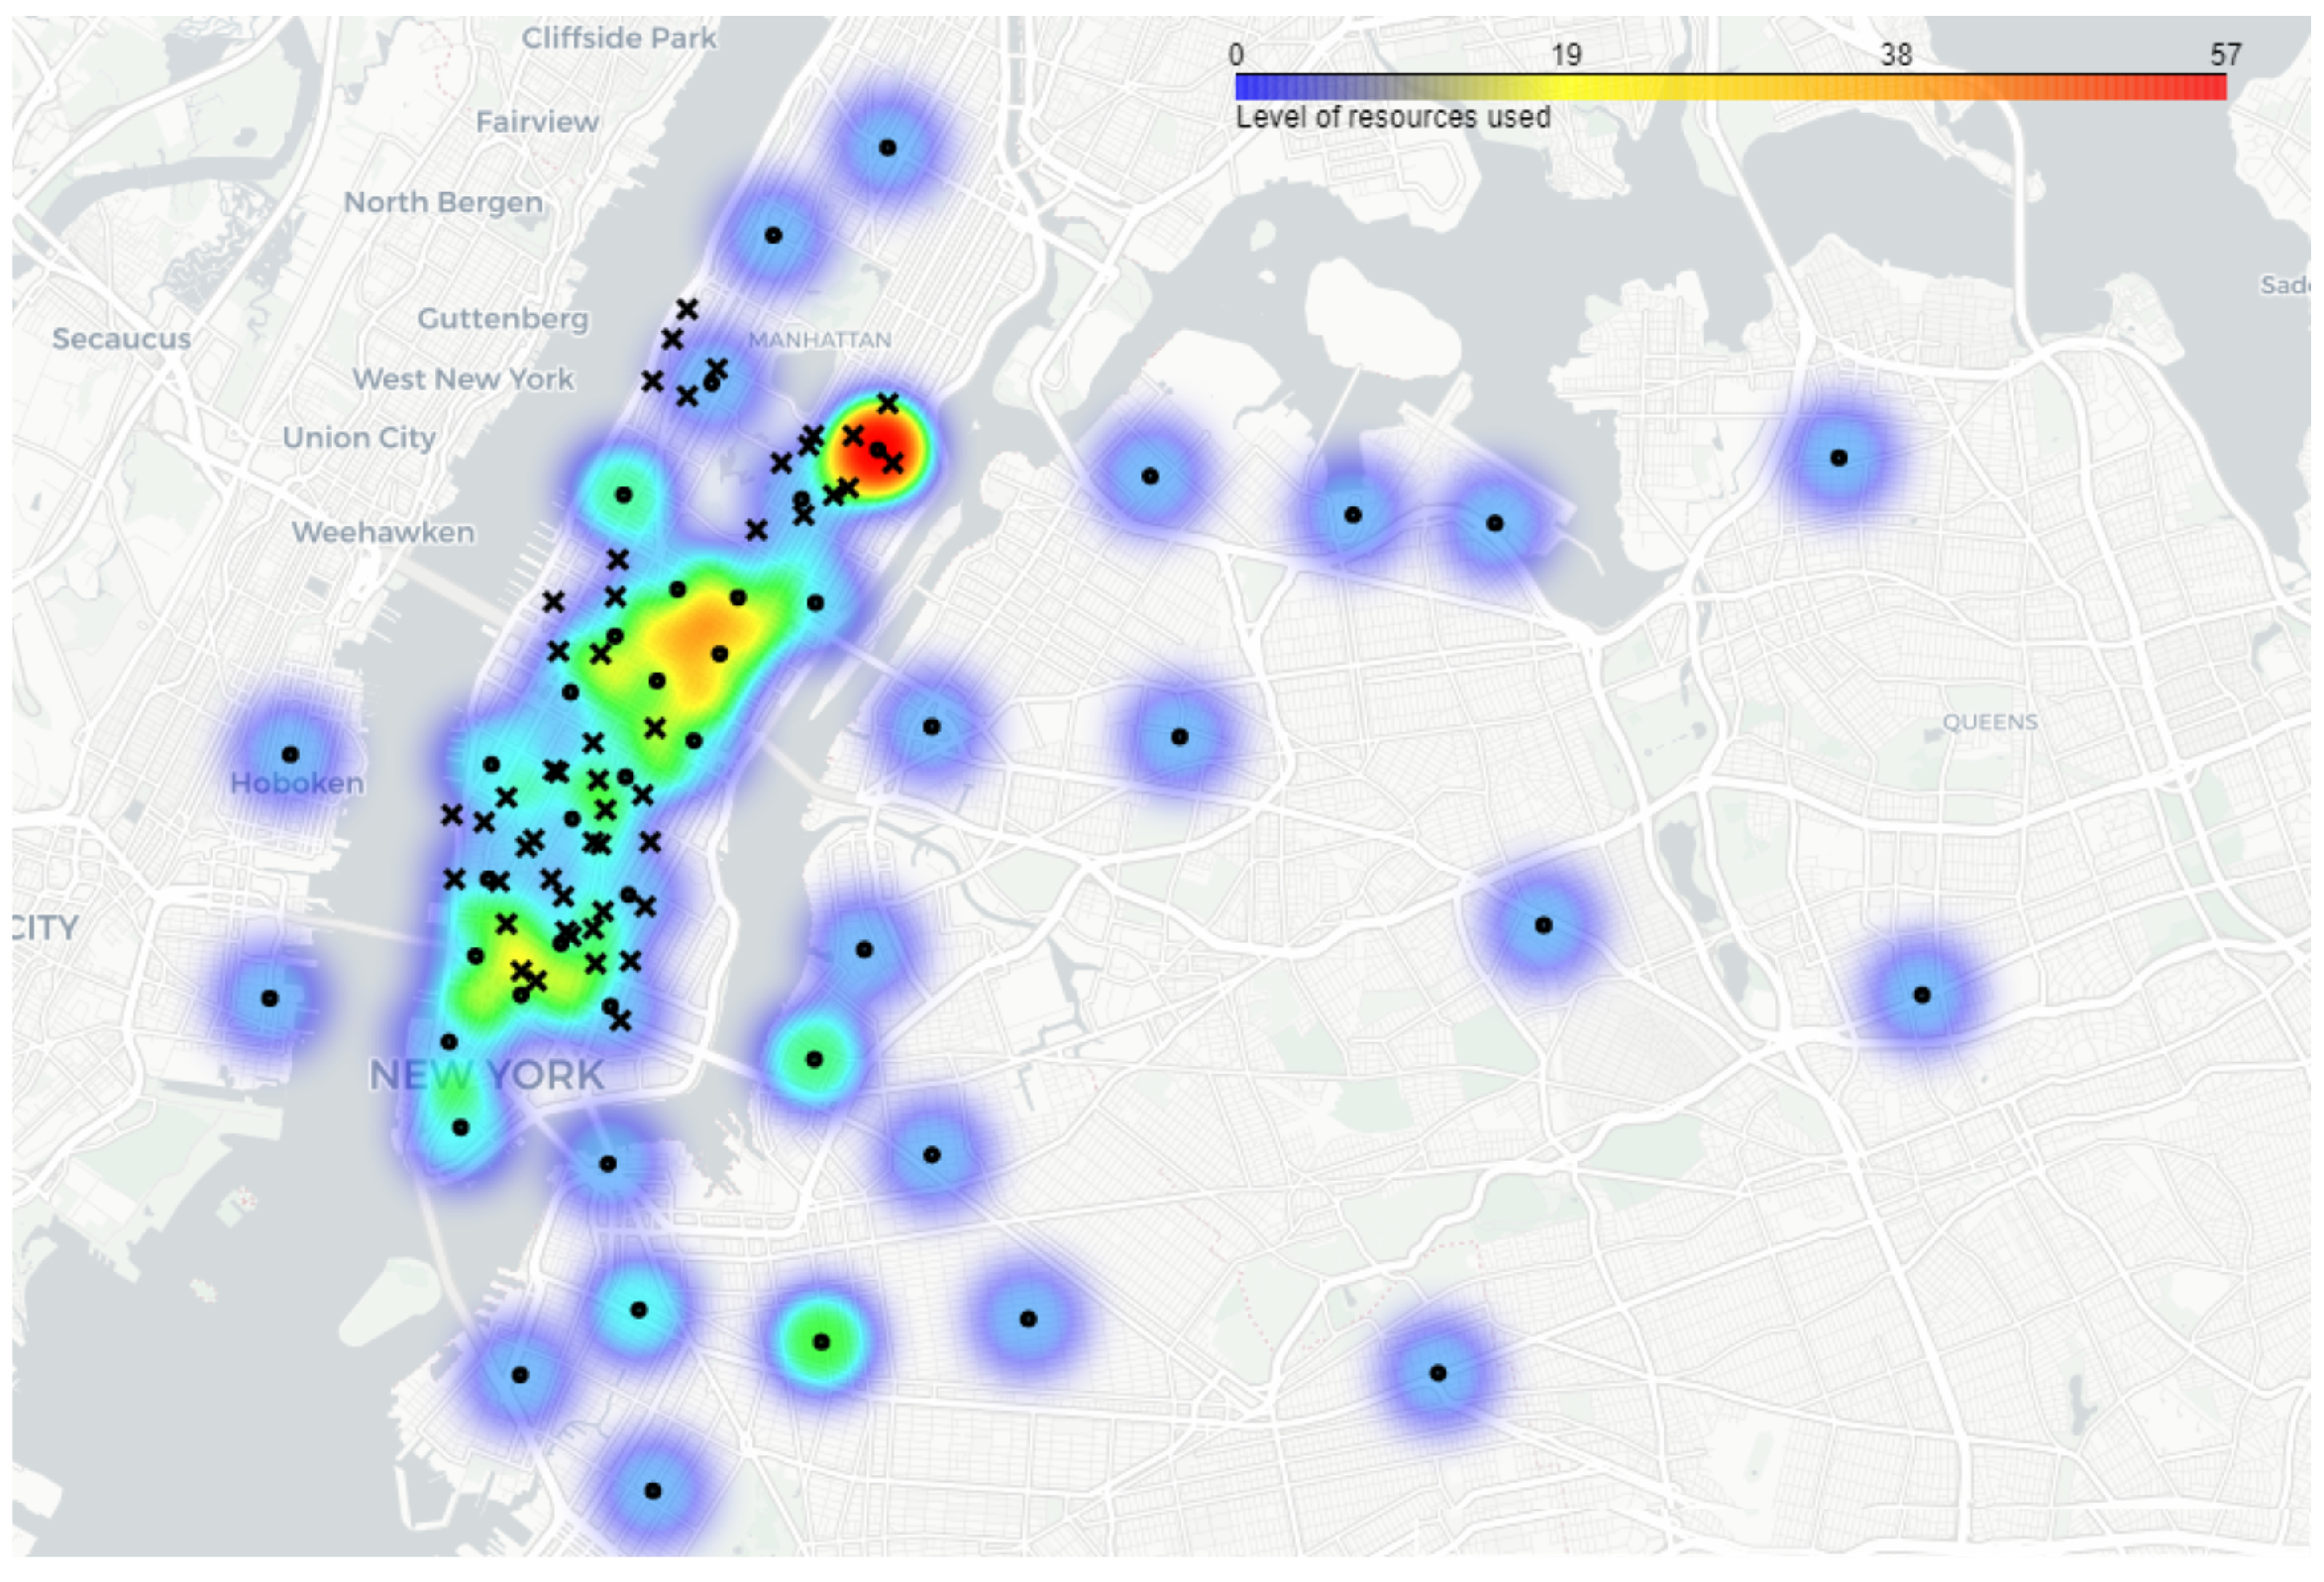
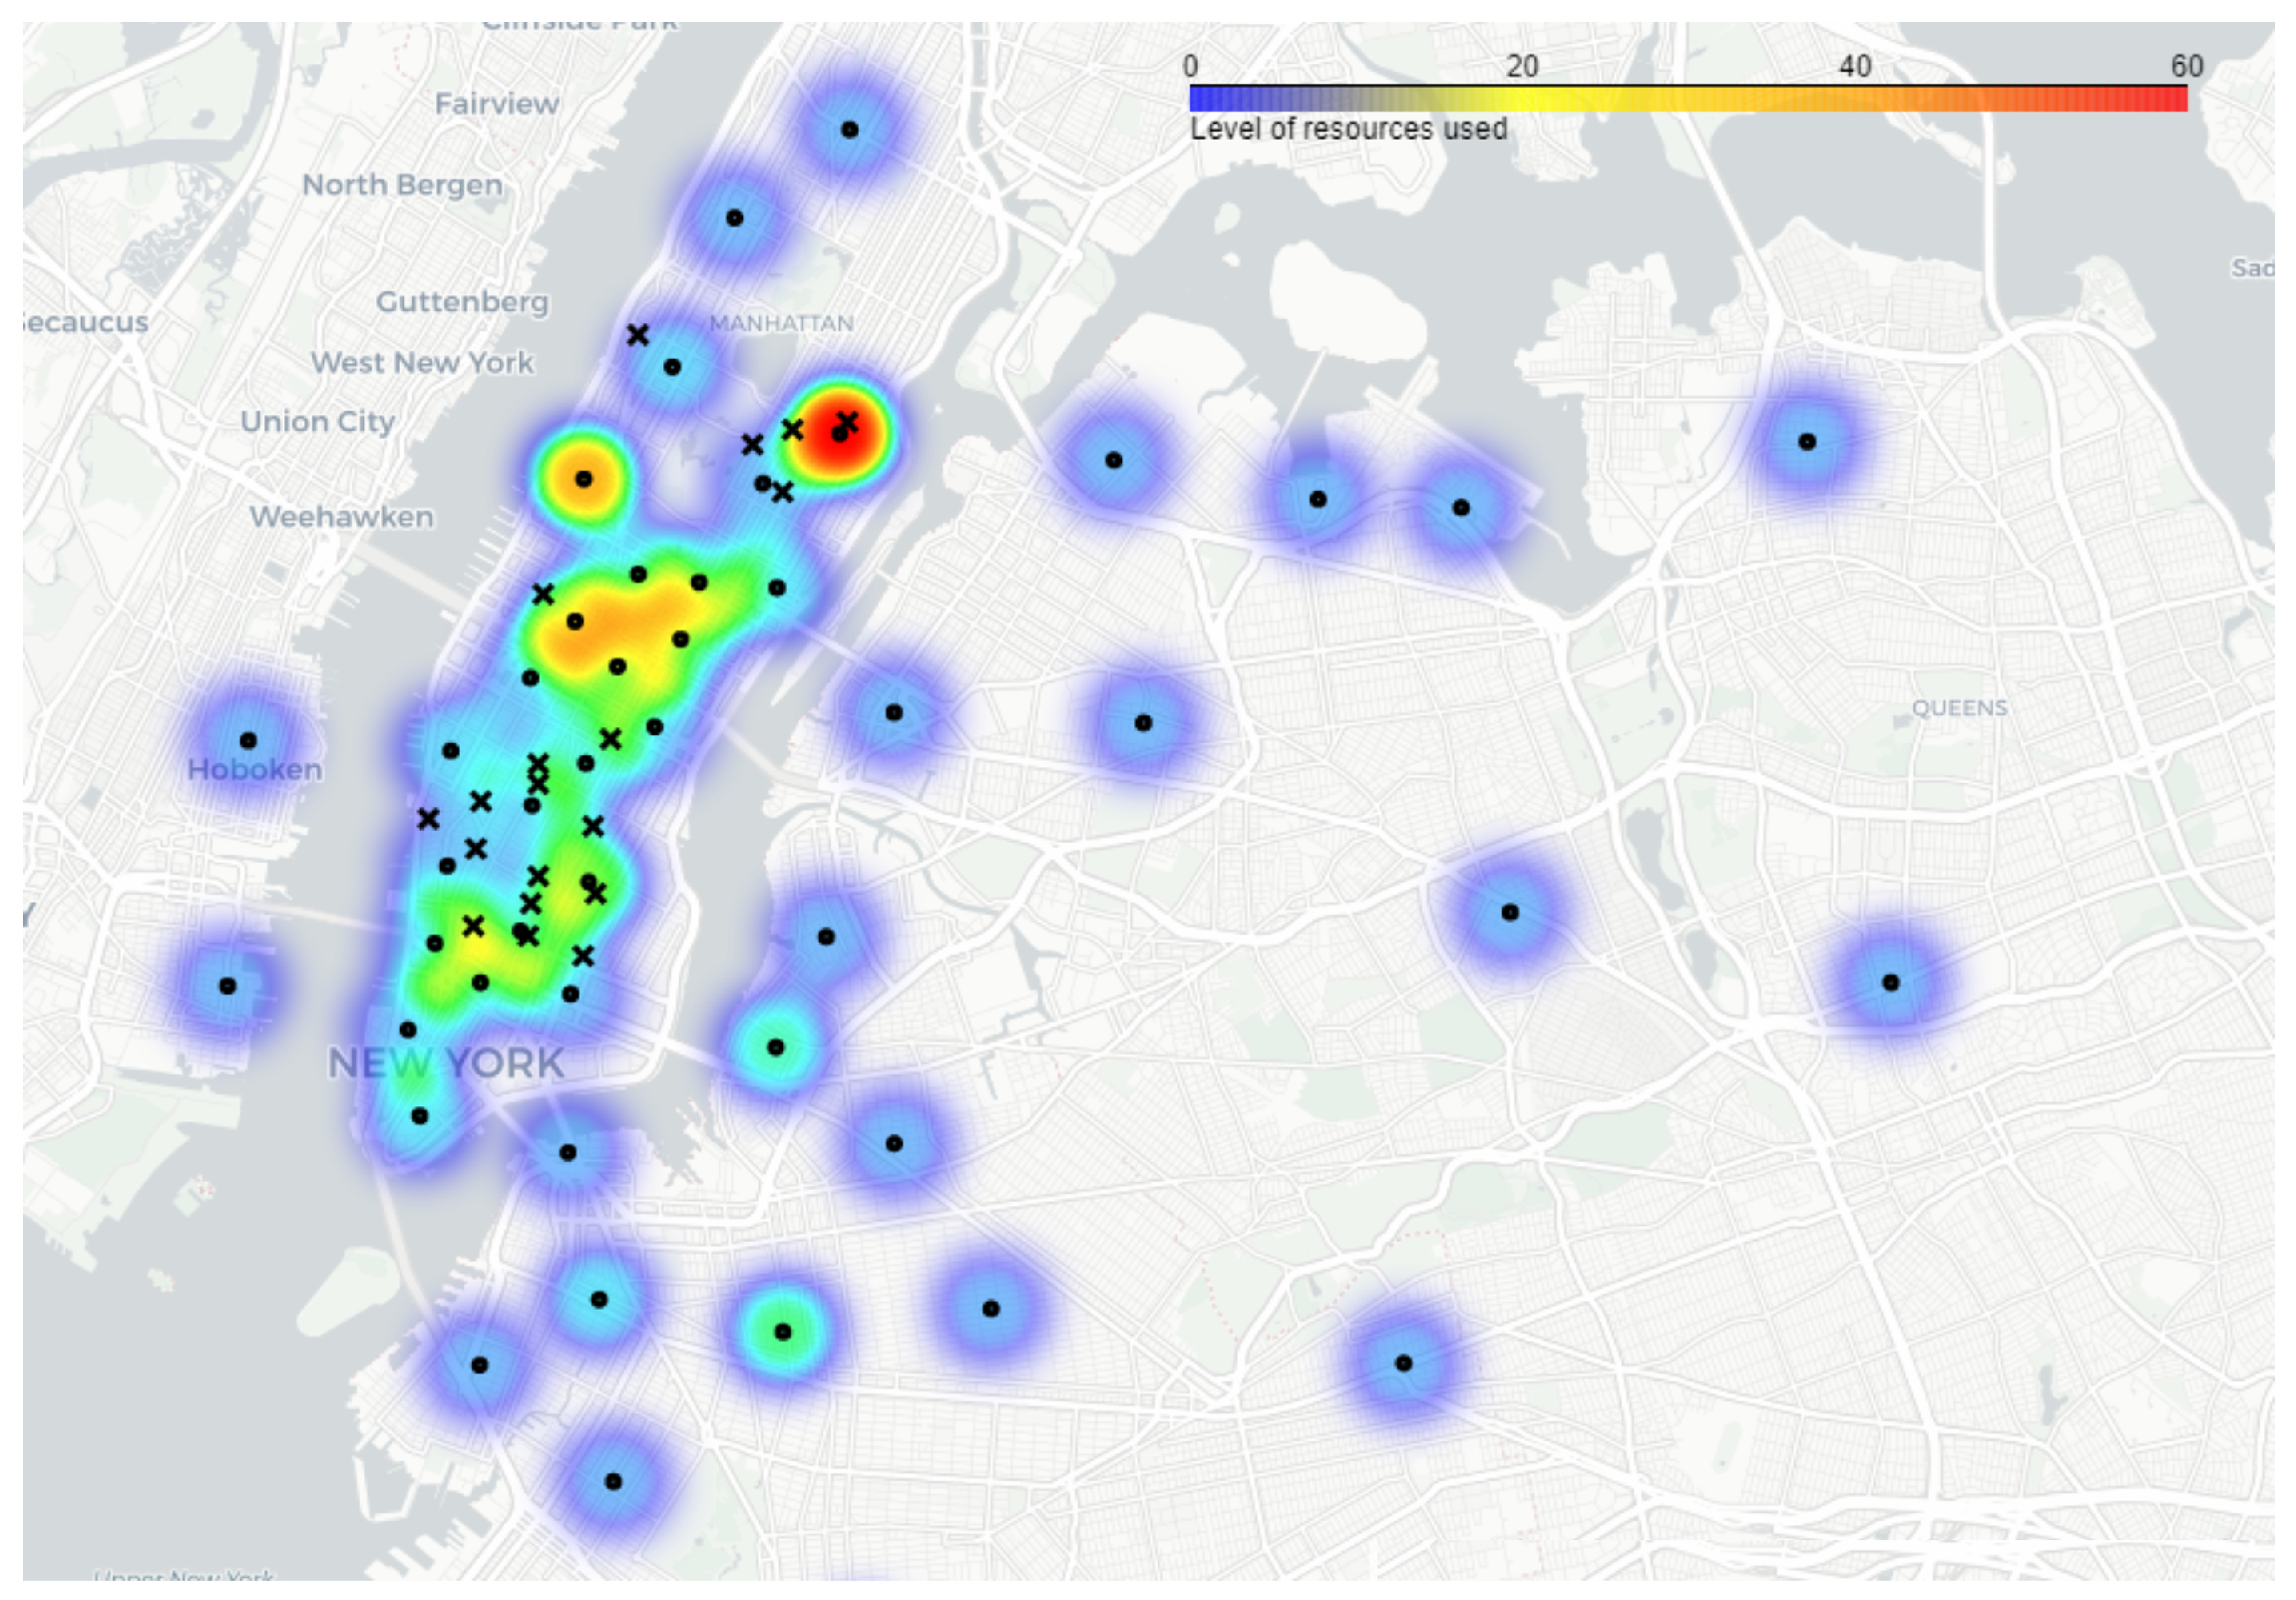
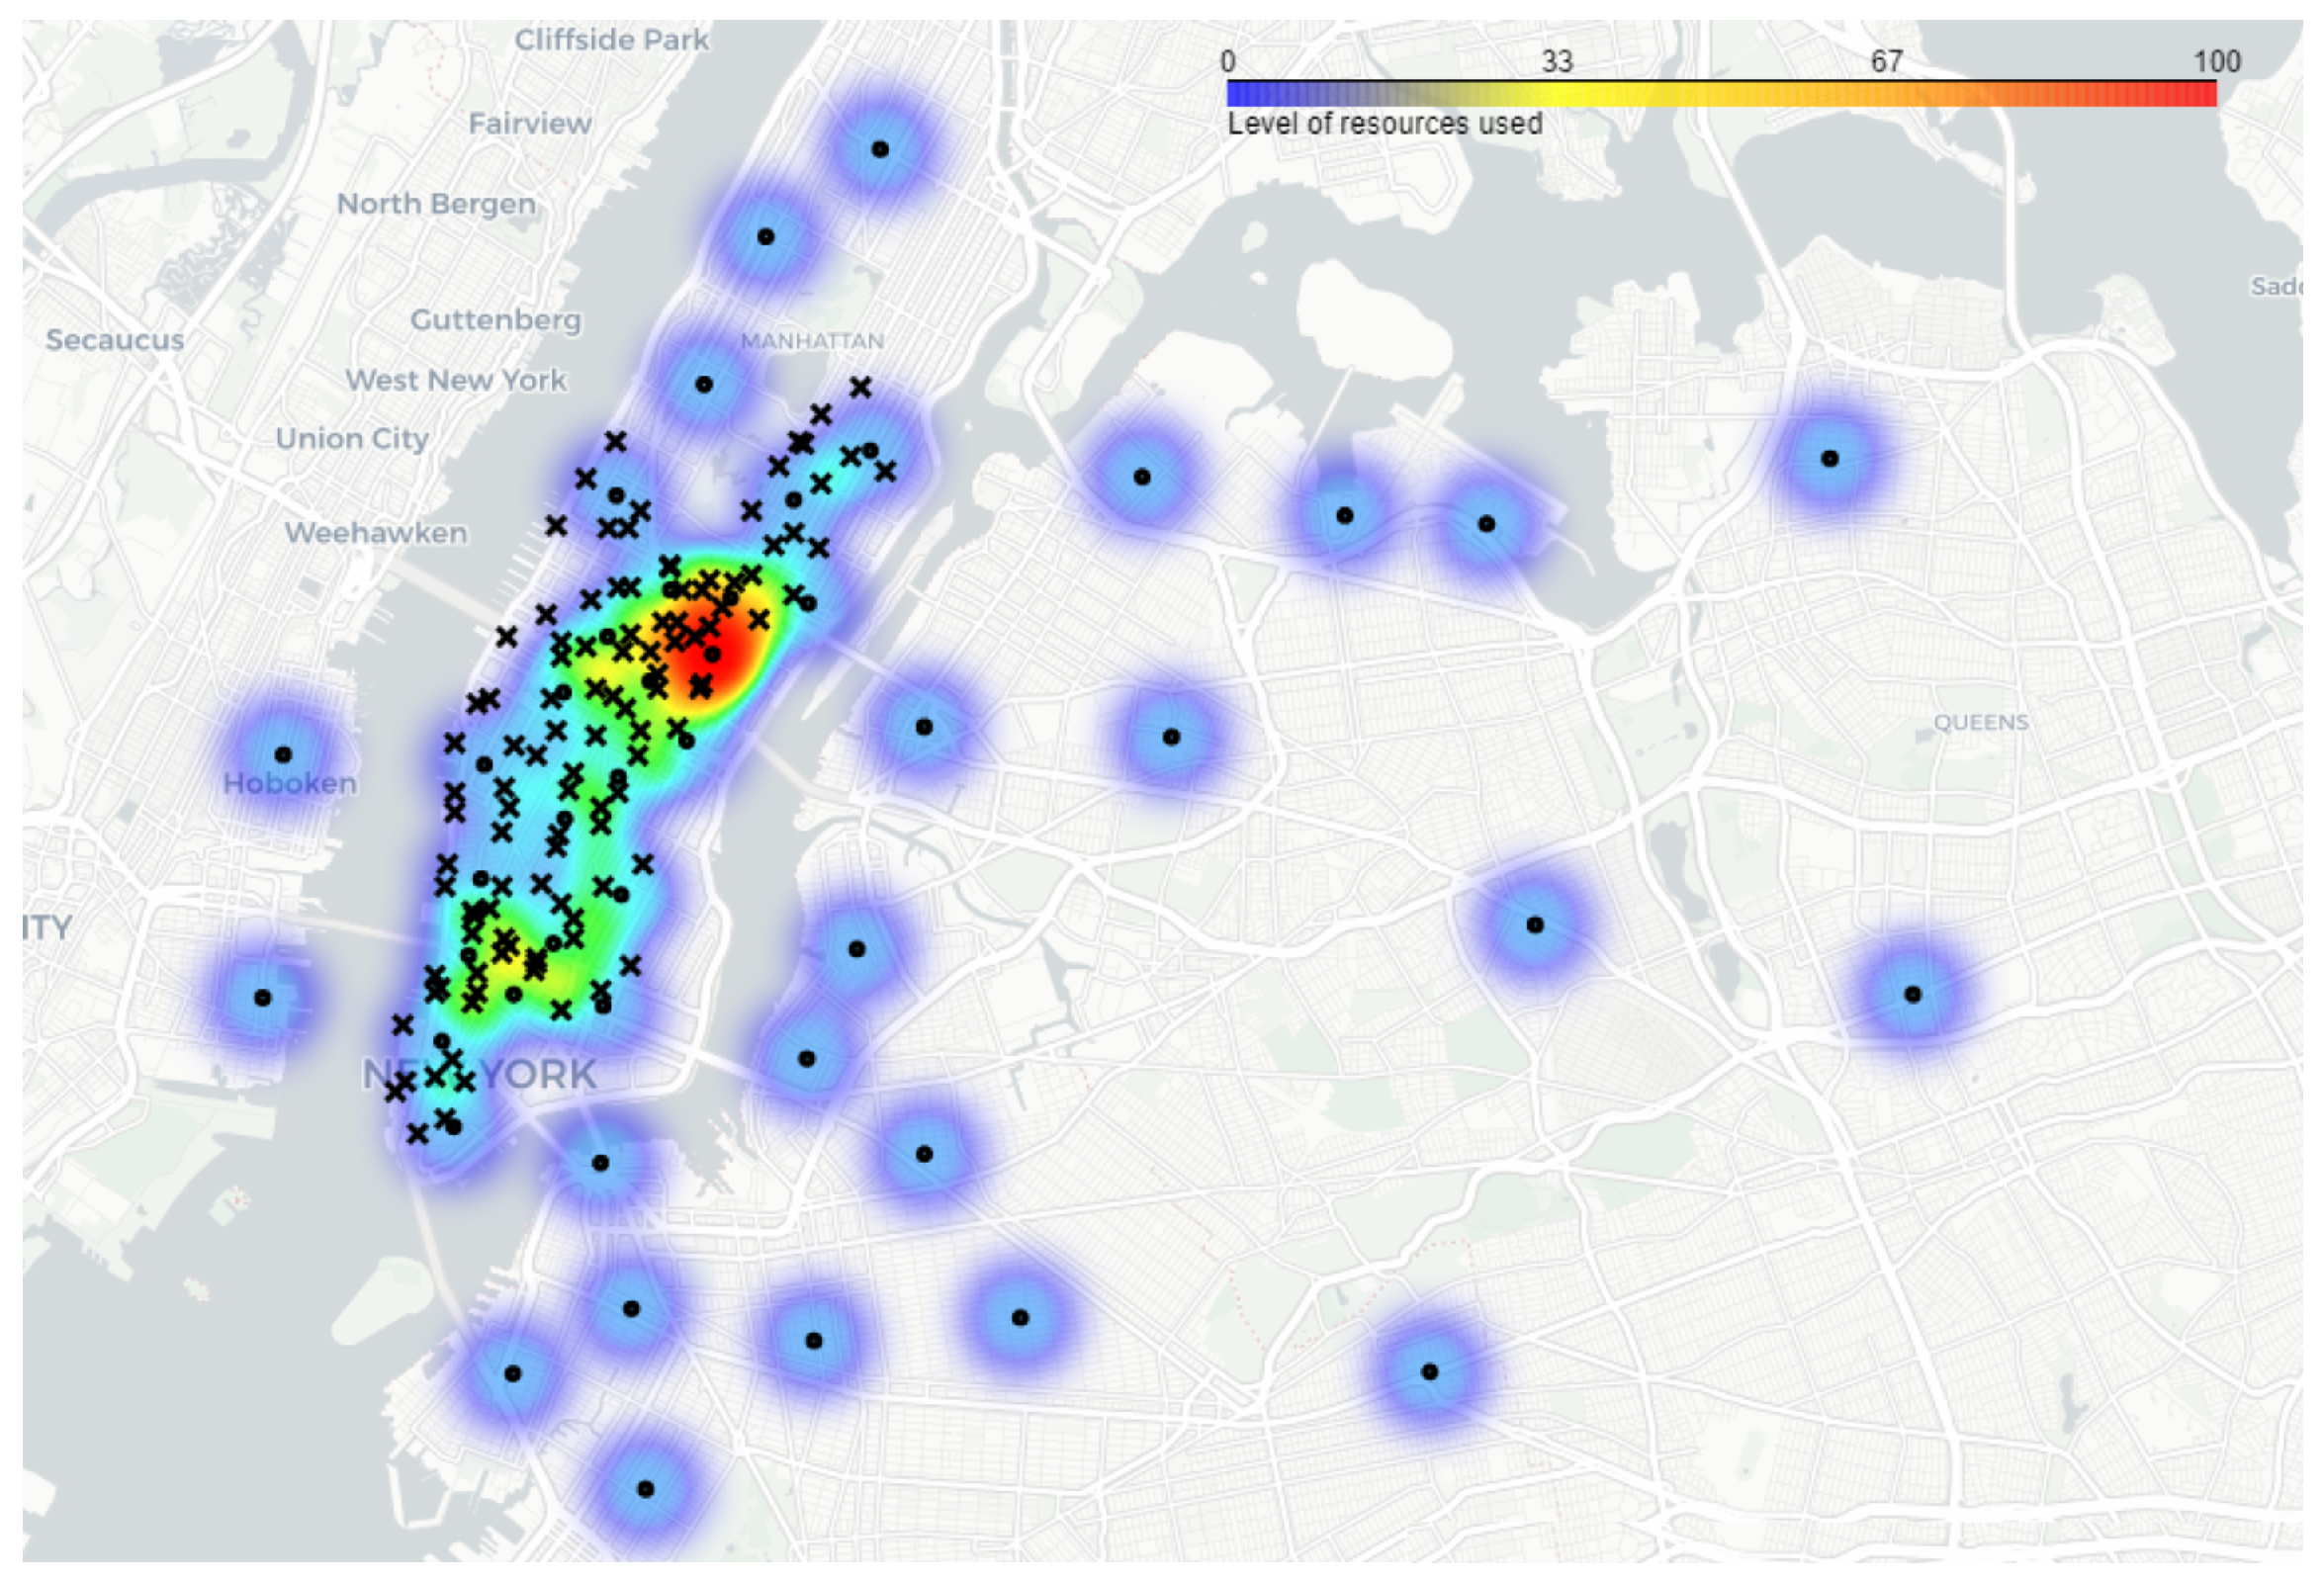
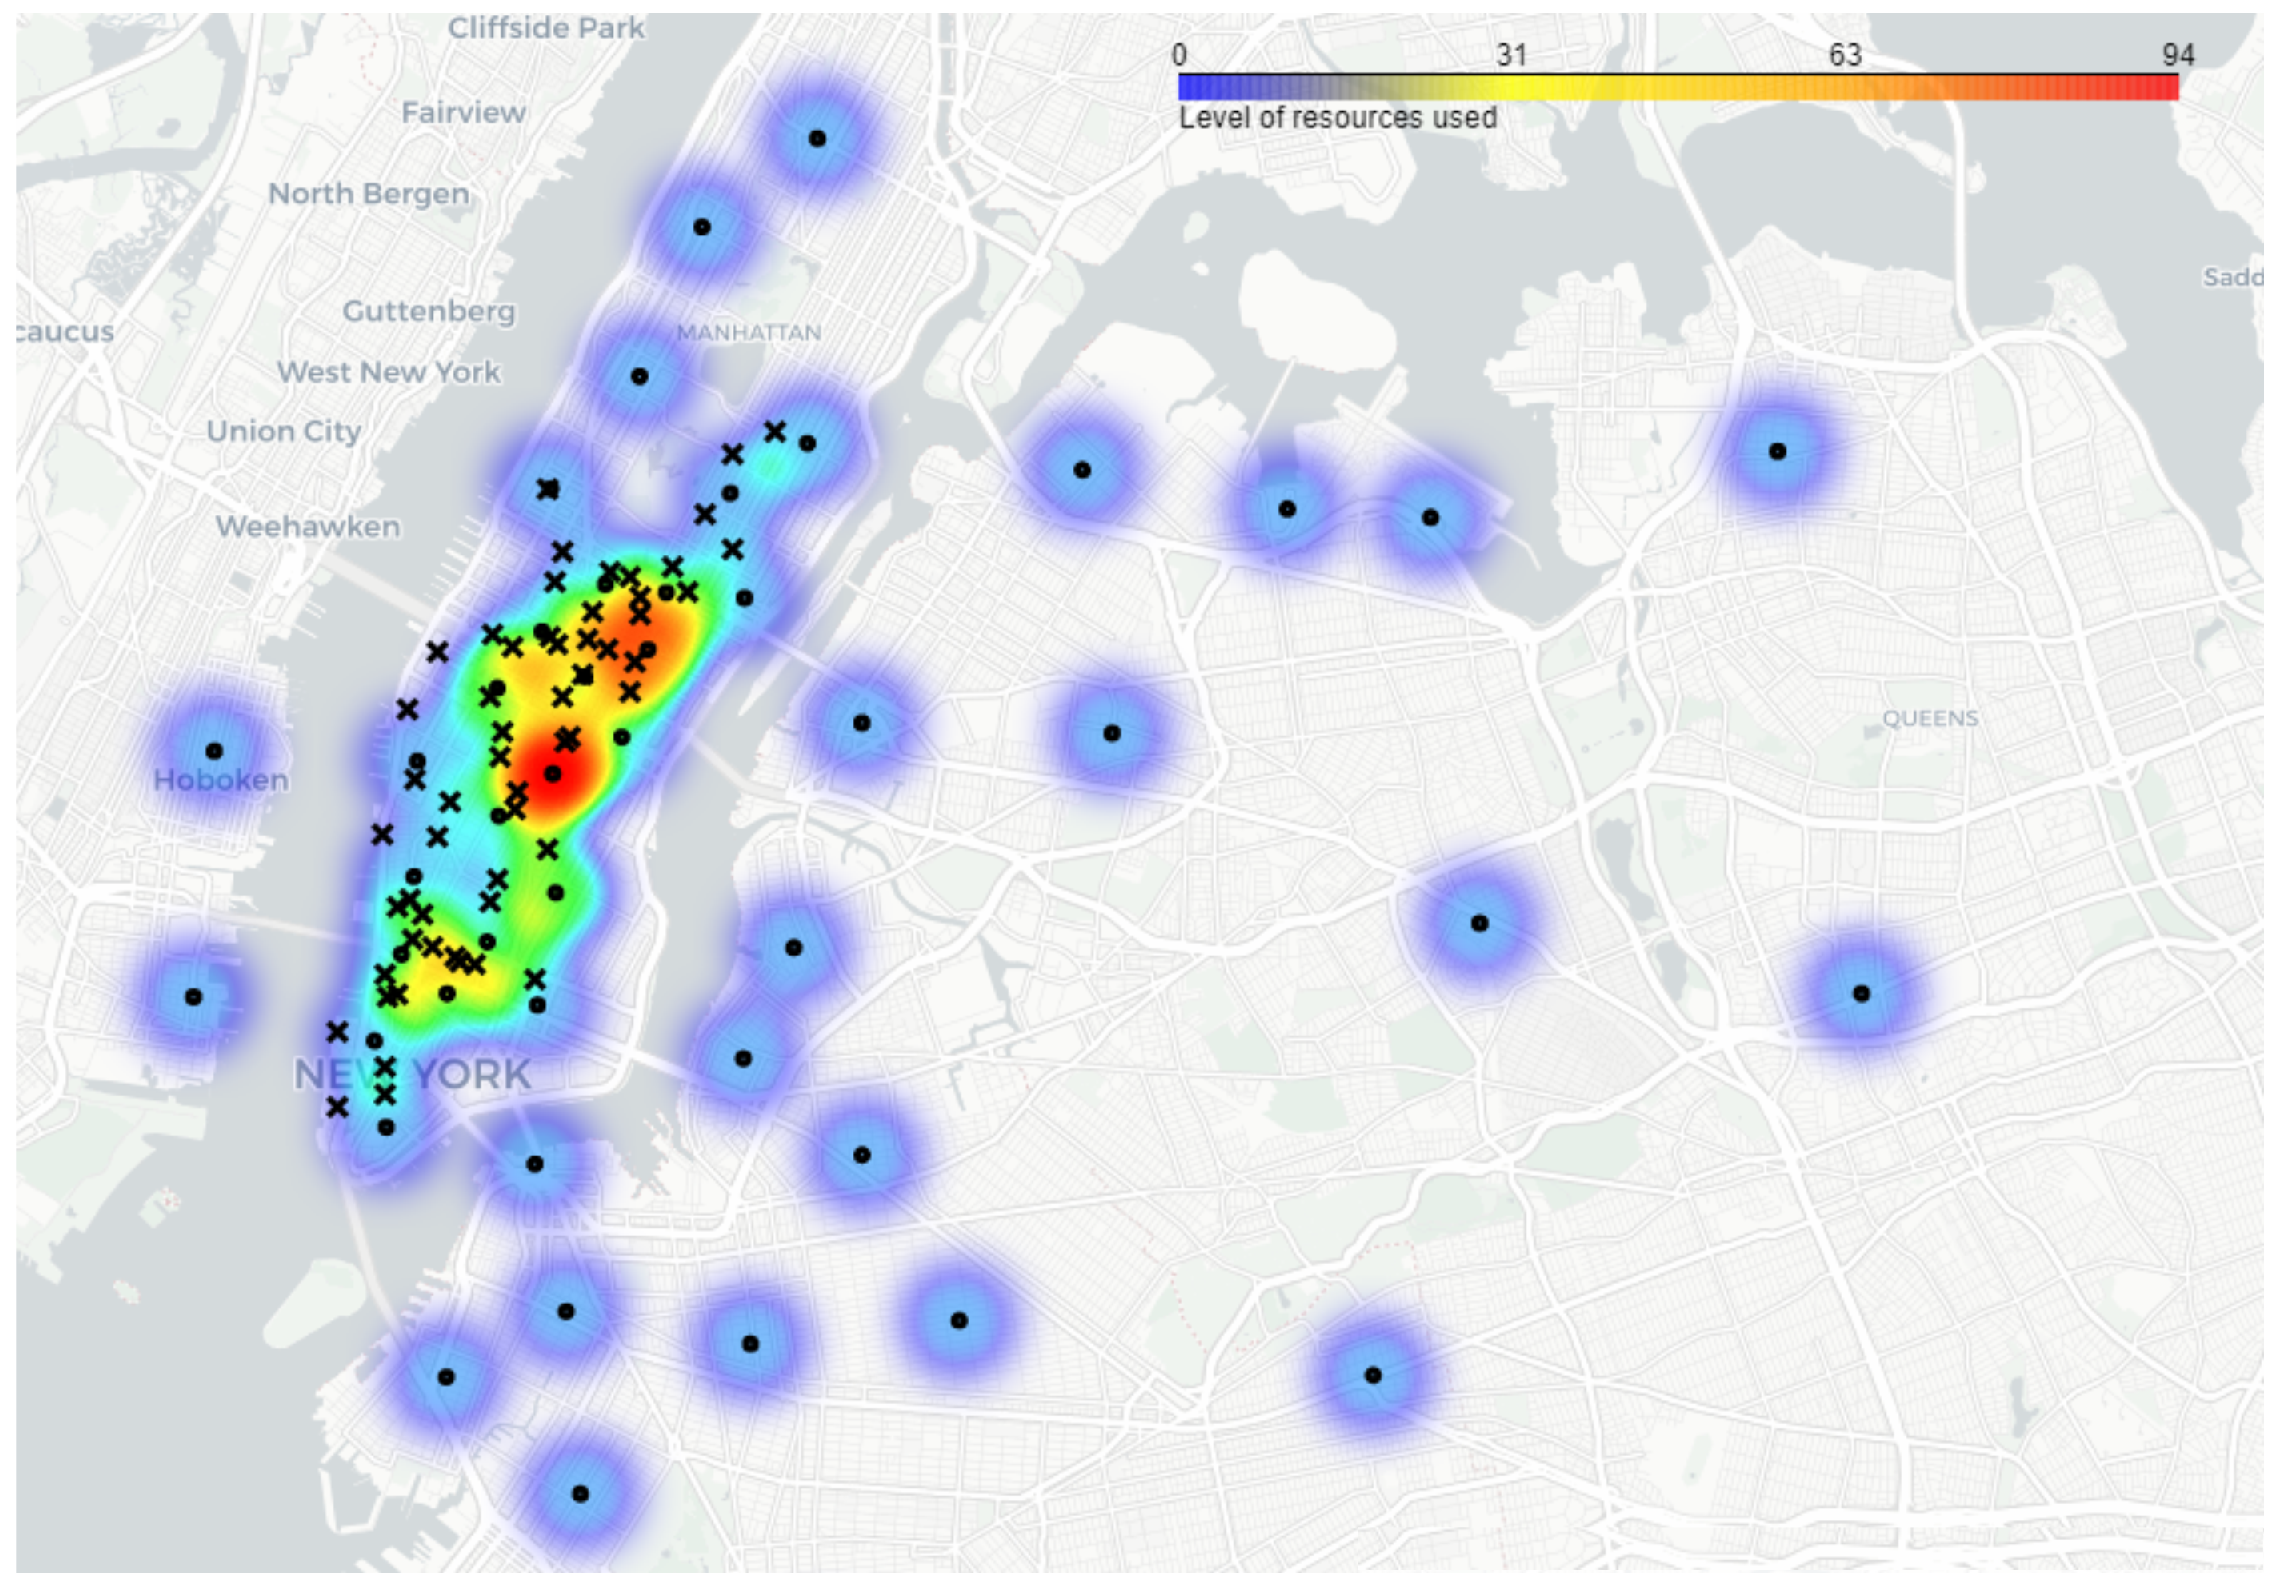
Figure 1 clearly shows the behavior of these regions in a large city, which can be represented by traffic jams, commercial areas, or any type of temporary event with seasonality in time and space. In addition, the system can be used to solve other problems, such as compensating for areas where telecommunication service is difficult due to adverse conditions or network unavailability. Telecommunications service based on UAV-BS is ideal for problems of this type because of its flexibility and speed of deployment, as well as lower operating costs.
3. System Model
The proposal presents an intelligent system targeting telecommunication systems that need temporary support. We consider an urban region,
, based on a real area with multiple macrocells deployed at maximum capacity due to the large size of the region under study. We use a database with the user’s geolocation to simulate the behavior of the mobile network with its temporal and spatial characteristics. We consider the help of UAV-BSs simulating a picocell to support regions affected by high user density leading to network congestion. The architecture defined for UAV-BS is designed to concentrate service in small regions and reduce instantaneous user access to macrocells. The relationship between users, macrocells, and UAV-BSs is defined by the quality of the link based on the signal-to-interference-and-noise ratio (SINR). This link is established in descending rank order between users with the best and worst link quality. Those who could not connect are considered to be disconnected from the network.
Table 1 shows the most important symbols for understanding the formulations.
UAV-BSs do not have a direct connection to the network operator’s network but are directly connected to the macrocell via a dedicated backhaul connection. In summary, UAV-BSs are connected to the operator via the connection to the macrocell base, so traffic is offloaded to the macrocell and then sent to the network [
36]. The link between the UAV BSs and the macrocell has a high capacity because a portion of the spectrum is reserved for this link, as described in [
36,
37]. The network consists of a set of macrocells M = {
} defined based on the number of users by the K-means algorithm. K-means was used to define the location of each
M in the region and was also used in the UCPA step where its use is described in detail. Two main parameters are required to use K-means: the user’s geolocation database and the number of
M groups defined by the author. K-means then returns the subsets of users and their respective centroids used to position the macrocell.
The distance between the
M in the center of the region is spread to about 1 km by the K-means algorithm, which helps to minimize the interference between the
M. The communication between the
M and the user was defined by ranking based on the SINR mentioned earlier; the better the relationship between the
M and the user, the higher the probability of connection. To calculate the SINR, you first need to know the distance between the
M and the
U, which is given in Equation (
1) as M
and U
:
Here, represents the location of the macrocell in latitude, and longitude and represents the location of the user.
Then, we used the propagation model to calculate the path loss (PL). This information is transmitted by electromagnetic waves, which have propagation loss due to interaction with the environment. To simulate the propagation loss, models that can predict this loss are needed.
Several models in the literature can make this prediction. The model used in this work is the Cost Walfisch–Ikegami [
38,
39], which was developed for urban use and takes into account obstructions due to building height and street width, as well as other relevant conditions in the urban area. The Cost Walfisch–Ikegami model has three basic components. The total attenuation (
PL) is specified for (
NLoS) conditions and calculated in Equation (
2).
Here,
represents free space loss,
represents diffraction and scattering loss between the roof and the street, and
represents diffraction loss between multiple screens. The free space loss is given in Equation (
3).
where
d is the radio link length (in km) and
f is the radio frequency (in MHz). The loss due to diffraction and scattering from the roof to the road is calculated in Equation (
4).
Here,
W is the road width and
is calculated in Equation (
5).
where is the difference between the height of the rooftop
and the height of the user’s device
, similar to
calculated in Equation (
6).
Here,
is the angle of incidence concerning the direction of the road. It is then shown that the loss is caused by the multiscreen diffraction calculated in Equation (
7).
Here,
B is the distance between buildings along the signal path and
, and
represents the increase in path loss due to a lower height of the macrocell antenna. Using the abbreviation in Equation (
8),
where the height of the base antenna above the rooftops
is represented, we find that
and
are passed through in Equations (
9) and (
10).
The expressions
and
control the dependence of the diffraction loss of the multiple screens on distance and operating frequency, respectively. The distance factor
is given in Equation (
11).
The factor
is given in Equation (
12):
For line of sight condition, the total attenuation
is given in Equation (
13).
For the UAV-BS to provide a high-quality communication service to users, the UAV-BS goes through an SINR-based ranking and selects the best links to ensure QoS as well as macrocells. The network of UAV-BSs is defined by the number of congested macrocells and the number of users in the coverage radius of the macrocells. First, it is necessary to calculate the distance between UAV-BS and the user competing for the service defined in Equation (
14).
where
is the distance between UAV-BS and the user,
is the radius of the UAV-BS coverage area, and
is the height from UAV-BS to the ground. The formed angle between the UAV-BS and the user can be calculated using Equation (
15).
Unlike the Cost Walfisch–Ikegami model, the dispersion model for UAVs considers the average relationship between the two equations (
LoS) and (
NLoS). The propagation model used to predict the path loss of UAV-BS is the air-to-ground channel model [
40,
41], which can be calculated for
using Equation (
16) and for
using Equation (
17).
where
is the carrier frequency,
c is the speed of light, and
and
are average additional losses for the propagation loss in free space, which depends on the environment.
The probability of obtaining a
link at an angular increase
is calculated in Equation (
18):
where
and
are considered constant values that depend on the environment, such as urban, rural, etc. Similarly, the probability of
can be found in Equation (
19):
Therefore, the average propagation loss results from the altitude and the coverage radius of the UAV-BS, calculated in Equation (
20):
Signal power is a ratio between the power of the macrocell or UAV-BS and the user device calculated using the propagation model. We can assume that
is the set of users denoted by
U = {
} and that
is the set of UAV-BS denoted by
V = {
}. Knowing that
U is the set of users,
M is the set of macrocells, where
m is the total number of macrocells and
v is the total number of UAV-BSs, we can calculate the received reference signal power
(in dB) for user
from macrocell
or from UAV-BS
, denoted by
[
42,
43]. The received signal power is calculated in Equations (
21) and (
22).
If
j is a UAV-BS:
where
is the power transmitted by the macrocell,
is the path loss between the macrocell and the user device, just as
is the power transmitted by UAV-BS, and
is the propagation loss between UAV-BS and the user.
Finally, we can calculate the signal-to-interference-plus ratio (SINR) presented in [
36,
42,
43,
44] and given in Equation (
23).
Here,
is the result of the ratio between the user equipment and the macrocell and
is the power noise. To calculate the
,
and
are expressed in linear form [
42,
43].
The throughput is used as a constraint to allocate users in the macrocell, where
is the main variable. The calculation is based on the channel capacity formulation presented in [
36,
42,
43] and can be found in Equation (
24).
Similarly, in [
43,
45], the required throughput of a backhaul is calculated based on the cumulative radio throughput of the users served by the macrocell
. The required throughput is calculated in Equation (
25).
where
is the total number of users served by the macrocell
j or UAV-BS
j in the time interval, and
is the actual user throughput
i, where we can see similar strategies in [
36,
43].
User Allocation by SINR Ranking
In our research, the system model is based on [
43], where we use an SINR-based user classification method to perform the allocation of macrocells or radio resources named UAV-BS. Users are assigned the best available radio resources according to their SINR, taking into account the available backhaul capacity during the association process. If the
of a user
i is above a certain threshold and the macrocell or UAV-BS
j meets the following requirements, the user is assigned the radio resource in that time interval: (1) the radio resources have enough resource blocks (RBs) to meet the user’s throughput requirements; (2) the sum of the radio resources’ backhaul throughputs does not exceed their capacity in this action. If the user or radio resource does not meet some of these requirements, the next macrocell or UAV-BS is attempted based on the highest SINR. If a user still cannot be assigned a macrocell or UAV-BS after attempting all radio resources, the user is considered as outage (out of service coverage) for that time interval. A resource block is the smallest unit of resources that can be assigned to a user. The required resource blocks are calculated based on the required throughput of user i and the
, which is related to the macrocell or UAV-BS
j.
4. Solution Problem
In the proposed scenario, we consider a network of UAV-BSs that supports the conventional network suffering from congestion based on spatial and temporal characteristics, together with computational intelligence to determine approximately the location and time when the macrocell needs help to relieve the instantaneous traffic. In particular, the system considers two important steps, LPA and UCPA, to perform the management of UAV-BSs. In the LPA step, the load history generated by the mobile network is used as an input variable into the predictive model to determine which regions are congested and the specific times of each macrocell that need assistance. In this step, we use two models known in the literature for time series prediction. One is the random forest (RF), a model that uses a series of random decision trees to generalize the model operations, which minimizes the overfitting of each model to improve the prediction accuracy. The other model is the generalized regression neural network (GRNN), a variation of the traditional neural network with an excellent solution for dynamical systems and time series predictions [
46]. GRNN is often used on nonlinear datasets because it has better behavior compared to other models.
This section presents the intelligent system methodology for the next-generation communications network. The LPA subchapter shows how the data collection, processing, and preparation are performed, as well as the network utilization prediction models, which facilitate finding the congested regions and times. The UCPA subchapter shows how the number of UAV-BSs is calculated by using two strategies used in this work and calculating the ideal positioning for each device requested to support the congested macrocells.
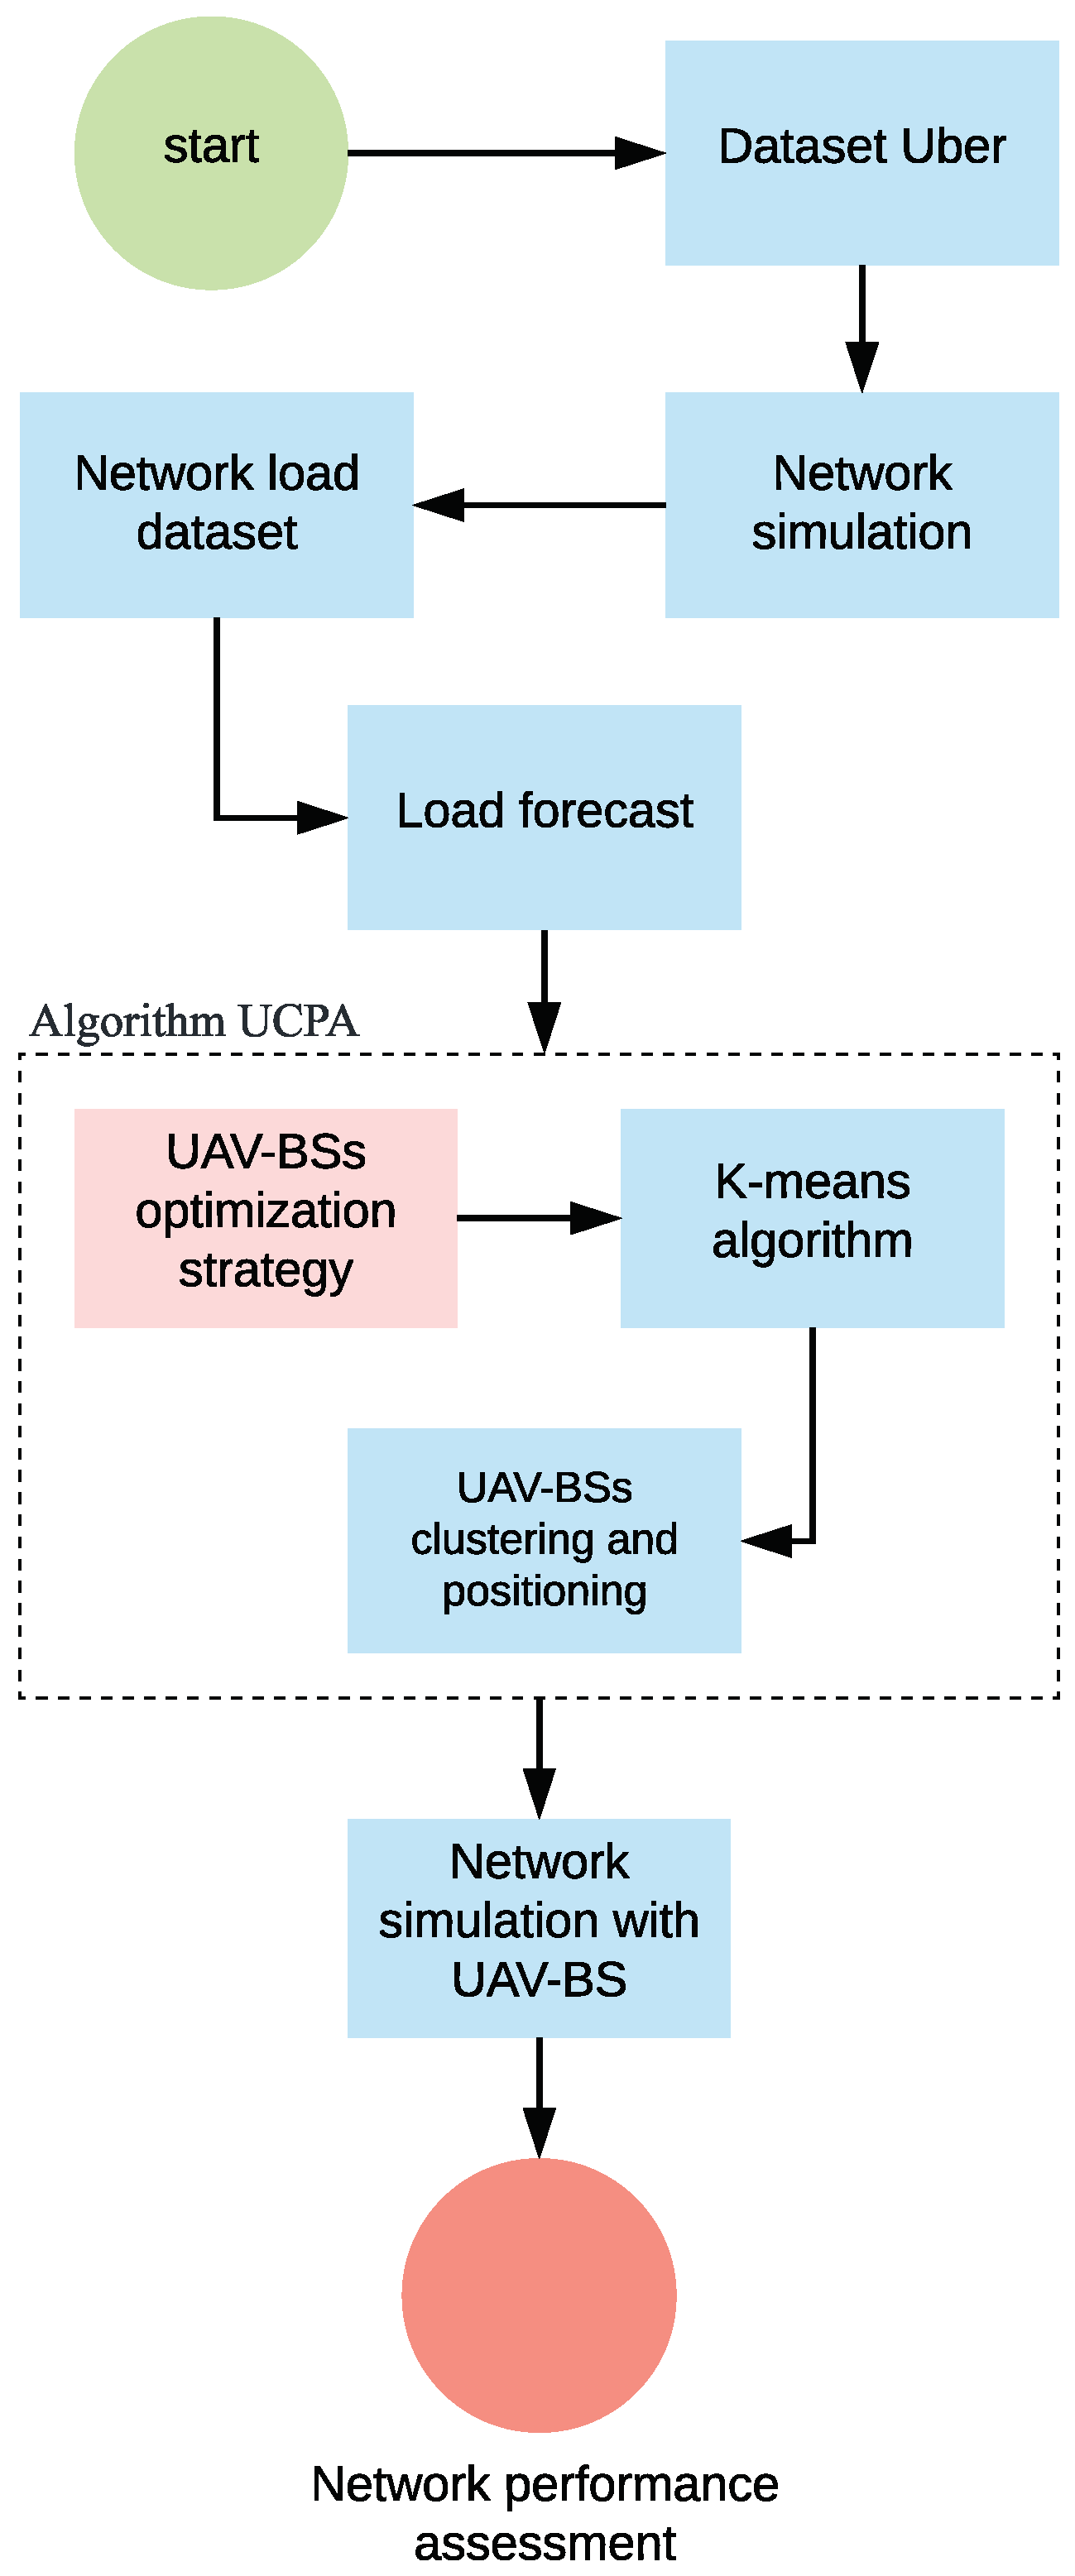
Figure 2 shows the flowchart of the intelligent system. We start by mining the data collected by the open platform. These data are used to determine the location of the user in the simulation environment, revealing the patterns and behavior of the real world. Then, the network simulation is performed to create the dataset with the network utilization history based on the user behavior collected and processed in the previous step (see flowchart). Next, the network history dataset is used as the basis for training two machine learning models to predict the time and location of potential network congestion. With this information, the resources (UAV-BSs) can be managed more efficiently, and then the system can perform the calculations to define the number of resources needed to support the compromised network. This starts with defining the strategy needed to determine the parameters of the K-means algorithm. Then, the number and positioning of UAV-BSs in the region suffering from congestion are calculated. Finally, the simulation is performed by adding the UAV-BSs to support the congested regions, and the results show the performance of the network.
4.1. Load Prediction Algorithm (LPA)
Mobile network congestion in regions with high population density is a problem that increases with population growth and urban modernization, such as digital cities or smart cities that bring the concept of interconnecting everything. This increase in traffic directly affects the mobile network by reducing the QoS of users in the region. If the increase in user density is programmed in the form of concerts, sports games, and demonstrations, the resulting congestion can be resolved by preemptively planning the infrastructure so that congestion does not occur. However, most of the congestion of mobile networks is generated by the high density of users in everyday life, which makes preventive planning difficult due to the randomness of the congested regions. This congestion is based on the temporal and spatial flow of the region, which is affected by the seasonality and the trend that is generated by the regionality in
Figure 1. This scenario can lead to planning problems, high deployment costs for utilities, uncontrolled deployment of macrocells that can be harmful to health, visual pollution, a decrease in QoS, and an increase in blocked users in the mobile network.
Machine learning models are great solutions to nonlinear problems. Provided there is a database to train and test the model, it is possible to perform predictions on nonlinear data. To overcome the problem of nonlinearity of the data used in this study, we used the random forest and GRNN models as a good solution for macrocell load forecasting, as shown in Algorithm 1.
| Algorithm 1 Load Prediction Algorithm |
Input: week, day, hour, macrocell id - 1:
- 2:
- 3:
- 4:
- 5:
procedure (training) - 6:
- 7:
- 8:
while do - 9:
- 10:
end while - 11:
end procedure - 12:
- 13:
▹ Equations ( 26)–( 28)
Output: trained model ▹ selection of the best model for the scenario |
4.1.1. Generalized Regression Neural Networks
The GRNN proposed in [
46] is based on a standard statistical method called Gaussian kernel regression. The main difference is that it is based on nonparametric regression, while the artificial neural network (ANN) is based on parametric regression. It also differs in the number of layers, which in the GRNN model is divided into four: input layer, default layer, summation layer, and output layer, where the last layer generates the predicted value corresponding to an unknown input vector. At the same time, the ANN model has three layers in a row: input layer, hidden layer, and output layer. The input layer of the GRNN model, which is known as the distribution unit and stores the information as vector X, is fully connected to the standard layer, which passes the information and uses the Gaussian activation function to calculate an output for the next sum layer.
The sum layer receives the data from the standard layer to perform the appropriate processing. In this layer, there are two summations to smooth the output of the model. The first sums all the outputs of the model layer and the second calculates the weighted sum of the outputs of the model layer, where there is a connection weight between the layers to adjust the calculation. Finally, the output layer calculates the output Y of the GRNN model by dividing the outputs of the summation layer. This model has been widely studied for predictions, as in [
47,
48,
49]. The architecture of the GRNN model is shown in simplified form in
Figure 3. The main advantages of the model are fast learning and convergence to an optimal regression value as the number of samples increases. Working with real-time data is particularly advantageous since the regression result is determined immediately after the process is started [
50].
4.1.2. Random Forest
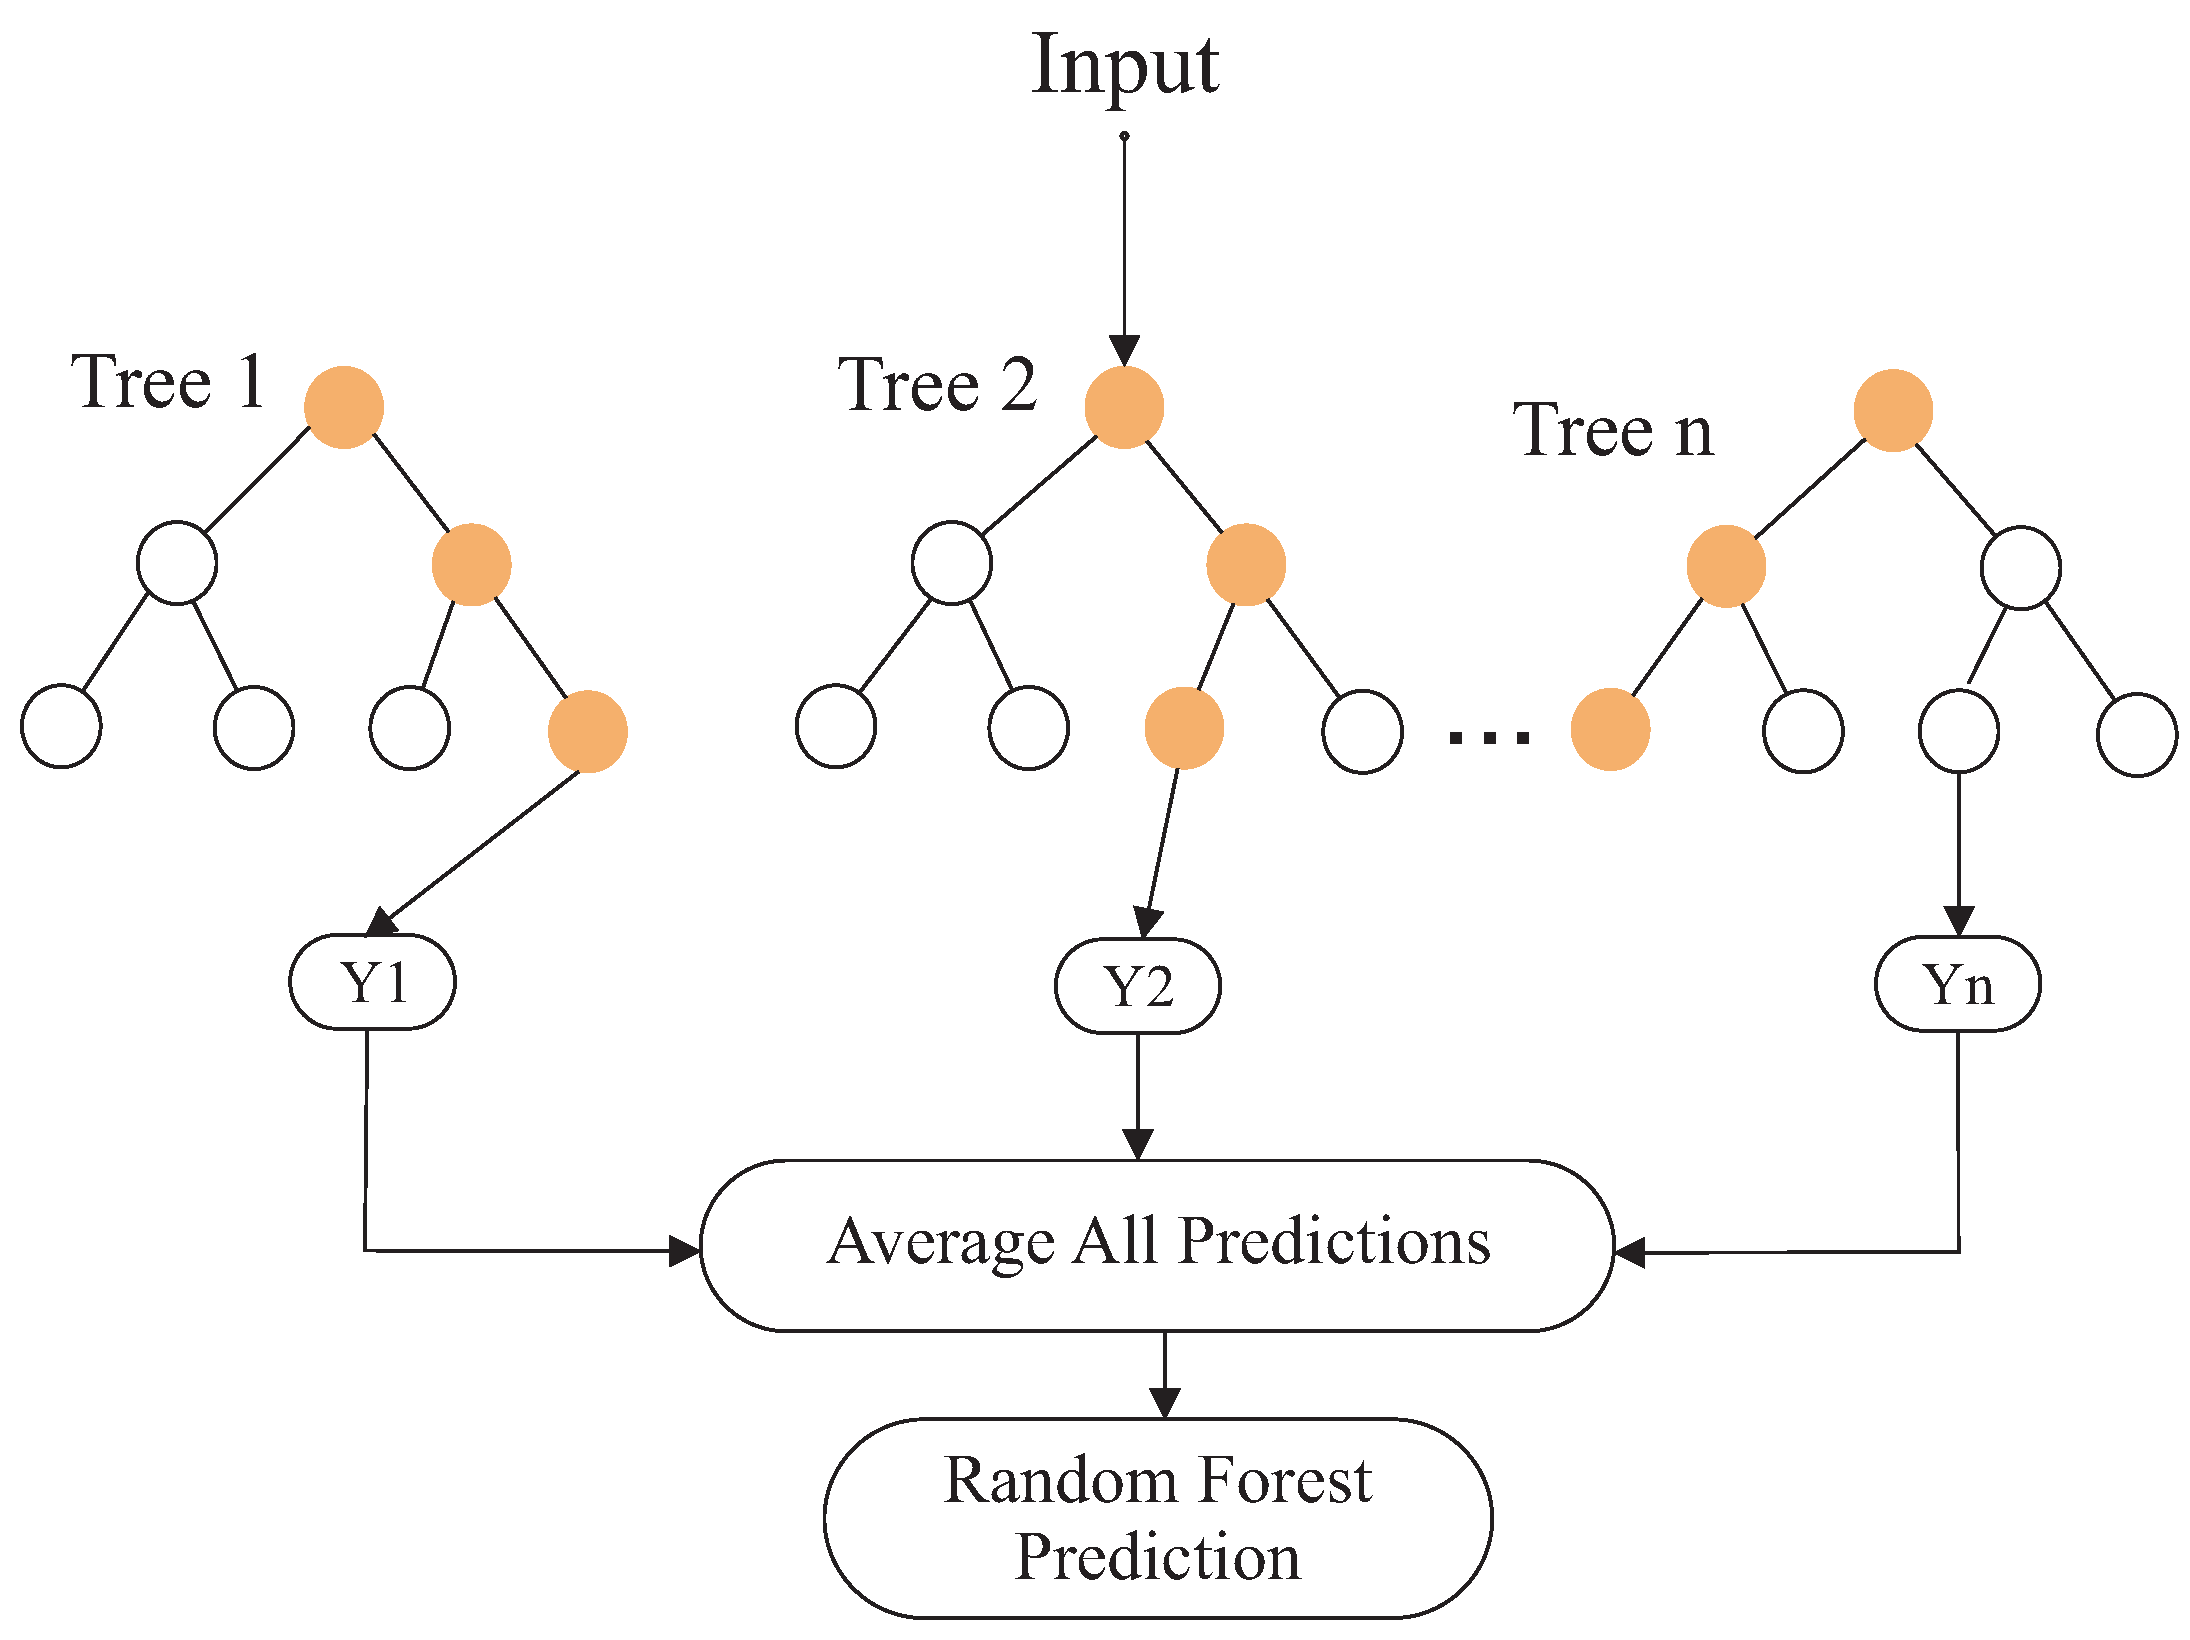
Random forest is a type of supervised machine learning used in prediction, modeling, and behavior analysis from a combination of decision trees [
51]. The model contains a large number of decision trees, where each tree represents an input instance of the random forest. Based on the output produced by each decision tree, prediction can be made by averaging to improve accuracy and overfitting in model control. Unlike other methods, decision trees are capable of linking nonlinear data in the dataset. In decision trees, each node represents an independent feature, branches describe decisions, and each leaf represents an output with different predictions. Each tree selects a particular prediction and the random forest then averages the different predictions provided by the decision trees, which improves prediction accuracy. The random forest has been studied extensively in the literature (see [
52,
53,
54,
55]). Its architecture is shown in
Figure 4.
The model provides efficient methods for processing missing data. Missing values are replaced by data that occur most frequently at a given node. The model can handle large amounts of data and different variables arriving simultaneously, which makes random forest efficient [
56]. In addition, there is an option to automatically compensate for the less frequent datasets in the model.
4.1.3. Dataset
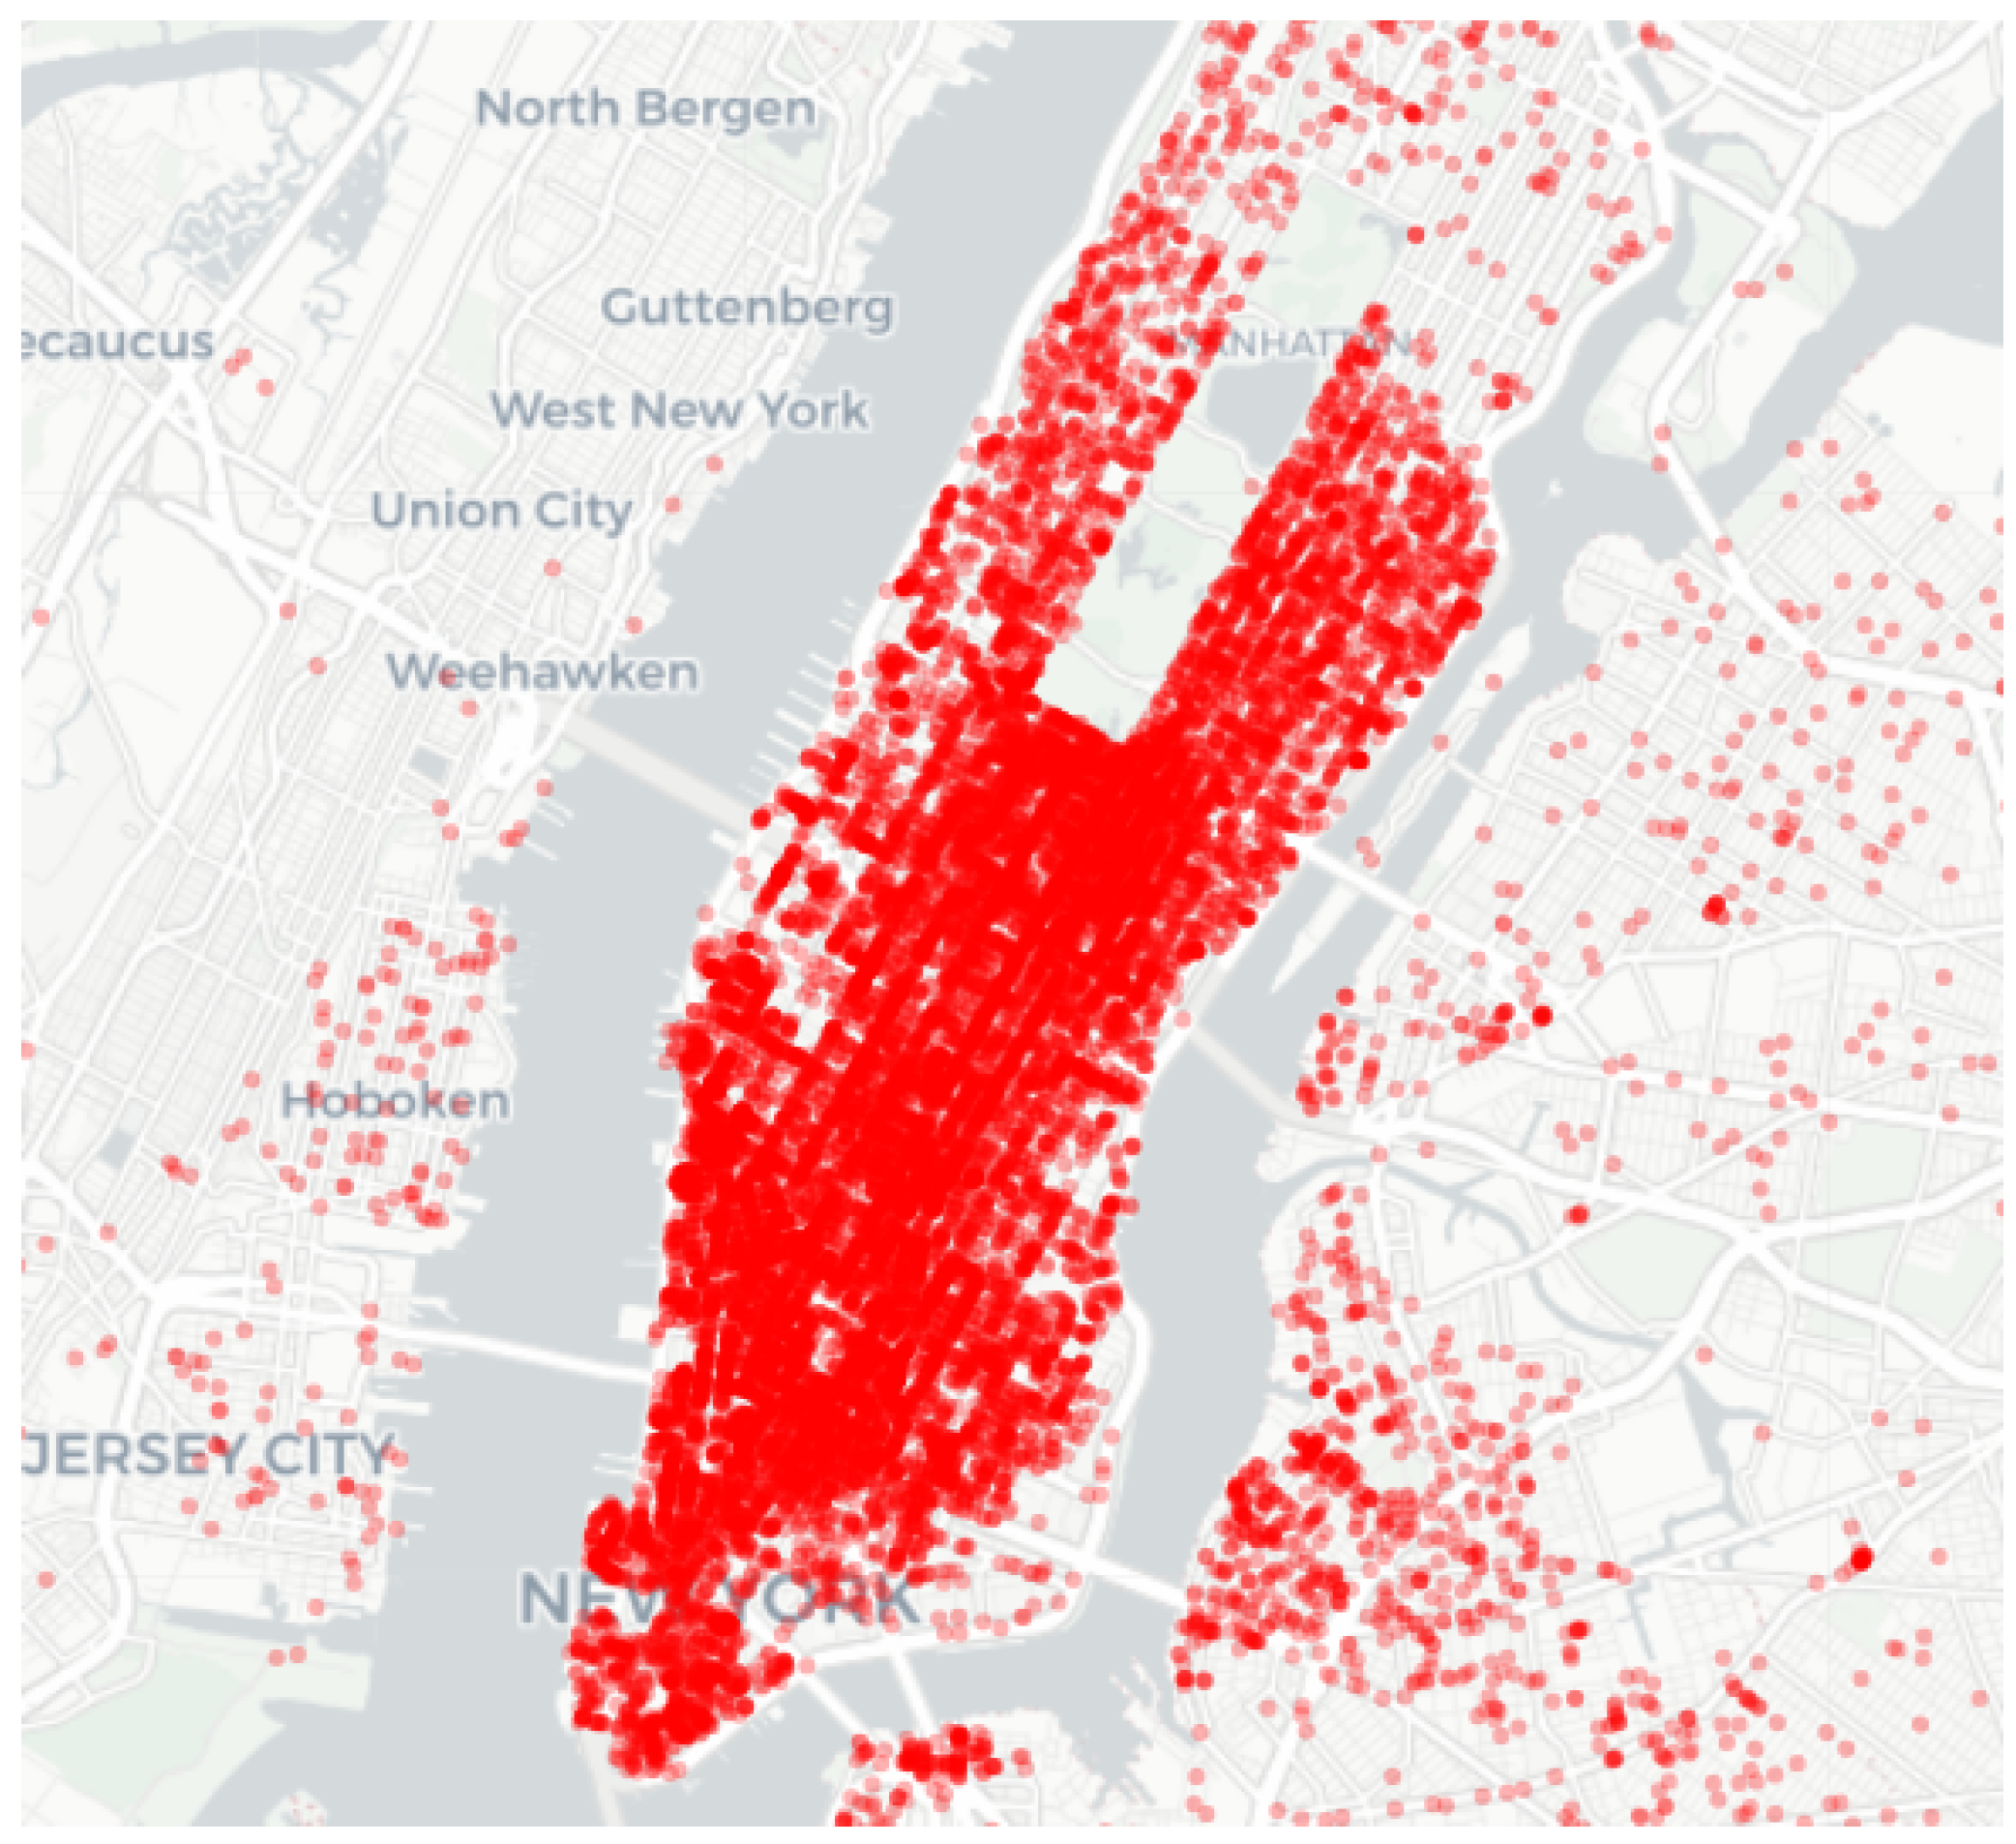
For this work, it was necessary to use two databases to simulate users in the mobile network and perform network utilization prediction. The first database contains the user’s geolocation and date (time and day), which were used to simulate the behavior of users in the high-density region, based on the real data shown in
Figure 5. We edited and cleaned the data and added the variable week to identify patterns in user behavior. The simulation followed the features of the database to generate a new dataset of network utilization for each hour of the day. With the new database, we can forecast and identify which macrocells suffer from congestion and define the times and regions that are most affected by this high user demand.
The data used by the models for prediction were generated by simulations. However, in a real network, there may be different types of problems, such as the main problem of congestion of macrocells caused by the density of daily users at different times. The creation of new macrocells is not feasible because this overload is temporary.
The new database generated by the simulation, which is used as input to the predictive model, contains the following attributes: time, day, week, macrocell ID, and the generated load. The forecasting models used in this paper follow the supervised approach. According to the architecture, the data are divided into input (time, day, week, macrocell ID) and output (load). Then, the data are randomly divided into 70% for training and 30% for testing and validation, using the same methodology for the two models presented previously. Then, the data are normalized to improve the performance of the predictive models. After training, testing and validation were performed with specific metrics to evaluate the performance and accuracy of the models.
4.1.4. Evaluation Metrics
Metrics are used to evaluate and determine which model is most appropriate for a dataset, helping to select the most appropriate model. In this work, we used the MAE, RMSE, and scores below.
In this subsection, the LPA algorithm was used to predict the regions affected by overload effects. We presented the methodology used to train, validate, and test the models, the database used in the simulation and the database used for prediction, and the metrics used to validate the models. In the next subsection, we will present the UCPA algorithm and its modeling.
4.2. UAV-BSs Clustering and Positioning Algorithm (UCPA)
In UCPA, we calculated the number of UAV-BSs each congested macrocell requires to minimize the associated user flow, in addition to determining the optimal positioning of each UAV-BS in the coverage area of the congested macrocell. The algorithm obtained the database containing the load of the overloaded macrocells defined by the set . Then, the number of UAV-BS needed to serve each macrocell in a congested situation was estimated based on two strategies (naïve and optimized), to study the relationship between cost and quality of service. Once the number needed to support the network was known, the optimal positioning of each UAV-BS was determined.
To calculate the number of users in the coverage area and centralize the support of the UAV-BSs, the coverage area had to be reduced and the distance between the users and the macrocells calculated, as indicated in Equation (
29).
Here, is the dataset of users in the new coverage area used by the optimized strategy to determine the number of UAV-BSs and find the optimal location of UAV-BSs in possible candidates for support in the region, and R is the value of the radius set to calculate the number of users.
The optimal location is found using the K-means clustering algorithm, which calculates the centroid of each subgroup. The main variable is , which is used by the algorithm to determine the number of subgroups. Each subgroup is the deployment area of a UAV-BS. The second input variable of the algorithm is the database , with the locations of the users, which is used to calculate the similarities between the data. In this way, the subgroups are separated and their center is selected, which is the ideal point for a UAV-BS.
4.2.1. Naïve
The naïve strategy aims to show the cost–benefit relationship between the number of devices required by the strategy and the quality of service compared to the optimized strategy. In the naïve strategy, the number of UAV-BS calculated for each macrocell has a fixed value that does not depend on the number of users, denoted by the variable
, which is used as input to the K-means algorithm to define the number of subgroups. In this strategy, the main objective is to provide services regardless of resource optimization, i.e., efficient scheduling of UAV-BSs. In Equation (
30), the sum of all UAV-BSs is calculated by this strategy.
4.2.2. Optimized
The main goal of the optimized strategy is to efficiently schedule the resources used to support the network, balancing the number of UAV-BS with the quality of service. The strategy is based on the number of users counted in the new coverage area calculated in Equation (
29), generating a new dataset. The strategy follows a different methodology than the naïve strategy, in that the number of centroids is defined by the number of users in the set
. Equation (
31) shows the calculation used to determine the number of UAV-BSs in the optimized strategy.
To determine the total number of UAV-BS, the sum of the values of the overloaded macrocell was calculated. Equation (
32) simplifies the total number of UAV-BS for the optimized strategy.
Once we have all the necessary information to determine which macrocells are overloaded, we can plan the necessary number of UAV-BS to support the overloaded macrocells and, consequently, temporarily reduce the service congestion. Algorithm 2 shows the step-by-step operation of UCPA, starting with the calculation of the user set that determines the number of UAV-BS, based on the naïve and optimized strategies, to the optimal location for the UAV-BS.
This subsection has shown how the UCPA algorithm was presented to calculate the number of UAV-BS needed for each macrocell based on the chosen strategy. We also present the methodology for determining the optimal positioning of UAV-BS based on the number of users in the coverage area of the macrocell. Overall, we present a methodology for solving congestion problems in mobile networks in regions where there is a strong temporal and spatial influence that enables the generation of nonlinear data and complicates the planning of temporary support resources. In the next section, we present the case study to validate the solution to the problem.
| Algorithm 2 UAV-BSs Clustering and Positioning Algorithm |
Input: ▹ overloaded macrocell set - 1:
for i <= do - 2:
procedure (calculating the number of UAV-BSs) - 3:
- 4:
if then - 5:
▹ number fixed of UAV-BSs - 6:
else - 7:
▹ based on user set Loc(i,j) - 8:
end if - 9:
end procedure - 10:
end for - 11:
- 12:
- 13:
Return ▹ number of UAV-BSs calculated per macrocell - 14:
procedure (calculating the optimal placement of UAV-BSs) - 15:
- 16:
- 17:
- 18:
- 19:
end procedure - 20:
Return (set of cluster centroids)
Output: ▹ ideal position set |
5. Simulation and Experiments
In this section, we present the simulations and experiments we used to study the behavior of the mobile network in Manhattan, the prediction to locate the regions affected by congestion, resources used in each macrocell, and the UAV-BS, which will support the affected network.
For all experiments, a simulation scenario was developed in Python to show the effectiveness of the proposed solution. For the simulation, a working terrestrial network with congestion problems was considered, and the need to temporarily balance the quality-of-service parameters in the region by the mobile base stations was determined. In this paper, we have divided the work into two simulations. The first one aims to generate the mobile network utilization; the network utilization database is used as input to the predictive models to find the congested
M. The second simulation is performed using the UAV-BSs to support the congested
. For the simulation, we use the physical layer parameters and simulation parameters recommended by 3GPP [
57]. The simulation attempts to replicate the behavior of a large urban area, where there are effects that can directly impact the performance of mobile services on a day-to-day basis, and where it can be expensive to deploy new fixed structures. An example of events that can affect performance is the tidal effect, which represents the behavior of user traffic throughout the day. This effect refers to the daily dynamic movement of users leaving the semi-urban area for the urban regions and returning at the end of the day, similar to the movement of sea levels up and down. Identifying and defining traffic load patterns in
M are important measures for network design and load balancing, as they provide an important solution for service operators facing network congestion problems or link capacity overcommitment [
58].
For this study, we used the Uber platform’s database of passenger boarding and alighting in the city of Manhattan in April 2014 from the repository [
59]. The database contains date/time, geolocation, and codes related to the service offered by the platform. For the simulation, only date/time and geolocation were used to leverage the behavior of users in the Manhattan area. We analyzed daily behavior to identify seasonal variations or user trends between days of the week. We separated date and time and added day-of-week data to help the model understand behavior. In addition to the database treatment, it was necessary to define the location of each
M in the study region. For this, we used the user base itself as a reference to determine the ideal point on the site. We used 60
M in the simulation, where
M = 60 in the K-means algorithm, resulting in 60 positions related to the set of
M in the Manhattan region.
In the first phase, we considered a set of
M deployed in the Manhattan region, which is one of the most populous regions of New York City, with an area of approximately 58.7 km
and a population of 1,694,251, with a population density of 28,873 hab/km
. In this first phase, we simulated 30 days referring to April 2014, based on the user base. We used 60
M, but the number of users depended on the day and time, depending on which database was used. We consider those who have downlink requests that need to be served as active users. These users have different characteristics, such as their location and their downlink transmission requirements. Throughput can be calculated in terms of perceived SINR, as shown in Equation (
23); minimum throughput requirements are modeled as SINR requirements. The user’s assignment to
M is determined by ranking the
M based on the SINR, and the possible assignment is determined. Otherwise, it will move to the next
M with the best SINR. A constant bit rate (CBR) traffic is applied to users with a minimum range of 0.5 to 2 Mbps for downlink transmission. COST 231 Walsch–Ikegami [
38,
39] is used for signal propagation from
M to user devices. We assume that the intercell interference is shared between the
M. The radio resources are limited, as well as the backhaul resources. The bandwidth used was 20 MHz, which corresponds to 100 resource blocks (RBs) corresponding to the parameters used in LTE. In the simulation, the RB is the smallest resource unit that can be allocated to a user. Depending on interference and other variables that may interfere with the allocation between the user and
M, more RBs may be allocated to that user. The backhaul capacity of an
M is similar to the study [
36], where resource block usage is the mediator between
M with either normal or congested states. For example, we assume that an overloaded
M uses its resource blocks more than 80% of the time. In this step, we generate the new database of utilization that will be used as input to the predictive models.
The second step of this work was to predict the M with the possibility of overload, its location, and time so that the second simulation could be performed. In LPA, we have two models already consolidated in the literature, the random forest and GRNN, to predict the load set. In the first phase, 43,200 data were generated with time, day, week, and load information for each M for April 2014. The data were split into 70% for training and 30% for testing and validation, and divided into input (week, day, time, and macrocell ID) and output (load) of the models. Both models had over 80% accuracy on a 30-day basis.
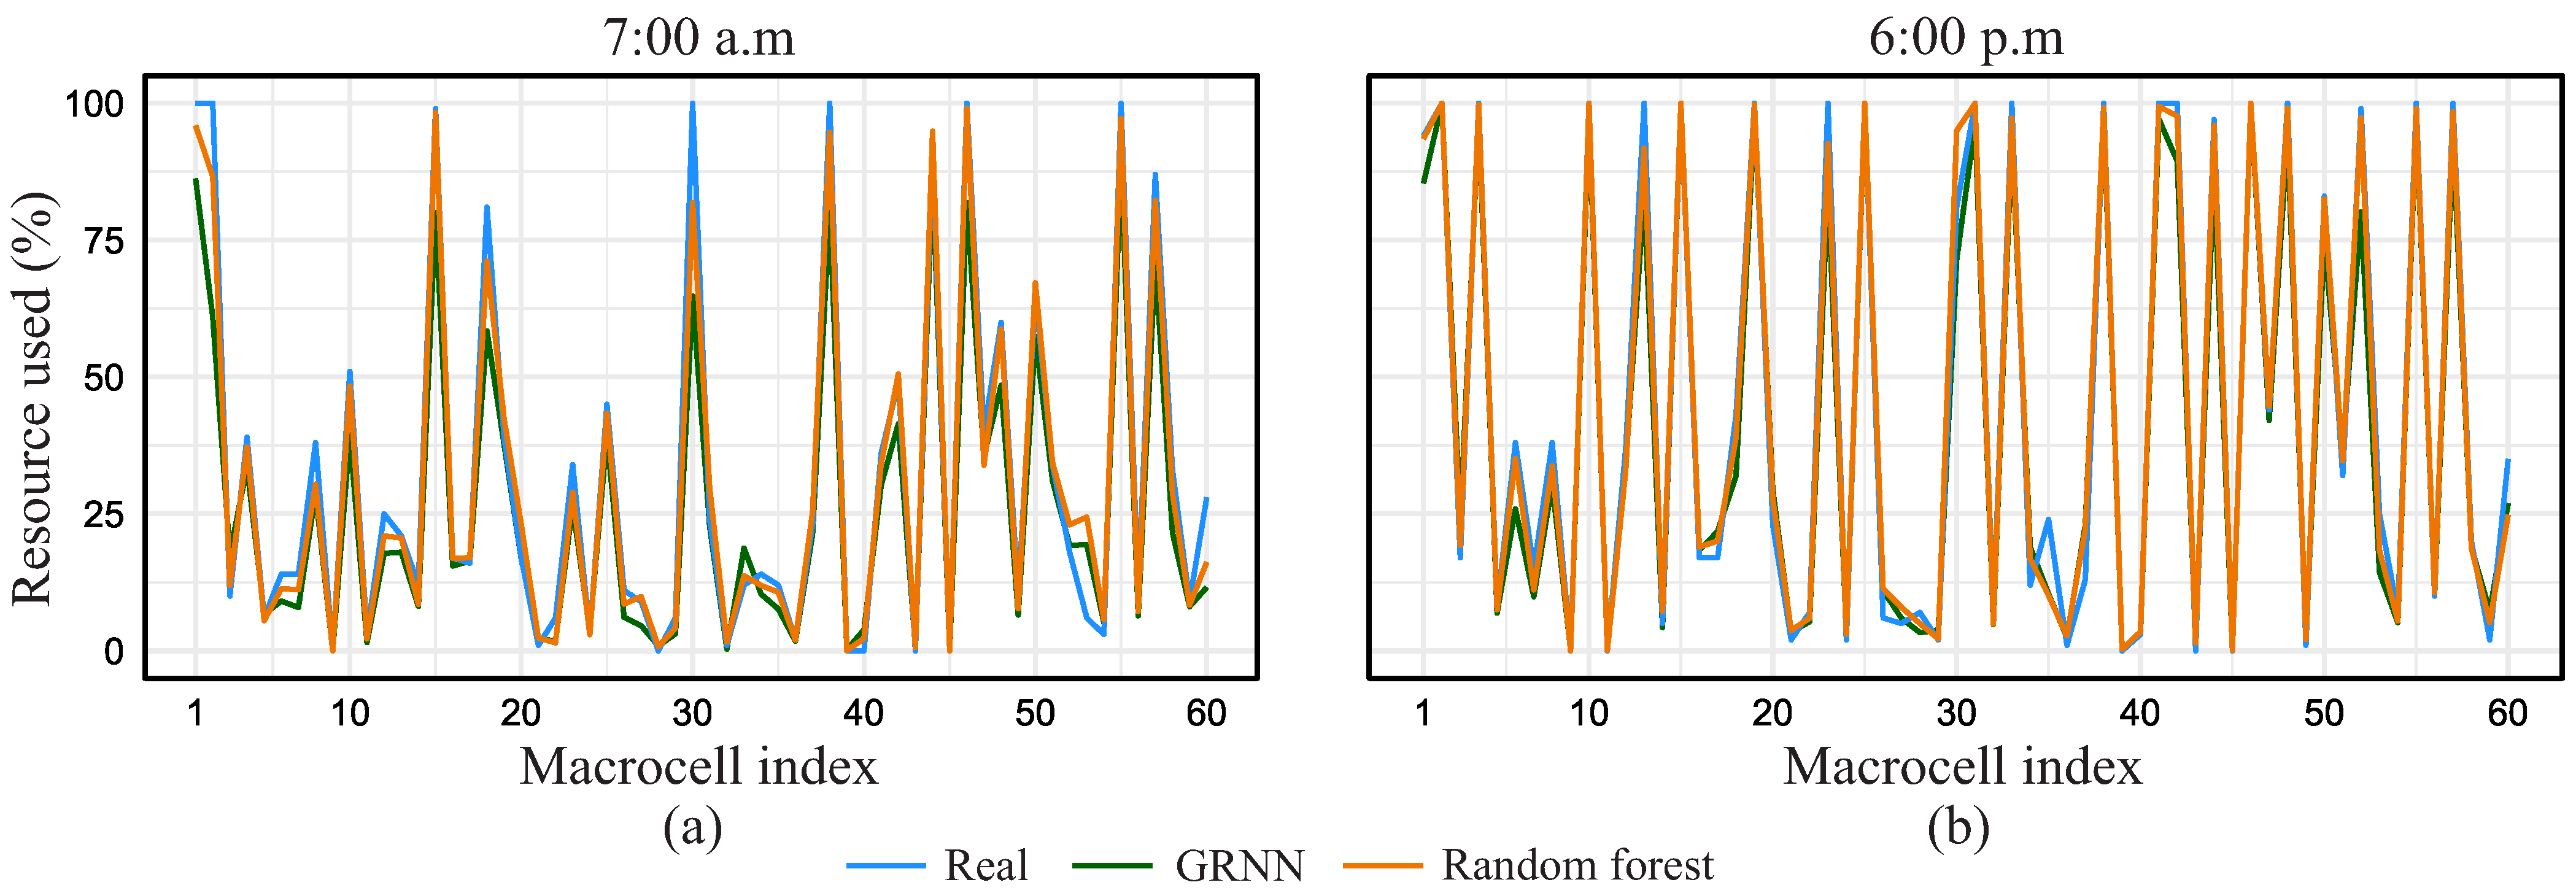
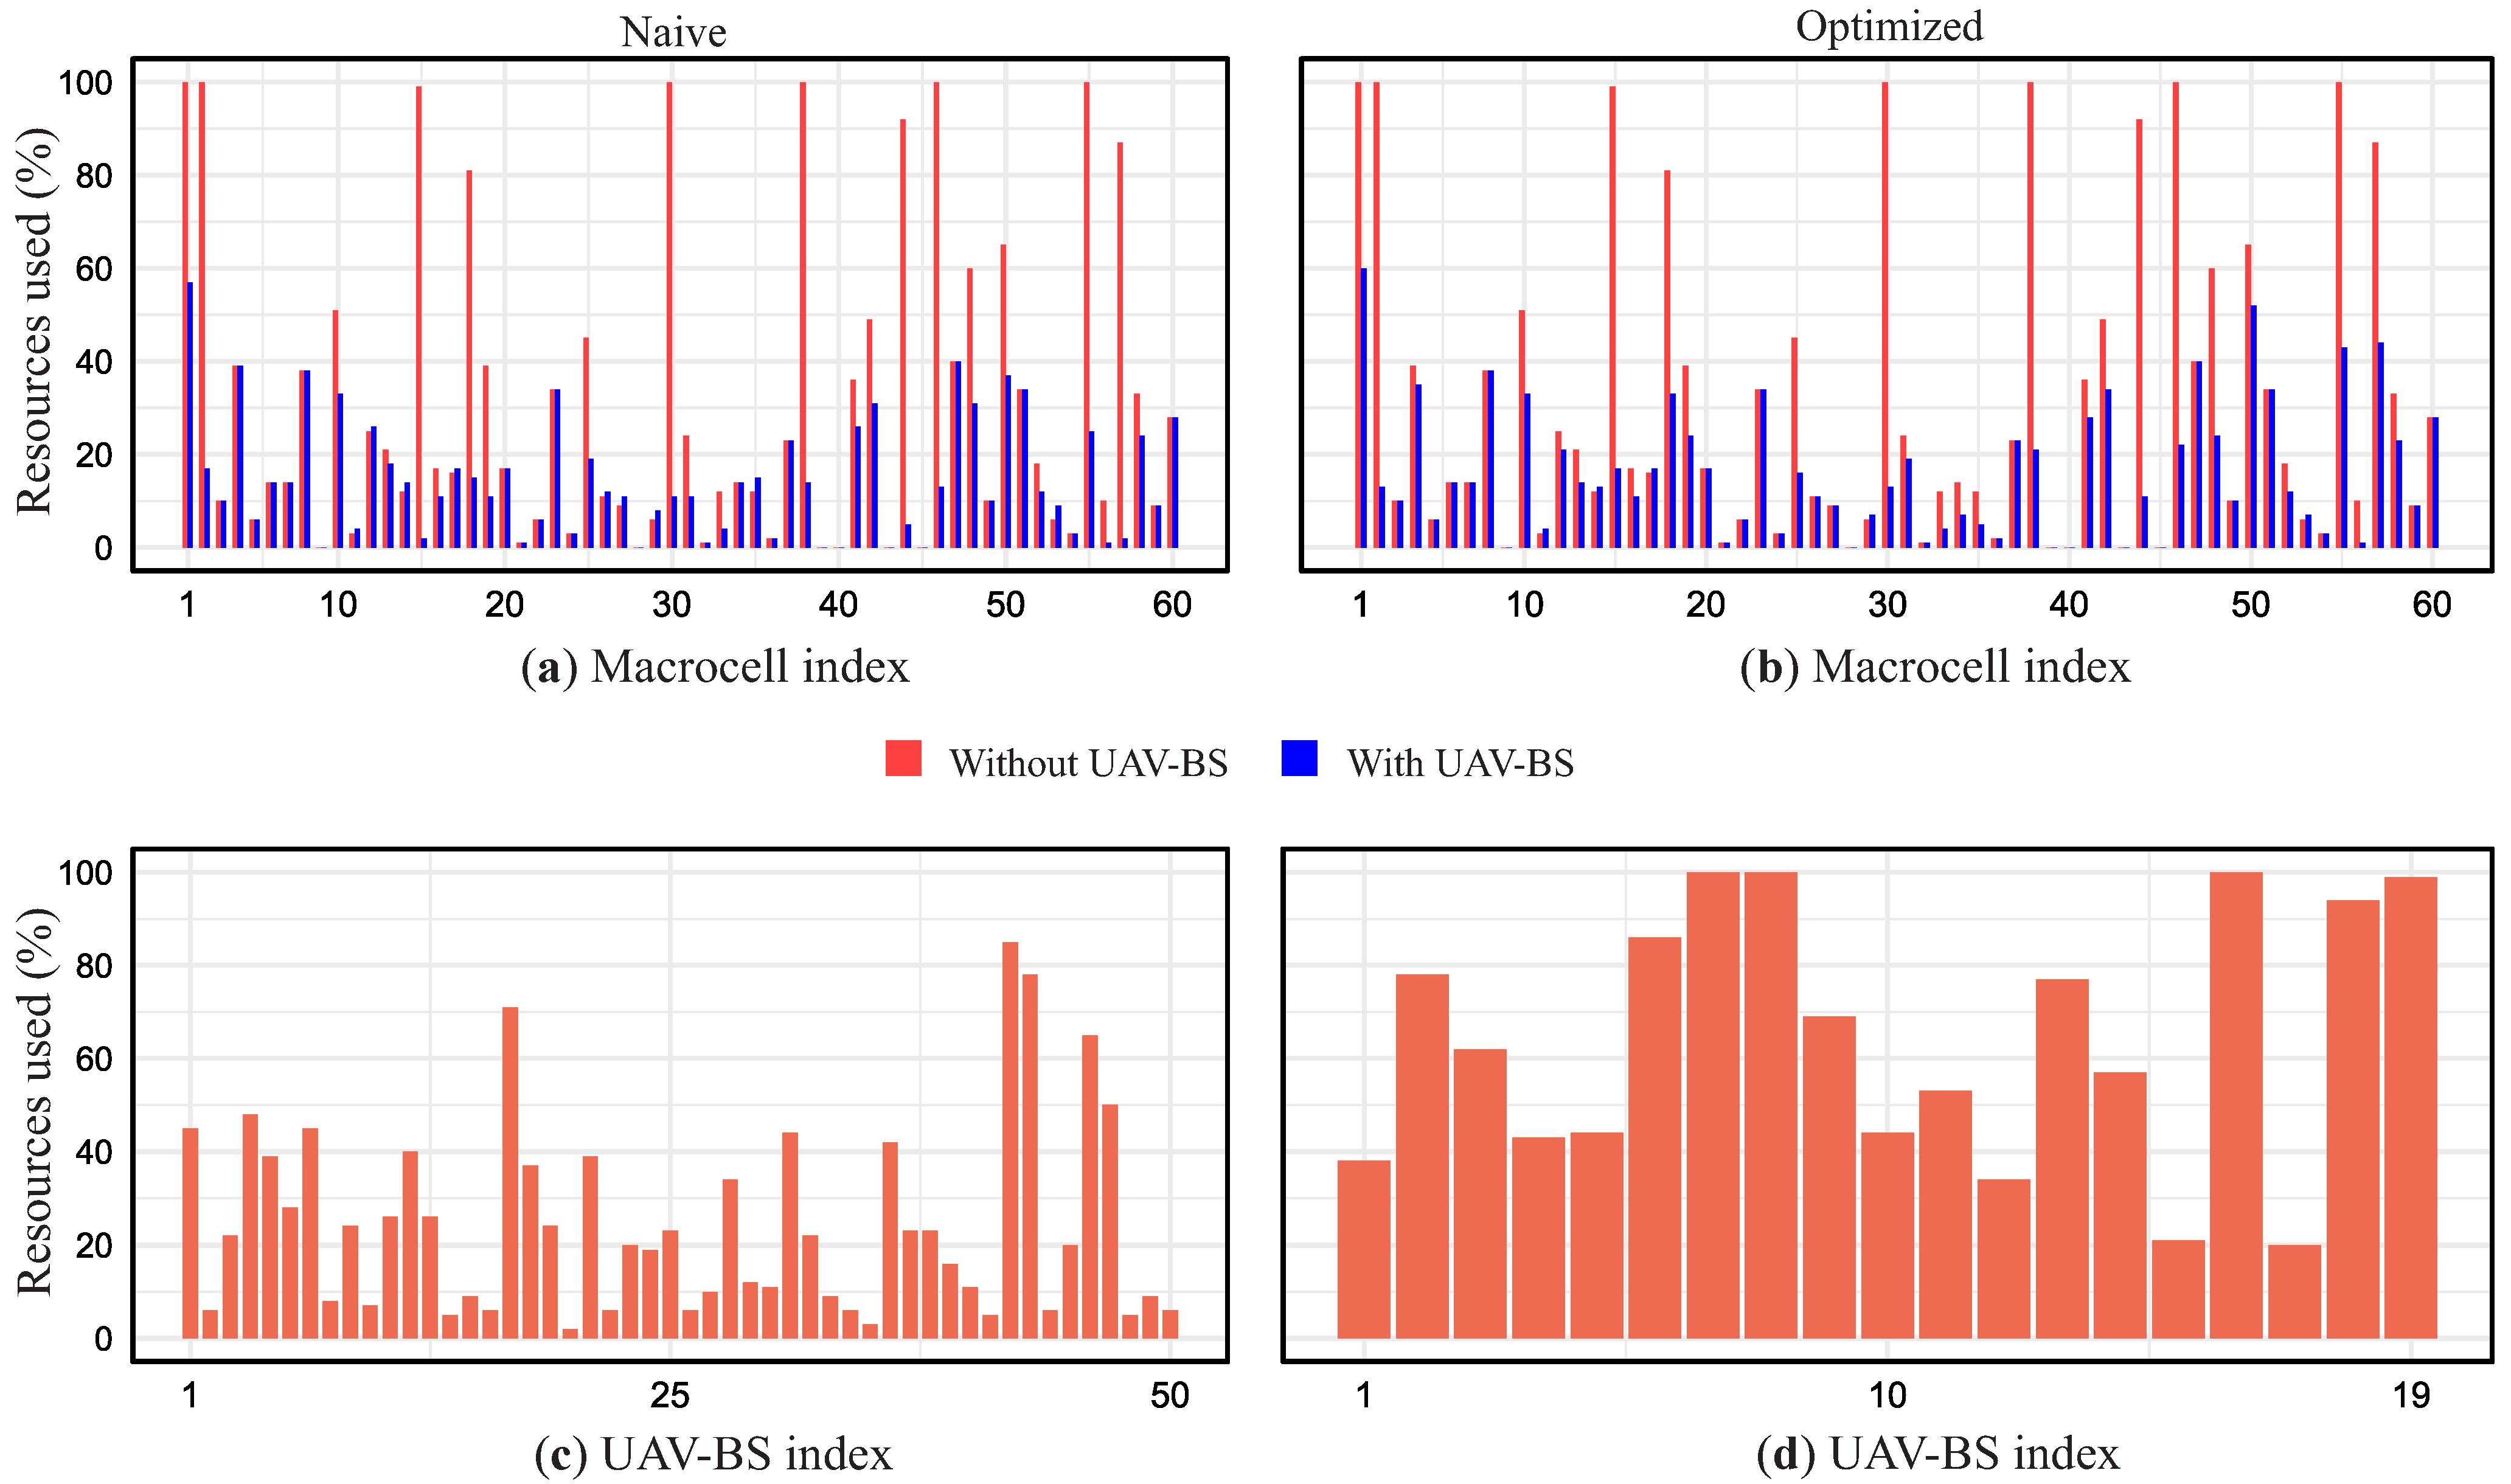
For the case study, we selected two samples within the database within 30 days. The goal was to evaluate and validate the proposed system. We divided the database into four weeks and selected the last week of April 2014 for the experiment. From this week, we selected Friday because it has the highest density of users. Then, we divided the week into two specific times that are within the peak hours of Manhattan according to [
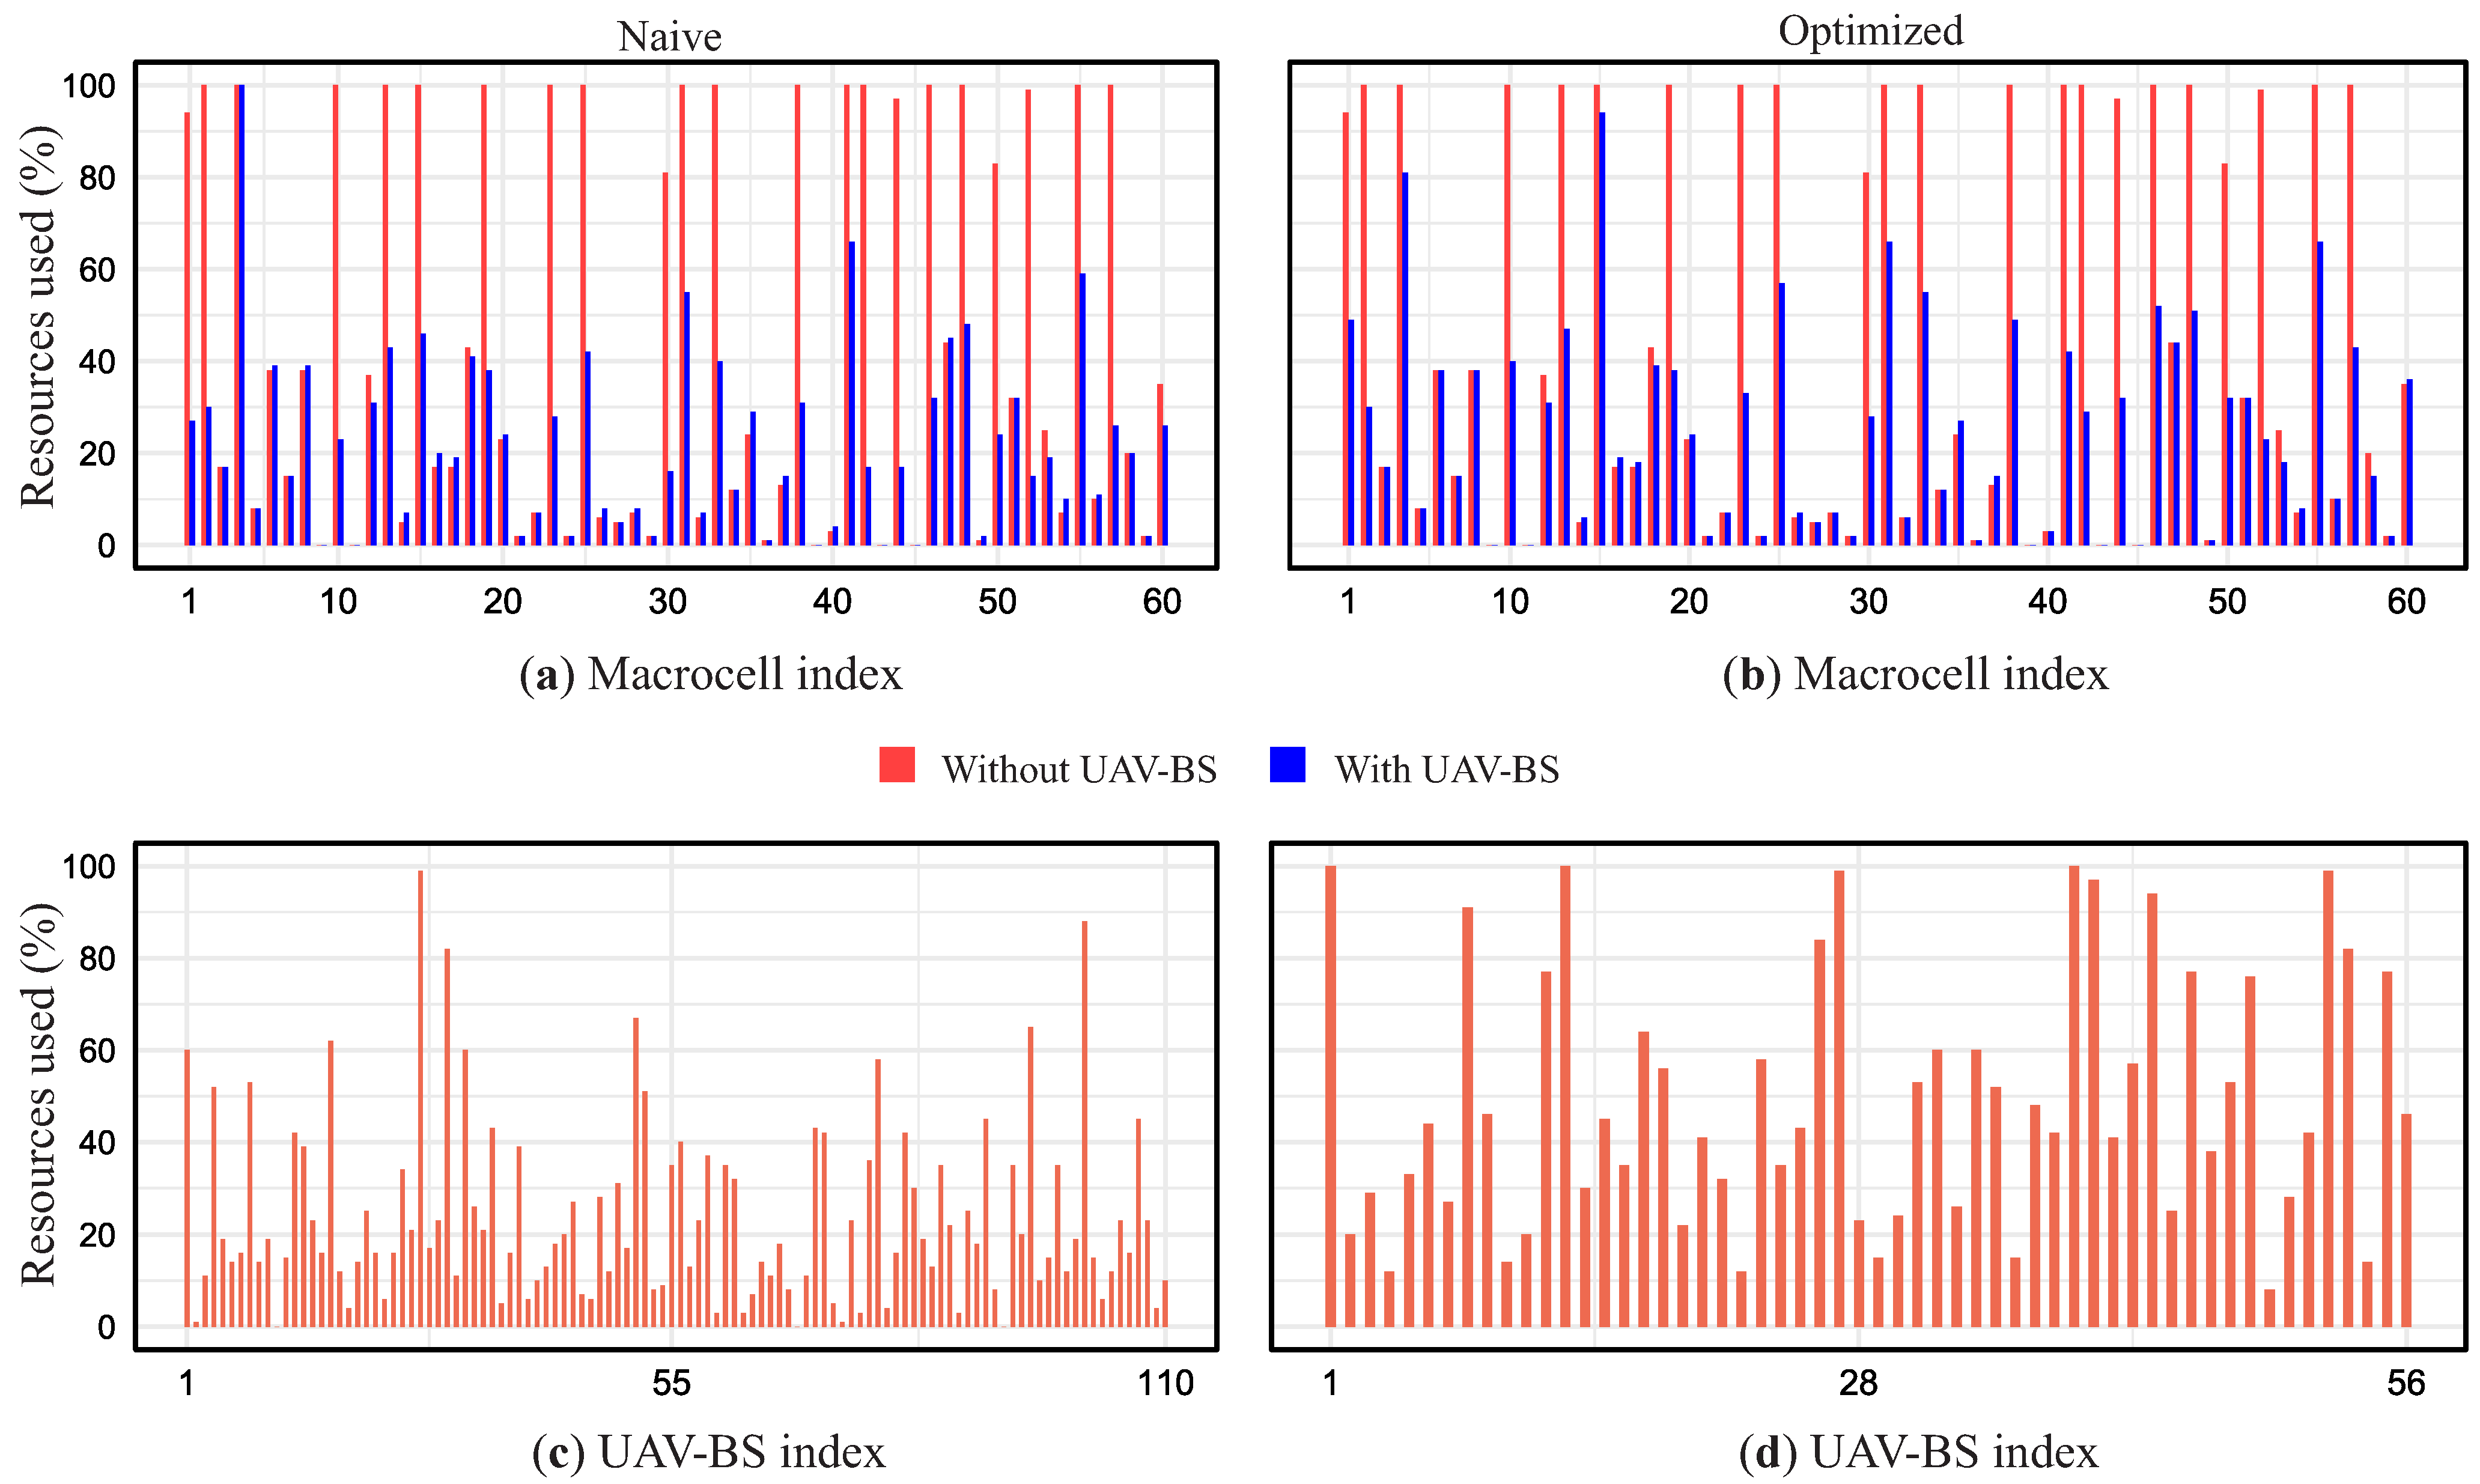
35]. The first sample selected was Friday at 7 a.m., with approximately 1054 users. The data was fed to the already trained models, and the prediction obtained accuracy above 84% accuracy. For the second sample, we chose Friday at 6 p.m., with a total of 1947 users. The data were passed to the trained models, and the prediction reached over 97% accuracy.
Next, we used the prediction of 7 a.m. and 6 p.m. to select the overloaded macrocell
and then grouped users that were located within 800 m of each other, as shown in Equation (
29). With the
found, the UCPA algorithm calculated the required UAV-BSs based on two strategies: naïve and optimized. The naïve strategy has a fixed value
of UAV-BSs for each overloaded
. In the optimized strategy, the number of UAV-BSs is calculated based on the number of users in the
coverage area, as shown in Equation (
30). After calculating the number of UAV-BSs, the UCPA calculates the optimal location for each UAV-BS, to serve the users with the best possible QoS and minimize the energy cost for the UAVs. The grouped users were passed to the K-means algorithm to separate the higher-affinity subgroup and find the center of that subgroup, and then determine the best placement for the UAV-BSs.
After determining the number and positioning of the UAV-BSs, we restarted the simulation, but only with the two specific schedules of 7 a.m. and 6 p.m. Unlike the first phase, in this phase, we had the support of the UAV-BSs, and the results were compared with those of the first phase to evaluate the performance of this system. The settings for the macrocell were the same as in the first phase, except that we assumed that both macrocell and UAV-BS used the same frequency band. That is, UAV-BS and macrocell interfere with each other. A frequency reuse factor of 1 was assumed. We assumed that UAV-BS has limited resources, e.g., for the radio access network (RAN) and backhaul. We determined that the bandwidth of UAV-BS with 20 MHz, as well as macrocell with an amount of 100 resource blocks, was used to determine the amount of load consumed. The air-to-ground channel model described in [
40,
41] was used from the UAV BSs to the user devices. The simulation starts with the deployment of the macrocell, UAV-BSs, and users in the scenario, then the necessary settings and models are initialized. The allocation of the users is calculated and determined by ranking based on the SINR for the macrocell and the UAV-BSs. If the user is unable to connect to the macrocell or UAV-BS that is at the top of the ranking, it moves to the next row until a stable connection is achieved. If no macrocell has a sufficient resource block to provide the required downlink throughput, the user is considered unreachable (blocked). In addition, users with an SINR value below the threshold of
were considered unavailable. The parameters used in this work are listed in
Table 2.
7. Conclusions
In this work, we have studied issues related to mobile network congestion affected by the temporal and spatial flow of users. We focused on the quality of service in regions temporarily supported by UAV-BS. The machine-learning-based solution is divided into two main algorithms, LPA and UCPA, which are used to predict the mobile network utilization and calculate the number and location of ideal UAV-BSs to temporarily support the ground network. LPA predicts the utilization based on the cellular network usage history to find congested macrocells. To temporarily solve the congestion problem, a network of air cells must fly to the location. To estimate the number of aerial cells needed and their positioning, the UCPA was developed. In the load prediction (LPA) phases, the random forest and GRNN models have been tested and have shown accuracy up to 86% in testing and validation. To demonstrate the efficiency of the proposed method, a study based on Manhattan data was conducted. The random forest model achieved the best result, compared to the GRNN model, and showed an accuracy of 99% for the best scenario.
The UAV-BS number estimation and positioning (UCPA) considered the predicted congestion and the definition of the congested macrocells (LPA). The final positioning of the UAV-BSs was based on the K-means algorithm. In this phase, the cost–benefit ratio was determined to balance between the number of UAV BSs and the quality of service offered. The results showed that there was little difference between the strategies in terms of service quality. However, the optimized strategy uses, on average, 50% less UAV-BS than the naïve strategy.
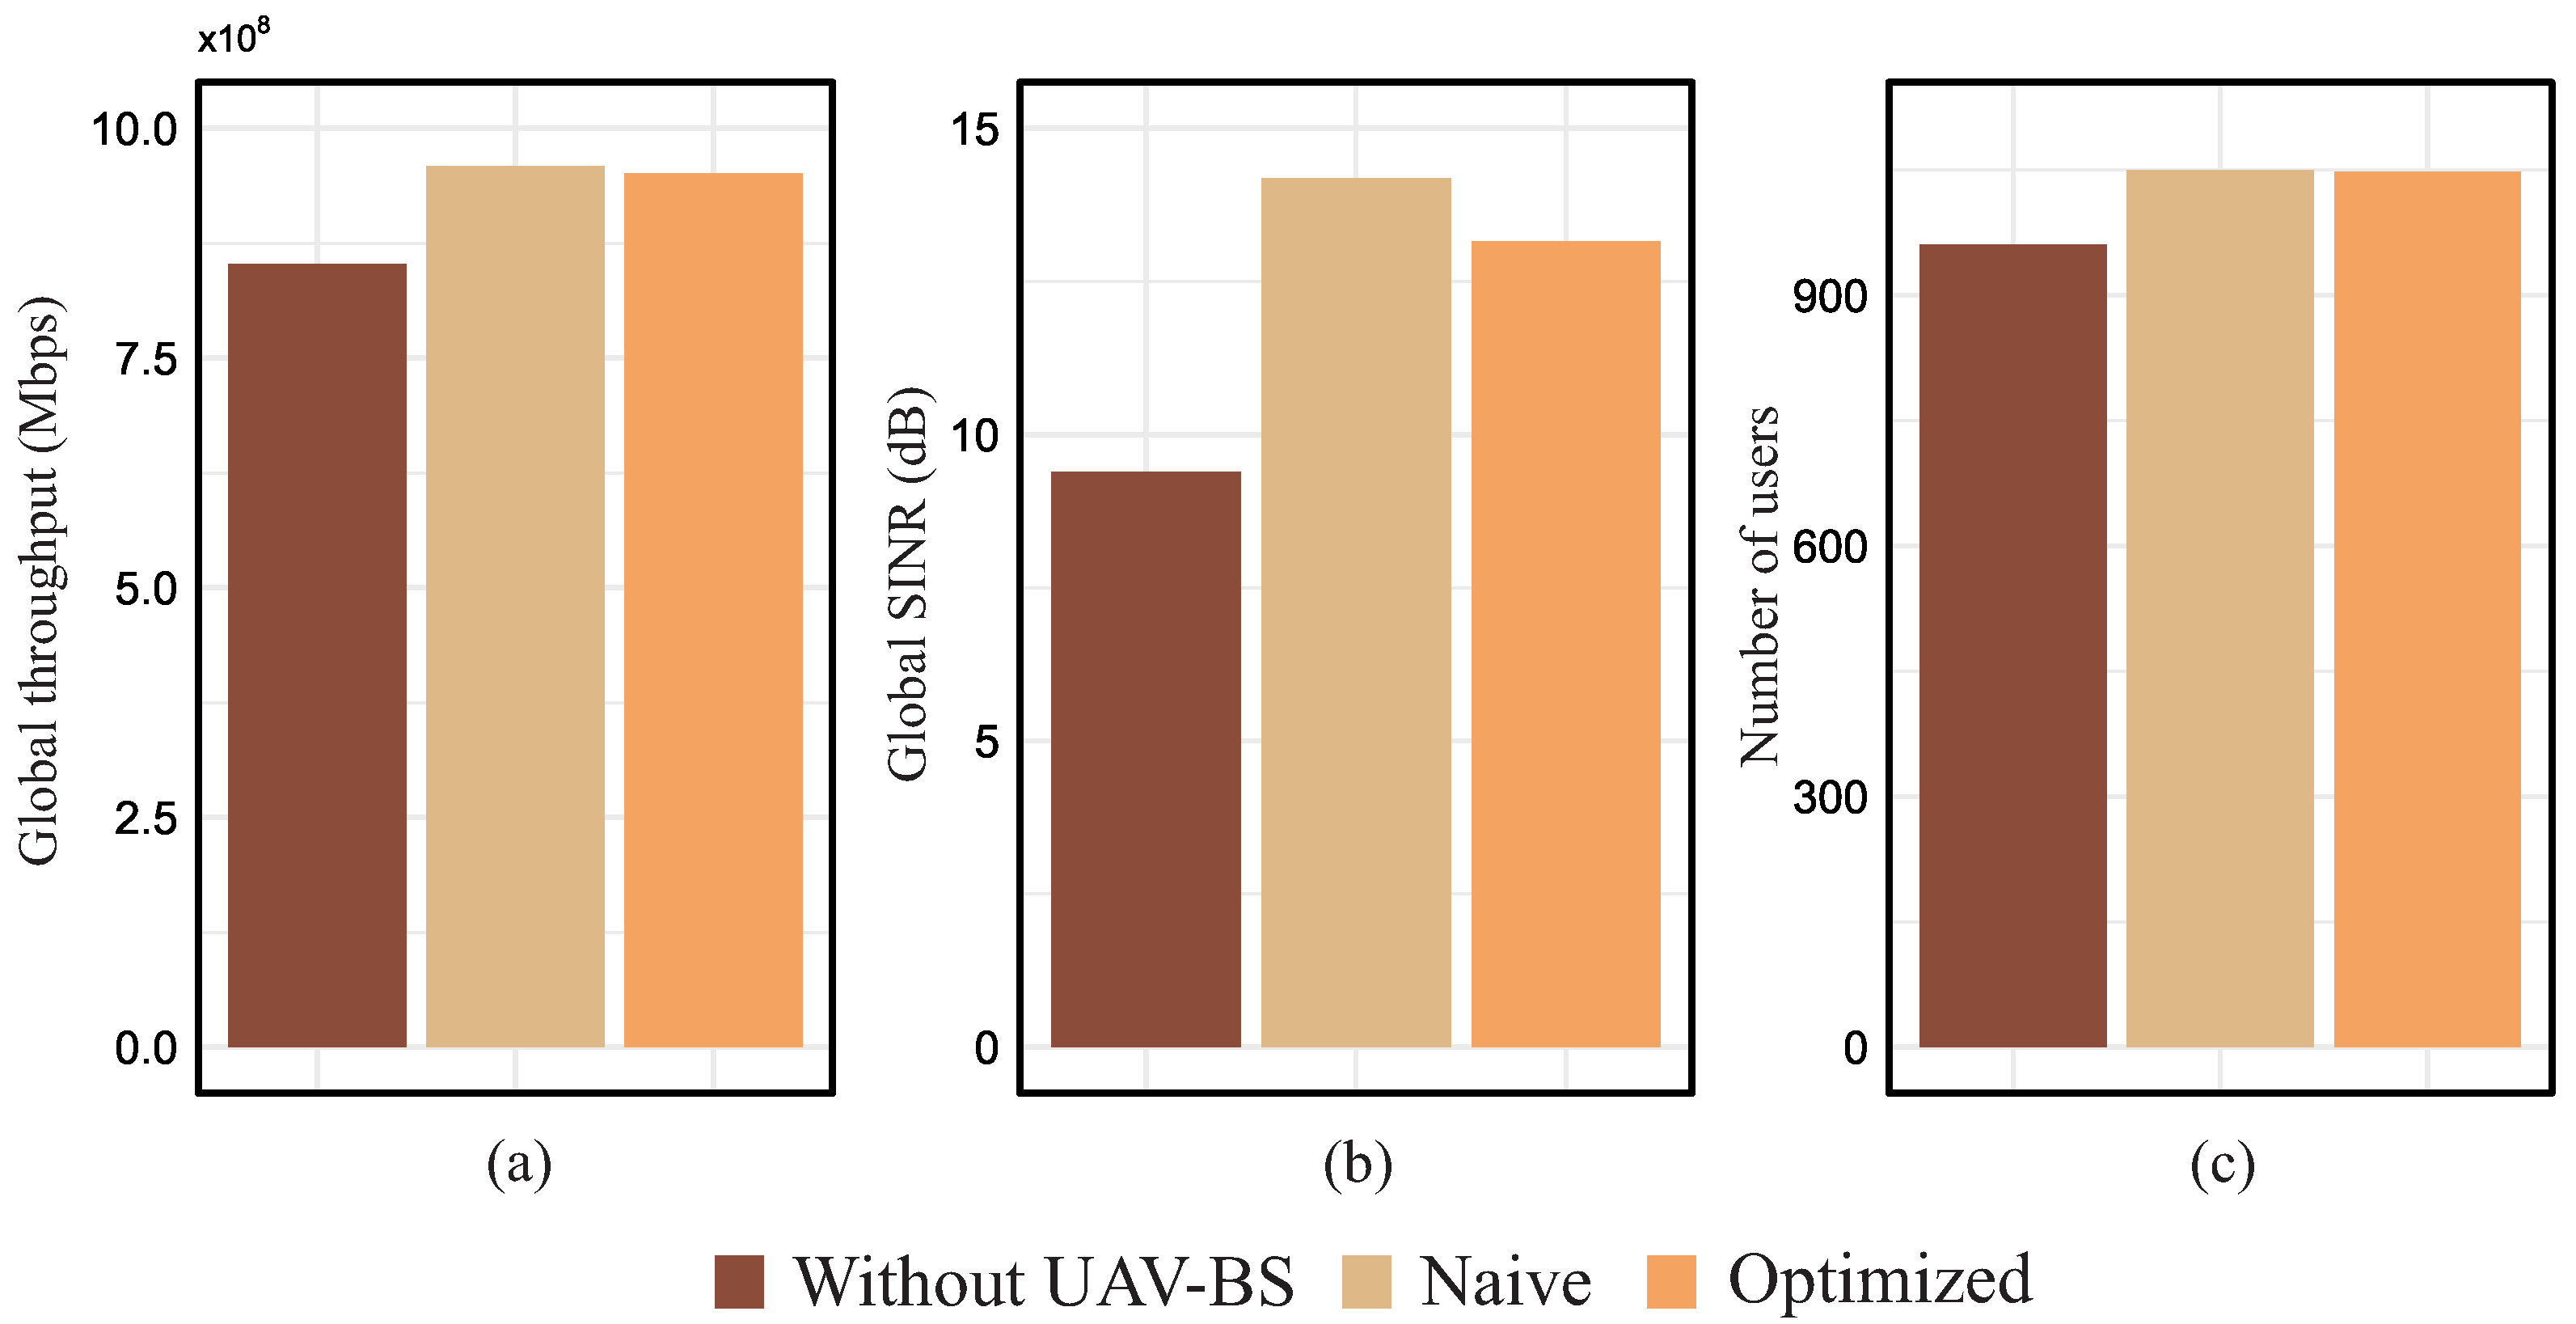
In general, the intelligent system was able to solve the problem of congestion. Congested regions were supported by the UAV-BSs and congestion was minimized, as shown by the numerical results. The system significantly improved the quality of service in the region and reduced the probability of user blockage. The system can be used to intelligently manage the resources available in a congested region (UAV-BS), improving deployment and increasing the lifetime of the service provided.


 ,
, 


