Article

Chaos Synchronization Error Technique-Based Defect Pattern Recognition for GIS through Partial Discharge Signal Analysis

Department of Electrical Engineering, National Chin-Yi University of Technology, Taichung 41170, Taiwan
*
Author to whom correspondence should be addressed.
Entropy 2014, 16(8), 4566-4582; https://0-doi-org.brum.beds.ac.uk/10.3390/e16084566
Submission received: 31 May 2014 / Revised: 30 July 2014 / Accepted: 31 July 2014 / Published: 13 August 2014
(This article belongs to the Special Issue Complex Systems and Nonlinear Dynamics)

Abstract

:
The work is aimed at using the chaos synchronization error dynamics (CSED) technique for defect pattern recognition in gas insulated switchgear (GIS). The radiated electromagnetic waves generated due to internal defects were measured by the self-made ultrahigh frequency (UHF) micro-strip antenna, so as to determine whether partial discharge will occur. Firstly, a data pretreatment is performed on the measured raw data for the purpose of computational burden reduction. A characteristic matrix is then constructed according to dynamic error trajectories in a chaos synchronization system, subsequent to which characteristics are extracted. A comparison with the existing Hilbert-Huang Transform (HHT) method reveals that the two characteristics extracted from the CSED results presented herein using the fractal theory were recognized at a higher rate pattern.

1. Introduction

There have been a great number of studies based on sound, chemical, optical, electric approaches, etc., on defect pattern recognition techniques according to the detected partial discharge signals released from a gas insulated switchgear (GIS) [1,2]. Currently, the main techniques include the conventional partial discharge impulse current and ultrahigh frequency (UHF) approaches. Some noise components below 150 MHz are observed in our test field, according to which an UHF sensor with bandwidth between 400 MHz and 1.3 GHz is designed to filter the noise. It is a non-contact online monitoring technology to monitor the normal operation of a GIS by means of the released electromagnetic signals. An impulsive radiation emission, over the frequency spectrum from DC to above 1 GHz, is caused by high pressure SF6 gas the moment a partial discharge arises. In contrast, most noise interference such as corona in a power system occupies the frequency band below 150 MHz, and undergoes rapid decay during wave propagation in air, that is, an elevated signal to noise ratio is hence seen due to the lower level noise interference over the UHF band.
Nevertheless, the electromagnetic signal is rather weak over the UHF band, and hence a high sensitivity detection module, either a MHz narrow- or GHz broadband [3], is found necessary. In most cases, a narrow band detection module requires a spectrum analyzer together with a low noise, high gain preamplifier to handle the received signal in the presence of ultrahigh frequency noise components. As a more popular alternative, a broadband detection module needs a nanosecond sampling oscilloscope along with a 250–300 MHz high pass filter [4]. The sensitivity of the HUF approach is subject to a number of features, i.e. the detection module sensitivity, the strength of partial discharge signals and defect types. In this work, an investigation is made into the electromagnetic signals received by a microstrip antenna for defect pattern recognition, since the electromagnetic wave leakage from a GIS experiences weak propagation decays in air. Hence, the use of a microstrip antenna as well as a broadband power amplifier, and a detection module, as implemented in [5], is designed so as to meet the PD analysis requirements.
As suggested in [613], a partial discharge phenomenon can be characterized in most cases by the partial discharge phase, mean discharge number, mean discharge, mean discharge frequency, and so on, and the commonly seen approaches for defect pattern recognition include Fourier transform, Discrete Fourier Transform, Hilbert-Huang Transform (HHT), etc. Although the embedded characteristics can be extracted directly from partial discharge signals, a large database is required when statistics are performed on the characteristics of interest over a long time span. Neverthless, a 100% recognition rate cannot be ensured. In early days, a partial discharge signal was recognized by means of the features revealed on an elliptical trajectory. However, as a consequence of the long term technology progress made over the years, commercial instruments are now able to accurately sense partial discharge signals [14,15], emanating from an insulation facility, analyze the dielectric punchthrough process, provide a maintenance message and prevent catastrophes, but such commercial instruments, costing as much as a million dollars, preprocess field detected signals in their front end circuits, due to which part of intrinsic physical meanings contained in the signals are lost. For this sake, a diagnostic tool for pattern recognition of GIS defects is presented in this work.
Described as a random-like dynamic behavior in a deterministic system, chaos is an exclusive form of nonlinear system, and its applications can be found in a wide variety of research fields [1621], e.g., in adaptive control systems, signal processing, fluid mechanics, encryption, and so on. It features a high sensitivity to initial values, fractal dimensions, random-like properties, unpredictability, and the like. In this study, analysis of partial discharge signals is made through a chaos synchronization system. A proper choice of parameters enables the Slave to automatically track the Master system, and dynamic errors are found between the signals in a normal case and a defect one [22]. A pretreatment is conducted on measured raw data in such a way that the computational load and the amount of noise are reduced, while characteristics embedded in partial discharge signals are well preserved.
This work aims to build a diagnostic tool able to identify the latent defects for a GIS at an early stage. Distinct types of defective GISes give rise to distinct partial discharge patterns which are sampled over a single 60 Hz cycle. Under the assumption that an ideal zero amplitude normal signal occupies the same time interval as the defect one, both the defect and the normal signals are respectively applied to the Master and the Slave in a chaos synchronization system, then the tracking error trajectories are treated as characteristics. The self-similarity between the same type of partial discharge signals is reflected in the low tracking error, and a characteristic matrix is constructed thereby. By use of fractal theory, the fractal dimension and the lacunarity are extracted as both characteristics. The use of fractal features to identify different defect typologies has been proposed in [23] and the approach was abandoned because it was found to be ineffective. That is, the fractal features cannot do well in some defect typologies. However, it does perform well in our paper when combined with chaos synchronization from the experimental results. Therefore, our paper combined with chaos synchronization could improve the fractal features to be more effective for dealing with the PD defect typologies. In this study, the first 20 samples in each defect type are regarded as training samples, while the remaining 20 are used as test samples. This proposal, as opposed to the HHT approach [23,24] employing an energy-frequency-time characteristic matrix, demonstrates a satisfactory defect recognition rate when applied to a chaos synchronization scheme [25].

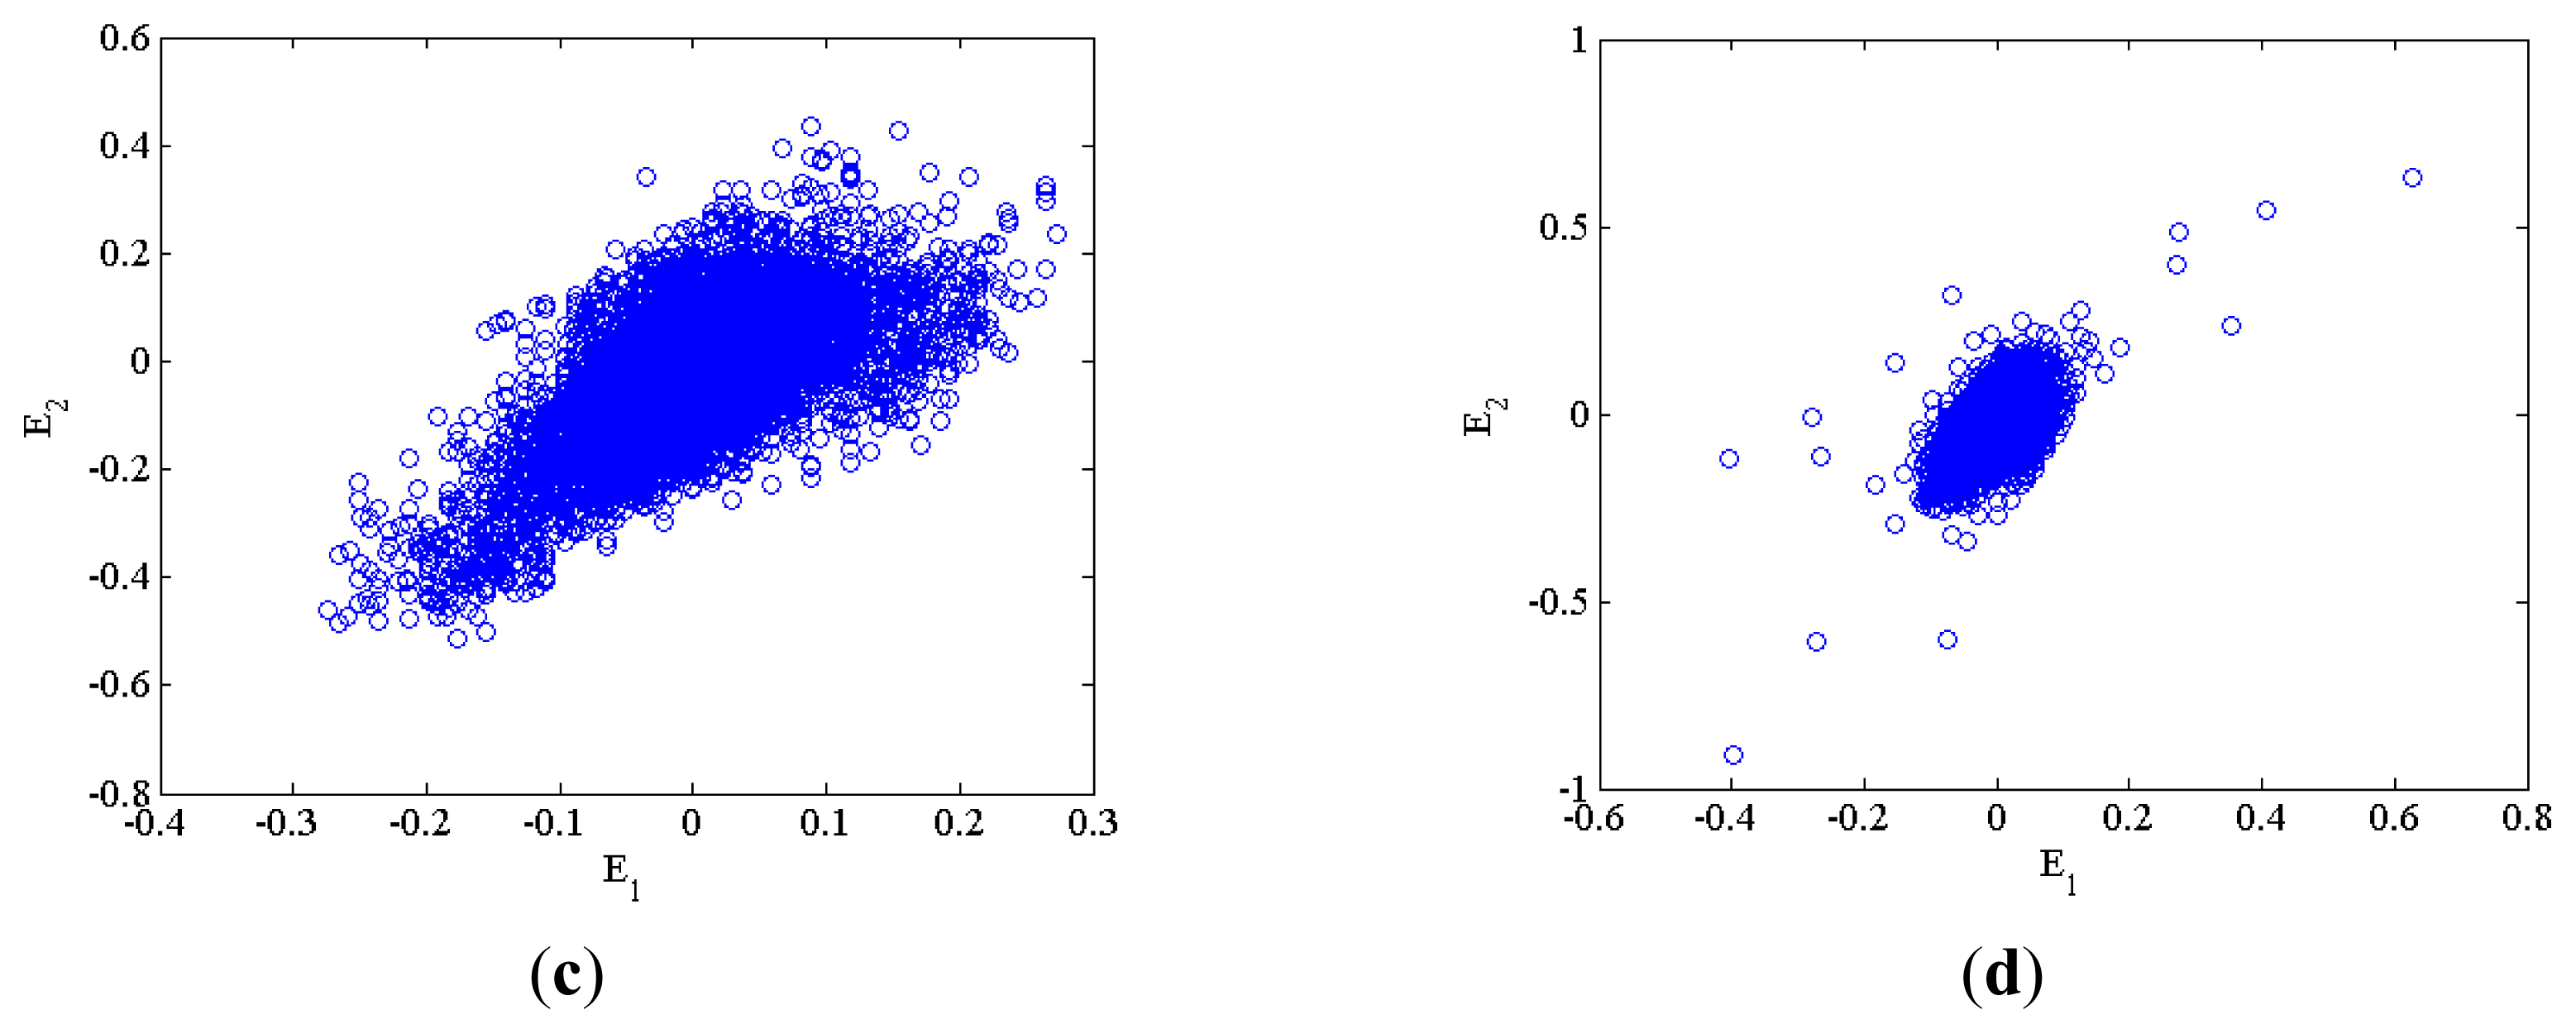
2. Chaos Synchronization Error Dynamics

The system in which a chaotic system is used to track the chaotic behavior of another system is called chaos synchronization error dynamics (CSED) [19]. Generally, a chaotic system contains Master and Slave systems that exist in a master and servant relationship. The characteristic signal of PD is transient in a real physical system. Recording and analyzing these characteristics are impractical. In addition to requiring the construction of a massive database, analyzing the characteristics of long signals takes a lot of time. Therefore, this study proposes a chaos synchronization system, where the Master system is defined as the driving system; the Slave system is the response system, and the Slave system tracks the Master system to within a cycle period.
In this study, the most typical Lorenz chaotic system was used to demonstrate the chaos synchronization error dynamics fault diagnosis in PD system. A Lorenz system is described as a third order differential equation involving three parameters. In early days, it was developed for complicated weather forecasts, expressed as the nonlinear atmosphere convection equation, that is:
d x d t = - a ( y - x ) d y d t = b x - y - x z d z d t = x y - c z
where x, y, z represent three state variables, and a, b, c three system parameters. A Lorenz chaos synchronization error dynamics system is configured as:
M a s t e r S y s t e m :             { d x 1 d t = - a ( y 1 - x 1 ) d y 1 d t = b x 1 - y 1 - x 1 z 1 d z 1 d t = x 1 y 1 - c z 1
S l a v e S y s t e m :             { d x 2 d t = a ( y 2 - x 2 ) + u 1 d y 2 d t = b x 2 - y 2 - x 2 z 2 + u 2 d z 2 d t = x 2 y 2 - c z 2 + u 3
where u1, u2, u3 denote the control terms in a slave system. With the dynamic error trajectories as the targets, u1, u2, u3 are set to zeros in a chaos synchronization error dynamics system [22]. In Equations (2) and (3), x1 = x[i], y1 = x[i + 1], z1 = x[i + 3], x2 = y[i], y2 = y[i + 1], z2 = y[i + 2], i = 1, 2, 3, …, n − 2, x and y respectively represent the sample sequences of the defect and the normal signals, and n denotes the total number of samples. Defining dynamic errors as e1 = x1x2, e2 = y1y2, e3 = z1z2, a dynamic error (DE) system is derived from Equations (2) and (3) as:
{ d e 1 d t = E 1 = a ( e 2 - e 1 ) d e 2 d t = E 2 = b e 2 - e 2 - x 1 z 1 + x 2 z 2 d e 3 d t = E 3 = - c e 3 + x 1 y 1 - x 2 y 2
where scaling factors a, b, c in Equations (2) and (3) are three nonzero parameters. As shown in Figure 1, a normal and a defect PD signal, dynamic error E1, E2, E3, and a phase plot of a chaos synchronization error dynamics are illustrated.
Exhibited in Figure 1a are a normal signal and a partial discharge signal, i.e., the defect, which arises from a GIS defect. The raw data are collected over a single 60 Hz cycle in hopes of defect pattern recognition. The respective dynamic error trajectories E1, E2, E3 for a Lorenz chaos synchronization system are exhibited in Figure 1b, where deviations of E1, E3 are seen away from zeros. A point worthy of mention is that the occurrence of partial discharge is reflected in the dynamic error trajectories which do not as expected converge to zero in the presence of inevitable noise interference. Demonstrated in Figure 1c is a phase plane trajectory for E1, E2, E3, where a number of spikes representing partial discharge are seen as the validation of this proposal.

3. Fractal and Extension Theories
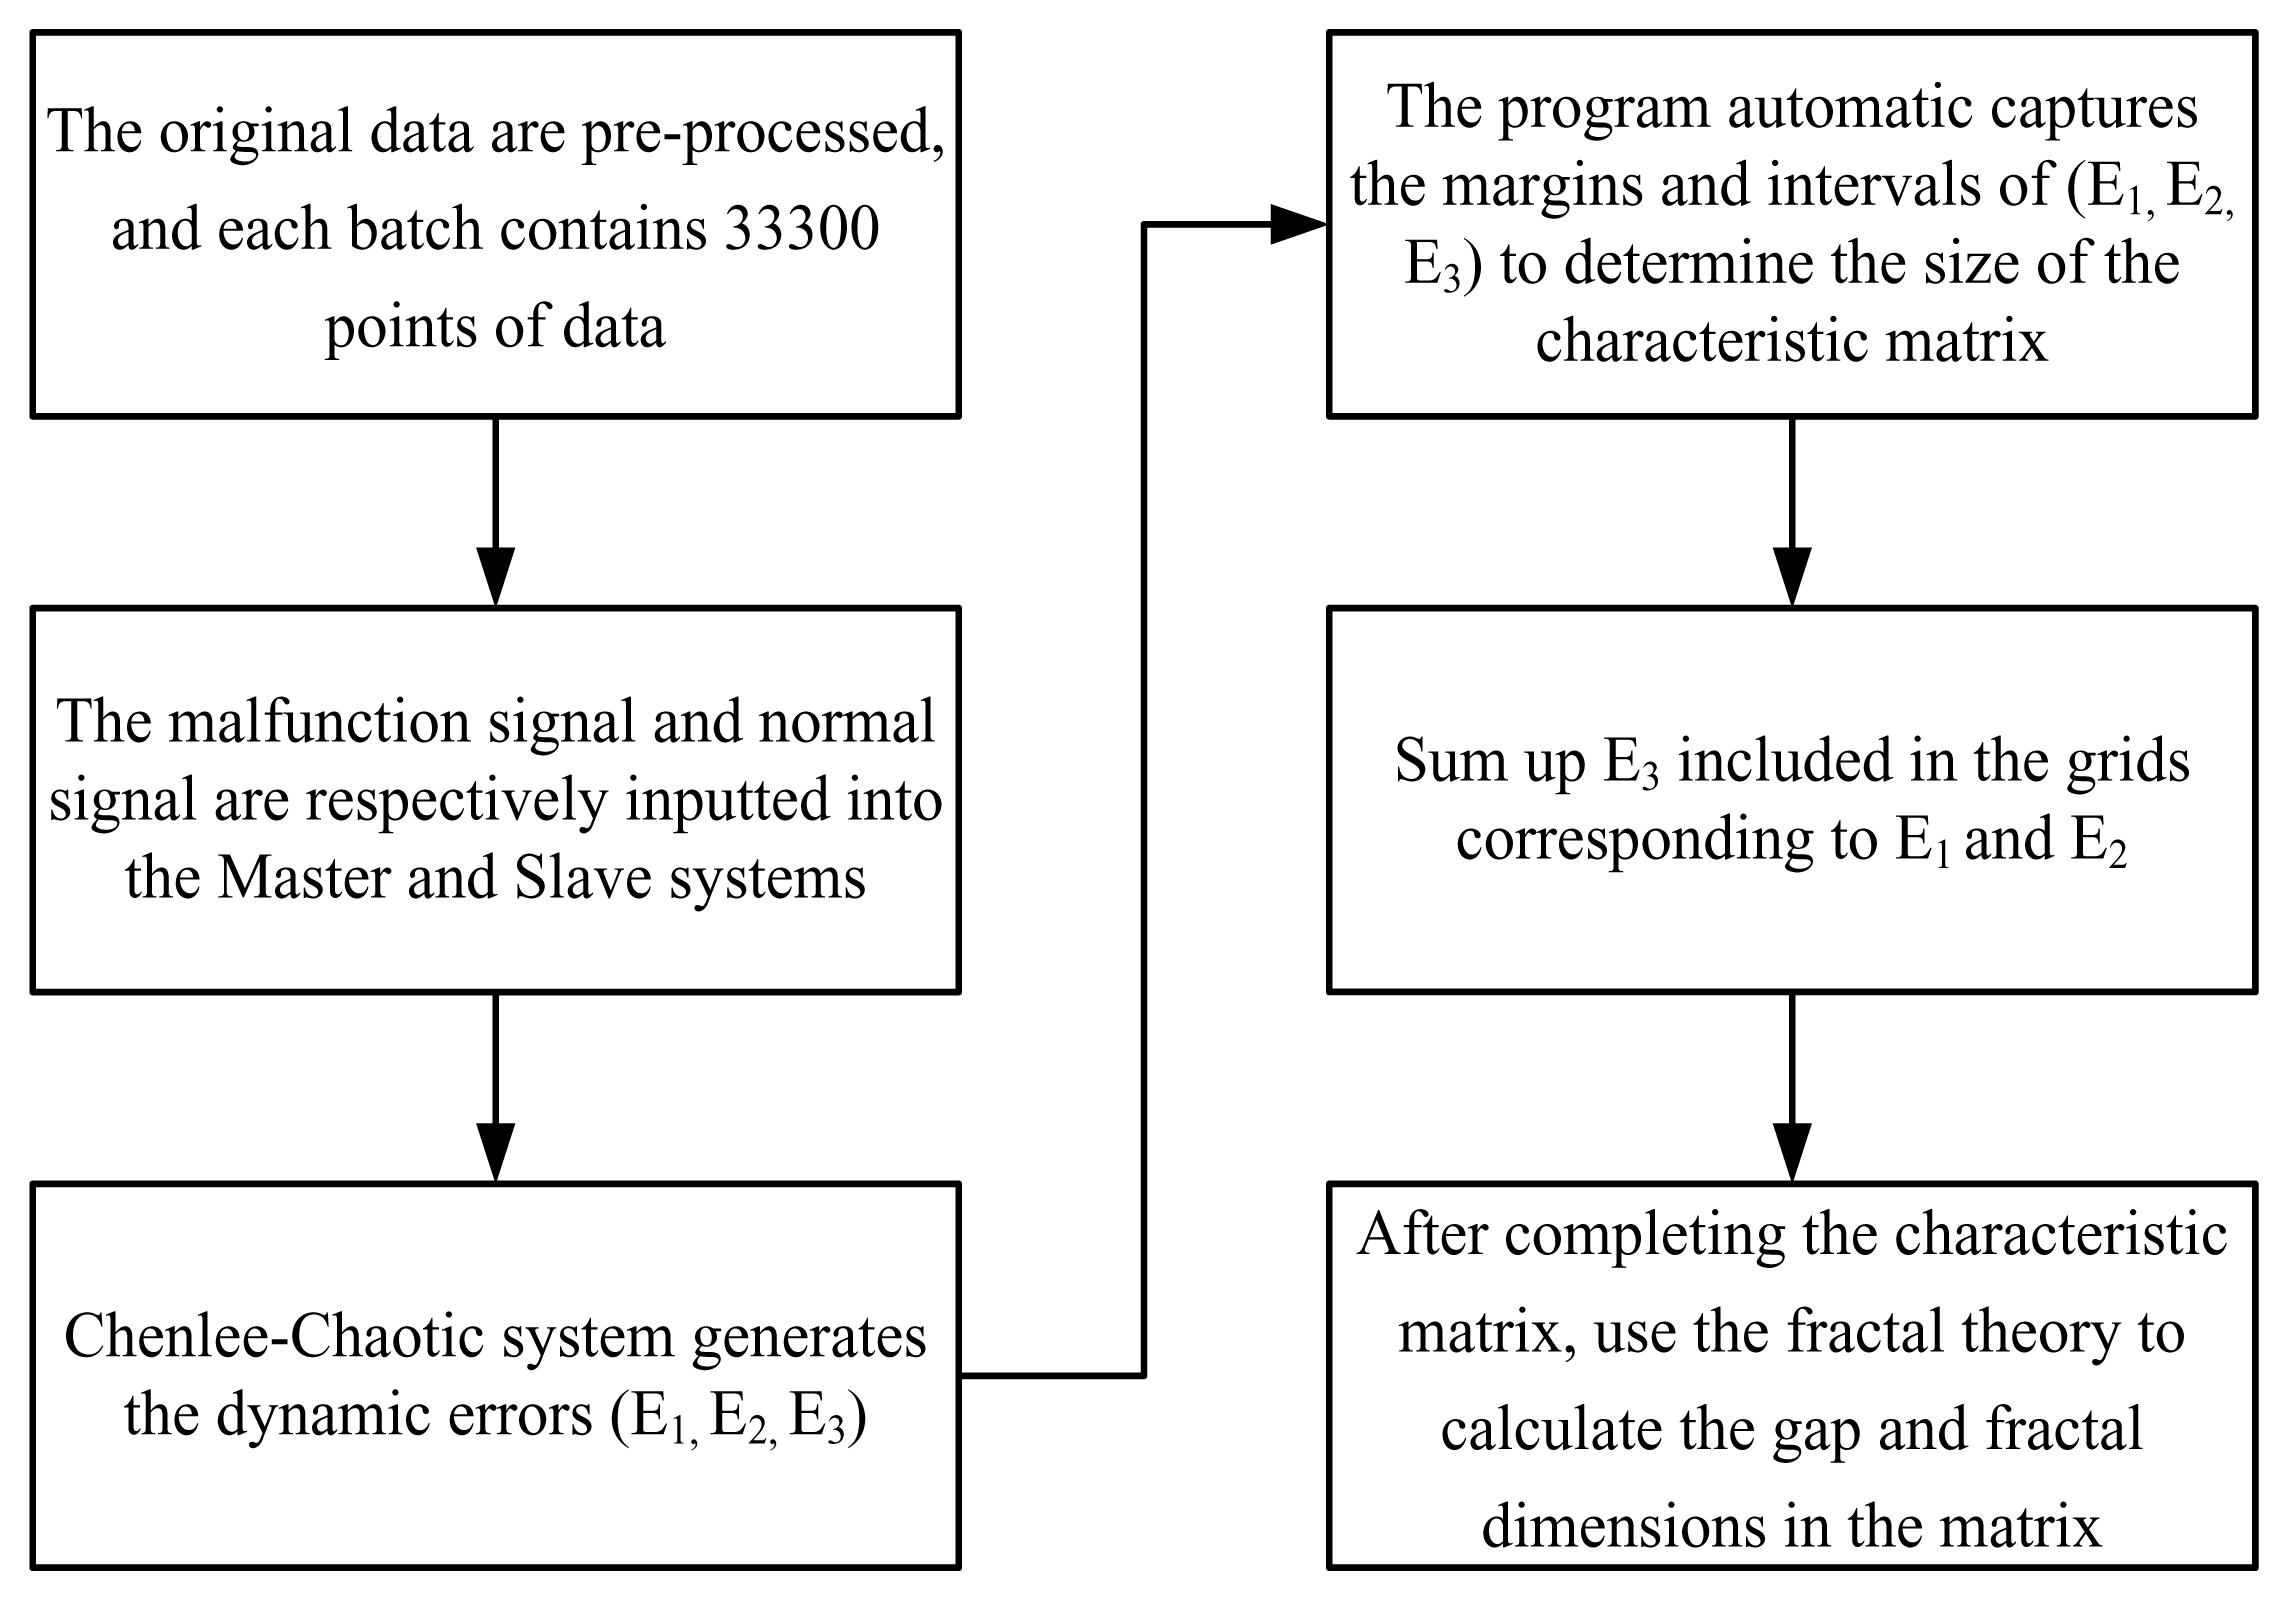
Although the CS error dynamic can present information about the defect of partial discharge, graphs cannot easily capture microvariations among signals. Therefore, a numerical value is used to represent this characteristic information. This study uses the error dynamics E1, E2 and E3 to construct the characteristic matrix, which must be able to express the characteristics and properties of the defect signals. Then, fractal theory is utilized to obtain the characteristic value, which is finally used in the clustering method for training and testing. A more detailed introduction of fractal theory process and the extension concept can be found elsewhere [2632].

4. Method

4.1. Characteristic Extraction

An investigation is made into four types of defects. As exhibited in Figure 2 for a Lorenz chaos synchronization system as described by Equations (4) and (5), a partial discharge event of each defect type can be characterized by such quantities as the signal frequency and amplitude, etc., and self-similarity can be found between the same type of defect.
In this work, a defect signal is applied to the master reference system, where the set composed of the defect signal samples 1 to 33,298 is indicated by x1, 2 to 33,299 is by y1, and 3 to 33,300 is by z1. Likewise, a normal signal is applied to the Slave tracking system, where the set consisting of the normal signal samples 1 to 33,298 is denoted by x2, 2 to 33,299 is by y2, and 3 to 33,300 is by z2. The tracking dynamic errors, E1, E2, E3 are evaluated by Equations (4) to (6). Differences in trajectories E1, E2, E3 are demonstrated in Figure 3 among four types of defects. In particular, as demonstrated in Figure 4, different dot distribution patterns and densities are seen across various defect types, and self-similarity is viewed between the same types of defect, so that such two quantities are extracted as two characteristics.

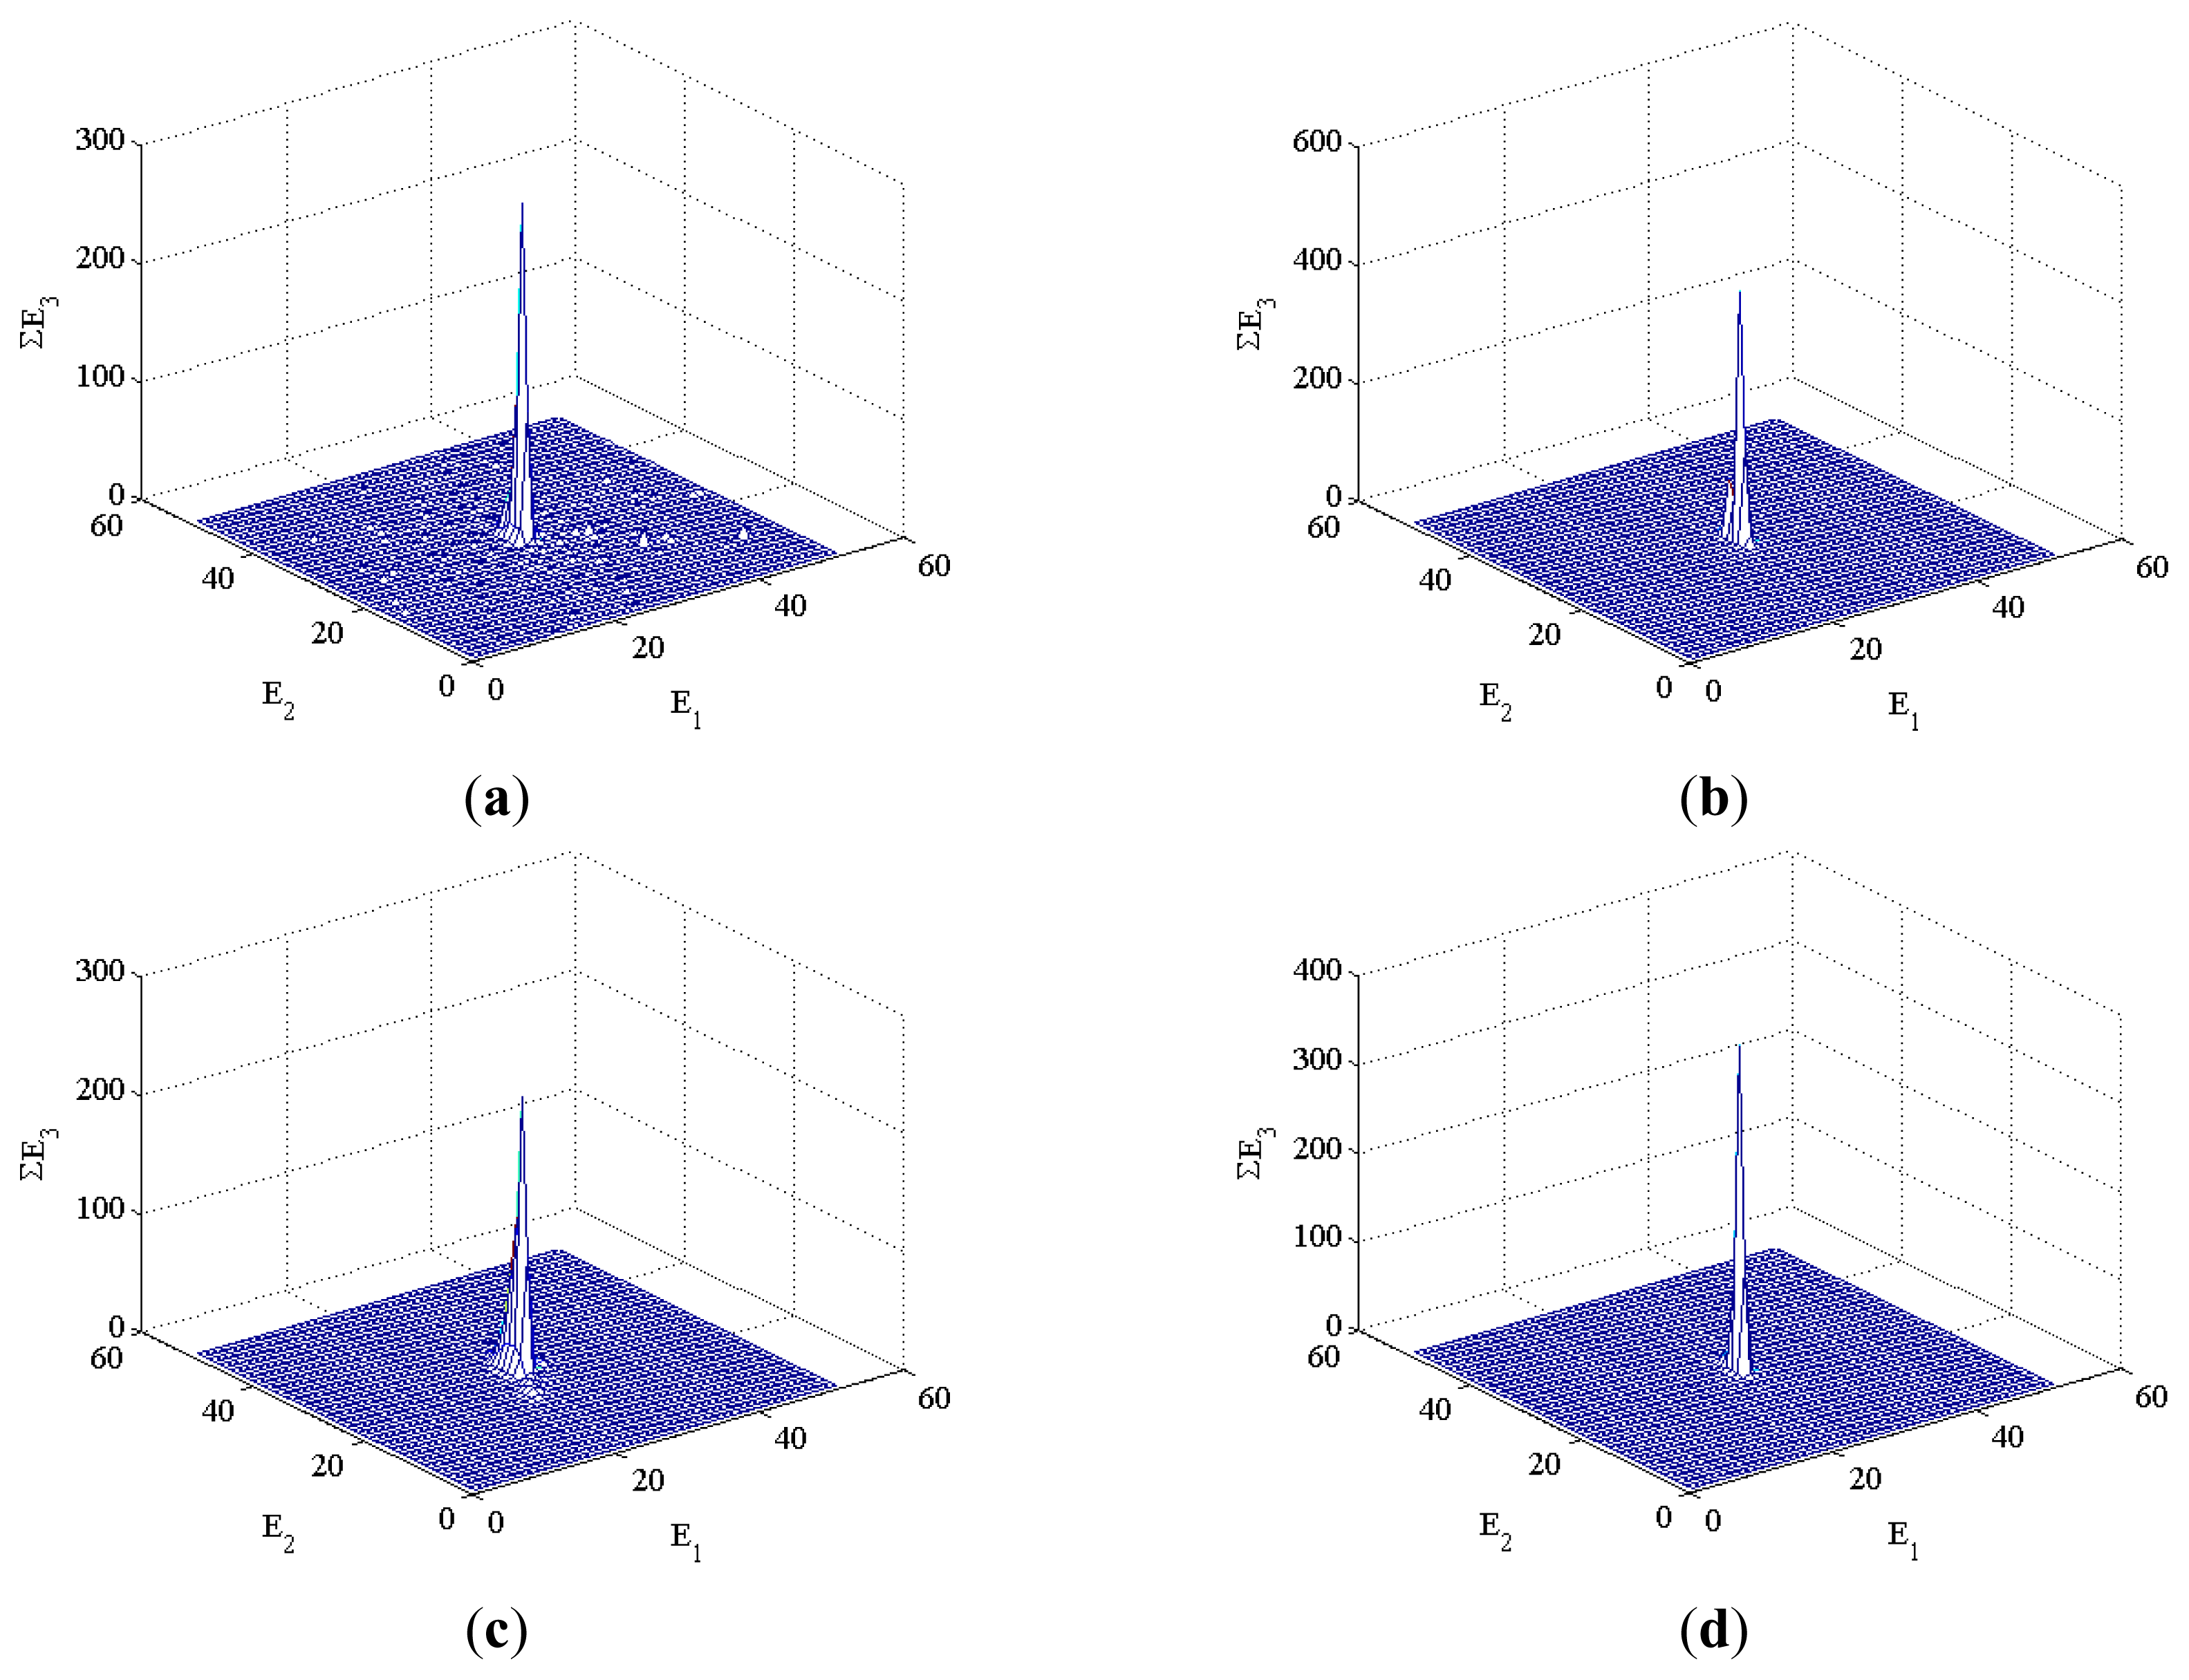
4.2. Construction of the Characteristic Matrix

The density and number of distributed points are extracted, as mentioned in the previous section. First, these characteristics are represented in a matrix, and the characteristic values of these characteristics are obtained by calculating this matrix. Figure 5 presents the procedure for the construction of the characteristic matrix. First, E1 and E2 are represented as the x and y axes, and program automatically determines the maximum values bmax for all defect types of |E1| and |E2|. The maximum value bmax and minimum value −(bmax) define the extent of the x and y axes. This step ensures that the matrices for all defects have the same size. The extreme values at the limits of the minimum range are set to −(bmin) and bmin. These are divided by number of grid cells to obtain the spacing value. Finally, the matrix size is determined by dividing the boundary value by the spacing.
Following the construction of the matrices as described above, the grid cells represent the positions that correspond to E1 and E2. However, only the density characteristic is shown in this study, so all the E3 in the E1 and E2 grid cells are summed, so the total amplitude value represents the number of distributed points. More distributed points corresponds to a higher total amplitude value, so this characteristic matrix can express the density of the E1, E2 distributions, and the total amplitude value for E3 represents the number of distributed points.

4.3. Characteristic Extraction and Clustering Method

The lacunarity and fractal dimension are extracted using the method that was described in Section 3 for characteristic extraction. Figure 6 presents three-dimensional diagrams of a characteristic matrix of different types. A 512 × 512 characteristic matrix is extracted from the center point. The characteristic distributions in Figure 6a,c are clearly different from those in Figure 6b,d. The characteristic distributions in Figure 6a,c are wider and the ∑E3 values are larger than those in Figure 6b,c. When the three-dimensional characteristic graphs are calculated using fractal theory, the lacunarity and fractal dimension values of various defects can be determined.
Two characteristic values, namely the lacunarity and the fractal dimension, are extracted through fractal theory for pattern recognition by means of the extension theory. In each type of defect, the first 20 samples are treated as the training samples, while the remaining 20 are as the test samples tested in the presence of noise interference.

5. Experiment and Results

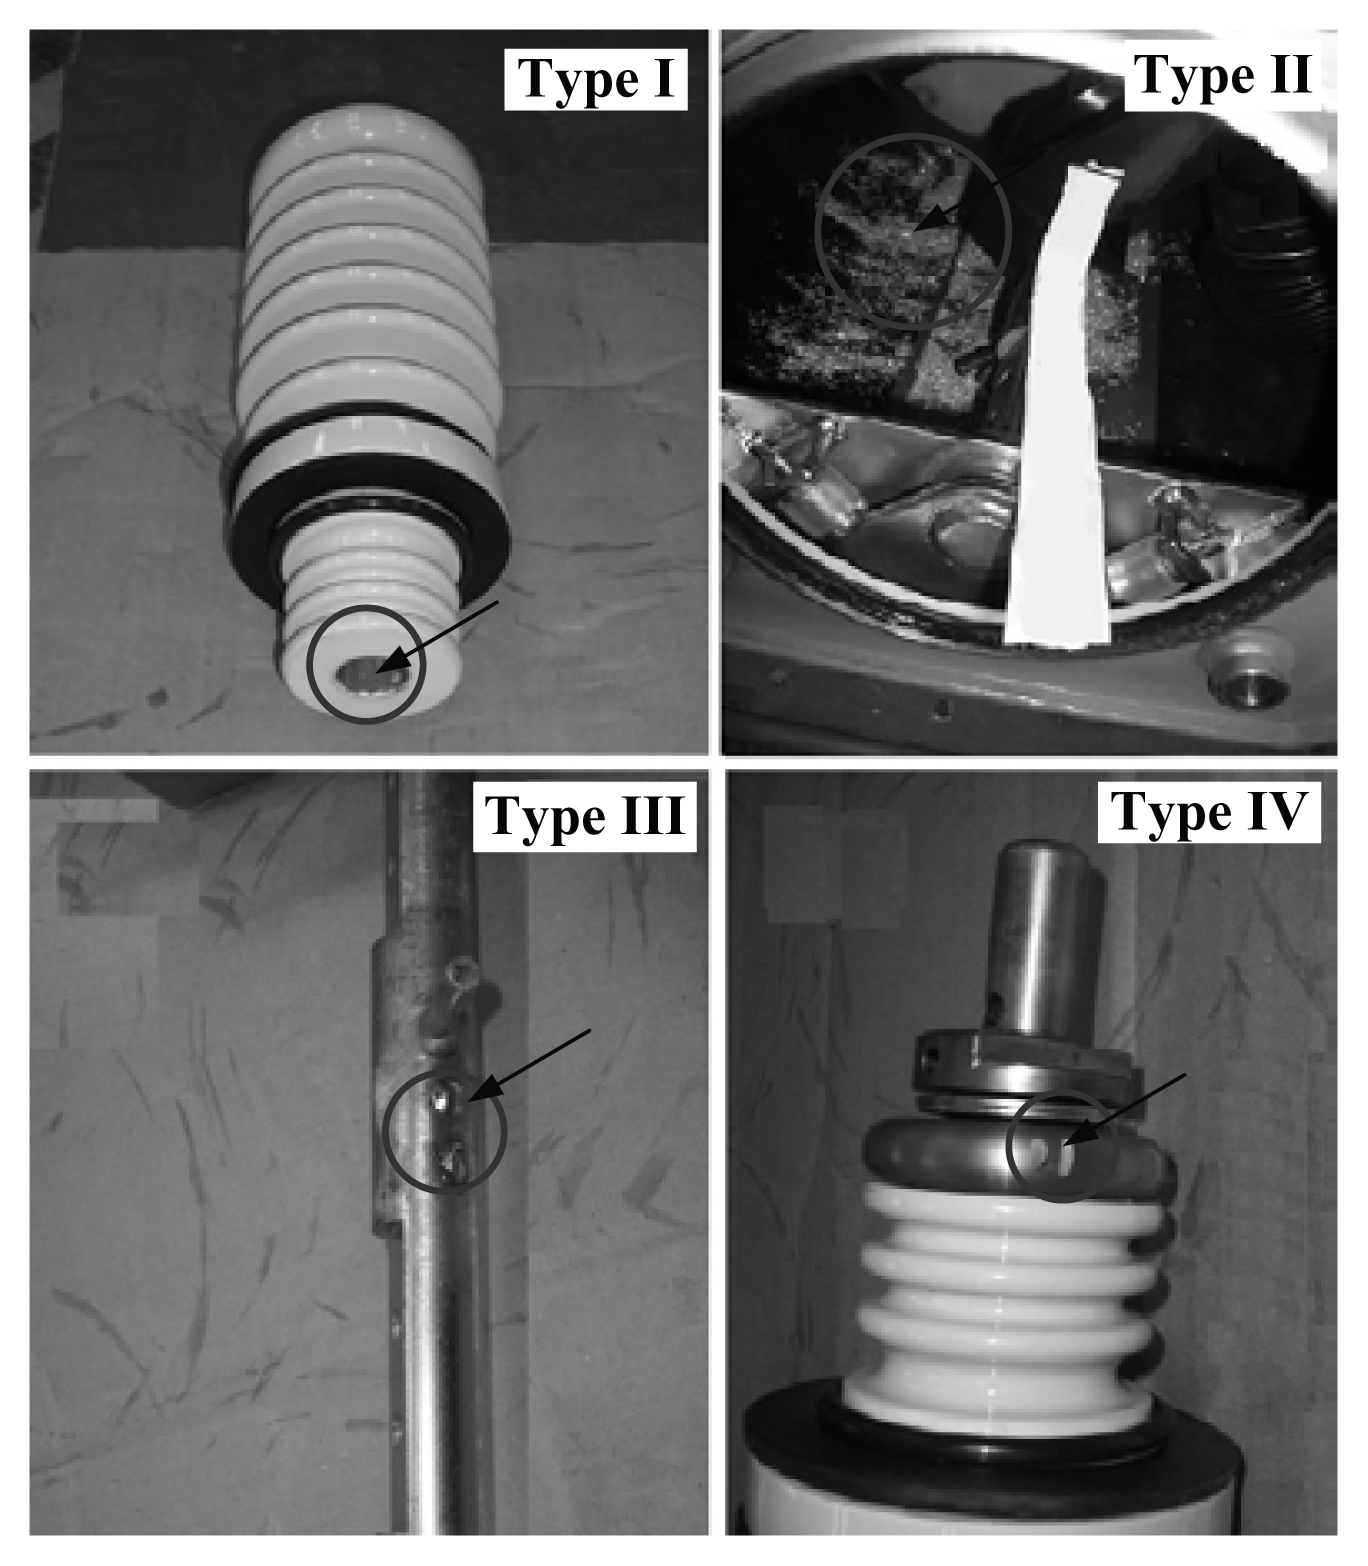
5.1. Experiment Models

In this work, experiments are conducted with four designedly made 15 kV pole-type GIS defect models, which are filled with SF6 gas. Figure 7 shows the possible defect models that might be a result of human carelessness during GIS construction. The four testing models are designed as follows:
  • Type I: Porcelain bushing internal conductor containing oil grease.
  • Type II: SF6 gas tank containing 5 mm × 3 mm × 1 mm metal particles.
  • Type III: A welding protrusion with size approximately 5 mm × 5 mm × 2 mm on the bearing.
  • Type IV: An abrasion defect with 2 mm depth and 10 mm length on a metal ring.

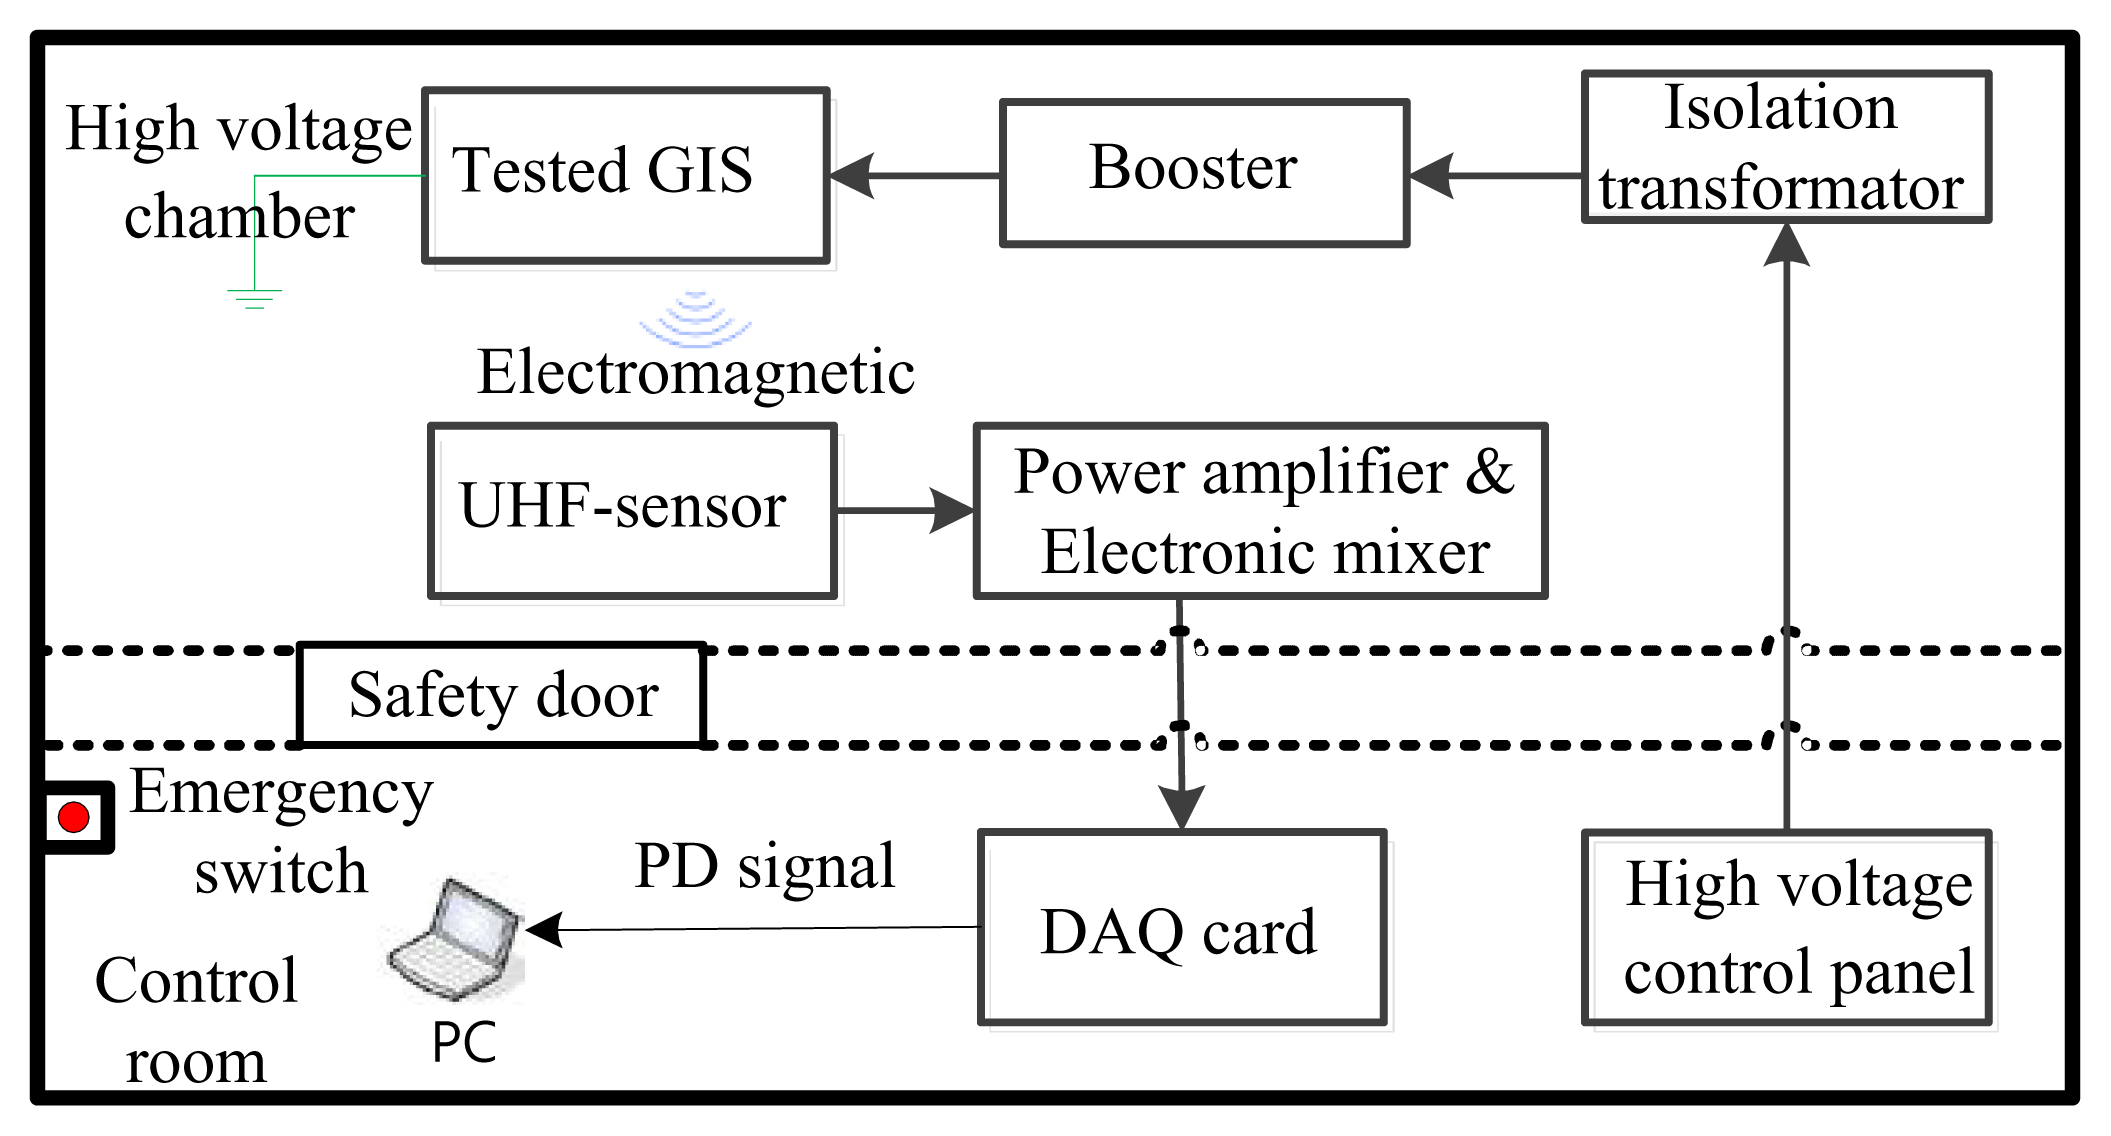
5.2. Measurement System

An experiment environment, as configured in Figure 8, is composed of a control room adjacent to a high voltage chamber. The voltage step-up procedure of the PD experiment is according to IEC 62271-203 for high-voltage switchgear and controlgear—part 203: gas-insulated metal-enclosed switchgear [33]. This standard indicates the test voltage for measuring PD intensity, the pre-stress voltage (Upre-stress) should be applied for the power-frequency withstand voltage test and maintained at that value for 1 min. Partial discharges occurring during this period shall be disregarded. The voltage is then reduced to test the voltage for PD measurement, phase-to-earth (Upd-test, ph-ea). In this work, the GIS rated voltage (Ur) is 15 kV, Upre-stress is applied at 45 kV for 1 min, and Upd-test, ph-ea = 1.2 Ur/3½ = 10.4 kV according to standard for PD measurement.
The electromagnetic signal emanating from the GIS is collected by a self-made detector, and then linked to a PC through a data acquisition card. The structure and the measured frequency response of the designed microstrip antenna are depicted in Figure 9. The detailed sizes are L1 = 135.56 mm, W1 = 149.81 mm, L2 = 104.62 mm, W2 = 3.53 mm, L3 = 47.26 mm, W3 = 34.8 mm and L4 = 37.26 mm. Due to financial constraints we could not acquire an ultrahigh speed signal capture card, therefore, in order to fit the Shannon theorem, we decreased the bandwidth of the microstrip antenna to 4 MHz using a delay circuit in the experimental system. A human-computer interface is developed in the LABVIEW environment for real time partial discharge signal processing. There are a total of 160 discharge signal samples for four types of defects, each with 40 samples, the first 20 of which are regarded as training samples, and the rest are as the testing ones. In this study, dynamic error trajectories E1, E2, E3 in a chaos synchronization system are plotted, based on which a characteristic matrix is constructed, and the lacunarity as well as the fractal dimension is extracted accordingly through the fractal theory. In the end, an investigation is made into the recognition accuracy rate and the tolerance to noise interference for a chaos synchronization system by use of this proposed approach.

5.3. Experiment Results and Discussion

Presented in Figures 10 and 11 are the bar graphs of the fractal dimension and lacunarity versus the defect type respectively, following the analysis on four types of defects in a chaos synchronization system by means of fractal theory. Figure 12 is the distributions of the fractal dimension and the lacunarity accordingly. In consistency with Figure 6, Type I is of the highest level of fractal dimension among all defect types, since a broader distribution of E1, E2 are demonstrated. Yet, the use of merely fractional dimension is found inadequate to recognize all the four defect types, according to which the lacunarity is adopted as another characteristic so as to improve the recognition rate. The differences in characteristics can be obviously observed in Figures 10 and 11. As exhibited in Figure 13 and as a validation of this work, distinct defects can be made distinguishable with ease through the application of this proposed approach to a Chen-Lee system, that is, another type of chaos synchronization systems.
The input signal to a PD measurement system is presumed to contain some noise inevitably. The noise sources may be attributed to the PD detector, environmentally electromagnetic interference, human errors, etc. Taking into account the noise interference, 160 sets of testing data are created by imposing the uniformly distributed random noise. In this work, the simulative white noise can be composed of a group of uniformly distributed random numbers with mean zero and then its normalized peak value is specified from ±10 to ±30 on the basis of mean discharge of the original measured PD signal.
As tabulated in Table 1, a 100% recognition rate is reached in the absence of noise interference, while an average recognition rate of 85% is achieved in the presence of 10% noise. Likewise, when applied to a Chen-Lee chaos synchronization system, a 100% recognition rate is seen again in a noise free case, and a 82.5% recognition rate in the presence of 10% noise. However, the HHT method in the 0% noise case has only an average 62.5% recognition rate in Table 3. The CS method has a higher recognition rate than the HHT method under noisy conditions. With the fractal dimension and the lacunarity as two characteristics, this proposal, employing a characteristic matrix, is successfully applied to defect pattern recognition for two types of chaos synchronization systems. A promoted recognition rate is thus expected in the presence of background noise in the event that a third characteristic is adopted in futuristic studies.

6. Conclusions

There is an inevitable insulation fault in a GIS as the consequence of improper installation or imperfect manufacturing process. Besides, since the insulation of a GIS is found critical, in particular, for the normal operation of a high capacity power plant, it is seen required to have a regular checkup on the GIS. Four deliberately defective GISes are employed as test objects, and experiments are conducted with a self-made rectangular microstrip antenna together with a broad band power amplifier as an electromagnetic signal detection device. For the purpose of computational load reduction, a pretreatment is conducted on the measured raw data, while the characteristics are well preserved. Subsequently, a characteristic matrix is built by use of the trajectories of dynamic errors E1, E2, E3 in the tracking process of a chaos synchronization system. The boundary values are determined by the defect type with a high dynamic error trajectory, while the lacunarity is by that with a low dynamic trajectory. As a consequence, the dimension of the characteristic matrix corresponding to each defect type is specified, and the properties of dynamic error trajectories are characterized therein. By use of fractal theory, an improved defect recognition rate is reached by means of extension theory with the fractal dimension as well as the lacunarity extracted out of a characteristic matrix. The proposed approach yielded better clustering results than the HHT method, proving that the method that was proposed herein can extract characteristic information about four defects. In conclusion, this proposal is proven as an effective diagnostic tool for defect types in chaos synchronization systems.

Acknowledgments

This research was supported by the National Science Council of Taiwan, under Grant NSC 100-2221-E-027-015 and NSC 99-2221-E-167-030-MY3.

Author Contributions

Hung-Cheng Chen and Her-Terng Yau developed the theoretical analysis of GIS signals by chaos synchronization. Po-Yan Chen built the database from experiment results and then to compare our new method with other method. All authors have read and approved the final manuscript.

Conflicts of Interest

The authors declare no conflicts of interest.

References

  1. Hampton, B.F.; Meats, R.J. Diagnostic Measurements at UHF in Gas Insulated Substations. IEE Proc. C Gener. Transm. Distrib 1988, 135, 137–144. [Google Scholar]
  2. Tang, J.; Xu, Z.; Zhang, X.; Sun, C. GIS partial discharge quantitative measurements using UHF microstrip antenna sensors. Proceedings of Annual Report Conference on Electrical Insulation and Dielectric Phenomena, CEIDP 2007, Vancouver, Canada, 14–17 October 2007; pp. 116–119.
  3. Sellars, A.G.; MacGregor, S.J.; Farish, O. Calibrating the UHF Technique of Partial Discharge Detection Using a PD Simulator. IEEE Trans. Dielectr. Electr. Insul 1995, 2, 46–53. [Google Scholar]
  4. Andre, H.; Khayam, U. Design of New Shape Printed Bowtie Antenna for Ultra High Frequency Partial Discharge Sensor in Gas-Insulated Substations. Proceedings of International Conference on Information Technology and Electrical Engineering, Yogyakarta, Indonesia, 7–8 October 2013; pp. 355–359.
  5. Chen, H.C.; Chen, B.Y.; Kou, C.C.; Chao, M.H. UHF Micro-Strip Antenna Design for Partial Discharge Detection of Gas Insulated Switch. Proceedings of 7th Asia-Pacific International Conference on Lightning, Chengdu, China, 1–4 November, 2011; pp. 590–594.
  6. Petzold, F.; Schlapp, H.; Gulski, E.; Seitz, P.P.; Quak, B. Advanced Solution for On-site Diagnosis of Distribution Power Cables. Proceedings of International Conference on Condition Monitoring and Diagnosis (CMD), Beijing, China, 21–24 April 2008; pp. 1145–1149.
  7. Wester, F.J.; Gulski, E.; Smit, J.J. Detection of Partial Discharges at Different AC Voltage Stresses in Power Cables. IEEE Electr. Insul. Mag 2007, 23, 28–43. [Google Scholar]
  8. Li, J.; Sum, C.; Grzybowski, S.; Taylora, C.D. Partial Discharge Image Recognition Using a New Group of Features. IEEE Trans. Dielectr. Electr. Insul 2006, 23, 1245–1253. [Google Scholar]
  9. Mazzetti, C.; Mascioli, F.F.; Baldini, F.; Panella, M.; Risica, R.; Bartnikas, R. Partial Discharge Pattern Recognition by Neuro-Fuzzy Networks in Heat-Shrinkable Joints and Terminations of XLPE Insulated Distribution Cables. IEEE Trans. Power Deliv 2006, 21, 1035–1044. [Google Scholar]
  10. Abdel-Galil, T.K.; Sharkawy, R.M.; Salama, M.M.A.; Bartnikas, R. Partial Discharge Pulse Pattern Recognition using an Inductive Inference Algorithm. IEEE Trans. Dielectr. Electr. Insul 2006, 12, 320–327. [Google Scholar]
  11. Qi, B.; Li, C.; Geng, B.; Hao, Z. Severity Diagnosis and Assessment of the Partial Discharge Provoked by High-Voltage Electrode Protrusion on GIS Insulator Surface. IEEE Trans. Power Deliv 2011, 26, 2363–2369. [Google Scholar]
  12. Mansour, D.E.; Kojima, H.; Hayakawa, N.; Endo, F.; Okubo, H. Partial Discharges and Associated Mechanisms for Micro Gap Delamination at Epoxy Spacer in GIS. IEEE Trans. Dielectr. Electr. Insul 2010, 17, 855–861. [Google Scholar]
  13. Gargari, S.M.; Wouters, P.A.A.F.; van der Wielen, P.C.J.M.; Steenis, E.F. Partial Discharge Parameters to Evaluate the Insulation Condition of On-line Located Defects in Medium Voltage Cable Networks. IEEE Trans. Dielectr. Electr. Insul 2011, 18, 868–877. [Google Scholar]
  14. Gulski, E. Digital Analysis of Partial Discharge. IEEE Trans. Dielectr. Electr. Insul 1995, 2, 822–837. [Google Scholar]
  15. Kreuger, F.H.; Gulski, E.; Krivda, A. Classification of Partial Discharge. IEEE Trans. Electr. Insul 1993, 28, 917–931. [Google Scholar]
  16. Kuo, C.L. Design of an Adaptive Fuzzy Sliding-Mode Controller for Chao Synchronization. Int. J. Nonlinear Sci. Numer. Simul 2007, 8, 631–636. [Google Scholar]
  17. Chen, G.; Dong, X. From Chaos to Order: Methodologies, Perspectives and Applications; World Scientific: Singapore, Singapore, 1998; pp. 12–27. [Google Scholar]
  18. Chen, J.H. Controlling Chaos Chaotification in the Chen-Lee System by Multiple Time Delays. Chaos Solitons Fractals 2008, 36, 843–852. [Google Scholar]
  19. Sheu, L.J.; Tam, L.M.; Chen, H.K.; Lao, S.K. Alternative Implementation of the Chaotic Chen-Lee System. Chaos Solitons Fractals 2009, 41, 1923–1929. [Google Scholar]
  20. Li, T.; Zhao, D.; Huang, Z.; Liu, C.W.; Su, S.J.; Zhang, Y.M. Blind Demodulation of Chaotic Direct Sequence Spread Spectrum Signals Based on Particle Filters. Entropy 2013, 15, 3877–3891. [Google Scholar]
  21. Su, R.Q.; Lai, Y.C.; Wang, X. Identifying Chaotic FitzHugh–Nagumo Neurons Using Compressive Sensing. Entropy 2014, 16, 3889–3902. [Google Scholar]
  22. Huang, C.H.; Lin, C.H.; Kuo, C.L. Chaos Synchronization-Based Detector for Power-Quality Disturbances Classification in a Power System. IEEE Trans. Power Deliv 2009, 26, 944–953. [Google Scholar]
  23. Krivda, A.; Gulski, E.; Satish, L.; Zaengl, W.S. The Use of Fractal Features for Recognition of 3D Discharge patterns. IEEE Trans. Dielectr. Electr. Insul 1995, 2, 889–898. [Google Scholar]
  24. Hao, N.; Dong, Z. Partial Discharge Signal Feature Extraction based on Hilbert-Huang Transform. Proceedings of 2011 International Conference on Transportation, Mechanical, and Electrical Engineering (TMEE), ChangChun, China, 16–18 December 2011; pp. 2398–2401.
  25. Liu, W.; Chen, G. A new chaotic system and its generation. Int. J. Bifurc. Chaos 2003, 13, 261–267. [Google Scholar]
  26. Chen, H.C.; Gu, F.C.; Lee, C.Y. A New Method Based on Extension Theory for Partial Discharge Pattern Recognition. WSEAS Trans. Syst 2008, 7, 1402–1411. [Google Scholar]
  27. Chen, H.C.; Gu, F.C.; Wang, M.H. A Novel Extension Neural Network Based Partial Discharge Pattern Recognition Method for High-Voltage Power Apparatus. Expert Syst. Appl 2012, 39, 3423–3431. [Google Scholar]
  28. Prieto, M.D.; Espinosa, A.G.; Ruiz, J.R.; Urresty, J.C.; Ortega, J.A. Feature Extraction of Demagnetization Faults in Permanent-Magnet Synchronous Motors Based on Box-Counting Fractal Dimension. IEEE Trans. Ind. Electron 2011, 58, 1594–1605. [Google Scholar]
  29. Du, B.X.; Ma, Z.L.; Cheng, X.X.; Liu, Y. Hydrophobicity Evaluation of Silicone Rubber Insulator Using PD-Induced Electromagnetic Wave. IEEE Trans. Dielectr. Electr. Insul 2012, 19, 1060–1067. [Google Scholar]
  30. Purkait, P.; Chakravorti, S. Impulse Fault Classification in Transformers by Fractal Analysis. IEEE Trans. Dielectr. Electr. Insul 2003, 10, 109–116. [Google Scholar]
  31. Wang, Q.; Wang, H.; Hao, K.; Dai, P. Two-Phase Flow Regime Identification Based on Cross-Entropy and Information Extension Methods for Computerized Tomography. IEEE Trans. Instrum. Meas 2011, 60, 488–495. [Google Scholar]
  32. Wang, M.H.; Ho, C.Y. Application of Extension Theory to PD Pattern Recognition in High-Voltage Current Transformers. IEEE Trans. Power Deliv 2005, 20, 1939–1946. [Google Scholar]
  33. International Electrotechnical Commission, High-Voltage Switchgear and Controlgear—Part 203: Gas-Insulated Metal Enclosed Switchgear for Rated Voltages above 52 kV; IEC 62271-203; IEC: Geneva, Switzerland, 2003.
Figure 1. Illustration of (a) a normal and a defect PD signal, (b) dynamic error E1, E2, E3, and (c) a phase plot of a chaos synchronization system.
Entropy 16 04566f1
Figure 2. Typically single partial discharge signal for defect (a) Type I, (b) Type II, (c) Type III and (d) Type IV.
Entropy 16 04566f2
Figure 3. Error trajectories E1, E2 for defect (a) Type I, (b) Type II, (c) Type III, and (d) Type IV.
Entropy 16 04566f3
Figure 4. Distributions of errors E1, E2 for defect (a) Type I, (b) Type II, (c) Type III, and (d) Type IV.
Entropy 16 04566f4aEntropy 16 04566f4b
Figure 5. Procedure of constructing a characteristic matrix.
Entropy 16 04566f5
Figure 6. Three dimensional characteristic for defect (a) Type I. (b) Type II. (c) Type III. (d) Type IV.
Entropy 16 04566f6
Figure 7. Four designedly made experiment defect models.
Entropy 16 04566f7
Figure 8. A laboratory configuration for PSD experiments.
Entropy 16 04566f8
Figure 9. Designed microstrip antenna structure.
Entropy 16 04566f9
Figure 10. Bar graph of the fractal dimension versus the defect type.
Entropy 16 04566f10
Figure 11. Bar graph of the lacunarity versus the defect type.
Entropy 16 04566f11
Figure 12. Characteristic distributions for various defect types in a Lorenz chaos synchronization system.
Entropy 16 04566f12
Figure 13. Characteristic distributions for various defect types in a Chen-Lee chaos synchronization system.
Entropy 16 04566f13
Table 1. Recognition accuracy rates with FD-Λ as characteristics in a Lorenz chaos synchronization system (%).
Noise Amount0%±10%±20%±30%

Defect Types
Type I1001008070
Type II100807040
Type III100706030
Type IV100907560
Table 2. Recognition accuracy rates with FD-Λ as characteristics in a Chen-Lee chaos synchronization system (%).
Noise Amount0%±10%±20%±30%

Defect Types
Type I100805035
Type II100756055
Type III100907530
Type IV100857065
Table 3. Recognition accuracy rates with FD-Λ as characteristics by an HTT approach (%).
Noise Amount0%±10%±20%±30%

Defect Types
Type I80707050
Type II30302010
Type III90553010
Type IV5025100

