Article

Multiscale Entropy Analysis of Heart Rate Variability for Assessing the Severity of Sleep Disordered Breathing

1
Department of Electrical Engineering, National Dong Hwa University, Hualien, 97401, Taiwan
2
Division of Pulmonary and Critical Care Medicine, Department of Internal Medicine, Kaohsiung Chang Gung Memorial Hospital and Chang Gung University College of Medicine, Kaohsiung, 83301, Taiwan
3
Sleep Center, Kaohsiung Chang Gung Memorial Hospital and Chang Gung University College of Medicine, Kaohsiung, 83301, Taiwan
4
Department of Emergency Medicine, E-Da hospital, I-Shou University College of Medicine, Kaohsiung, 82445, Taiwan
*
Author to whom correspondence should be addressed.
These authors contributed equally to this work.
Submission received: 29 October 2014 / Accepted: 7 January 2015 / Published: 12 January 2015
(This article belongs to the Special Issue Entropy and Cardiac Physics)

Abstract

:
Obstructive sleep apnea (OSA) is an independent cardiovascular risk factor to which autonomic nervous dysfunction has been reported to be an important contributor. Ninety subjects recruited from the sleep center of a single medical center were divided into four groups: normal snoring subjects without OSA (apnea hypopnea index, AHI < 5, n = 11), mild OSA (5 ≤ AHI < 15, n = 10), moderate OSA (15 ≤ AHI < 30, n = 24), and severe OSA (AHI ≥ 30, n = 45). Demographic (i.e., age, gender), anthropometric (i.e., body mass index, neck circumference), and polysomnographic (PSG) data were recorded and compared among the different groups. For each subject, R-R intervals (RRI) from 10 segments of 10-minute electrocardiogram recordings during non-rapid eye movement sleep at stage N2 were acquired and analyzed for heart rate variability (HRV) and sample entropy using multiscale entropy index (MEI) that was divided into small scale (MEISS, scale 1–5) and large scale (MEILS, scale 6–10). Our results not only demonstrated that MEISS could successfully distinguish normal snoring subjects and those with mild OSA from those with moderate and severe disease, but also revealed good correlation between MEISS and AHI with Spearman correlation analysis (r = −0.684, p < 0.001). Therefore, using the two parameters of EEG and ECG, MEISS may serve as a simple preliminary screening tool for assessing the severity of OSA before proceeding to PSG analysis.

1. Introduction

Obstructive sleep apnea (OSA), which is a disease condition characterized by a reduction or cessation of airflow through the upper respiratory tract due to soft tissue obstruction during sleep [1], has been found to be an independent cardiovascular risk factor [2] that predisposes to the development of hypertension, congestive heart failure, myocardial infarction, coronary artery disease, stroke and neurocognitive deficits [26]. One of the important contributors has been reported to be autonomic nervous dysfunction arising from chronic OSA-induced sympathetic stimulation [7].
Heart rate variability (HRV) [7] and sample entropy for nonlinear measurement of HRV [8] have been found to correlate with physiological and pathological findings and, therefore, are thought to reflect sympathetic activity or respiratory physiological control mechanisms. Using R-R intervals on electrocardiogram (ECG) during sleep, Al-Angari et al. applied sample entropy to the analysis of HRV complexity in subjects with OSA and in those without [9]. The results of that study demonstrated not only a reduced parasympathetic activity and decreased sample entropy, but also an imbalance between sympathetic and parasympathetic modulation in subjects with OSA compared with those without [9]. Although that study revealed the associations of OSA with autonomic nervous activities and complexity of physiological signals, the impact of the severity of the disease on these physiological parameters has not been investigated.
Consistently, other previous studies have not only shown that the physiological signals of human body are affected by multiple temporal and spatial scales and exhibit properties of complexity fluctuation, but also demonstrated that the fluctuation of the complexity of physiological signals can be analyzed to assess the health status of an individual [10,11]. Therefore, the aim of the present study is to investigate the relationship between OSA and the complexity of HRV to identify the predictive value of the latter in assessing the severity of the former. Accordingly, study subjects were divided into four groups: Normal snoring, mild OSA, moderate OSA, and severe OSA. Data on RRI were acquired from ECG for 10 min from each subject during the stage of non-rapid eye movement (NREM) sleep. Autonomic nervous function of subjects with different severity of OSA was evaluated through HRV analysis using multiscale entropy method to take into account the fluctuation in complexity of the acquired signals.

2. Methods

2.1. Study Population

Between December 2010 and February 2012, 113 subjects were recruited from the Kaohsiung Chang Gung Memorial Hospital Sleep Center. Of the 113 subjects, 102 were patients with established diagnosis of OSA, whereas 11 were subjects with snoring, but without OSA. Twenty-three subjects in the OSA group with previous history of continuous positive airway pressure (CPAP) therapy, surgical treatment for OSA, serious central sleep apnea, extremely poor sleep quality, diabetes mellitus (type 1 and type 2), hypertension or other cardiovascular disease, psychiatric disorder, alcohol dependency and/or other substance abuse, chronic obstructive pulmonary disease, chemotherapy or immunosuppressive therapy within 3 months, or known malignancy were excluded because of potential influence of these diseases on HRV [12,13], resulting in 79 subjects with OSA who were eligible for the present study. Demographic (i.e., age, gender), anthropometric (i.e., body mass index (BMI), neck circumference), and polysomnographic (PSG) data were recorded and analyzed for all recruited subjects. This study was reviewed and approved by the Institutional Review Board of Chang Gung Memorial Hospital. Each patient signed an informed consent.

2.2. Data Collection from Polysomnography (PSG), Definitions, and Patient Grouping

Polysomnography (PSG) is a multi-channel digital recording system (Sandman SD32+™ Digital Amplifier, Embla, CO, USA) comprising an electroencephalogram (EEG), electrocardiogram (ECG), electrooculogram (EOG), electromyogram (EMG), oxygen saturation sensor, and respiratory airflow detector for recording different physiological signals during the sleeping period. Apnea is defined as cessation of airflow for at least 10 s, while hypopnea is defined as a reduction of airflow of at least 50% with concomitant decrease in arterial oxygenation over 3% or/and the occurrence of arousal [14]. Apnea hypopnea index (AHI), which is the number of episodes of apnea and hypopnea per hour, was used to divided the recruited subjects with OSA into three groups according to disease severity: Mild OSA (5 ≤ AHI < 15), moderate OSA (15 ≤ AHI < 30) and severe OSA (AHI ≥ 30) [14]. In the present study, another group of subjects without OSA (AHI < 5) was included for comparison.
Data acquisition for the current study started at 11 p.m. and lasted until 6 a.m.. All tested subjects were asked to refrain from consumption of sedatives and alcohol- or/and caffeine-containing beverages at least 48 h before examination. Each participant was required to complete a questionnaire including basic demographic and anthropometric information, medical history, and an informed consent for the present study after detailed explanation by the principal investigator. PSG was performed by an experienced technician at the Sleep Center to harvest data on RRI and relevant physiological information. For each subject, ECG signals from 10 segments of 10-minute uninterrupted sleep at stage N2 were analyzed and the mean value was taken for subsequent computation. Sleep efficiency is defined as the number of minutes of sleep divided by the number of minutes in bed. Moreover, to compare the severity of OSA among different groups, the parameter of lowest arterial oxygen saturation (LSaO2), which objectively reflects the severity of OSA [15], was adopted in the current study to abolish the potential individual differences in the level of physiological tolerance and adaptation to the degree of hypoxia before arousal that may contribute to sleep fragmentation. Besides, the percentage of sleep that each subject spent at each stage was recorded and compared.

2.3. Heart Rate Variability and Multiscale Entropy Index (MEI) Analysis

Elsenbruch et al. have previously studied the sympathetic tone during waking and sleep in healthy human subjects and demonstrated that sympathetic tone during the rapid eye movement (REM) stage was higher, whereas that during the non-rapid eye movement (NREM) stage was lower compared with that in the awake state [16]. In the present study, 10-minute segments of ECG recordings were acquired during NREM sleep for analyzing the time elapsed between two R waves (i.e., R-R interval [RRI]) which then used fast-Fourier transform (FFT) to obtain the distribution of different frequency powers in the frequency domain. Total power was defined as the frequency band of 0–0.4 Hz. Very low frequency power (VLF), low frequency power (LF), and high frequency power (HF) were defined as frequencies of <0.04Hz, 0.04–0.15 Hz, and 0.15–0.4 Hz, respectively. Normalized LF power (nLF) was calculated by LF/(Total Power − VLF), while normalized HF (nHF) was computed by HF/(Total Power − VLF) [7,17]. Previous studies have shown that nLF is an indicator of sympathetic activity, while nHF represents parasympathetic and vagal activity [1823]. The ratio of LF/HF, therefore, represents the activity of the sympathetic relative to that of the parasympathetic system and reflects the status of overall autonomic control [24]. Hence, nLF, nHF, and LF/HF were used for comparison of autonomic activities among the four groups of subjects in the current study.
Multiscale Entropy (MSE), which was first proposed by Costa et al. [10], is a method for analyzing the complexity of nonlinear and non-stationary signals in finite length time series. It consists of two main procedures, namely coarse-graining and calculation of sample entropy for each coarse-grained time series. First, the computation of sample entropy (SE) comprises:
  • Define the data series x(n) with length N and the two parameters of m and r (where m = Embedded dimension of the vector; r = tolerance)
  • Define N – m + 1 vectors, each of size m, composed as follows:
    u m ( i ) = { x i , x i + 1 , , x i + m 1 } , 1 i N m + 1
  • Define d[um(i), um(j)] as the maximum value: d[um(i), um(j)] = max{|xi + k − xj + k|: 0 ≤ k ≤ m − 1}(i ≠ j). Calculate the number of d[um(i), um(j)] within distance r and calculate the ratio of the number to the total N – m for each value of i ≤ N − m + 1 and an average to all points is defined as:
    c m ( r ) = 1 N m + 1 i = 1 N m + 1 n i ( m ) N m + 1
  • Increase the embedded dimension to m + 1, gives:
    c m + 1 ( r ) = 1 N m i = 1 N m n i ( m + 1 ) N m
  • Therefore, sample entropy (SE) is defined as:
    S E ( m , r , N ) = ln c m ( r ) c m + 1 ( r )
Multiple coarse-grained time series are constructed by averaging the data points within non-overlapping windows of increasing length, τ (i.e., the scale factor), as follows:
y j ( τ ) = 1 τ i = ( j 1 ) τ + 1 j τ x i , 1 j N τ
Thus, the length of each coarse-grained time series is N/τ. Sample entropy is then computed for each new coarse-grained time series { y j ( τ ) }, and plotted as a function of the scale factor [8]. On analyzing ECG signals using the MSE algorithm, Costa et al. reported the association of sample entropy of small time scale (τ = 1–5) with parasympathetic nervous activity and respiratory modulation [11]. Accordingly, the present study analyzed ECG signals by dividing the multiscale entropy index (MEI) into small scale (MEISS, scale 1–5) (6) and large scale (MEILS, scale 6–10) (7) using the MSE approach for comparison [11,2528]:
MEI SS = τ = 1 5 MSE τ
MEI LS = τ = 6 10 MSE τ

2.4. Statistical Analysis

The SPSS software (Version 14.0, SPSS Inc., Chicago, IL, USA) was adopted for all statistical analyses. The data were presented as median, interquartile range (IQR). The continuous and categorical variables between the groups were compared using a Mann-Whitney U test. The correlation between the MEISS and the AHI was expressed using Spearman correlation. A p < 0.05 was considered statistically significant.

3. Results

3.1. Study Subjects

There was no significant difference in age, sleep efficiency, RRI, and heart rate among the four groups (Table 1). The body-mass index of subjects with severe OSA was significantly higher than that of normal snoring subjects and those with mild OSA. Besides, the neck circumference and breathing frequency in individuals with severe OSA was larger than those in the other three groups. Moreover, LSaO2 decreased with an increase in severity of OSA. On the other hand, analysis of the breathing frequency among the four groups demonstrated significant reduction in patients with severe OSA compared with that of subjects with normal snoring, mild, and moderate OSA, although there was no notable difference among the latter three groups. This may be due to the remarkable increase in frequency of apnea and hypopnea in patients with severe OSA compared with the other three groups. In terms of sleep staging, although there was no difference in the percentage of sleep at stages N1 and N2 in normal snoring subjects as well as those with mild and moderate OSA, substantial increase in percentage of sleep at stage N1 was noted in patients with severe OSA with concomitant reduction of sleep at stage N2 which may reflect the occurrence of frequent awakenings [29].

3.2. Frequency Domain Analysis of Heart Rate Variability

HRV as reflected in RRI was analyzed by using different frequency powers in the frequency domain. The results showed that nLF and LF/HF were significantly increased in subjects with severe OSA compared to the normal snoring individuals and those with mild and moderate OSA. A trend of elevation in nLF and LF/HF with an increase in severity of OSA could also be discerned. On the other hand, nHF in the severe OSA group was significantly lower than that in the other three groups. Again, nHF tended to decrease with an aggravation of the disease (Table 2).

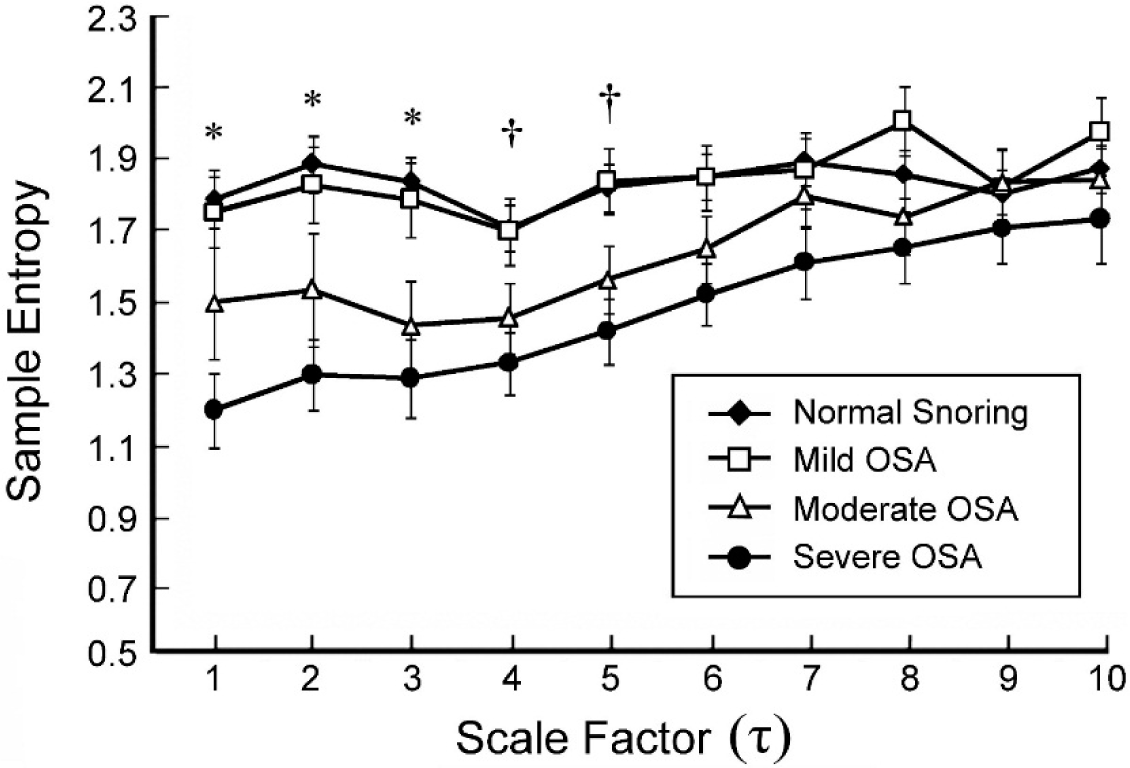
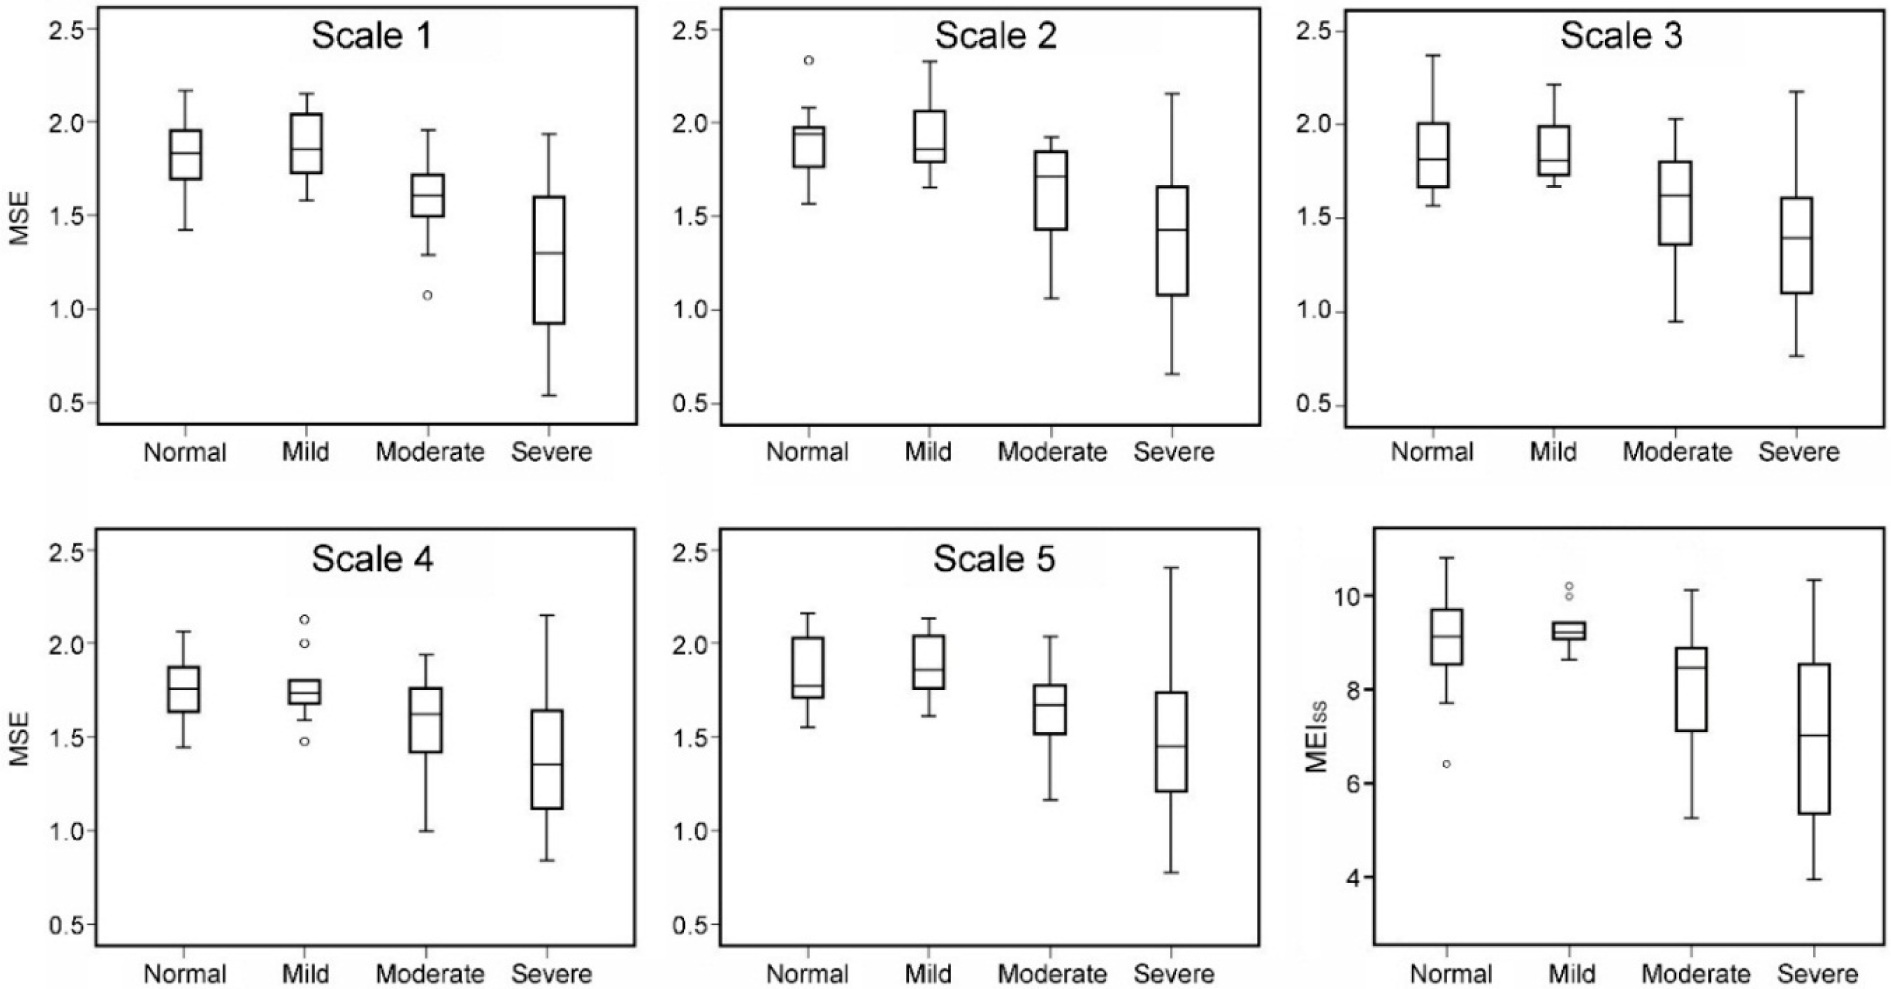
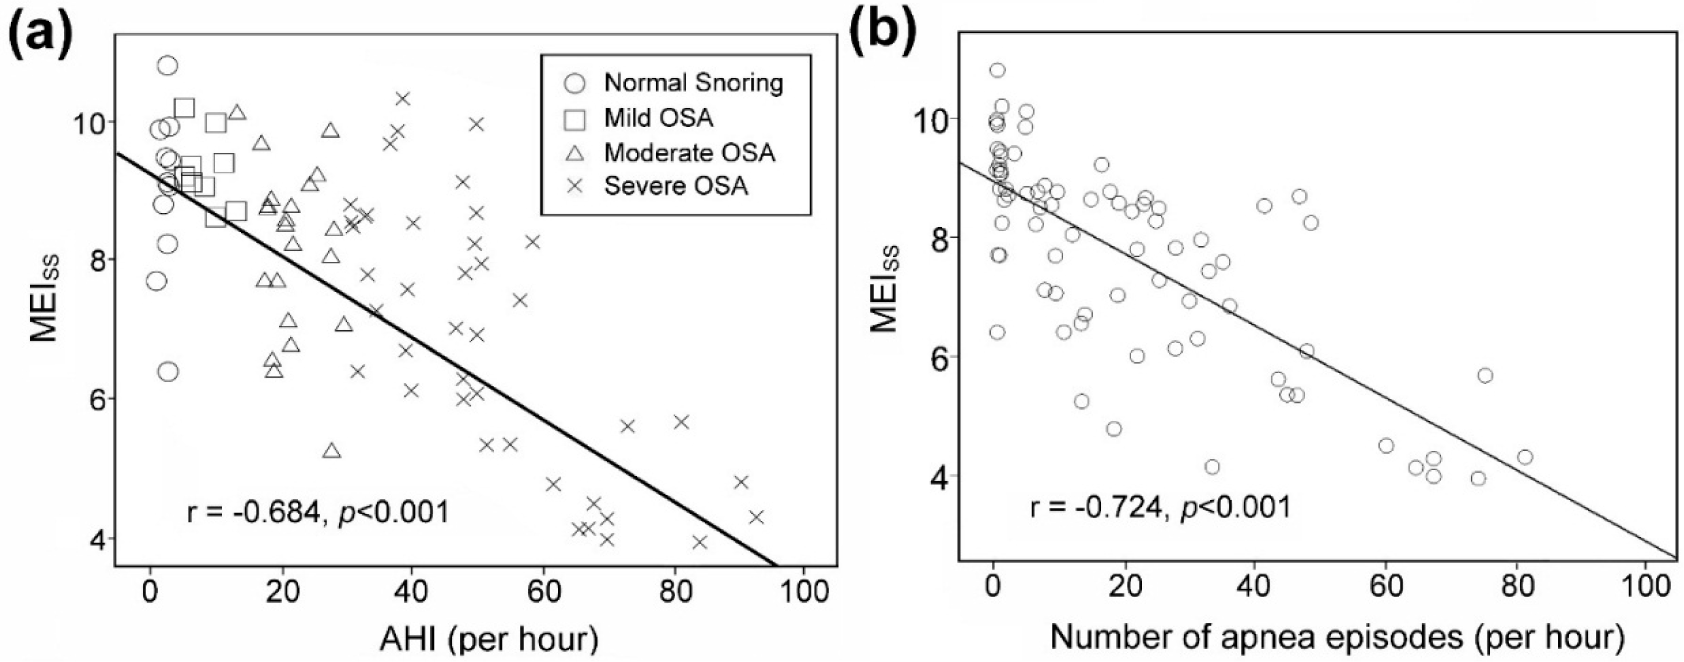
3.3. Multiscale Entropy Index for Groups

The results of MSE analysis of RRI in the study subjects is shown in Figure 1 that demonstrated a reduction in sample entropy with an increase in severity of OSA when plotted against the scale factor (τ) (Figure 1). Sample entropy of normal snoring subjects and those with mild OSA was higher than that of those with moderate and severe OSA (p < 0.05) for scale 1 to 3, while sample entropy of the normal snoring subjects and those with mild OSA was still significantly higher than that of patients with severe OSA for scale 4 to 5. On the other hand, no significant difference was noted in sample entropy among the four groups for large scale (i.e., τ = 6–10).
The current study analyzed ECG signals by dividing the multiscale entropy index (MEI) into small scale (MEISS, scale 1–5) (2) and large scale (MEILS, scale 6–10) (3) using the MSE approach for comparison. The results demonstrated that MEISS of normal snoring subjects and those with mild OSA was significantly higher than that of individuals with moderate and severe OSA (p < 0.05), whereas no remarkable difference was noted in MEILS among the four groups (Table 3). Moreover, boxplots of MSE of the four groups of study subjects from scale 1 to scale 5 and MEISS were analyzed (Figure 2). The results showed that subjects with normal snoring and mild OSA could be distinguished from those with moderate and severe OSA from scale 1 to 3, while the discrimination was less prominent for scale 4 and 5. On the other hand, the MEISS of individuals with normal snoring and mild OSA could be distinguished from those with moderate and severe disease.
Presentation of all data as median (interquartile range). MEISS: Multiscale entropy index with small scale; MEILS: Multiscale entropy index with large scale; * p < 0.05 vs. Moderate and Severe OSA.
To investigate the overall correlation between MEISS and AHI, Spearman correlation analysis was performed that showed highly significant negative association (r = −0.684, p < 0.001; Figure 3a). Without taking AHI into consideration, remarkably significant negative association was also noted between MEISS and the number of apnea episodes per hour in the testing subjects (r = −0.724, p < 0.001; Figure 3b).

4. Discussion

Previous studies on RRI in patients with sleep disordered breathing have reported significant differences in HRV parameters and sample entropy between subjects with OSA and those without [9,30]. Contradictory results were noted in one of the studies that demonstrated significant difference in sample entropy between patients with mild and severe OSA, but failed to show significant differences between patients with severe OSA and subjects without OSA [30]. One explanation for the paradoxical finding may be the use of ECG signals during REM and NREM sleep for comparison without taking into account the different stages of sleep [30] that has been reported to affect autonomic nervous activities [16,31,32]. For a more accurate assessment, the present study decomposed sleep into different stages (i.e., N1-N3) and chose N2 for analysis because of sporadic distribution of stage N1 and usually short duration of stage N3. Ten-minute segments of ECG signals were adopted after taking into consideration the frequent awakenings of subjects with OSA. The elevation in nLF and reduction in nHF with subsequent increase in the LF/HF ratio (Table 2) in patients with severe OSA compared with the other three groups signifies an enhancement of sympathetic activity, a suppression of parasympathetic activity, and an autonomic imbalance with progression of OSA [3335] (Table 2). The findings are consistent with those of previous studies suggesting a positive association between OSA and sympathetic nervous activity [9,30,36,37]. On the other hand, the increase in percentage of sleep at N1 stage in patients with severe OSA may reflect frequent awakenings and poor sleep quality [29]. Indeed, the resulting sleep fragmentation and autonomic dysfunction have been reported to contribute to increased oxidative stress, elevated blood pressure, and sympathetic activation in patients with OSA [34,38,39].
Accordingly, a previous study has proposed the use of small time scale (i.e., τ = 1–5) sample entropy as a respiratory and autonomic functional index [11]. Although another study has shown a significantly reduced sample entropy in subjects with OSA compared with those without [30], that study did not analyze the complexity of physiological signals on different time scales. To fill this gap, the present study utilized the MSE method for analyzing signal complexity taking into account the different time scales [10]. Our results demonstrated a suppression of MEISS in patients with moderate and severe OSA compared to that in the normal snoring subjects and in those with mild disease, suggesting a reduction in physiological complexity with an increase in severity of OSA (Table 3, Figure 3). In addition to reinforcing the previous finding of an association of sample entropy on small time scale with parasympathetic activity and respiratory modulation [11,40], our results further validate MEISS as a tool for assessing the impact of OSA on respiratory and autonomic functions.
The present study has its limitations. First, due to different disease severity, there was a discrepancy in the number of subjects in each group for comparison. Second, some patients with severe OSA were excluded from this study because of the poor sleep quality that precluded the acquisition of continuous 10-minute ECG signals at a single sleep stage for satisfactory HRV and MSE analysis. Third, HRV at other stages of sleep was not studied because of difficulty in adequate data harvesting from subjects with OSA as mentioned above. Fourth, although we demonstrated a significant negative correlation between MEISS and AHI (Figure 3a) as well as that between MEISS and the number of apnea episodes per hour (Figure 3b), we could not establish a clinically significant cuff-off values between MEISS and different degrees of OSA severity due to the limited sample size of the present study. Finally, although previous studies on the relationship between breathing disorders and HRV also did not take into consideration the frequency band of LF power [3234], a reduction of breathing frequency might confound the findings of elevated LF power when frequency ranges are fixed.

5. Conclusions

MSE analysis of RRI from segments of 10-minute continuous ECG recording during NREM sleep at stage N2 not only demonstrated that MEISS could successfully distinguish normal snoring subjects and those with mild OSA from those with moderate and severe disease (Figure 3), but also revealed good correlation between MEISS and AHI. Therefore, utilizing the two parameters of EEG and ECG, MEISS may serve as a simple preliminary screening tool for evaluation of the severity of OSA before proceeding to PSG analysis.

Acknowledgments

This study was financially supported by a research grant from the National Science Council, Taiwan, R.O.C. (Grant No.: 102-2221-E-259-004, Grant No NSC 102-2221-E-008-008, NSC 102-2911-I-008-001), joint foundation of CGH and NCU (Grant No CNJRF-101CGH-NCU-A4, and VGHUST103-G1-3-3).

Author Contributions

Wen-Yao Pan, Meng-Chih Lin and Cheuk-Kwan Sun designed the study. Hsien-Tsai Wu, Wen-Yao Pan and Mao-Chang Su were responsible for data collection and analysis. Wen-Yao Pan, Mao-Chang Su, Hsien-Tsai Wu and I-Ting Tsai reviewed relevant literature and interpreted the acquired data. Wen-Yao Pan, Meng-Chih Lin and Cheuk-Kwan Sun drafted the manuscript. All authors have read and approved the final manuscript.

Conflicts of Interest

The authors declare no conflict of interest.

References

  1. Fogel, R.B.; Malhotra, A.; White, D.P. Sleep 2: Pathophysiology of obstructive sleep apnoea/hypopnoea syndrome. Thorax 2004, 59, 159–163. [Google Scholar]
  2. Lopez-Jimenez, F.; Sert Kuniyoshi, F.H.; Gami, A.; Somers, V.K. Obstructive sleep apnea: Implications for cardiac and vascular disease. Chest 2008, 133, 793–804. [Google Scholar]
  3. Shepard, J.W., Jr. Hypertension, cardiac arrhythmias, myocardial infarction, and stroke in relation to obstructive sleep apnea. Clin. Chest Med. 1992, 13, 437–458. [Google Scholar]
  4. Society, A.T. Standards and indications for cardiopulmonary sleep studies in children. American Thoracic Society. Am. J. Respir. Crit. Care Med. 1996, 153, 866–878. [Google Scholar]
  5. Wolk, R.; Kara, T.; Somers, V.K. Sleep-disordered breathing and cardiovascular disease. Circulation 2003, 108, 9–12. [Google Scholar]
  6. Gottlieb, D.J.; Yenokyan, G.; Newman, A.B.; O’Connor, G.T.; Punjabi, N.M.; Quan, S.F.; Redline, S.; Resnick, H.E.; Tong, E.K.; Diener-West, M.; et al. Prospective study of obstructive sleep apnea and incident coronary heart disease and heart failure: The sleep heart health study. Circulation 2010, 122, 352–360. [Google Scholar]
  7. Heart rate variability: Standards of measurement, physiological interpretation and clinical use. Task Force of the European Society of Cardiology and the North American Society of Pacing and Electrophysiology. Circulation 1996, 93, 1043–1065.
  8. Richman, J.S.; Moorman, J.R. Physiological time-series analysis using approximate entropy and sample entropy. Am. J. Physiol. Heart Circ. Physiol. 2000, 278, H2039–H2049. [Google Scholar]
  9. Al-Angari, H.M.; Sahakian, A.V. Use of sample entropy approach to study heart rate variability in obstructive sleep apnea syndrome. IEEE Trans. Biomed. Eng. 2007, 54, 1900–1904. [Google Scholar]
  10. Costa, M.; Goldberger, A.L.; Peng, C.K. Multiscale entropy analysis of complex physiologic time series. Phys. Rev. Lett. 2002, 89. [Google Scholar] [CrossRef]
  11. Costa, M.; Goldberger, A.L.; Peng, C.K. Multiscale entropy analysis of biological signals. Phys. Rev. E 2005, 71. [Google Scholar] [CrossRef]
  12. Lishner, M.; Akselrod, S.; Avi, V.M.; Oz, O.; Divon, M.; Ravid, M. Spectral analysis of heart rate fluctuations. A non-invasive, sensitive method for the early diagnosis of autonomic neuropathy in diabetes mellitus. J. Auton. Nerv. Syst. 1987, 19, 119–125. [Google Scholar]
  13. Thayer, J.F.; Yamamoto, S.S.; Brosschot, J.F. The relationship of autonomic imbalance, heart rate variability and cardiovascular disease risk factors. Int. J. Cardiol. 2010, 141, 122–131. [Google Scholar]
  14. Quan, S.F.; Gillin, J.C.; Littner, M.R.; Shepard, J.W. Sleep-related breathing disorders in adults: Recommendations for syndrome definition and measurements techniques in clinical research. editorials. Sleep 1999, 22, 667–689. [Google Scholar]
  15. Lin, Q.-C.; Chen, L.-D.; Chen, G.-P.; Zhao, J.-M.; Chen, X.; Huang, J.-F.; Wu, L.-H. Association between nocturnal hypoxia and liver injury in the setting of nonalcoholic fatty liver disease. Sleep Breath 2014. [Google Scholar] [CrossRef]
  16. Elsenbruch, S.; Harnish, M.J.; Orr, W.C. Heart rate variability during waking and sleep in healthy males and females. Sleep 1999, 22, 1067–1071. [Google Scholar]
  17. Wu, H.T.; Hsu, P.C.; Sun, C.K.; Wang, H.J.; Liu, C.C.; Chen, H.R.; Liu, A.B.; Tang, C.J.; Lo, M.T. Assessment of autonomic dysfunction in patients with type 2 diabetes using reactive hyperemia. J. Theor. Biol. 2013, 330, 9–17. [Google Scholar]
  18. Kamath, M.V.; Fallen, E.L. Power spectral analysis of heart rate variability: A noninvasive signature of cardiac autonomic function. Crit. Rev. Biomed. Eng. 1993, 21, 245–311. [Google Scholar]
  19. Guzzetti, S.; Dassi, S.; Balsama, M.; Ponti, G.B.; Pagani, M.; Malliani, A. Altered dynamics of the circadian relationship between systemic arterial pressure and cardiac sympathetic drive early on in mild hypertension. Clin. Sci. (Lond.) 1994, 86, 209–215. [Google Scholar]
  20. Saul, J.P.; Arai, Y.; Berger, R.D.; Lilly, L.S.; Colucci, W.S.; Cohen, R.J. Assessment of autonomic regulation in chronic congestive heart failure by heart rate spectral analysis. Am. J. Cardiol. 1988, 61, 1292–1299. [Google Scholar]
  21. Malliani, A.; Lombardi, F.; Pagani, M. Power spectrum analysis of heart rate variability: A tool to explore neural regulatory mechanisms. Br. Heart J. 1994, 71, 1–2. [Google Scholar]
  22. Koenig, J.; Jarczok, M.N.; Ellis, R.J.; Warth, M.; Hillecke, T.K.; Thayer, J.F. Lowered Parasympathetic Activity in Apparently Healthy Subjects with Self-Reported Symptoms of Pain: Preliminary Results from a Pilot Study. Pain Pract. 2014. [Google Scholar] [CrossRef]
  23. Yeh, R.G.; Chen, G.Y.; Shieh, J.S.; Kuo, C.D. Parameter Investigation of Detrended Fluctuation Analysis for Short-term Human Heart Rate Variability. J. Med. Biol. Eng. 2010, 30, 277–282. [Google Scholar]
  24. Kuo, C.D.; Chen, G.Y. Comparison of three recumbent positions on vagal and sympathetic modulation using spectral heart rate variability in patients with coronary artery disease. Am. J. Cardiol. 1998, 81, 392–396. [Google Scholar]
  25. Wu, H.T.; Hsu, P.C.; Lin, C.F.; Wang, H.J.; Sun, C.K.; Liu, A.B.; Lo, M.T.; Tang, C.J. Multiscale entropy analysis of pulse wave velocity for assessing atherosclerosis in the aged and diabetic. IEEE Trans. Biomed. Eng. 2011, 58, 2978–2981. [Google Scholar]
  26. Baumert, M.; Javorka, M.; Seeck, A.; Faber, R.; Sanders, P.; Voss, A. Multiscale entropy and detrended fluctuation analysis of QT interval and heart rate variability during normal pregnancy. Comput. Biol. Med. 2012, 42, 347–352. [Google Scholar]
  27. Javorka, M.; Trunkvalterova, Z.; Tonhajzerova, I.; Javorkova, J.; Javorka, K.; Baumert, M. Short-term heart rate complexity is reduced in patients with type 1 diabetes mellitus. Clin. Neurophysiol. 2008, 119, 1071–1081. [Google Scholar]
  28. Turianikova, Z.; Javorka, K.; Baumert, M.; Calkovska, A.; Javorka, M. The effect of orthostatic stress on multiscale entropy of heart rate and blood pressure. Physiol. Meas. 2011, 32, 1425–1437. [Google Scholar]
  29. Weitzman, E.D.; Kripke, D.F.; Goldmacher, D.; McGregor, P.; Nogeire, C. Acute reversal of the sleep-waking cycle in man. Effect on sleep stage patterns. Arch. Neurol. 1970, 22, 483–489. [Google Scholar]
  30. Deng, Z.D.; Poon, C.S.; Arzeno, N.M.; Katz, E.S. Heart rate variability in pediatric obstructive sleep apnea, Proceedings of 28th Annual International Conference of the IEEE Engineering in Medicine and Biology Society (EMBS’06), New York, NY, USA, 30 August–3 September 2006; pp. 3565–3568.
  31. Toscani, L.; Gangemi, P.F.; Parigi, A.; Silipo, R.; Ragghianti, P.; Sirabella, E.; Morelli, M.; Bagnoli, L.; Vergassola, R.; Zaccara, G. Human heart rate variability and sleep stages. Ital. J. Neurol. Sci. 1996, 17, 437–439. [Google Scholar]
  32. Cabiddu, R.; Cerutti, S.; Viardot, G.; Werner, S.; Bianchi, A.M. Modulation of the Sympatho-Vagal Balance during Sleep: Frequency Domain Study of Heart Rate Variability and Respiration. Front. Physiol. 2012, 3. [Google Scholar] [CrossRef]
  33. Mortara, A.; Sleight, P.; Pinna, G.D.; Maestri, R.; Prpa, A.; La Rovere, M.T.; Cobelli, F.; Tavazzi, L. Abnormal awake respiratory patterns are common in chronic heart failure and may prevent evaluation of autonomic tone by measures of heart rate variability. Circulation 1997, 96, 246–252. [Google Scholar]
  34. Narkiewicz, K.; Montano, N.; Cogliati, C.; van de Borne, P.J.; Dyken, M.E.; Somers, V.K. Altered cardiovascular variability in obstructive sleep apnea. Circulation 1998, 98, 1071–1077. [Google Scholar]
  35. Muzumdar, H.V.; Sin, S.; Nikova, M.; Gates, G.; Kim, D.; Arens, R. Changes in heart rate variability after adenotonsillectomy in children with obstructive sleep apnea. Chest 2011, 139, 1050–1059. [Google Scholar]
  36. Gula, L.J.; Krahn, A.D.; Skanes, A.; Ferguson, K.A.; George, C.; Yee, R.; Klein, G.J. Heart rate variability in obstructive sleep apnea: A prospective study and frequency domain analysis. Ann. Noninvasive Electrocardiol. 2003, 8, 144–149. [Google Scholar]
  37. Penzel, T.; Kantelhardt, J.W.; Grote, L.; Peter, J.H.; Bunde, A. Comparison of detrended fluctuation analysis and spectral analysis for heart rate variability in sleep and sleep apnea. IEEE Trans. Biomed. Eng. 2003, 50, 1143–1151. [Google Scholar]
  38. Grote, L.; Ploch, T.; Heitmann, J.; Knaack, L.; Penzel, T.; Peter, J.H. Sleep-related breathing disorder is an independent risk factor for systemic hypertension. Am. J. Respir. Crit. Care Med. 1999, 160, 1875–1882. [Google Scholar]
  39. Lavie, L.; Vishnevsky, A.; Lavie, P. Evidence for lipid peroxidation in obstructive sleep apnea. Sleep 2004, 27, 123–128. [Google Scholar]
  40. Papaioannou, V.E.; Chouvarda, I.; Maglaveras, N.; Dragoumanis, C.; Pneumatikos, I. Changes of heart and respiratory rate dynamics during weaning from mechanical ventilation: A study of physiologic complexity in surgical critically ill patients. J. Crit. Care 2011, 26, 262–272. [Google Scholar]
Figure 1. Multiscale entropy (MSE) analysis of R-R interval (RRI) time series showing changes in sample entropy among four groups of study subjects with different scale factors. Symbols represent the mean values of entropy for each group, and bar represent the standard error ( S E = SD / n, n = total number of subjects). * p < 0.05: normal snoring and mild OSA groups vs. moderate and severe OSA groups; †p < 0.05: normal snoring and mild OSA groups vs. severe OSA group.
Entropy 17 00231f1
Figure 2. Boxplots of multiscale entropy (MSE) of four groups of study subjects from scale 1 to scale 5 and multiscale entropy index with small scale (MEISS). Normal: Normal snoring subjects; Mild, Moderate, Severe: Patients with mild, moderate, and severe obstructive sleep apnea, respectively.
Entropy 17 00231f2
Figure 3. Spearman correlation between multiscale entropy index with small scale (MEISS) and (a) apnea hypopnea index (AHI); (b) number of apnea episodes per hour.
Entropy 17 00231f3
Table 1. Summary of demographic, anthropometric, and sleep-related characteristics of study subjects.
CharacteristicsNormal Snoring (n = 11)Mild OSA (n = 10)Moderate OSA (n = 24)Severe OSA (n = 45)
Gender (men/women)7/48/214/1043/2
Age (years)41 (50.0–36.0)45.5 (64.0–35.5)48.5 (59.7–48.5)46 (56.0–41.0)
Body mass index (BMI, kg/m2)24.4 (25.0–22.1)23.5 (28.0–22.0)26.5 (30.57–22.62)26.8 (29.3–25.6)
Neck circumference (cm)36 (37.5–33.0)37 (39.0–34.7)36.5 (40.7–34.2)40 (42.0–37.6)
Sleep efficiency (%)88.6 (92.6–63.1)75.2 (93.0–63.1)83.7 (91.4–79.7)85.2 (89.4–75.0)
LSaO2 (%)93 (95–87)*89.5 (91–82)83 (84–76)70 (82–59)
AHI (per hour)2.4 (2.7–1.8)8.9 (10.3–5.8)21.1 (26.9–18.3)49.9 (67.3–38.8)
Breathing Frequency (Hz)0.216 (0.225–0.208)0.223 (0.230–0.208)0.215 (0.222–0.201)0.143 (0.159–0.128)
RR interval(ms)1005 (1147–892)1018 (1133–942)986 (1058–930)977 (1017–905)
HR(beats/min)59.7 (67.2–52.3)58.9 (63.8–52.9)60.8 (64.4–56.7)61.4 (66.3–58.9)
Sleep StageStage N1 (%)32.3 (43.7–10.2)32.1 (34.7–17.8)29.2 (44.4–23.3)61.9 (76.7–40.5)
Stage N2 (%)50.7 (59.7–39)49.1 (58.5–45.4)47.9 (55.8–35.3)18.5 (40.0–7.8)
Stage N3 (%)0.9 (12.5–0.6)0 (6.9–0)0.5 (5.4–0)0 (0.6–0)
REM (%)16.5 (23.7–13.7)17.7 (24.2–10.8)18.6 (21.9–16.6)16.1 (19.9–14.1)
Presentation of all data as median (interquartile range). HR: Heart Rate; AHI: Apnea hypopnea index; OSA: Obstructive sleep apnea; LSaO2: Lowest arterial oxygen saturation; REM: Rapid eye movement; Simple snoring: AHI < 5; Mild OSA: 5 ≤ AHI < 15; Moderate OSA: 15 ≤ AHI < 30; Severe OSA: AHI ≥ 30;
*p < 0.05 vs. Moderate and Severe OSA;
p < 0.05 vs. Severe OSA;
p < 0.05 vs. Mild and Moderate OSA; p < 0.05 vs. Moderate OSA;
p < 0.05 vs. Mild, Moderate and Severe OSA.
Table 2. Power spectrum of heart rate variability in four groups of study subjects.
ParameterNormal SnoringMild OSAModerate OSASevere OSA
nLF0.36 (0.46–0.29)0.38 (0.56–0.24)0.45 (0.53–0.36)0.56 (0.61–0.43)*
nHF0.57 (0.65–0.38)0.47 (0.72–0.35)¶0.37 (0.50–0.30)0.29 (0.41–0.24)
LF/HF0.63 (1.24–0.44)0.91 (1.59–0.33)1.13 (1.55–0.73)1.74 (2.51–1.06)*
Presentation of all data as median (interquartile range). nLF: Normalized low frequency power; nHF: Normalized high frequency power; LF/HF: Ratio of low frequency power to high frequency power;
*p < 0.05 vs. Normal Snoring and Mild, Moderate OSA;
p < 0.05 vs. Moderate and Severe OSA;
p < 0.05 vs. Moderate OSA; p < 0.05 vs. severe OSA.
Table 3. Multiscale entropy index (MEI) of four groups of subjects with different severity of obstructive sleep apnea (OSA).
ParameterNormal SnoringMild OSAModerate OSASevere OSA
MEISS9.13 (9.89–8.24)*9.17 (9.55–8.69)*8.32 (8.88–6.84)7.02 (8.55–5.35)
MEILS9.43 (10.40–8.66)9.19 (10.36–8.78)9.15 (10.21–8.20)8.37 (9.68–7.12)
Presentation of all data as median (interquartile range). MEISS: Multiscale entropy index with small scale; MEILS: Multiscale entropy index with large scale;
*p<0.05 vs. Moderate and Severe OSA.

