Article

Effects of Direct Fuel Injection Strategies on Cycle-by-Cycle Variability in a Gasoline Homogeneous Charge Compression Ignition Engine: Sample Entropy Analysis

1
Faculty of Mechanical Engineering, Lublin University of Technology, Nadbystrzycka 36, 20-618 Lublin, Poland
2
Departamento de Física Aplicada, Universidad de Salamanca, 37008 Salamanca, Spain
3
Instituto de Ingeniería Mecánica y Producción Industrial, Universidad de la República, 11300 Montevideo, Uruguay
4
Unidad Profesional Interdisciplinaria en Ingeniería y Tecnologías Avanzadas, Instituto Politécnico Nacional, Av. IPN 2580, L. Ticomán, México DF 07340, Mexico
*
Author to whom correspondence should be addressed.
Submission received: 4 December 2014 / Revised: 29 December 2014 / Accepted: 23 January 2015 / Published: 29 January 2015

Abstract

:
In this study we summarize and analyze experimental observations of cyclic variability in homogeneous charge compression ignition (HCCI) combustion in a single-cylinder gasoline engine. The engine was configured with negative valve overlap (NVO) to trap residual gases from prior cycles and thus enable auto-ignition in successive cycles. Correlations were developed between different fuel injection strategies and cycle average combustion and work output profiles. Hypothesized physical mechanisms based on these correlations were then compared with trends in cycle-by-cycle predictability as revealed by sample entropy. The results of these comparisons help to clarify how fuel injection strategy can interact with prior cycle effects to affect combustion stability and so contribute to design control methods for HCCI engines.

1. Introduction

Homogeneous charge compression ignition (HCCI) inherits selected features from both spark ignition and compression ignition combustion systems. The mixture is previously prepared before combustion, thus it is well premixed before ignition occurs, which is typical of spark ignition engines. However ignition is not forced via spark discharge but appears spontaneously at multiple sites as an effect of a gas temperature increasing during the compression process. Such a course of combustion process is characterized by the lack of flame propagation and uniform temperature across the cylinder. Also, as combustion is kinetically controlled, heat release process is very quick, resulting in a realization close to the ideal Otto cycle. Due to these features, HCCI combustion exhibits uncompromising improvement of working cycle efficiency and reduction of cylinder-out emissions of nitrogen oxides as well as particulates [1,2].
Exhaust gas retention with the use of negative valve overlap (NVO) technique is a production feasible approach to HCCI combustion in 4-stroke engines [2]. High amounts of trapped residuals elevate the mixture temperature at the start of compression. As a result it is possible to ignite gasoline-like fuels at compression ratios typical for spark ignition engines and without intake air preheating. Due to the high amount of internally re-circulated exhaust, the gas exchange process in HCCI engines is much more complex than in traditional 4-stroke engines. The amount of intake air is strongly affected by the temperature and the amount of trapped residuals. Thus, the compression temperature histories result from the thermal balance of the intake process, the thermodynamic properties of the mixture and heat transfer. For a mixture with given properties, gas temperature controls auto-ignition delay. A consequence of the above is that auto-ignition timing is controlled by NVO phenomena and the intake process. Finally, there is a strong feedback between the composition and the thermodynamic conditions of the burned gas after combustion of a given engine cycle and the subsequent combustion event. In other words, auto-ignition is spontaneous but controlled by the preceding events. Resulting cycle-by-cycle variability has a clear deterministic component. The variations between consecutive cycles seem to be a key process enabling self-regulation of in-cylinder mixture composition and its thermodynamic properties, providing stable autonomous operation of the engine in HCCI mode.
The application of fuel injection during the NVO period introduces further complexities into the operation of residual effected HCCI engine [3,4]. Direct fuel injection in the early stage of the NVO period (during exhaust compression) enables fuel reforming, which results in the production of auto-ignition promoting species, like ethane, ethylene, acetylene, formaldehyde and methanol [3,5,6]. As a result, early NVO injection advances the start of combustion by a couple of degrees when compared to mixture preparation outside of the cylinder under the same thermal conditions [7,8]. However, the majority of researchers recognize thermal NVO processes as dominant in combustion development [9,10]. The amount of the in-cylinder gas and its thermodynamic conditions at intake valve opening event determines the amount of aspirated air and the in-cylinder temperature at the start of compression. Early NVO injection at rich or stoichiometric mixtures enables endothermic fuel reforming, which causes a drop of in-cylinder temperature. Under stoichiometric conditions auto-ignition delaying effect of thermal phenomena cannot be compensated by the production of ignition promoting species. Under lean mixture conditions, oxidative reforming takes place due to oxygen presence during the NVO period. Oxidative reforming, apart from the production of auto-ignition promoting species, increases in-cylinder temperature [11]. Consequently, it advances combustion much more than endothermic reforming does [6]. Associated heat production during the NVO reduces the heating value of the remaining mixture. Finally, less heat is released during the main event, which affects the thermal efficiency of the overall engine cycle. Recent works proposed modeling frameworks devoted to analyze optimal engine operating strategies for this kind of engines from the viewpoint of the second law of thermodynamics and quantifying the in-cylinder exergy loss mechanisms [12,13].
The extent of processes influencing combustion course and feedback loop between consecutive cycles make the cycle-by-cycle variability a complex multidimensional process. During the last decade a lot of effort was put into understanding the mechanisms of cyclic variability in HCCI engines [1421]. Koopmans et al. [14] presented the mechanism of cyclic variability of combustion timing in an engine with direct NVO injection. They observed self-excited oscillations of 50% mass fraction burned (MFB) damped after a couple of cycles. The authors hypothesized that oscillations were resulting from variations in air excess ratio and dilution rate. Previous studies by our group [22] revealed that these oscillations in combustion timing resulted primarily from variability in heat release during the NVO period. Daw et al. [15] and Sen et al. [16] demonstrated deterministic patterns of cyclic variations of main event cumulative heat release in HCCI engine and developed a statistical model for the prediction of heat release on the basis of time series data. The authors concluded that cyclic variations mainly result from nonlinear internal exhaust gas re-circulation (EGR) feedback. However, their experiments were performed for port injected engine. Correlations between consecutive engine cycles were also studied by Hellström et al. [17]. They found that the subsequent cycles were coupled by feedback from incomplete combustion. Ghazimirsaied and Koch [18] developed an algorithm enabling the prediction of combustion timing one cycle ahead on the base of peak pressure crank angles from two previous cycles. They have also demonstrated peak pressure patterns at engine operation close to the misfire limit. Recently, understanding of the cyclic variability nature in HCCI engines became a keystone for the development of control algorithms for stabilization of cyclic dispersion [17,18,21,2325].
As thermal and chemical effects of exhaust-fuel reactions are supposed to affect main combustion event to a high extent, we would expect a feedback loop between consecutive cycles via NVO phenomena. The understanding of this mechanism would be basic in the design of any control strategy for HCCI engines. Thus, it is a major objective of this work to study how some kind of “message” is passed from the preceding to the following cycle. To decode this “message” we adopted information entropy analysis—a method which was originally elaborated for diagnostic purposes in physiology. An entropy analysis was already applied to characterize the combustion dynamics by Daw et al. [26]. The authors analyzed the amounts of heat released in consecutive cycles for a spark ignition engine. Their results showed that at lean engine operation, close to a misfire limit, heat release variability exhibited deterministic features. Litak et al. [27] found deterministic patterns in heat release using recurrence plots. The quantity and quality of residuals left in the cylinder by the preceding combustion was pointed out as the major reason for this deterministic variability. However, in spark ignition engines the effects of trapped residuals are small, as the amount of residuals is small. In contrast, in HCCI engines operated in the NVO mode, the amounts of residuals are large, thus they determine mixture composition during the main event. Moreover, trapped residuals provide energy for auto-ignition, thus thermal balance between residuals and fresh mixture is a major factor determining combustion timing. Considering the comments above, it is expected that there could be a characteristic behavior for pairs of consecutive engine cycles. Such pairs of cycles can be identified and quantified using sample entropy statistics, that is recognized as a powerful tool for the analysis of short time series avoiding the count of self matches [28].
In this experimental study we examined cycle-by-cycle variability in main event indicated work, NVO indicated work, and auto-ignition timing making use of sample entropy calculations with the aim to identify the origin of instabilities. The first two variables represent the thermal effects of exhaust-fuel reactions during the NVO and the efficiency of fuel conversion into work by the main event, accordingly. The last variable is a sensitive indicator of temperature at the end of compression. Therefore, we try to investigate the way NVO features are reflected in main event details in terms of cycle-by-cycle variability.

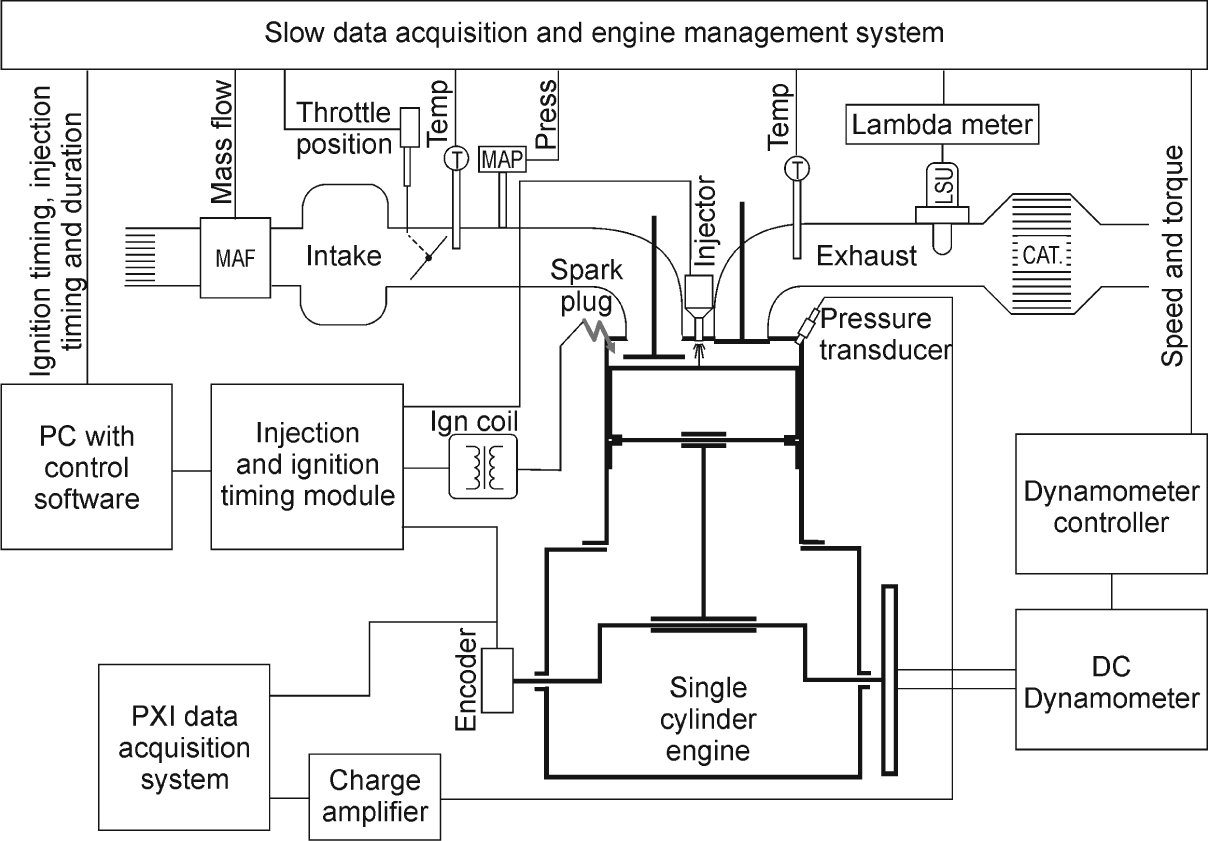
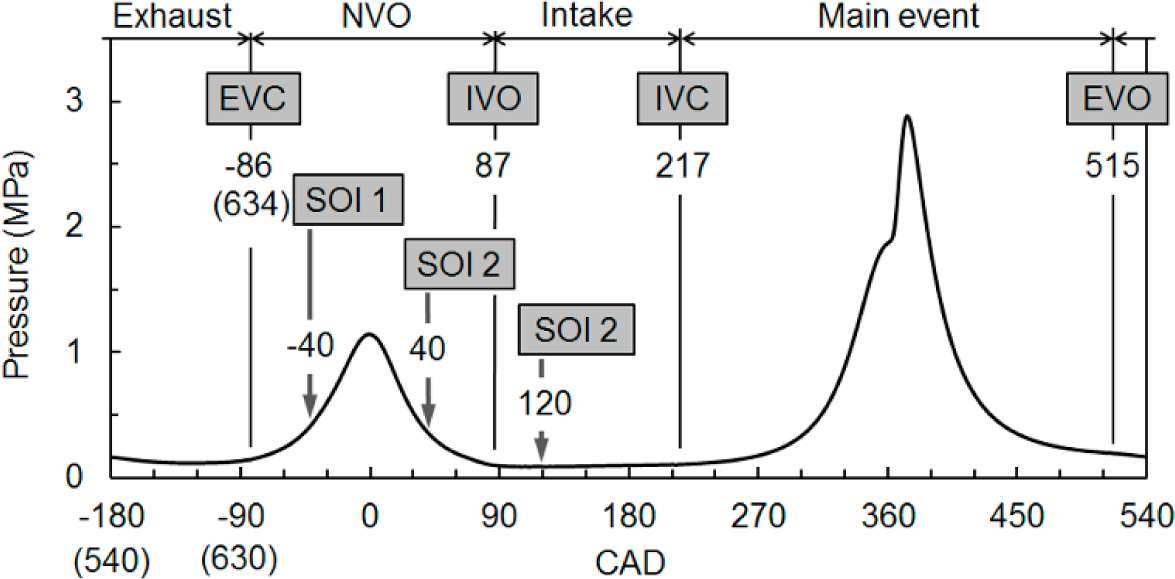
2. Experimental Setup and Procedure

A single-cylinder research engine was installed on a test bed with a DC dynamometer. The engine was equipped with a fully variable valvetrain with independent regulation of valves lifts and timings. The regulation of valves lifts was relied on a hydraulic mechanism. The fully variable valvetrain allowed us to obtain internal EGR with the use of the NVO technique. Fuel was introduced into the cylinder with the use of a side-mounted single-stream swirl-type injector. The combustion chamber design and injector characteristics were extensively described in [29]. The main engine geometric parameters along with valvetrain settings are specified in Table 1. In order to simplify imaging crank angle based figures, all timings are given in terms of degrees after NVO top dead center (TDC). A low compression ratio, typical of spark ignition engines, is used. This is usual in residual effected HCCI engines [13] because the energy required to promote auto-ignition is provided by trapped exhaust, instead of elevated compression ratios. Furthermore, this allows to switch to spark ignition mode without necessity of changing the compression ratio.
The engine test bench was equipped with all the necessary measurement and control instrumentation, as shown in Figure 1. In-cylinder pressure was measured with the use of a miniature pressure transducer mounted directly in the engine head. Pressure and other crank angle based parameters were acquired with a constant angular resolution of 0.1 crank angle degrees (CAD). At each operating condition the in-cylinder pressure signal was recorded for 1000 consecutive cycles.
Data post-processing was performed with the use of in-house software on the basis of measured in-cylinder pressure traces and a number of time averaged parameters. Among these parameters were the pressures and temperatures of intake air and exhaust, the intake mass flow rate, the fuel consumption, the oxygen content in the exhaust gas, etc. Net heat release rate was calculated according to the first law of thermodynamics, where the specific heat ratio at each measurement point (crank angle) was calculated on the basis of temperature and instantaneous mixture composition. The mass of trapped residuals was computed using the ideal gas equation of state on the basis of in-cylinder pressure and volume at exhaust valve closing (EVC) event and the temperature measured in the exhaust port. The amount of intake air at each analyzed engine cycle was assessed with the use of a flow model, which utilized measured in-cylinder pressure as boundary condition. Finally, all in-cylinder parameters were calculated separately for each analyzed cycle, considering cyclic fluctuations of mass and composition.
The experiments were conducted at an engine speed of 1500 rev/min and wide open throttle. The engine was operated at atmospheric intake. To enhance HCCI combustion, intake air was preheated by a water jacket around the intake running up to approximately 40 °C. The temperature of cooling liquid at the engine outlet was maintained constant at 90 ± 1°C. The engine was fueled with regular European Euro Super gasoline (95 RON) from a single batch. The fuel consisted of 38% alkanes, 8% cycloalkanes, 8% alkenes, and 37% aromatics. Additionally, it contained 4% ethyl tert-butyl ether and 5% ethanol. These data were obtained by detailed analysis according to ASTM D 5134 standard. Air excess ratio (λ) was set to level of 1.2 via the amount of fuel injected. Internal EGR rate was not controlled directly, thus it was determined by the gas exchange phenomena at constant valvetrain settings. Under investigated conditions EGR rate varied from 0.55 to 0.57 while the indicated mean effective pressure (IMEP) varied between 0.22 and 0.24 MPa. In order to avoid artifacts originated from the feedback of the engine control system, the engine was ran in an open-loop mode except the dynamometer speed controller and the cooling liquid temperature controller.
The fuel was introduced into the cylinder at three strategically selected start of injection (SOI) timings shown in Figure 2. The early NVO injection, applied at SOI 1 = 40 CAD before TDC enabled fuel reforming. The experiments were performed for whole fuel injection at SOI 1 and also with the split fuel injection technique where the mass of fuel was shared between the first injection and the second injection, at SOI 2. The second injections were applied at 40 CAD after TDC during NVO or at 120 CAD during intake. Application of SOI 2 at 40 CAD did not result in fuel reforming, however, heat for fuel phase change was consumed during NVO. In the case of SOI 2 at 120 CAD fuel vaporization did not contributed to NVO thermochemistry, while homogeneous charge was created. For each split injection case the fuel share between injections was gradually varied from the whole fuel injection at the early NVO stage (solely at SOI 1) to 25% of fuel applied at SOI 1, while the remaining 75% of fuel was applied at selected SOI 2 timings. In the case of the whole fuel injected, early mass of trapped residuals was 214 mg, while mass of fuel was 8.9 mg. At given main event λ of 1.2, the resulting value of λ during NVO was 0.33. With increasing second injection fuel mass share, the value of NVO λ after the first injection increased progressively up to approximately 1.2% for 75% of fuel injected at SOI 2, as shown in Figure 3. At the engine operating conditions applied for the present experiments whole fuel injection at SOI 2 timings was not applicable due to misfires. During such experiments, data recording was started for several times and each time combustion was interrupted by the occurrence of misfires. In other words, there was at least one misfire per each 1000 consecutive engine cycles.

3. Results and Discussion

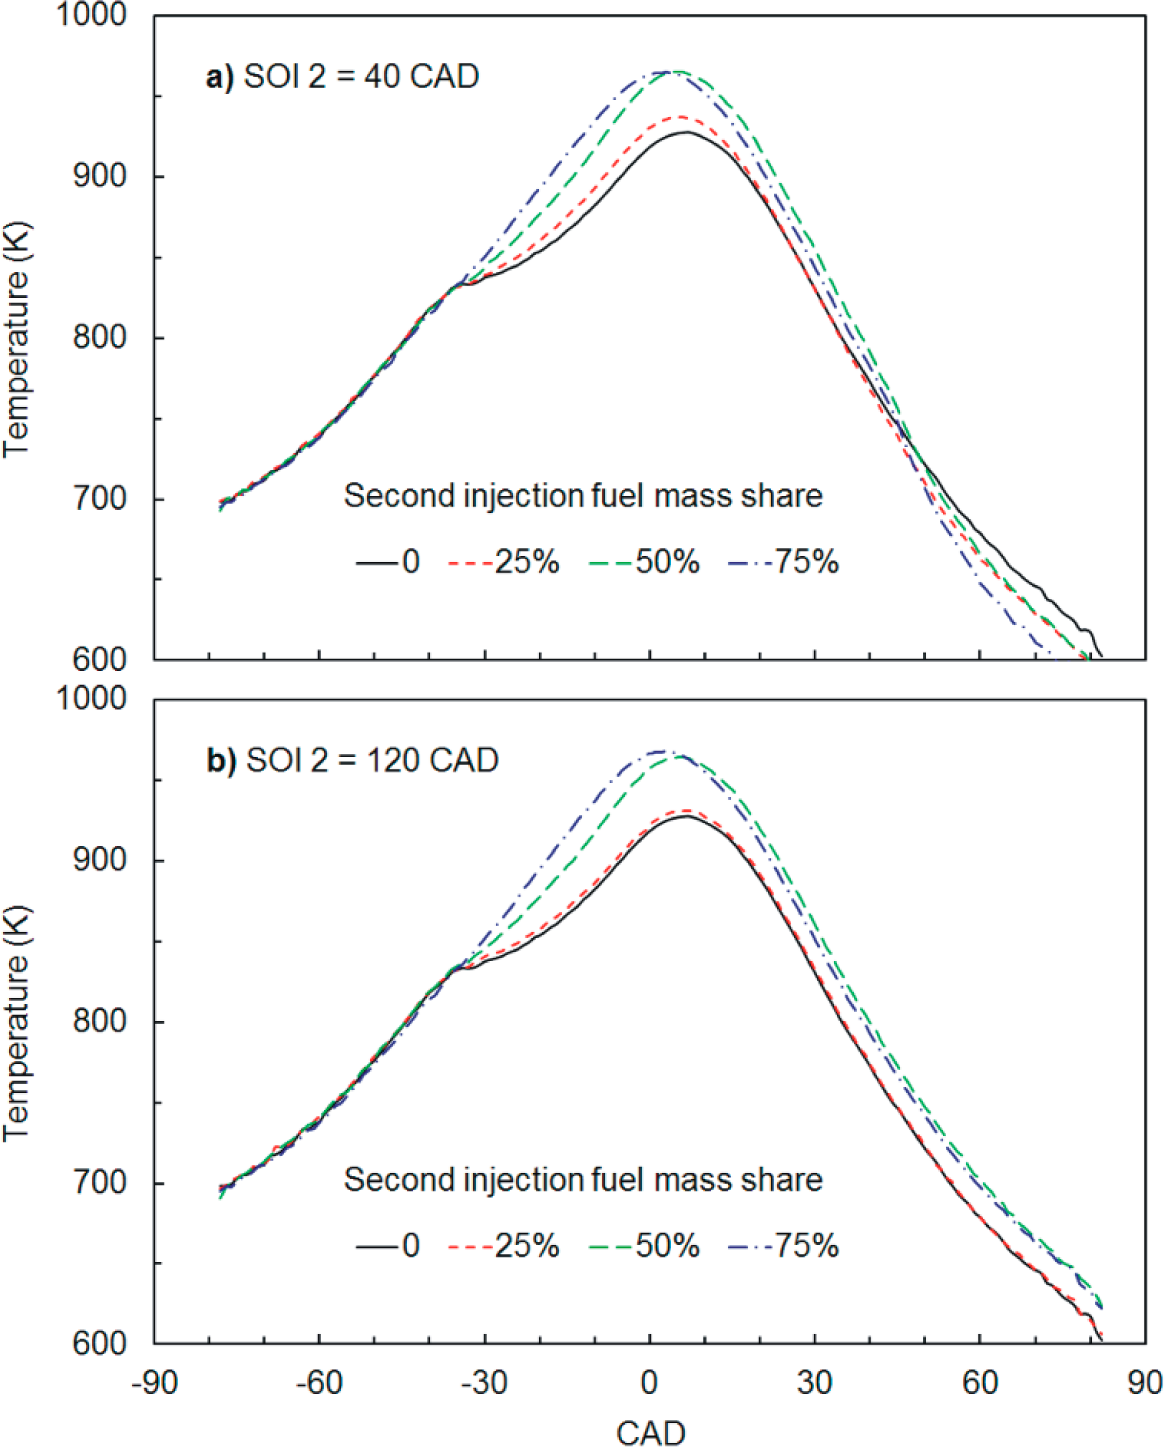
3.1. NVO Thermal Phenomena

The ensemble average in-cylinder parameters are presented in order to show how injection timing and fuel split ratio affect NVO thermodynamics and the subsequent combustion. Figures 4 and 5 illustrate the thermal effects of different injection strategies. Approximately 5 degrees after SOI 1 the heat consumption required for fuel phase change and reforming can be observed, as shown in Figure 4. The more fuel is injected early at SOI 1, the more heat is consumed. Approximately 10 CAD before TDC heat release starts with the same rates for all cases except for 75% of fuel injected at SOI 2. In the last case there was oxygen excess after the first injection, as shown in Figure 3, and heat release was controlled solely by the fuel quantity.
In the case of the second injection applied at SOI 2 = 40 CAD, after the injection only heat consumption can be observed, as shown in Figure 4a. The in-cylinder temperature is dropping and shortly after injection it is too low for either reforming or heat release. Moreover, comparing the amounts of heat consumed after the first and the second injection in the case of equal fuel distribution, it can be observed that more energy is consumed after the first injection. This strengthens the hypothesis that endothermic fuel reforming takes place.
Figure 5 shows how heat consumption and heat release during NVO affected NVO temperature histories. The temperatures at the start of recompression were nearly the same for all the applied injection timings and split ratios. In the case where the second injection was applied during exhaust expansion, the increase of the second injection fuel mass share resulted in a reduction of the temperature after NVO, as shown in Figure 5a. This effect does not correlate with heat release data shown in Figure 5a. However, it should be noted that mass of trapped residuals slightly decreased with the increase in second injection fuel mass share. Thus, the thermal effect of fuel vaporization was more significant. In the case the second injection is applied during intake, the expansion temperatures at the end of NVO do not change monotonically with changing second injection fuel mass share, as shown in Figure 5b. The observed trend results from the limited oxygen availability for fuel combustion at increased fuel shares of the first injection.

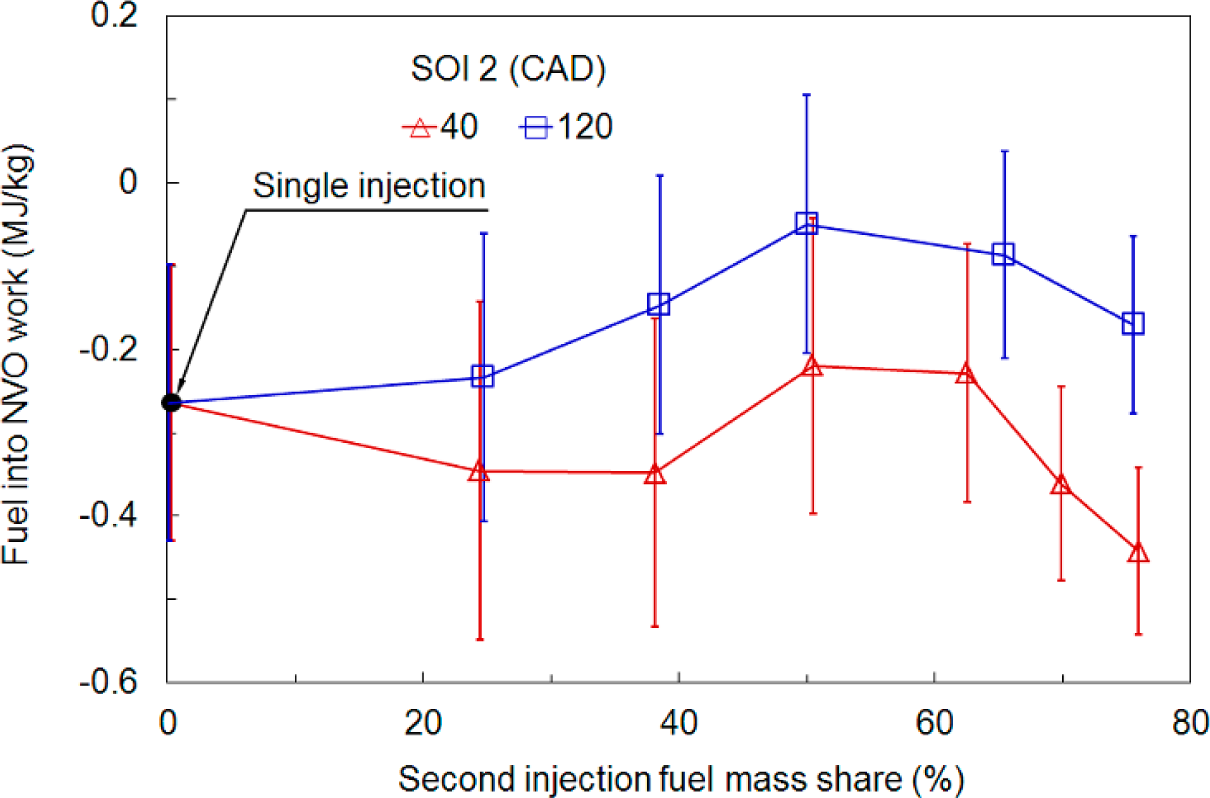
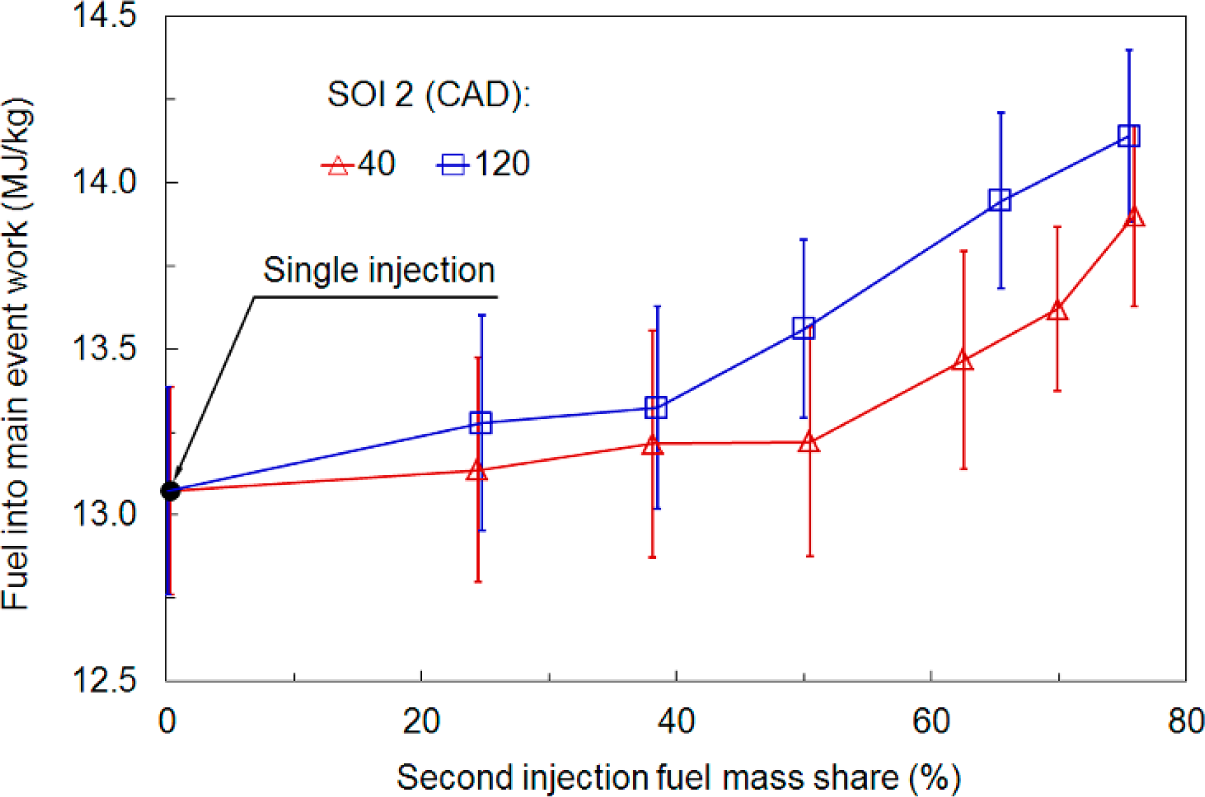
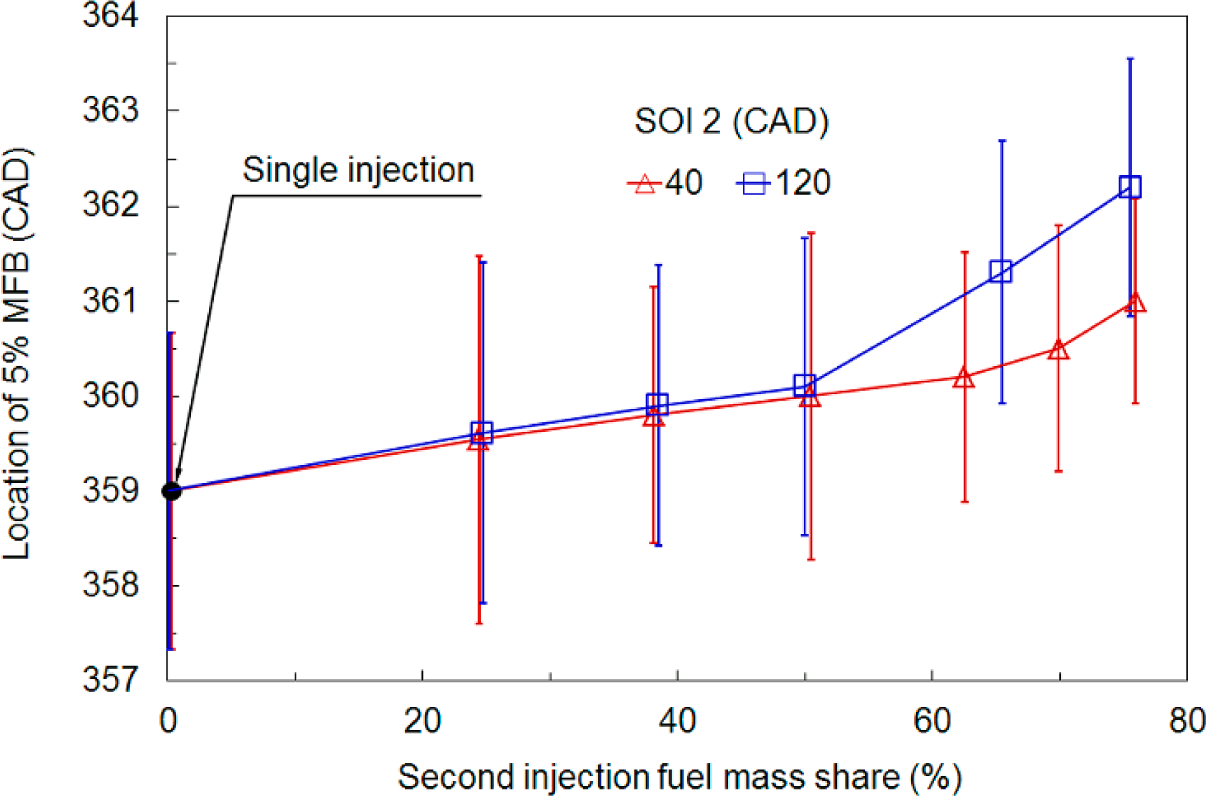
3.2. Data Reduction and Average Trends

In order to analyze cycle-by-cycle variations of NVO phenomena and the main event processes on the basis of in-cylinder pressure measurements, special attention should be paid on the selection of the indicated energetic parameters. It is necessary to select the parameters which are the least susceptible to measurement errors and shortcomings from calculation procedures. In other words, the proper selection of parameters prevents a situation where cyclic variability arises as an artifact of the applied technique. Thus, NVO indicated work was selected to provide data representing thermal effects of fuel injection, reforming and heat release during the NVO period. Due to the almost symmetrical exhaust valve closing (EVC) and intake valve opening (IVO) timings, this indicator was not affected by the pressure offset and long-term temperature drift of the pressure transducer. Analogously, the indicated work computed for crank angle degrees ranging from IVC to EVO was utilized as an energetic parameter for the main event. Crank angle at 5% of mass fraction burned (MFB) was selected as combustion timing related parameter. Since at the same auto-ignition properties of the mixture, temperature is the main factor determining the start of combustion [30], even small variations in the end of compression temperature can be reflected in the start of combustion timing. It should be noted, that the chosen parameters can be easily calculated from in-cylinder pressure signal, without complete information on mixture quantity and its thermodynamic conditions. Thus, computations can be made in real time on-board of an engine controller and their results can be utilized by control procedures.
Figures 6 and 7 show 1000 cycle average values and the corresponding standard deviations of NVO indicated work and main event indicated work for all the applied injection strategies. It should be noted that at constant λ value, the mass of fuel injected depends on the amount of aspirated air, which varies between fuelling strategies. Thus, indicated work values were referred to the average mass of fuel injected. NVO work is determined by thermal effects of fuel injection [29], where three phenomena can be distinguished:
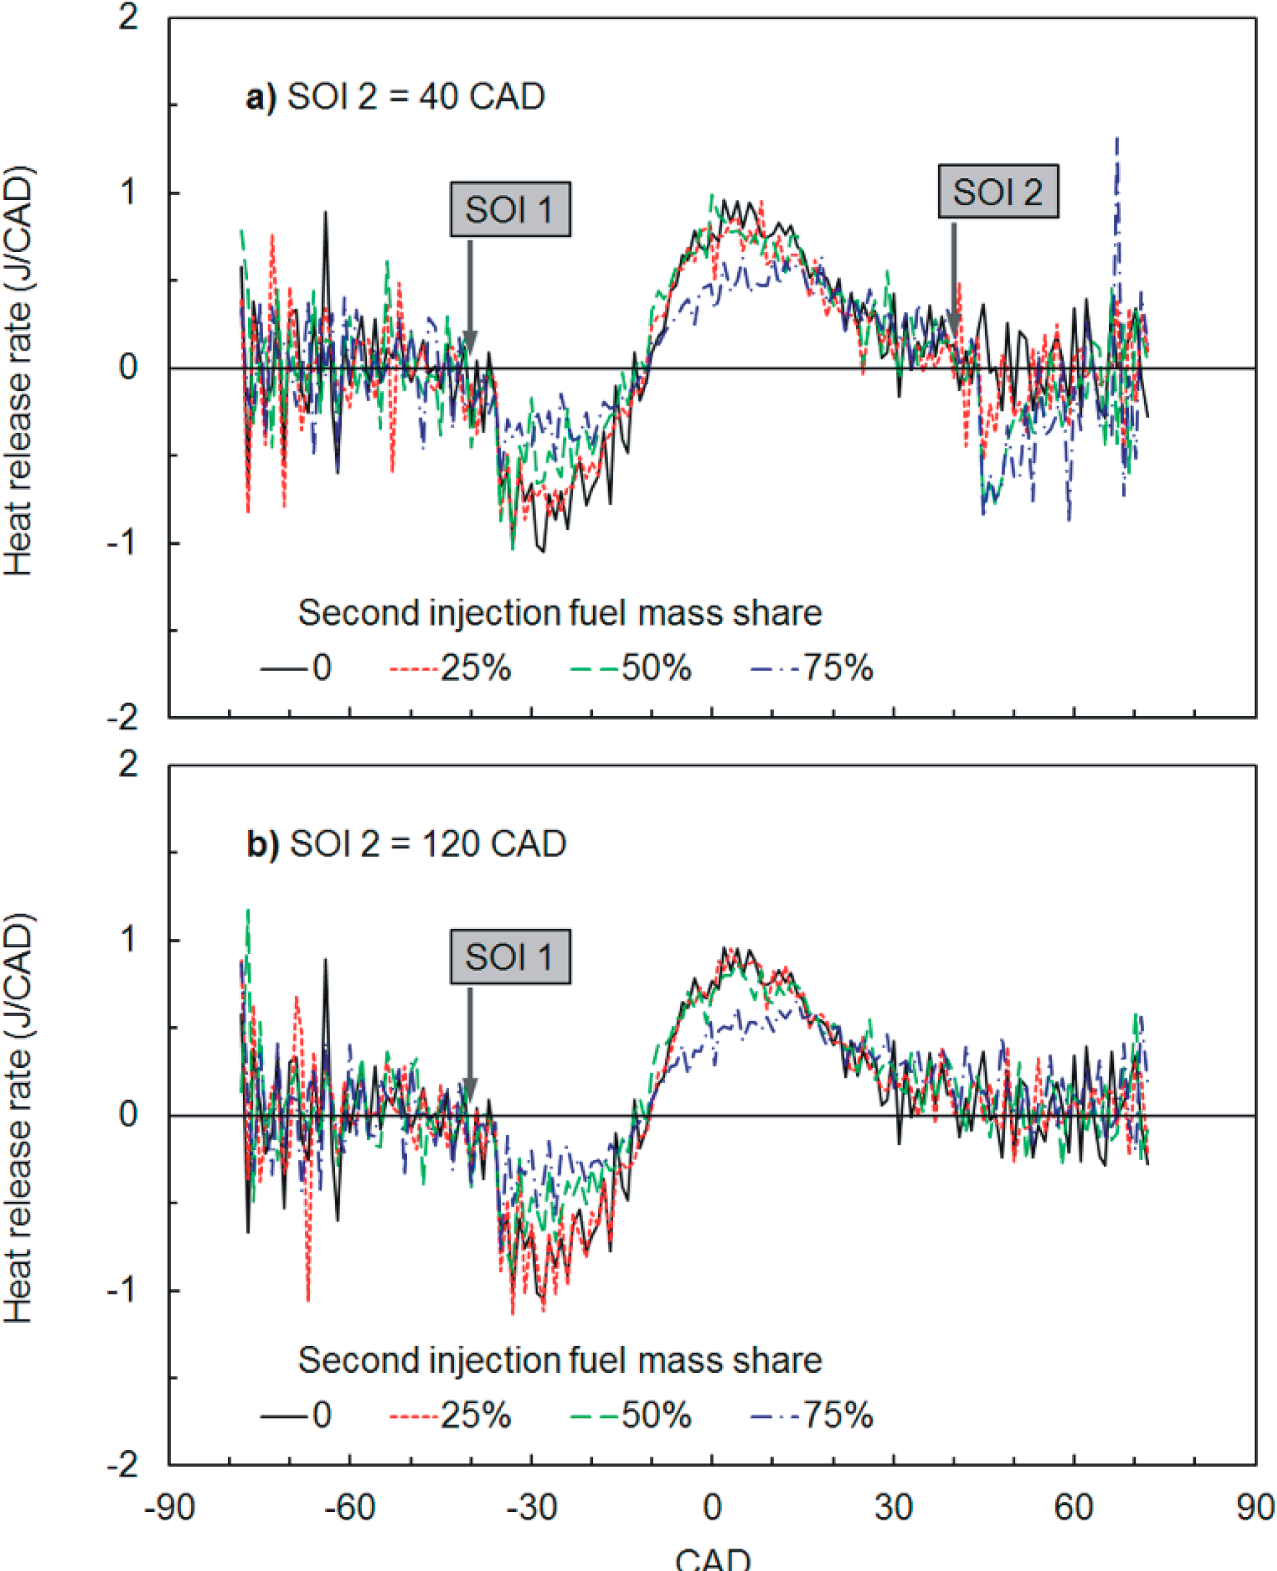
  • Heat consumption for fuel phase change and endothermic reforming after the first injection reduces the expansion work vs. the compression work demand.
  • Heat release after the first injection increases the expansion work vs. the compression work demand.
  • Heat consumption for fuel phase change after the second injection (if applied during exhaust expansion) reduces the expansion work.
The increase of fuel mass share applied at SOI 2 = 120 CAD results in an increase in NVO work (decrease in external work demand), as shown in Figure 6. It is a consequence of a balance between the heat of vaporization and the heat release during NVO. The decrease of the first injection fuel mass share reduces the energy demand for fuel phase change, while heat release is controlled by oxygen availability. However, this trend is limited to even fuel distribution between injections. For higher second injection fuel mass shares, a drop in NVO work can be observed. It is associated with the reduction of NVO heat release, which is controlled by the fuel quantity. In this case heat release cannot compensate for the heat demand for endothermic reactions and heat transfer. Comparison of Figure 3 and Figure 6 shows that the drop in NVO work starts before a lean mixture is achieved. This is the effect of increasing heat losses with increasing the second injection fuel mass share. NVO peak temperatures are increasing with an increase in the second injection fuel mass share, which contributes to heat transfer. The amount of NVO heat transfer calculated using Hohenberg equation for whole fuel injected at SOI 1 was 15.9 J, while for 75% of fuel injected late it was as high as 20.3 J. An alternative explanation of this phenomenon is that fuel carbon is combusted mainly into CO, thus oxidation reaction stoichiometry is achieved for λ less than 1. An analysis of NVO work at SOI 2 = 40 CAD is more complex, as fuel vaporization after second injection contributes to NVO thermodynamics. The observed trend is a result of a balance between the three aforementioned effects of fuel injection. It is similar to that at SOI 2 = 120 CAD, however, the values are sloping down in association to the heat for vaporization of the fuel applied with the second injection.
Heat release during the NVO period reduces the heating value of the in-cylinder mixture. Thus, the higher the NVO work, the lower the main event work is expected. Obviously, conversion of fuel chemical energy into work is a very complex process and is affected by the rate of heat release, expansion ratio, heat losses, mixture specific heats ratio, etc. Nevertheless, Figure 7 shows that the increase of mass shares of the second injection results in an increase in the main event work for both injection strategies. This trend is especially evident for higher mass shares, where a drop in NVO work is observed. The application of 75% of fuel at SOI 2 = 120 CAD increases fuel conversion into the main event work by 8.2% vs. single injection at SOI 1. At the same time, Figure 8 does not indicate that this benefit in fuel conversion efficiency is an effect of the combustion timing change. A delay of 5% MFB located after TDC would reduce the thermal efficiency rather than increase it. A careful examination of the pressure-volume diagrams in Figure 9 shows that a delay in combustion indeed reduces indicated work close to TDC, however, expansion pressure increases with the increase of the second injection fuel mass share, indicating that more heat is released. Therefore it is plausible that the observed trend is solely the effect of the reduction of heat consumption during the NVO period.
As mentioned earlier, an increase of the second injection fuel mass share results in delayed 5% MFB by 2 CAD for SOI 2 = 40 CAD and approx. 3 CAD for SOI 2 = 120 CAD, as shown in Figure 8. For the case of SOI 2 = 40 CAD this delay correlates with IVO temperature, shown in Figure 5a. However, for SOI 2 = 120 CAD, Figure 5b does not provide evidences for any drop in IVO temperature. Obviously, fuel injection during intake results in further drop of in-cylinder temperature, which is reflected in the main event compression temperature histories (see Figure 10). It is clear that an increase in the second injection fuel mass share reduces compression temperature, regardless IVO temperature. The in-cylinder temperature at 350 CAD for the single injection case was 791 K, while for 75% of fuel injected at SOI 2 = 120 CAD it was 750 K. It can be also seen how compression temperature affects auto-ignition timing.
Standard deviations of analyzed variables are depicted by error bars in Figures from 6 to 8. All variables exhibit lower dispersions in the case of large second injection mass shares for both SOI 2 timings. However, a further reduction of the fuel injected early in the NVO period led to misfires. This observation suggests a possible chemical effect of early NVO injection which enhances auto-ignition at low temperature. This effect was already demonstrated elsewhere [6].

3.3. Cycle-by-Cycle Data Trends

Ensemble average in-cylinder parameters, shown in Section 3.2, confirm a coupling between the amount of heat released, the combustion timing, and the injection strategy. This coupling is attributed to thermal effects of fuel vaporization, reforming, and NVO heat release. However, it should be noted that the heat consumption for fuel vaporization and reforming is not affected by the mixture composition in a high extent. At the same time, cyclic variations of air excess and internal EGR rate determine the amount of heat released during the NVO period after the first injection, if heat release is controlled by oxygen availability. Thus, it can be taken for granted that variations in the NVO work are solely resulting from variable amounts of NVO heat release. Furthermore, it is hypothesized that heat release during NVO is a dominant factor determining cyclic variations in auto-ignition timing. On the other hand, heat release during the NVO period reduces the heating value of the mixture, thus a drop in the main event indicated work would be expected.
Figures 1113 show data series of NVO indicated work, main event work, and 5% MFB for extreme injection strategies. The data series that are presented illustrate that different amplitudes and modes of parameters variability can be observed for different injection strategies. Comparing Figure 11a,b it can be seen that NVO work oscillations are associated with a drop in main event work. However, where high NVO work values produce low main event work, low NVO work values do not produce high main event work. This effect can be clearly seen in Figure 14a, which shows a certain anti-correlation of main event work vs. NVO work. The upper envelope of the measurement points shows a stabilization of the main event work values for NVO work less than −5 J. This limit represents the maximum heat utilization during the main event, where there is a lack of NVO heat release or it is negligible. This effect could be also attributed to late combustion cycles, which exhibit incomplete fuel utilization. Correlation of 5% MFB vs. NVO work shows that high work input at NVO delays main combustion, as shown in Figure 15a. However, the latest locations of 5% MFB are approx. 365 CAD, and such delays cannot lead to incomplete combustion quenched by the decrease of in-cylinder temperature.
It is well known that HCCI engines reveal very low cycle-by-cycle variability in terms of IMEP when compared to spark ignition engines. This improvement results from the fact that a short combustion period takes place at almost constant volume, close to TDC. In fact, cyclic variations in the start of combustion are high due to the spontaneous combustion initiation. It can be seen from Figure 11c that variations of 5% MFB between two consecutive cycles can be as high as 10 CAD. Oscillations of 5% MFB are clearly correlated with NVO indicated work, as shown in Figure 15a. This observation proves that auto-ignition timing is affected by NVO heat release in the highest extent. It should be noted that at all fuel injected during exhaust compression, the amount of heat released is only controlled by oxygen availability.
A plausible mechanism explaining cycle-by-cycle variability can be outlined as follows. High NVO heat release causes a drop in the amount of intake air. Less aspirated air and high IVO temperature increase the end of compression temperature and accelerate auto-ignition. Also, such a cycle is characterized by lower main event air excess and, thus higher combustion temperature. As a result, higher exhaust temperature reduces the mass of trapped residuals in the following cycle, additionally containing less oxygen. The straightforward consequence is a higher volumetric efficiency of the next cycle, lower temperature, and later auto-ignition. However, the following NVO period is characterized by a high amount of retained residuals with high oxygen content, which enhances heat release.
For the cases with the least quantity of fuel injected during exhaust compression, oscillations in NVO and main event parameters are less evident, as shown in Figures 12 and 13. The amplitudes are lower and durations are shorter. The reason for a lower intensity of oscillations is the fact that amount of heat released during NVO is controlled by the amount of fuel injected at SOI 1 rather than the amount of trapped residuals. As a result, the mechanism described above does not excite oscillations. Also, the correlations among parameters are weaker, as shown in Figures 14 and 15 and a lower dispersion of the parameters can be observed. For intermediate fuel mass shares, not shown in the figures, intermediate oscillations intensities were observed as well. It can be seen from the figures that the oscillations of the analyzed parameters appear with repeatable patterns. Thus, in the next section statistical methods are applied to identify whether the analyzed parameters reveal deterministic behaviors.

3.4. Sample Entropy Analysis

The time series presented in the previous section exhibit the occurrence of repeating instabilities. However, it is necessary to identify if oscillations are originated from NVO phenomena or from the main event. We make use of sample entropy calculations in order to identify the origin of repeating instabilities in the experimental time series. Sample entropy analysis is a powerful tool for the analysis of short time series, avoiding the counting of self-matches [31]. To estimate the entropy of finite-length real world time series is not an easy task because only entropies of finite order can be computed numerically, and entropy is underestimated as the order becomes large. For finite length time series, the analysis of sample entropy statistics is recognized to be an adequate method to quantify the regularity in time series. The sample entropy (SE) was introduced by Richman and Moorman [28], based on a previous methodology called approximate entropy. Some advantages of sample entropy are that it is a robust method for short time series, does not count self-matches and is not based on a template-wise approach [28]. Briefly, SE(N) is constructed as follows: given a time series {x1, x2, …, xN}, of length N, it is estimated as follows [26,28]:
S E ( N ) ( m , r ) = ln U m + 1 ( N ) ( r ) U m ( N ) ( r )
where S E ( N ) ( m , r = 0.15 ) represents the probability that vector x(i,m) defined at the sampled time series point i, and characterized by the length m of the consecutive points [xi, …, xi+m-1] is close to a vector x(j,m) within the tolerance r for each element. In the limit of m → ∞ and r → 0, sample entropy is equivalent to order-2 Rényi entropy. Figures 16 and 17 show the computed values of sample entropy for the main event work and location of 5% MFB respectively, plotted against sample entropy of NVO work. All the calculations were made with the following parameters: N = 999, m = 2, and r = 0.15. The latter corresponds to 15% of standard deviation for the tolerance of the matching sets. A low value of SE reflects a high degree of regularity, whereas high values are assigned to more irregular, less predictable time series. We also show in Table 2 the sensitivity of the calculated values of S E ( N ) ( m , r ) to the parameter r by repeating the calculations for several values of r. The data in the table are obtained as the ratio between the standard deviation of the sample entropy when calculated for r = 0.1, 0.15, and 0.2 with respect to, S E ( N ) ( m , r = 0.15 ), considering as fixed N and m.
NVO work entropy reveals a peculiar effect. The most deterministic behavior of NVO work appears for the least fuel injected early, where the least intensive fuel NVO thermal effects can be observed, as seen in Figure 4. In this case both endothermic and exothermic reactions were supposed to be controlled solely by the fuel quantity. This behavior could be explained by an effect of variable temperature of trapped residuals. It is plausible because the main event work also exhibited the most deterministic behavior, as shown in Figure 16. However, overall high values of sample entropy for the main event work indicate that this parameter exhibits a fairly stochastic behavior. In other words, the main event work shows a noisy response to the NVO work. In contrast, locations of 5% MFB reveal rather deterministic patterns over all applied injection strategies and resulting mixture formation conditions, as shown in Figure 17. It should be noted that the highest values of sample entropy in terms of the main event work and location of 5% MFB can be observed for the single NVO injection strategy. This observation suggests that the main event combustion process is determined by NVO thermal effects, however, a carrier between consecutive NVO processes is not reflected in the main event.

4. Conclusions

The effects of fuel injection strategies on cycle-by-cycle variability in a gasoline HCCI engine running in a NVO mode were studied. At slightly lean (λ = 1.2) main event mixture split fuel injection technique was utilized. The first injection was applied during exhaust compression (40 CAD before NVO TDC) and the second injection was applied during exhaust expansion (40 CAD after NVO TDC) or during the intake process (120 CAD after NVO TDC). The split fuel injection rates were varied from whole fuel injected early during NVO to 75% of fuel injected with one of the second injection timings. The applied injection strategies resulted in variable NVO fuel reactions and thermal NVO effects which propagated towards the main event. The operating point of the engine was selected in the middle of its operation area. This kind of HCCI engine usually operates in a narrow range of load. To vary engine load, different valve timings (to control EGR rate) or variable λ can be applied. Obviously, different modes of variability would be achieved for stoichiometric mixtures (reduced NVO fuel oxidation) or for very diluted mixtures (low loads), close to the misfire limit, where incomplete combustion occurs in some cycles. However, we focused on the effects of different mixture formation strategies at moderate engine load. Within this perspective, the findings of this study could contribute to improve control techniques for this kind of engines. They could be summarized as follows:
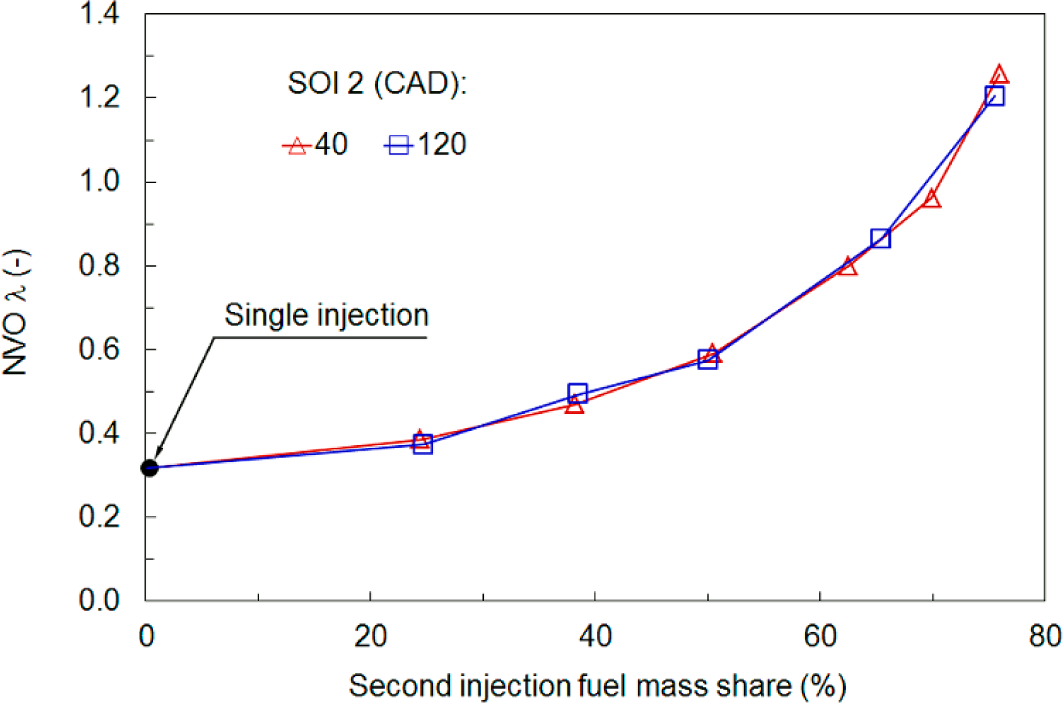
  • Early NVO injection into exhaust gas containing oxygen results in heat release during the NVO period. For a rich mixture conditions during NVO, the amount of heat released is limited by oxidizer availability, while for a lean mixture it decreases with decreasing amount of fuel injected. Nevertheless, the less fuel is injected during the exhaust re-compression the more indicated work is produced during the main event.
  • Correlations of NVO work with the main event work and combustion timing for separate cycles show that there is a strong coupling between NVO thermodynamics, main combustion work, and combustion timing. However, this coupling is more effective for whole fuel injected early in the NVO period. The higher the NVO work the earlier auto-ignition is observed, which is attributed to in-cylinder temperature at the beginning of the intake process. High values of NVO work result in a reduction of the main event work due to fuel heat utilization. At low NVO work stabilization in the main event work is observed. It is plausible that in such cycles all heat is released during the main event due to NVO oxygen deficiency.
  • We made use of sample entropy analysis in order to analyze the origin of repeating instabilities in the time series obtained from different injection strategies. Particularly, we investigated the propagation of NVO thermal effects towards the main event in terms of cycle-by-cycle variability. NVO work exhibits deterministic patterns while the main event work is fairly stochastic with noisy behavior. This suggests that there must be a cycle-by-cycle coupling carrier which, however, is not revealed by fuel heat utilization during the main event. A plausible explanation of this phenomenon can be associated to fluctuations in the air-fuel ratio which affect NVO thermochemistry in much higher extent than the main event combustion. Specifically, the most deterministic behavior of NVO work appears for the least fuel injected early. Single injection led to less predictable time series for the main event work as well as for the location of 5% MFB.

Acknowledgments

The research was supported by the Polish National Science Center under grant No. 2012/05/B/ST8/00077. Alejandro Medina acknowledges financial support from MINECO (Spain) under grant ENE2013-40644-R. Lev Guzmán-Vargas acknowledges COFAA-IPN, EDI-IPN and Conacyt (Mexico).

Author Contributions

Jacek Hunicz and Grzegorz Litak designed the experiments and performed experimental measurements as well as data preprocessing. Alejandro Medina performed time series analyses to select appropriate data processing methods. Pedro L. Curto-Risso and Lev Guzmán-Vargas performed entropy calculations and wrote the description of entropy analysis. Jacek Hunicz and Alejandro Medina wrote most of the paper; however, all authors significantly contributed to the content of the paper in its final version. All authors have read and approved the final manuscript.

Conflicts of Interest

The authors declare no conflict of interest.

References

  1. Lavy, J.; Dabadie, J.C.; Angelberger, C.; Duret, P.; Willand, J.; Juretzka, A.; Schäflein, J.; Ma, T.; Lendresse, Y.; Satre, A.; et al. Innovative ultra-low NOX controlled auto-ignition combustion process for gasoline engines: The 4-SPACE project. SAE Tech. Pap. 2000. [Google Scholar] [CrossRef]
  2. Fuerhapter, A.; Piock, W.F.; Fraidl, G.K. CAI-controlled auto-ignition—the best solution for the fuel consumption—vs. emission trade-off? SAE Tech. Pap. 2003. [Google Scholar] [CrossRef]
  3. Fitzgerald, R.P.; Steeper, R.R. Thermal and chemical effects of NVO fuel injection on HCCI combustion. SAE Int. J. Engines. 2010, 3, 46–64. [Google Scholar] [CrossRef]
  4. Song, H.H.; Edwards, C.F. Optimization of recompression reaction for low-load operation of residual-effected HCCI. SAE Tech. Pap. 2008. [Google Scholar] [CrossRef]
  5. Aroonsrisopon, T.; Nitz, D.; Waldman, J.; Foster, D.E.; Lida, M. A computational analysis of direct fuel injection during the negative valve overlap in an iso-octane fueled HCCI engine. SAE Tech. Pap. 2007. [Google Scholar] [CrossRef]
  6. Hunicz, J. An experimental study of negative valve overlap injection effects and their impact on combustion in a gasoline HCCI engine. Fuel 2014, 117, 236–250. [Google Scholar] [CrossRef]
  7. Puranam, S.V.; Steeper, R.R. The effect of acetylene on iso-octane combustion in an HCCI engine with NVO. SAE Int. J. Engines. 2012, 5, 1551–1560. [Google Scholar] [CrossRef]
  8. Yu, W.; Xie, H.; Chen, T.; Li, L.; Song, K.; Zhao, H. Effects of active species in residual gas on auto-ignition in a HCCI gasoline engine. SAE Tech. Pap. 2012. [Google Scholar] [CrossRef]
  9. Cao, L.; Zhao, H.; Jiang, X.; Kalian, N. Investigation into the effect of injection timing on stoichiometric and lean CAI operations in a 4-stroke GDI engine. SAE Tech. Pap. 2006. [Google Scholar] [CrossRef]
  10. Koopmans, L.; Ogink, R.; Denbratt, I. Direct gasoline injection in the negative valve overlap of a homogeneous charge compression ignition engine. SAE Tech. Pap. 2003. [Google Scholar] [CrossRef]
  11. Lau, C.S.; Tsolakis, A.; Wyszynski, M.L. Biogas upgrade to syn-gas (H2–CO) via dry and oxidative reforming. Int. J. Hydrog. Energy. 2011, 36, 397–404. [Google Scholar] [CrossRef]
  12. Mamalis, S; Babajimopoulos, A.; Assanis, D.; Borgnakke, C. A modeling framework for second law analysis of low-temperature combustion engines. Int. J. Engine Res 2014, 15, 641–653. [Google Scholar] [CrossRef]
  13. Saxena, S.; Shah, N.; Bedoya, I.; Phadke, A. Understanding optimal engine operating strategies for gasoline-fueled HCCI engines using crank-angle resolved exergy analysis. Appl. Energy. 2014, 114, 155–163. [Google Scholar] [CrossRef]
  14. Koopmans, L.; Backlund, O.; Denbratt, I. Cycle to cycle variations: Their influence on cycle resolved gas temperature and unburned hydrocarbons from a camless gasoline compression ignition engine. SAE Tech. Pap. 2002. [Google Scholar] [CrossRef]
  15. Daw, C.S.; Wagner, R.M.; Edwards, K.D.; Green, J.B. Understanding the transition between conventional spark-ignited combustion and HCCI in a gasoline engine. Proc. Combust. Inst. 2007, 31, 2887–2894. [Google Scholar] [CrossRef]
  16. Sen, A.K.; Litak, G.; Edwards, K.D.; Finney, C.E.A.; Daw, C.S.; Wagner, R.M. Characteristics of cyclic heat release variability in the transition from spark ignition to HCCI in a gasoline engine. Appl. Energy. 2011, 88, 1649–1655. [Google Scholar] [CrossRef]
  17. Hellström, E.; Stefanopoulou, A.; Vavra, J.; Babajimopoulos, A.; Assanis, D.; Jiang, L.; Yilmaz, H. Understanding the dynamic evolution of cyclic variability at the operating limits of HCCI engines with negative valve overlap. SAE Int. J. Engines. 2012, 5, 995–1008. [Google Scholar] [CrossRef]
  18. Ghazimirsaied, A.; Koch, C.R. Controlling cyclic combustion timing variations using a symbol-statistics predictive approach in an HCCI engine. Appl. Energy. 2012, 92, 133–146. [Google Scholar] [CrossRef]
  19. Maurya, R.K.; Agarwal, A.K. Statistical analysis of the cyclic variations of heat release parameters in HCCI combustion of methanol and gasoline. Appl. Energy. 2012, 89, 228–236. [Google Scholar] [CrossRef]
  20. Chang, J.; Filipi, Z.S.; Assanis, D.N.; Kuo, T.W.; Najt, P.M.; Rask, R. Characterizing the thermal sensitivity of a gasoline homogeneous charge compression ignition engine with measurements of instantaneous wall temperature and heat flux. Int. J. Engine Res. 2005, 6, 289–309. [Google Scholar] [CrossRef]
  21. Song, K.; Xie, H.; Li, L.; Lu, J.; Li, C.; Gao, Z. Disturbance observation and rejection method for gasoline HCCI combustion control. SAE Tech. Pap. 2013. [Google Scholar] [CrossRef]
  22. Hunicz, J.; Geca, M.; Rysak, A.; Litak, G.; Kordos, P. Combustion timing variability in a light boosted controlled auto-ignition engine with direct fuel injection. J. Vibroeng. 2013, 15, 1004–1012. [Google Scholar]
  23. Ravi, N.; Liao, H.; Jungkunz, A.F.; Widd, A.; Gerdes, J.C. Model predictive control of HCCI using variable valve actuation and fuel injection. Control Eng. Pract. 2012, 20, 421–430. [Google Scholar] [CrossRef]
  24. Glewen, W.J.; Wagner, R.M.; Edwards, K.D.; Daw, C.S. Analysis of cyclic variability in spark-assisted HCCI combustion using a double Wiebe function. Proc. Combust. Inst. 2009, 32, 2885–2892. [Google Scholar] [CrossRef]
  25. Bidarvatan, M.; Shahbakhti, M.; Jazayeri, S.A.; Koch, C.R. Cycle-to-cycle modeling and sliding mode control of blended-fuel HCCI engine. Control Eng. Pract. 2014, 24, 79–91. [Google Scholar] [CrossRef]
  26. Daw, C.S.; Kennel, M.B.; Finney, C.E.A.; Connolly, F.T. Observing and modelling nonlinear dynamics in an internal combustion engine. Phys. Rev. E. 1998, 57, 2811–2819. [Google Scholar]
  27. Litak, G.; Kaminski, T.; Rusinek, R.; Czarnigowski, J.; Wendeker, M. Patterns in the combustion process in a spark ignition engine. Chaos Soliton Fractal 2008, 35, 565–578. [Google Scholar] [CrossRef]
  28. Richman, J.S.; Moorman, J.R. Physiological time-series analysis using approximate entropy and sample entropy. Am. J. Physiol. 2000, 278, H2039–H2049. [Google Scholar]
  29. Hunicz, J.; Kordos, P. An experimental study of fuel injection strategies in CAI gasoline engine. Exp. Therm. Fluid Sci 2011, 35, 243–252. [Google Scholar] [CrossRef]
  30. Olesky, L.M.; Vavra, J.; Assanis, D.; Babajimopoulos, A. Effects of charge preheating methods on the combustion phasing limitations of an HCCI engine with negative valve overlap. J. Eng. Gas Turbines Power 2012, 134, 112801–112812. [Google Scholar] [CrossRef]
  31. Kantz, H.; Schreiber, T. Nonlinear Time Series Analysis; Cambridge University Press: Cambridge, UK, 1997. [Google Scholar]
Figure 1. Schematic representation of the experimental engine setup.
Entropy 17 00539f1
Figure 2. Engine operating cycle with depicted valve timings and injection timings.
Entropy 17 00539f2
Figure 3. NVO air excess ratio with respect to second injection fuel mass shares.
Entropy 17 00539f3
Figure 4. Heat release rate during NVO when all the fuel is injected early and also for split fuel injection.
Entropy 17 00539f4
Figure 5. In-cylinder temperature during NVO when all the fuel injected early and also for split fuel injection.
Entropy 17 00539f5
Figure 6. Average values of fuel conversion rates into NVO indicated work for all the applied fuel mass shares and second injection timings.
Entropy 17 00539f6
Figure 7. Average values of fuel conversion into main event indicated work for all the analyzed fuel mass shares and second injection timings.
Entropy 17 00539f7
Figure 8. Average locations of 5% MFB for all the analyzed fuel mass shares and second injection timings.
Entropy 17 00539f8
Figure 9. Pressure-volume diagrams for variable second injection fuel mass share at SOI 2 = 120 CAD.
Entropy 17 00539f9
Figure 10. Histories of in-cylinder temperature during the main event for variable second injection fuel mass share at SOI 2 = 120 CAD.
Entropy 17 00539f10
Figure 11. Engine cycle parameters for 1000 consecutive engine cycles; whole fuel injected at SOI = −40 CAD.
Entropy 17 00539f11
Figure 12. Engine cycle parameters for 1000 consecutive engine cycles; split fuel injection, 75% of fuel injected at SOI 2 = 40 CAD.
Entropy 17 00539f12
Figure 13. Engine cycle parameters for 1000 consecutive engine cycles; split fuel injection, 75% of fuel injected at SOI 2 = 120 CAD.
Entropy 17 00539f13
Figure 14. Correlation of main event work vs. NVO work for 1000 analyzed cycles: single injection (a); 75% of fuel injected at SOI 2 = 40 CAD (b), and 75% of fuel injected at SOI 2 = 120 CAD (c).
Entropy 17 00539f14
Figure 15. Location of 5% MFB vs. NVO work for 1000 analyzed cycles: single injection (a), 75% of fuel injected at SOI 2 = 40 CAD (b); and 75% of fuel injected at SOI 2 = 120 CAD (c).
Entropy 17 00539f15
Figure 16. Sample entropy of main event work vs. sample entropy of NVO work.
Entropy 17 00539f16
Figure 17. Sample entropy of location of 5% MFB vs. sample entropy of NVO work.
Entropy 17 00539f17
Table 1. Engine specifications.
Displaced Volume498.5 cm3
Bore84 mm
Stroke90 mm
Compression ratio11.7
Number of valves2
Intake valve lift3.6 mm
Intake valve opening87 CAD
Intake valve closing217 CAD
Exhaust valve lift2.9 mm
Exhaust valve opening515 CAD
Exhaust valve closing634 CAD
Negative valve overlap173 CAD
Fuel-rail pressure10 MPa
Table 2. Influence of the parameter r on the calculated sample entropy, S E ( N ) ( m , r )(see text for details).
Injection strategyNVO WorkMain Event WorkLocation of 5% MFB
Single0.14060.26220.2222
40 CAD; 25%0.18550.02240.1769
40 CAD; 50%0.14100.08720.2534
40 CAD; 75%0.12020.15520.1527
120 CAD; 25%0.17450.19000.1325
120 CAD; 50%0.14260.08210.2044
120 CAD; 75%0.14240.21210.1805

