1. Introduction
A widely-recognized property of language is Zipf’s law, in which the frequency of words exhibits a power law behavior in terms of the rank, that is if
is the frequency of a word and
r the rank of that word, then
, with
[
1]. As is well known, language is a system composed of grammatical rules applied to a vocabulary or lexicon, where the words represent an essential unit, and the order or sequence is related to the need to transmit information or ideas [
2]. Since Zipf discovered this property in the 1940s, several studies have focused on this direction and recently, other properties, such as information content [
2], polarities and information [
3], recurrence times [
4], correlations [
5,
6,
7], allometries [
8,
9], the length of words [
2,
10,
11], and many others [
12,
13,
14,
15,
16,
17].
For instance, Piantadosi
et al. [
2] found that the word length has a non-linear relationship with the frequency and that an efficient communication process is concomitant with the fact that the word length increases with information content. Furthermore, Garcia
et al. [
3] noted that words with positive emotional content are used more often, and they tend to carry less information than negative ones. In the same direction, other studies have noted the important role of word length in meaning, emotional and information content in the organization of human language. Particularly, word length has been systematically studied in quantitative linguistics since 1851, when August de Morgan suggested the use of word lengths as a hallmark of the text style and a possible factor in determining authorship [
11]. For a review about this topic, see [
18]. Recently, Chen
et al. [
19] reported that the increase of word length is an essential ingredient in the evolution of written Chinese. These recent studies have contributed new approaches to the complex analysis of texts and, at the same time, have opened up new questions about the underlying complexity of language, particularly in written texts. For example, longer words are more likely to be used to express more abstract ideas [
3].
An important trait of written texts is the appearance of temporal correlations as ideas or stories are created. However, the direct evaluation of these correlations is not feasible, because words can be used in different manners, which can make a quantitative analysis difficult. In past years, diverse methods have been used to explore the presence of temporal correlations in texts [
5,
20,
21], mainly focused on the length or frequency of words. Very recently, it has been reported that there are some differences between European languages when they are compared in terms of the frequency and correlations of the word lengths [
11]. As is recognized, written language is the conformation of grammar properties and semantic connotations with the purpose of expressing ideas or information. It has been reported that the temporal organization of word-length sequences from written texts can be characterized by the presence of slightly positive correlations [
5,
20] and with local variations of the scaling exponents related to the temporal organization of the texts [
21].
However, these studies have not considered the temporal organization over a wide dataset of large literary texts, where the concatenation of ideas or stories is the most important trait. In this work, we study the “temporal” correlations of word lengths in large literary texts by means of the natural visibility graph algorithm (NVG) [
22]. Specifically, we consider 30 ebooks in the English language from which we extract the word-length time series. To evaluate the presence of correlations in the word-length sequences, we use the NVG to relate every two words [
22]. The NVG method has the advantage of providing potential further insight into the temporal organization of sequences, by exploring the emerging network structures in a quantitative manner. The NVG has been used to explore organizational features in complex time series from different systems ranging from chaotic signals [
23], heartbeat variability [
9] and economics to seismology [
24,
25].
Our results show that the resulting degree distribution follows a power law, , which exhibits two different regimes of correlations over the short and long distances between words. These findings are complemented with the application of the detrended fluctuation analysis (DFA) and the calculations of recurrence times.
The paper is organized as follows. In
Section 2, we provide a brief description of the NVG and the collection of texts that we studied. The results are described in
Section 3. Finally, some concluding remarks are given in
Section 4.
3. Results
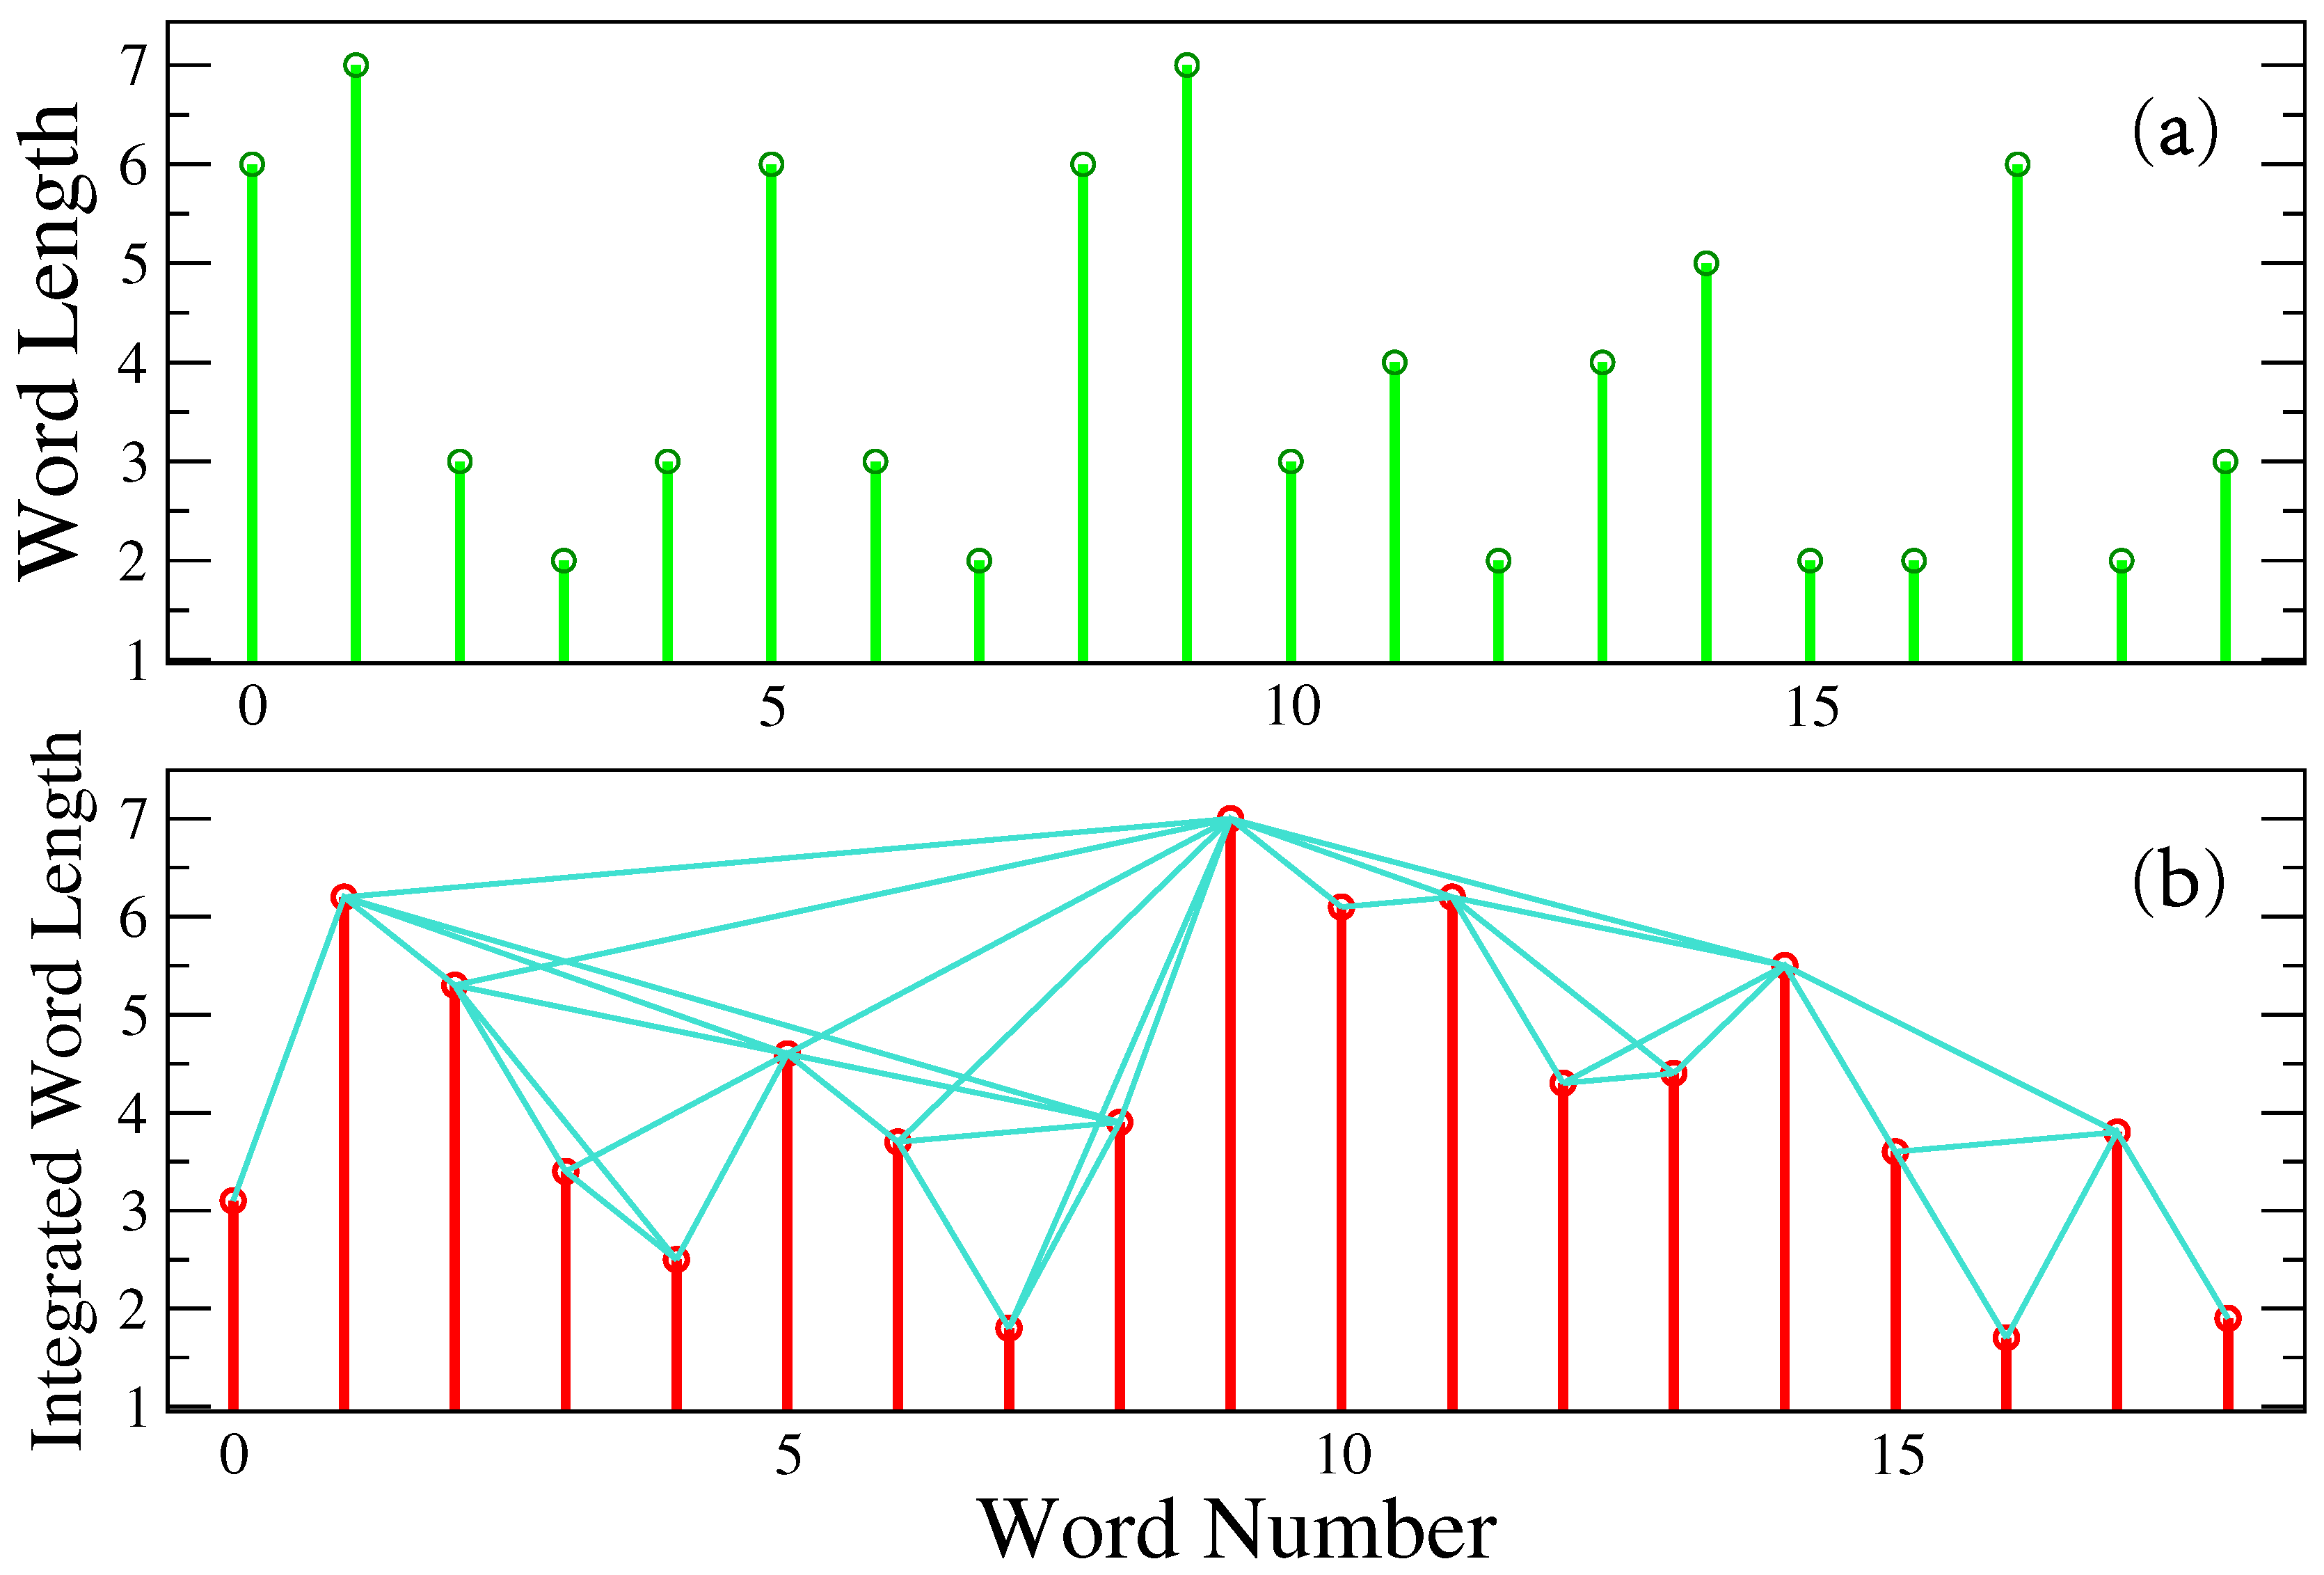
We consider the sequences of word- length obtained from the 30 books described above. We emphasize that the word length is given in terms of the number of letters forming a word. First, we notice that a direct application of the NVG to the word length sequences reveals that the NVG is highly inaccurate at capturing temporal correlation/organization structures in signals close to the transition from anti-persistent to persistent behavior [
23]. For a more reliable application of the NVG to the word-length data, the sequence
is first integrated to obtain the profile,
, where
is the
j-th word length,
is the mean value and
(see
Figure 2). In this way, the integrated signal is within the fractional Brownian motion regime, and the NVG provides more reliable information of the emerging networks by means of, for example, quantities, like the degree distribution.
The NVG was applied to the integrated word length sequences in the dataset to get the corresponding networks, where nodes are the words (length value), and a link exists if there is a direct visibility between two values in the sequence, as shown in
Figure 2.
Figure 2.
(a) Representative word-length sequence. (b) Visibility graph method applied to the integrated sequence of word lengths. Two values are connected if there is “visibility” between them.
Figure 2.
(a) Representative word-length sequence. (b) Visibility graph method applied to the integrated sequence of word lengths. Two values are connected if there is “visibility” between them.
The number of nodes of the resulting networks correspond to the number of words in the original literary text, while the order (number of edges) depends on the “visibility” restriction. First, we construct the probability degree distribution
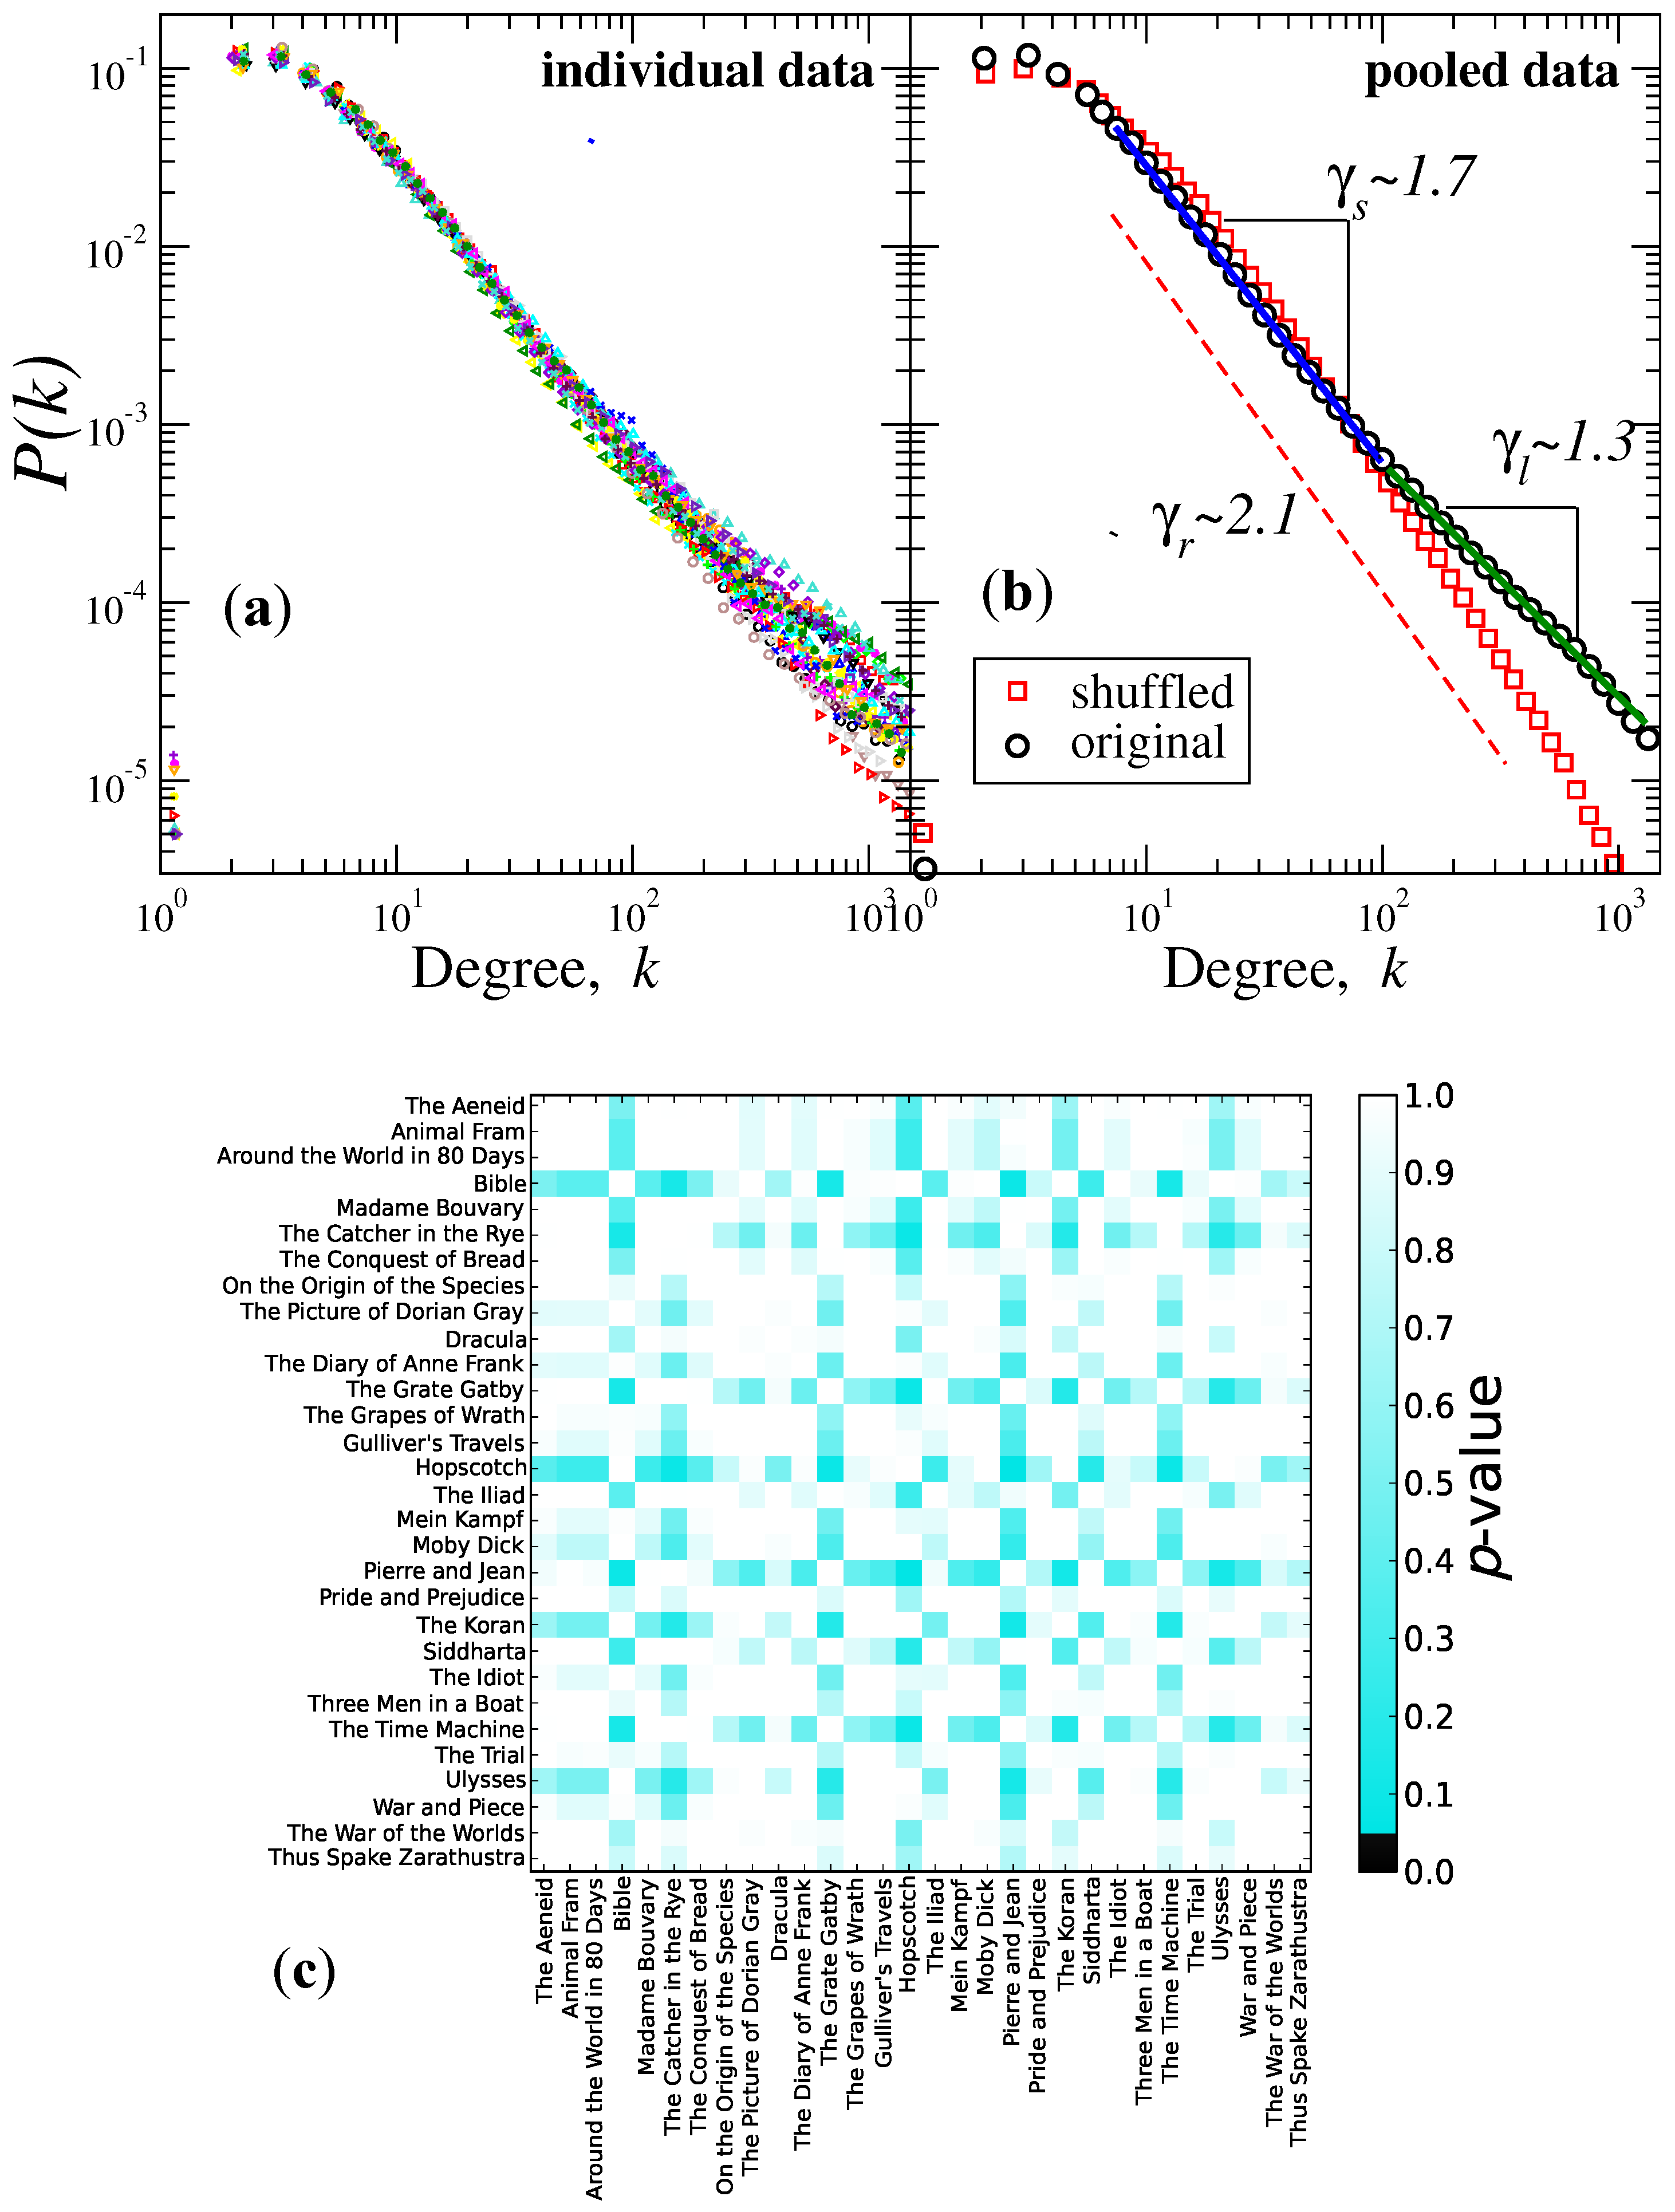
from this network in order to characterize the connectivities. In
Figure 3a, we depicted the degree distribution of the visibility networks from individual data. We find that a power-law behavior is observed for each book (
Figure 3a), that is
, with approximately two regimes; for the range
, the average exponent is
, while for
, the value is
. A significant difference is observed between
and
when comparing both groups of exponents (
p-value
by student’s test). It is important to evaluate the extent to which these distributions from different books correspond to the same distribution. To this end, we used the Kolmogorov–Smirnov (K-S) test to accept or reject the null hypothesis that any pair of distributions (books) has the same distribution. We computed the
p-value between the cumulative distributions from all of the pairs of books.
In
Figure 3b,c, we present the results obtained from the application of the K-S test to our dataset. We observe that, at the
level of significance, in all cases, we accept the null hypothesis that any two books have the same distribution, justifying that we can pool the data (degrees) from all books to get better statistics (see the caption of
Figure 3 for a description). The results of pooling the data are shown in
Figure 3b, where we find that
is consistent with a power law with two regimes separated by the crossover degree scale located at
; over short scales, the probability of degrees decays following an exponent
, which is bigger than the one corresponding to the large scales
, confirming that the connectivities exhibit two different tendencies.
Figure 3.
Visibility graph method (natural visibility graph (NVG)) analysis. Degree distributions of the degree probability versus the degree k of the number of visible connections from the graph of the integrated word-length sequences. (a) Log-log plot of vs. k of individual data. We observe that each book follows an overall function of the form , but with two apparent regimes having different exponents. (b) As in (a), but for pooled original and shuffled data. The original data follow a power-law function with two regimes separated by the degree scale value ; over short degree values, the scaling exponent is , while for large scales, . We also show the distribution from shuffled data, and we observe that they follow a power law with exponent value . (c) The matrix of p-values from the application of the Kolmogorov–Smirnov (K-S) test to all pairs of individual distributions shown in (a). We observe that at the level of significance, for all of the books in our dataset, we cannot reject the null hypothesis that any pair of books has the same distribution. Therefore, we can pool the degree data from all of the texts and improve the statistics.
![Entropy 17 07798 g003]()
Lacasa
et al. [
23] have reported that the exponent
, which characterizes the connectivities in fractional Brownian motion (fBm), is related to the exponent of power spectrum
β through the relationship
. Since our work here is based on the NVG analysis of the integrated word-length series, the corresponding relationship for the increments (
i.e., the original word-length values) would be
, with
[
27]. Given our values of
and
, this means that the corresponding exponents of the power spectrum are given by
and
, in agreement with previous results obtained for small datasets [
5,
20,
21].
For a comparison, we repeated our procedure, but for the case of randomized versions of the word-length sequences,
i.e., the initial word-length series are shuffled in order to destroy correlations, and then, the NVG is applied to construct the degree distribution of those integrated series. The results are shown in
Figure 3b for the case of pooled data. The randomized data lead to a degree distribution, which follows a power law
, with
. According to the relation
, the shuffled data lead to the value
, in good agreement with the expected exponent for uncorrelated sequences.
We also compared these results from the NVG with the detrended fluctuation analysis (DFA) [
28]. The DFA is a reliable method to detect long-range correlations in time series. In the DFA, the original time series is integrated; the resulting series is divided into boxes of size
n, and for each box, a straight line is fitted to the points. Next, the root-mean-square fluctuation
is computed of the detrended sequence within each box. If a scaling function of the form
is present, then the correlation exponent
characterizes the original signal. It is known that
corresponds to white noise (non-correlated signal) and that
corresponds to a long-range correlated process. In many cases, the scaling behavior in the fluctuation is not expressed through a single exponent, and two or more of them are necessary to characterize the signal [
29,
30]. For these cases and in order to get a good estimation of the
α-values and the crossover point, we consider the following procedure: given the statistics of
, a sliding pointer along the scale
n is considered to perform linear regression fits to the values on the left and to the elements on the right. At each position of the pointer, we calculate the errors in the fits (
and
), monitor the total error defined by
and find the position of the minimum of
. We then define two stable exponents (
and
) as the power law fit to the left and right, respectively, of
. For our data,
reaches its minimum value, and the position of the crossover point is within the interval
.
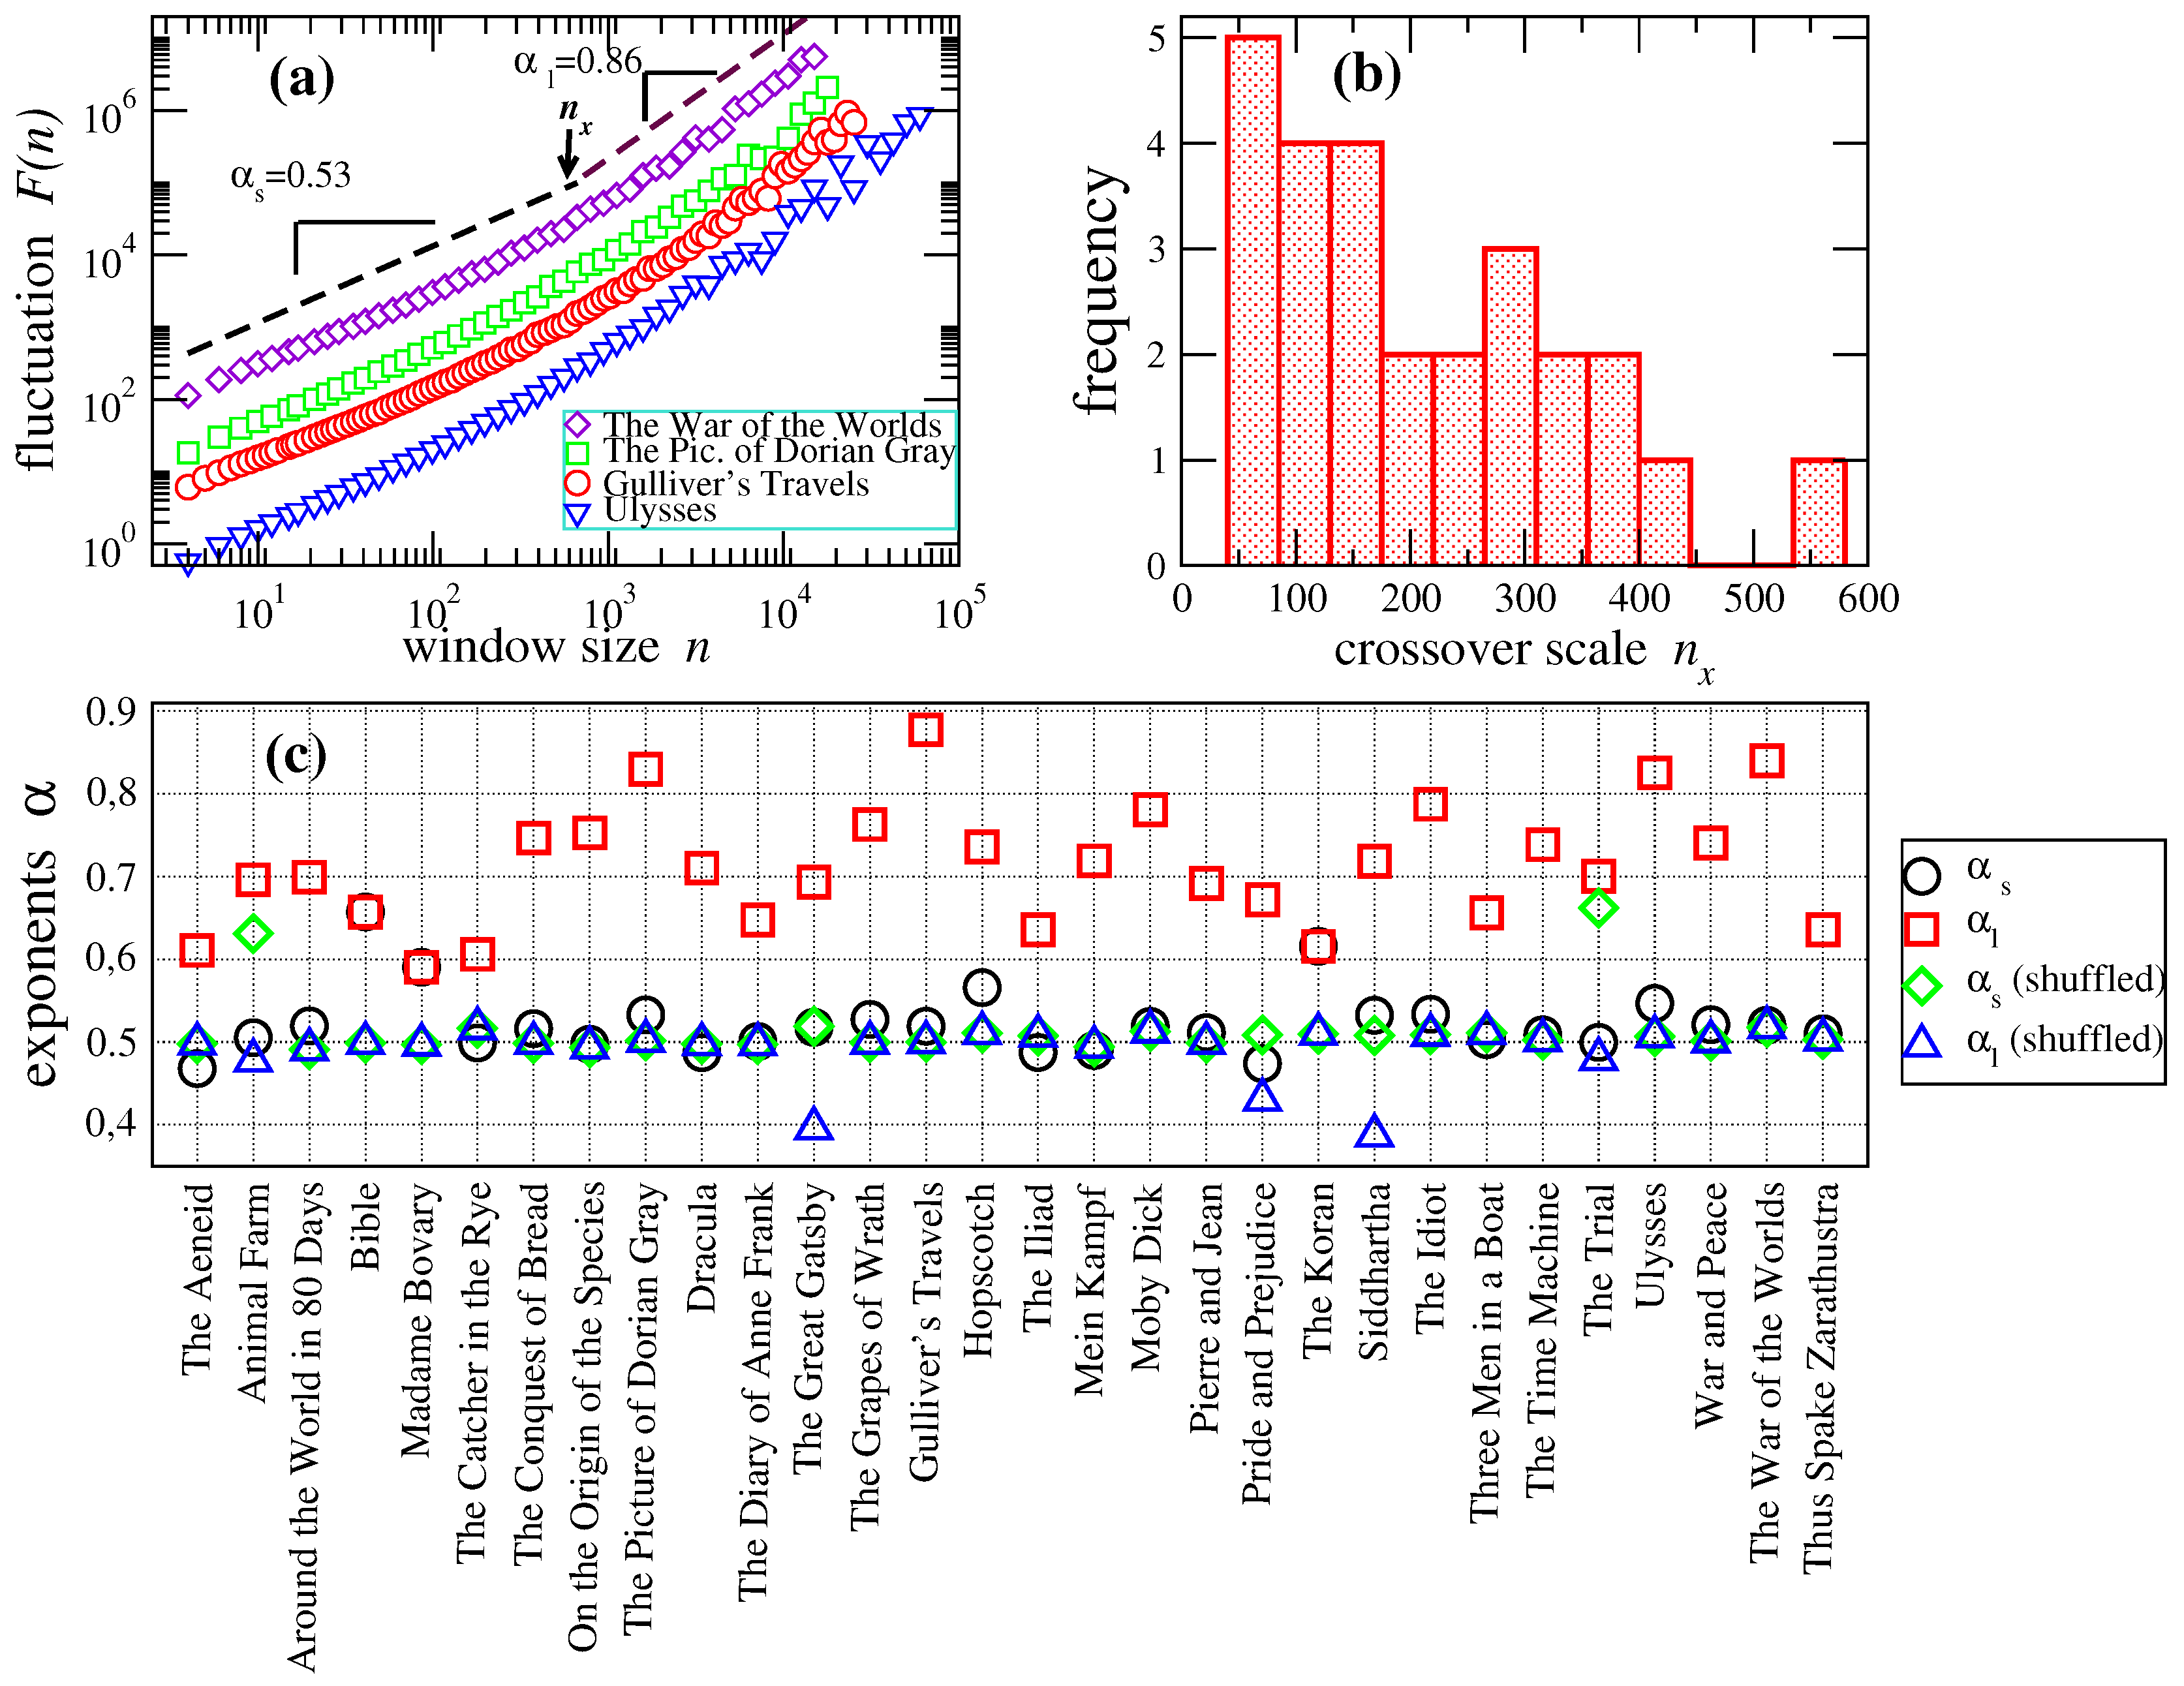
We use the DFA method to verify the presence of long-range correlations in the word-length sequences. We notice that in this case, the DFA method is applied to the original world-length series. As shown in
Figure 4, the scaling behavior is characterized by two regimes; over short scales (
), the average exponent is
, whereas for large scales (
), the value is
. We observe that for short scales, the average exponent is close to
, indicating an uncorrelated behavior, while over large scales, the average exponent is larger than
, revealing a persistent behavior with long-range correlations. A significant difference is observed between
and
for the whole dataset (
p-value
by Student’s test). For a comparison, we shuffled the original word-length sequences in order to destroy correlations and repeated our procedure. The results are also depicted in
Figure 4.
Figure 4.
Detrended fluctuation analysis (DFA). Correlation exponents and of the detrended fluctuation analysis (DFA) for the books in the dataset. (a) Plots of vs. n for four representative cases of crossover scaling in word-length sequences from the books The Picture of Dorian Grey, Gulliver’s Travels, Ulysses and The War of Worlds. Two regimes in the exponent values are identified, and they are separated by the crossover scale , as is indicated. (b) Histogram of crossover scale position for the DFA data. Most of the cases lie between the range of a 50–400 window size. (c) Correlation exponents α for the 31 books in our study. Here, the exponents’ values were determined by means of two linear fittings for which the error is minimum (see the text for details). For most cases, the scaling exponents () from the small scales (squares) are close to that for the randomized data from the small and large scales (diamonds, triangles), indicating that there are no significant correlations in word lengths at small distances between the words. This contrasts with the behavior of most of the data at large scales (squares), where () indicates the presence of positive long-range correlations. However, for three books, The Bible, Madame Bovary and The Koran, the exponent values, and , at both small and large scales, are the same.
![Entropy 17 07798 g004]()
For all books, both scaling exponents collapse to the value of
, confirming that the randomization procedure has destroyed the correlations. We notice that the correlation exponents from large scales are not uniform, and some deviations with respect to the mean are observed for specific texts, such as
Gulliver’s Travels,
The Picture of Dorian Grey,
Ulysses and
The War of the Worlds, which exhibit an exponent value above
. It is also worth noticing that the obtained values of DFA exponents are in qualitative concordance with the values observed under the visibility method, according to the relationships
and
[
28,
31]; the exponents
α and
γ are related through
. Given our values of
(
), the corresponding exponents of the power spectrum and degree distribution are given by
(
) and
(
), respectively. We recall that the results from the DFA indicate that for small scales, there is very weak correlation, while for large scales, there are positive correlations, consistent with our results from the NVG.
Next, in order to test the presence of memory effects in word-length sequences, we consider the return times of word-length values equal or bigger than a given threshold [
32]. The return time is given by the number of word lengths until the word length in question appears again. The threshold lengths
are considered. For each value of
, we construct the cumulative probability distribution of the return times of all of the books in our study.
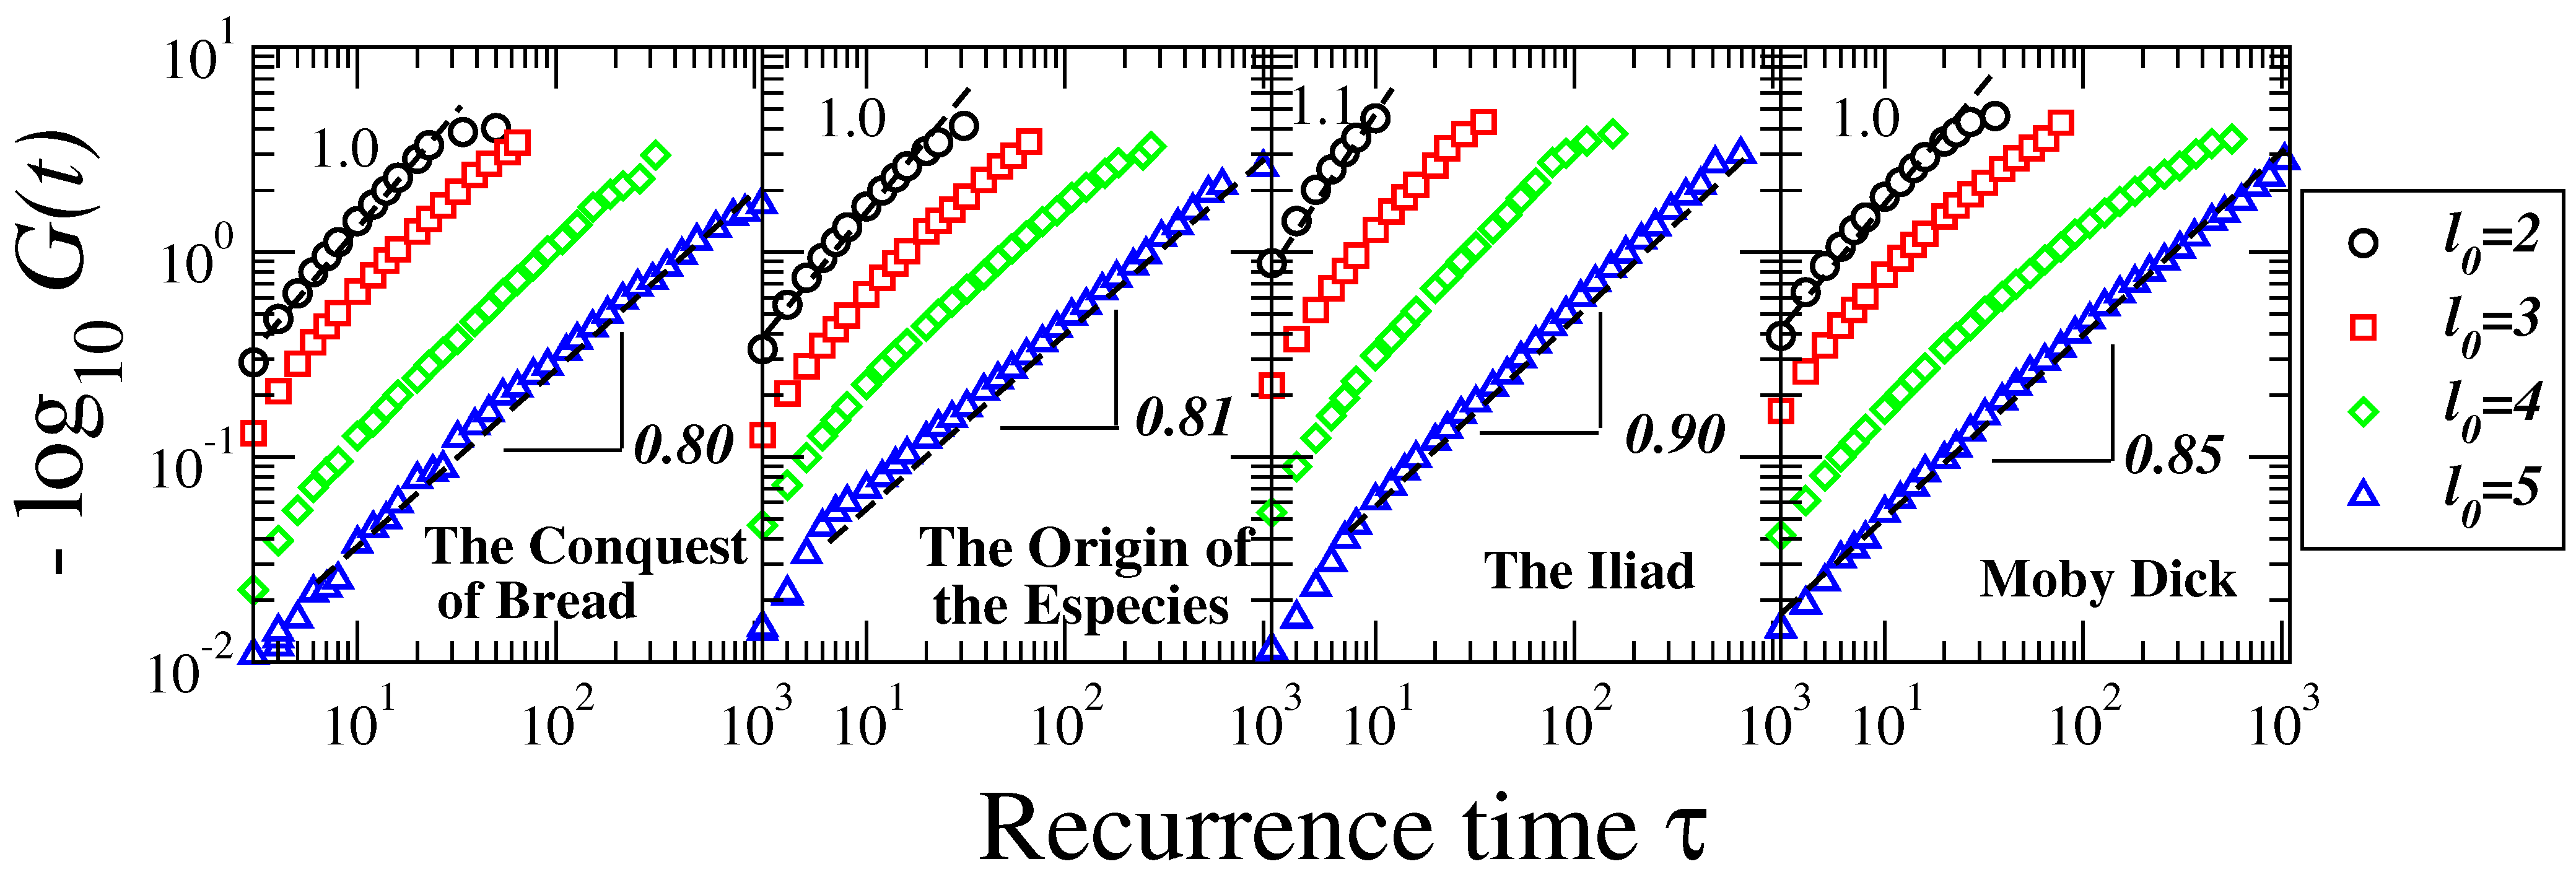
Figure 5 shows four representative cases of the calculations. We observe that the return times for all thresholds can be approximately described by a stretched exponential distribution of the form
, with
a and
b two fitting parameters, which reveal the information of the behavior of the distribution. This distribution is more skewed than a single exponential distribution and less skewed than a power law distribution. As
, it approaches a single exponential distribution, and as
, it approaches a power-law distribution. The fits to the individual data lead to the average values
,
,
and
, where the subindex indicates the threshold value.
Figure 5.
Recurrence time analysis. Plot of
versus. recurrence time
τ for four representative books in our study. We show the cases of threshold values
(circles),
(squares),
(diamonds) and
(triangles). The exponent
here represents the single exponential case, while
is a stretched exponential distribution. Consistent with the NVG and DFA analysis in
Figure 3 and
Figure 4, the exponent
b is closer to one, indicating no memory effects in word length for small values and
indicating the presence of memory in return intervals of large word-length values.
As shown in
Figure 5, for
, the distributions are close to the exponential limit, indicating that the mechanism of selecting a word with a length equal to or above the threshold is time independent and can be explained as a simple Poisson process. As the value of the threshold increases, the value of
b decreases, revealing that the burstiness of larger words tends to increase. This burstiness in larger words is also consistent with our results that the structure of the correlations changes at larger scales as these larger words appear at lower frequency and, therefore, over larger scales in the text.


