Article

Improved LMD, Permutation Entropy and Optimized K-Means to Fault Diagnosis for Roller Bearings

1
The School of Electronic and Electrical Engineering, Shanghai University of Engineering Science, 333, Long Teng Road, Shanghai 201620, China
2
Mechanical Engineering Department, Virginia Tech MC-0238, 332 Randolph Hall, Blacksburg, VA 24060, USA
*
Author to whom correspondence should be addressed.
These authors contributed equally to this work.
Submission received: 18 December 2015 / Revised: 28 January 2016 / Accepted: 5 February 2016 / Published: 25 February 2016
(This article belongs to the Special Issue Wavelets, Fractals and Information Theory I)

Abstract

:
A novel bearing vibration signal fault feature extraction and recognition method based on the improved local mean decomposition (LMD), permutation entropy (PE) and the optimized K-means clustering algorithm is put forward in this paper. The improved LMD is proposed based on the self-similarity of roller bearing vibration signal extending the right and left side of the original signal to suppress its edge effect. After decomposing the extended signal into a set of product functions (PFs), the PE is utilized to display the complexity of the PF component and extract the fault feature meanwhile. Then, the optimized K-means algorithm is used to cluster analysis as a new pattern recognition approach, which uses the probability density distribution (PDD) to identify the initial centroid selection and has the priority of recognition accuracy compared with the classic one. Finally, the experiment results show the proposed method is effectively to fault extraction and recognition for roller bearing.

1. Introduction

Roller bearings are the most common parts and play the key role in rotating machinery system. Under the working conditions of high-speed and heavy-load, varying degrees of failures always appear in different locations of bearings which are probably related almost 50% of all motor faults [1]. In order to monitor the health condition of bearings, the vibration-based signal processing techniques are seen as the most valid methods for diagnosing the roller bearing faults due to vibration signals accompanies with a lot of useful information of failures [2,3]. Furthermore, it is generally accepted that vibration-based signal processing techniques consist of two major aspects: fault feature extraction and fault pattern recognition [4].
Currently there are many techniques have been put forward to extract the fault characteristics from the vibration signals such as time-domain analysis, frequency-domain analysis , time-frequency analysis and so on [5]. Nevertheless, the vibration signals in most cases reveal the features of non-linear, non-Gaussian and non-stationary, the traditional time and frequency domain analysis techniques based on linear system may never be suitable for detecting the faults from those vibration signals [6]. Therefore, much research has been done on time-frequency analysis and proved that it could effectively detect dynamic changes of those vibration signals. The short time Fourier transformation (STFT) [7] cannot catch the higher time and frequency resolution meanwhile. The Wigner-Ville distribution (WVD) [8] would be influenced by cross-term interference easily when dealing with the multi component. And the wavelet transform (WF) [9,10] has an advantage over them because the local features in both time and frequency domains would be provided and the sharp components which is drowned by the background signals would be distinguished. Whereas all of them whose certain parameters, such as the time width and bandwidth, the window function and the mother wavelets, are fixed in advance share a common limit and possess no self-adaptive feature in nature [11].
One of the well-known techniques of self-adaptive time-frequency decomposition techniques is empirical mode decomposition (EMD) [12]. EMD could decompose a complicated signal into several intrinsic mode functions (IMFs) and verify the basic oscillation mode of the effective signal in essence by combining with Hilbert transform. But it is precisely because of this combination that it has many problems such as boundary effect, mode mixing and over and undershoot problems.
Another is called local mean decomposition (LMD) which is proposed by Jonarhan S. Smith and first used in EEG field [13]. Compared with EMD, LMD offers a way directly to the calculations of the instantaneous amplitude (IA) and instantaneous frequency (IF) of each product function (PF) which is the product of an amplitude envelope signal and a purely frequency modulated signal, avoiding running the HT. However, the same as the EMD, inevitably the original LMD exists the problem of the edge effects caused by the local extreme points mainly. It’s unclear whether the left or the right points are applied as the extreme ones, so the envelop estimation function curve fitting the extremes could be unreasonable. Because of this, [14] and [15] propose the method of the extreme point extension and the mirror extension method to suppress the LMD edge effects respectively. The boundary waveform matching prediction method is shown in [16], including the Auto-Regressive and Moving Average Model (ARMA) prediction. These methods just extend the waveform both sides simply without thinking about the inner rules or characteristics of signals. An integral extension LMD [17] overcomes the drawbacks above and lacks of flexibility to find out the same waveform to extend. And on the basis, a new improved LMD will be detailed in this article. The new improved LMD adopts the signal’s self-similarity to lengthen two sides. The method not only takes inner discipline into account but it also is more flexibility than existing methods.
For roller bearing, vibration signals of different fault locations and different degrees of failures will show varying complexity, so they will have various PFs through LMD. In order to extract the representation information of faults, permutation entropy (PE) is proposed to measure it [18]. It has been successfully and widely applied in the signal processing because PE highlights the simplicity, robustness and reduces computational cost [19].
Once PE is taken as a feature factor to extract the fault information from the vibration signals, the obtained features are fed into optimized K-means to fault pattern recognition in this paper. Comparing with others classifiers, like support learning machine (SVM) [20], extreme learning machine (ELM) [21], optimized K-means which uses the probability density distribution (PDD) to identify the initial centroid selection requires less human intervention and less running time.
So, in this study, a novel method of improved LMD, permutation entropy and the optimized K-means will be proposed and used in the fault extraction and recognition.
This paper is organized as follows. Section 2 gives the review of traditional LMD method and the main steps of improved LMD. Section 3 described the permutation entropy and in Section 4, we are going to present the optimized K-means. The application of the proposed method will present in Section 5. Finally, the conclusion is drawn in Section 6.

2. The Improved Method of LMD Edge Effects

2.1. Review of LMD Method

Nowadays, there are too many papers for detailing to original LMD [3,22] and they can be summarized as follows.
1. Find out all the local extrema n i of the row signal x ( t ) , thus calculate the ith mean value m i and the ith envelope estimate a i respectively.
m i = ( n i + n i + 1 ) / 2
a i = | n i n i + 1 | / 2
2. The local means and the local envelope estimates are then separately smoothed using moving average method (MA) to get the mean function m 11 ( t ) and the local envelope function a 11 ( t ) .
3. Get a frequency modulated signal s 11 ( t ) .
s 11 ( t ) = ( x ( t ) m 11 ( t ) ) / a 11 ( t )
If the s 11 ( t ) is not a purely frequency modulated signal, regard it as the new original signal and repeat 1~3 until s 1 n ( t ) is, that is the envelop function a 1 ( n + 1 ) ( t ) equals to 1.
4. Multiply together the all envelope estimates obtained from the iterative process and then get the envelope signal a 1 ( t ) .
a 1 ( t ) = a 11 ( t ) a 12 ( t ) a 1 n ( t ) = k = 1 n a 1 k ( t )
5. Then, the first PF is formed from the product of the envelope signal a 1 ( t ) and the purely frequency modulated signal s 1 n ( t ) .
P F 1 = a 1 ( t ) s 1 n ( t )
6. Finally, separate the P F 1 from the x ( t ) to get a new signal. Repeat the whole process until u k ( t ) becomes constant or monotonic. So for, the raw signals can be reconstructed according to
x ( t ) = p = 1 k P F p ( t ) + u k ( t )

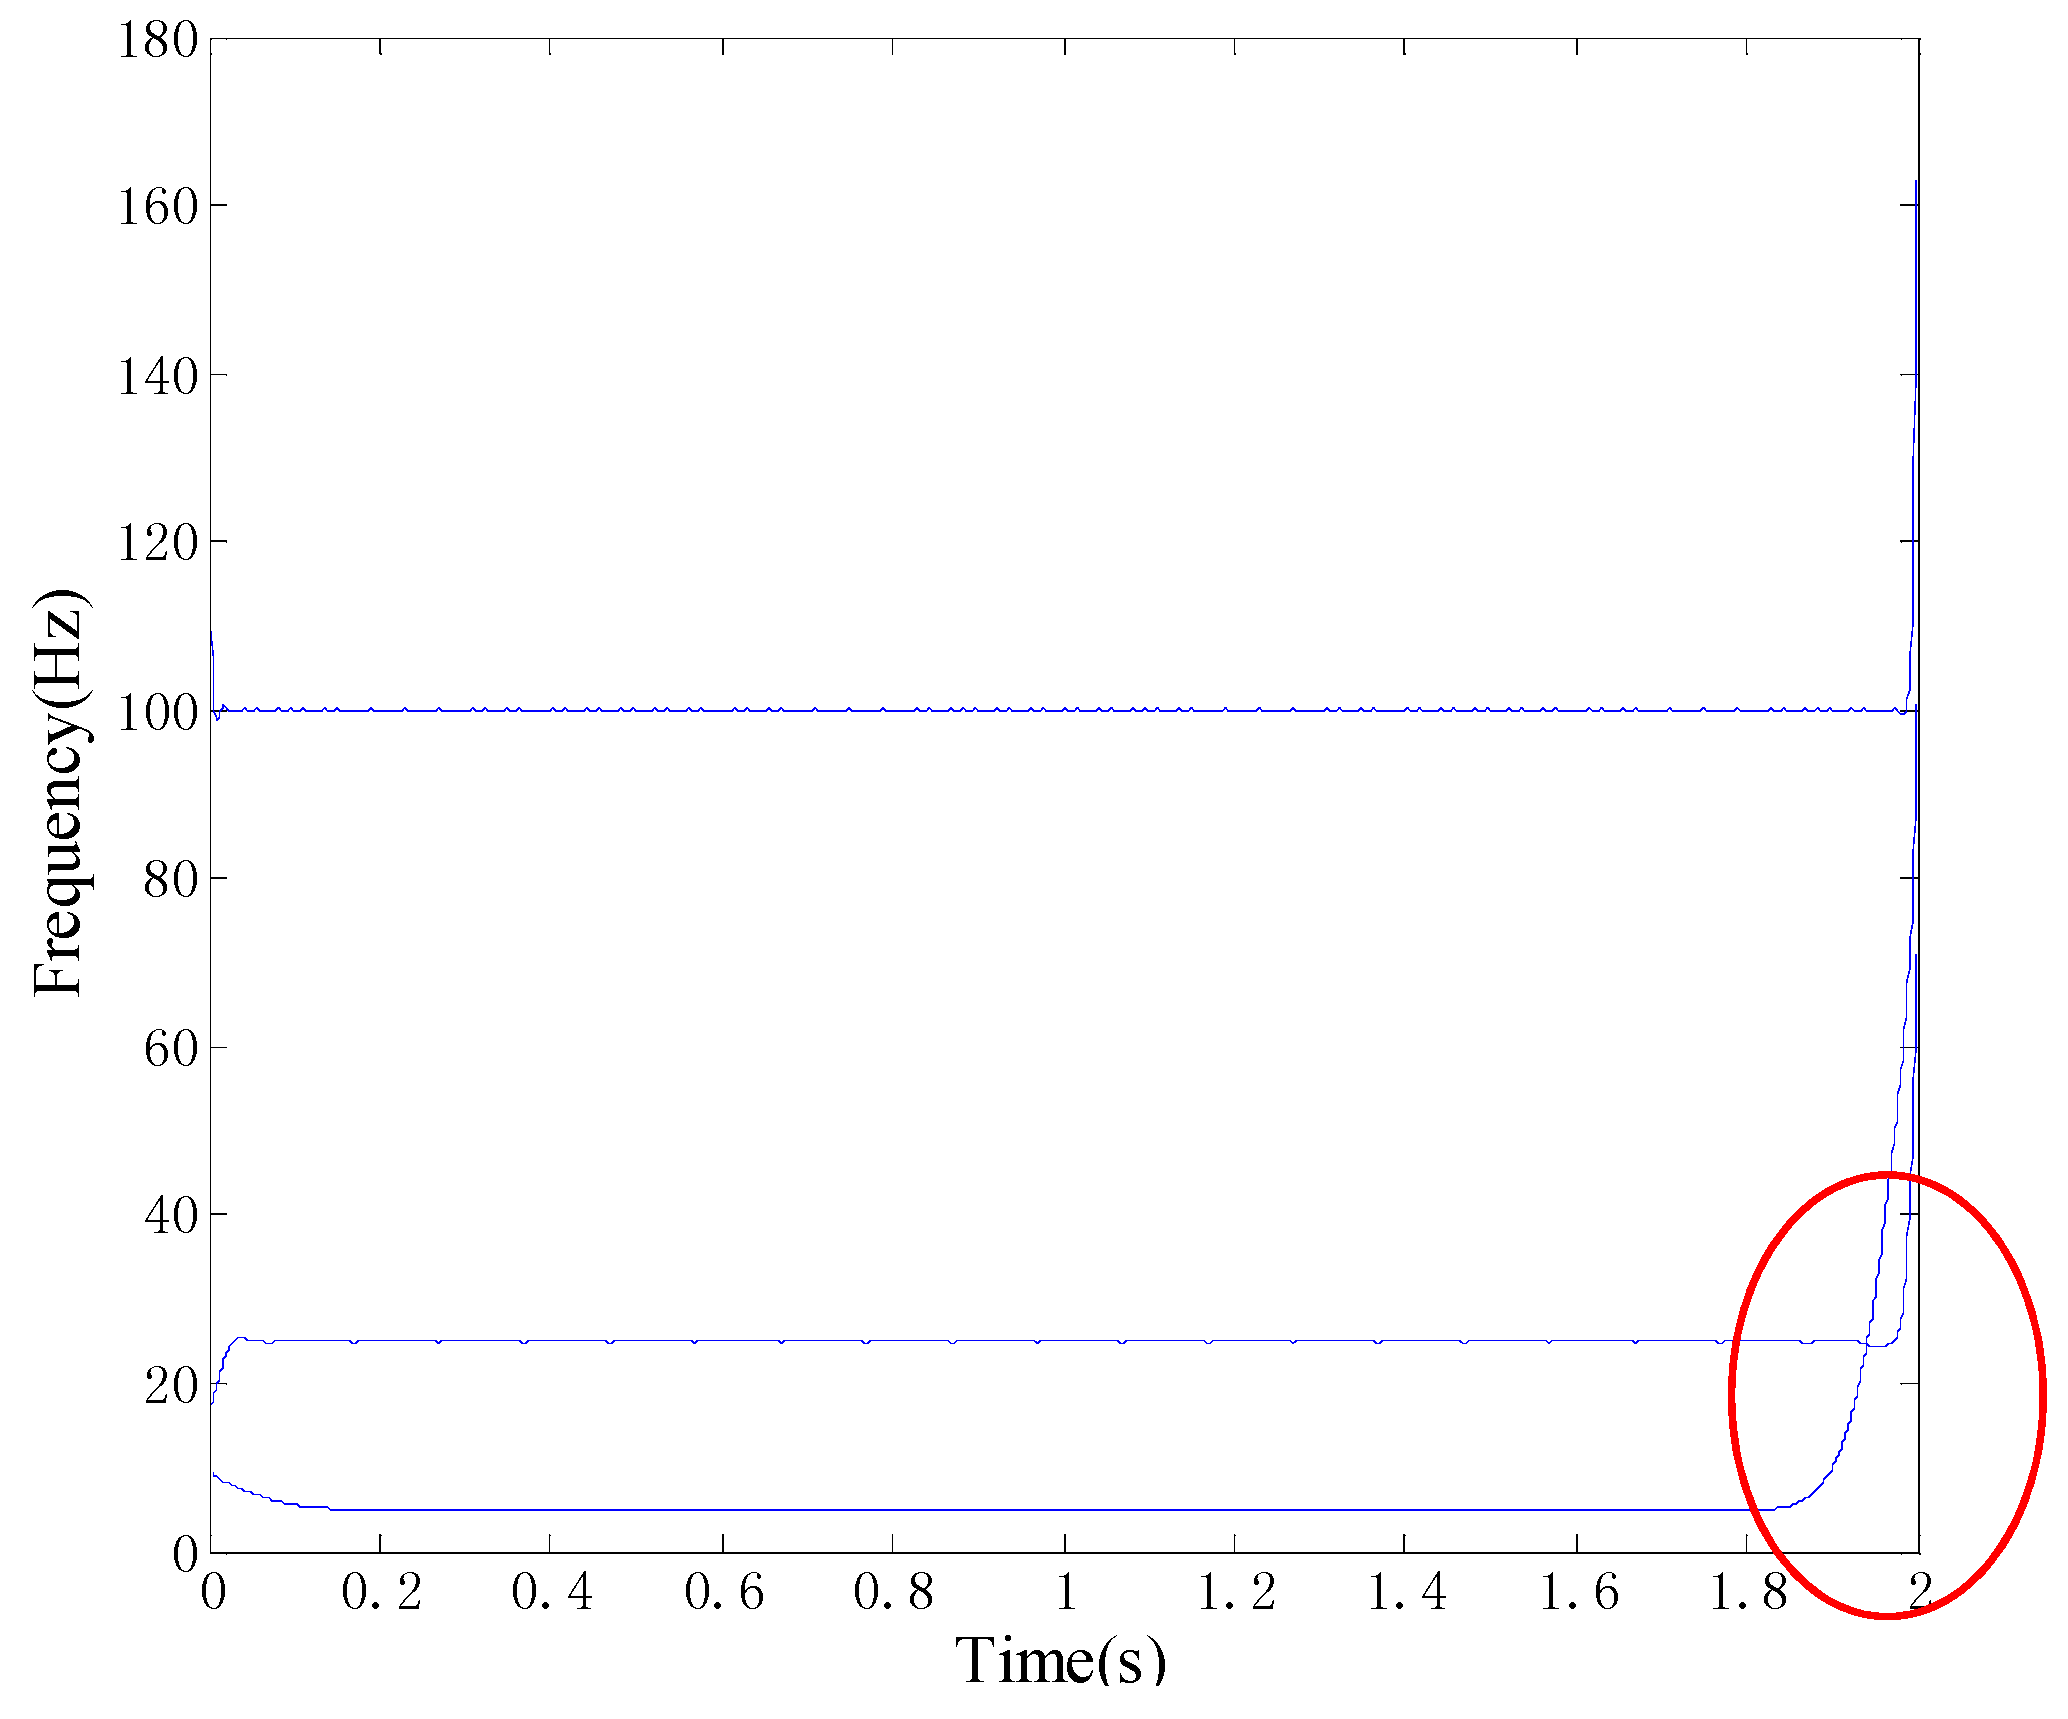
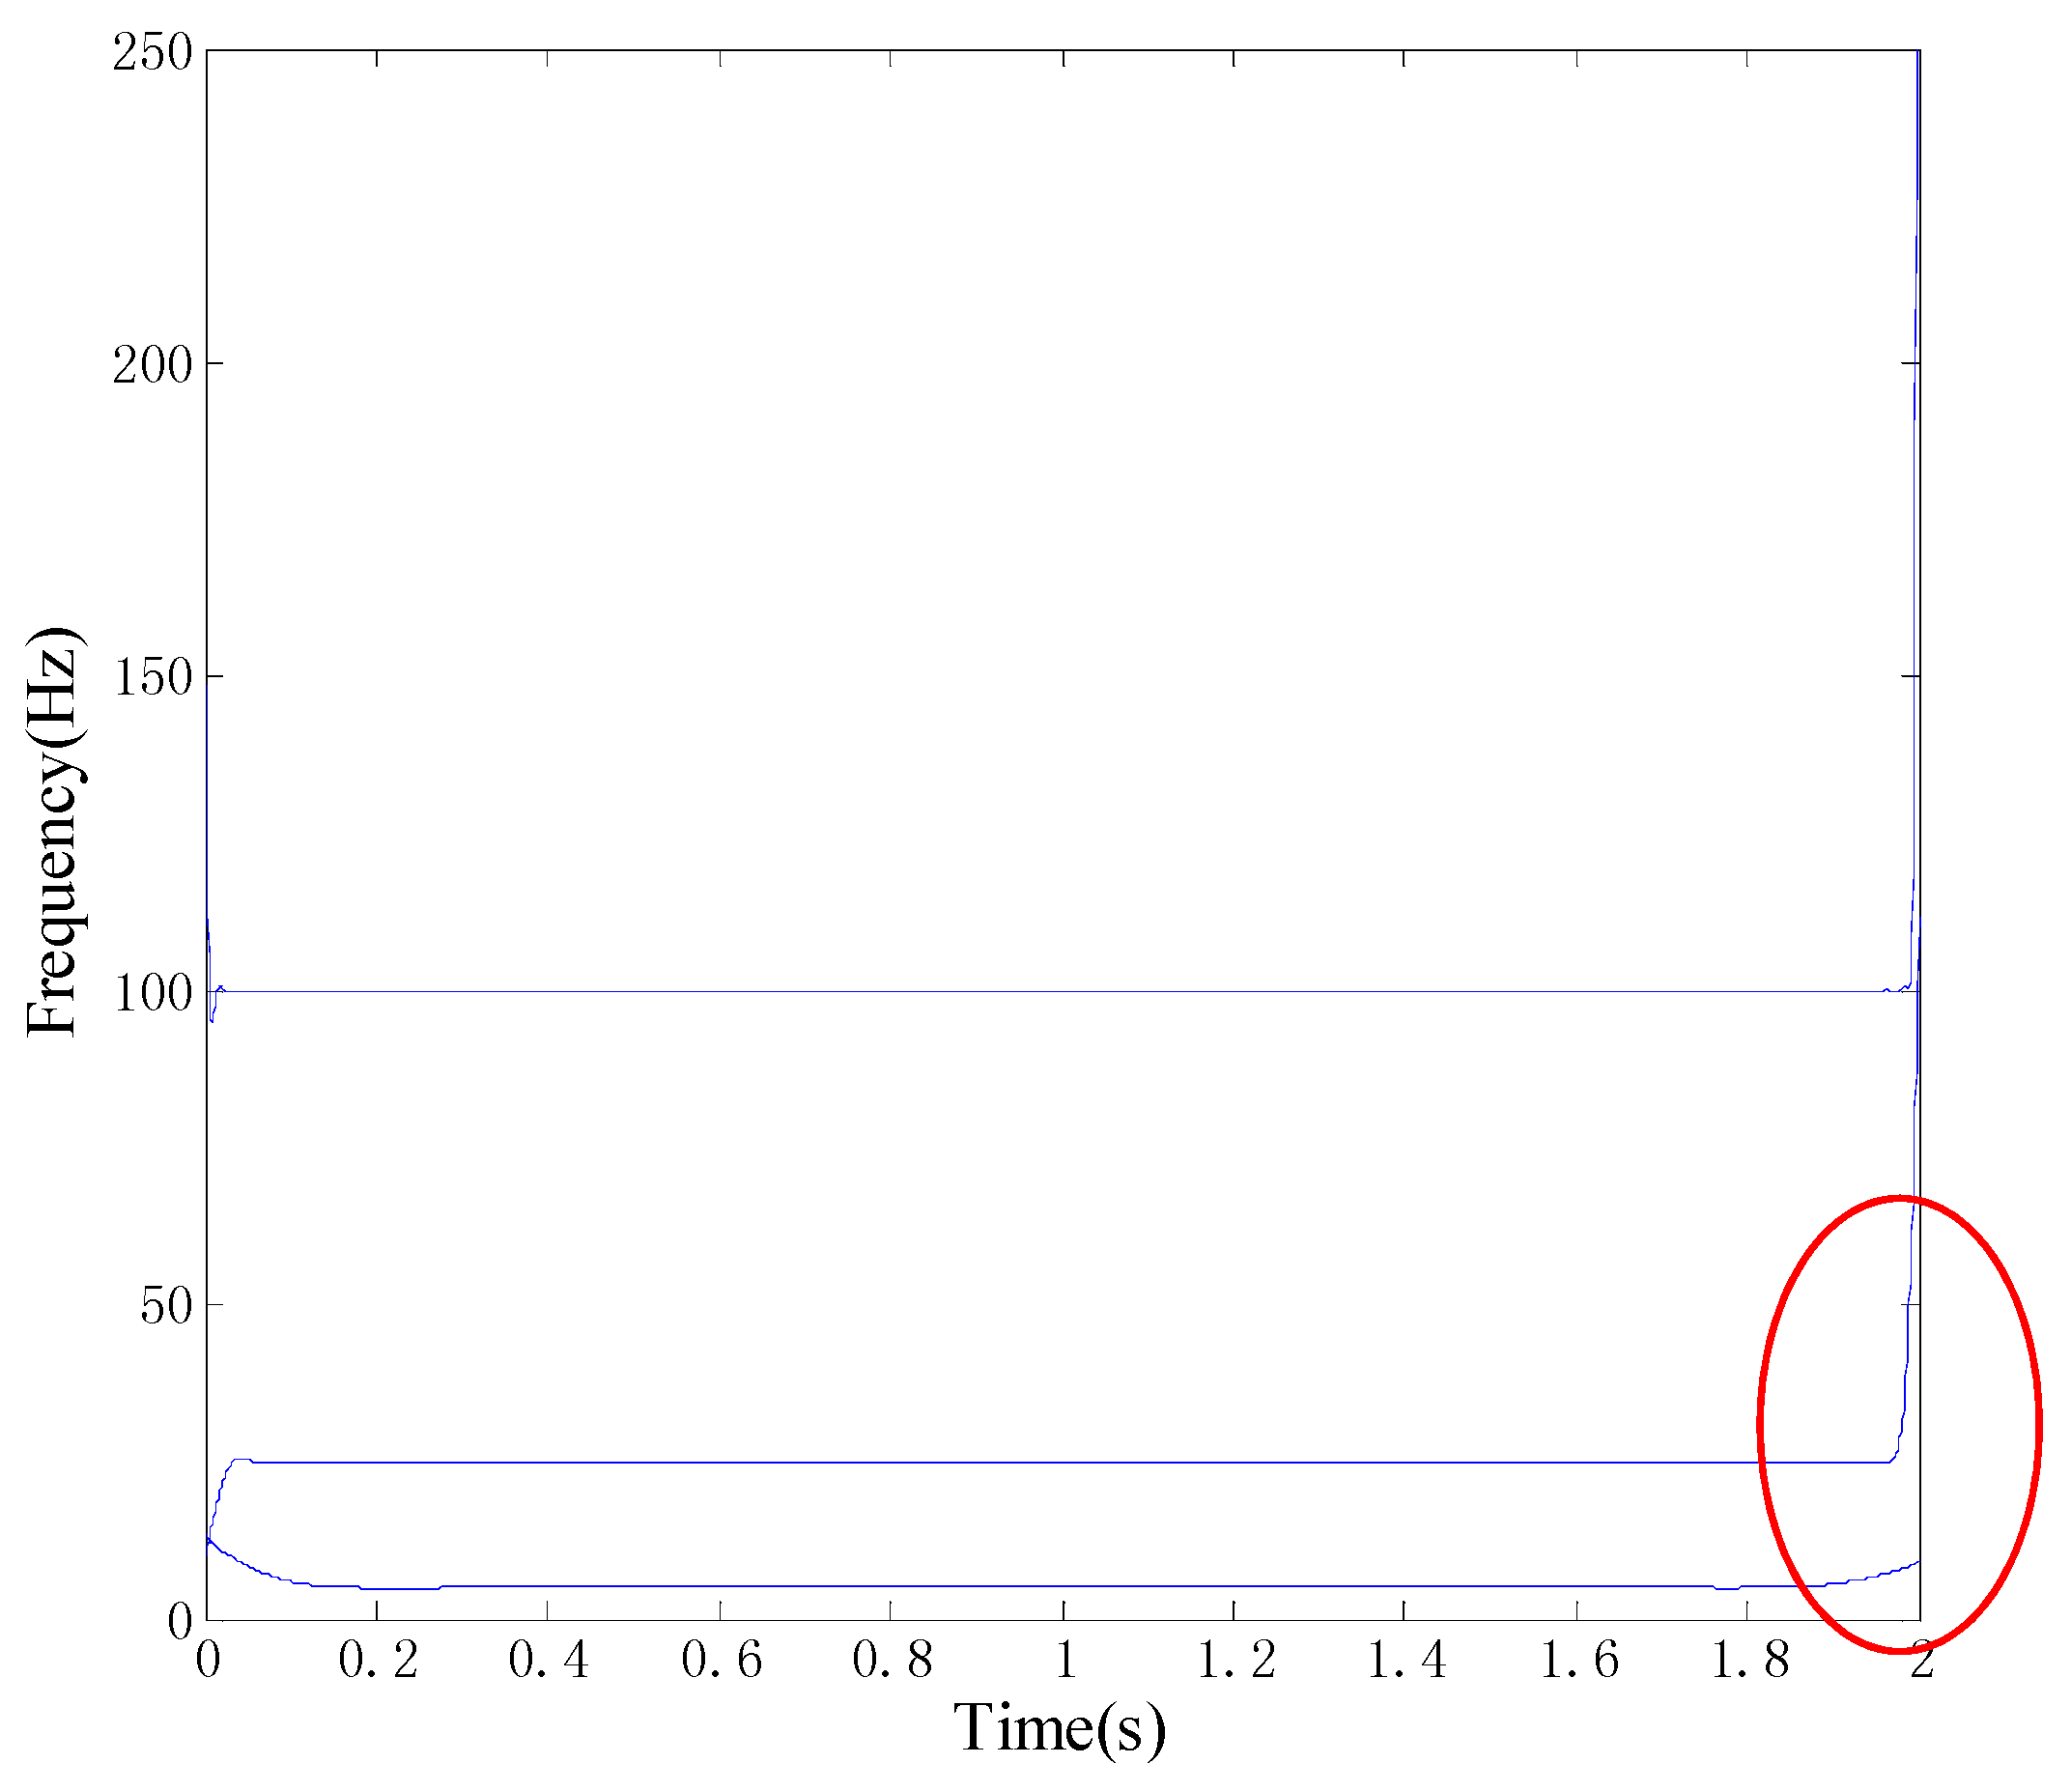
2.2.The Boundary Processing Method

Because of the nondeterminacy of local extreme points both at the beginning and at the end of finite-duration signals, border distortion or edge effect will appear. Here a multi-component AM-FM simulation signal x ( t ) is given.
{ x ( t ) = x 1 ( t ) + x 2 ( t ) + x 3 ( t ) x 1 ( t ) = cos ( 2 π 5 t ) x 2 ( t ) = 2 sin ( 2 π 25 t ) x 3 ( t ) = 3 cos ( 2 π 100 t )
where t = 0:1/1000:2, set sampling frequency 1000 Hz. The decomposition results of the simulation signal x ( t ) by original LMD are shown in Figure 1. From Figure 1, it can be clearly found that the row signal is decomposed into three PFs which are corresponding with x 1 ( t ) , x 2 ( t ) and x 3 ( t ) , respectively, and a constant residual R ( t ) , however, two sides of each PF appear the distorting phenomenon to different extent. Furthermore, the time-frequency representation can be obtained by combining IFs and IAs in Figure 2 with the phenomenon of “swing” for the edge effect. The “swing” for edges of signal waveform because of the existence of edge effect could lead to more errors in calculating the PE which is based on permutation patterns by comparing the neighboring values of the signal. In addition, with the increase of iterations, the divergence will gradually “pollute” whole process of decomposition and lead to fatal results ultimately.
In order to solve the problem of edge effect, this paper will propose a novel method to extend the signal—self-similar continuation. The self-similarity of signal refers to exactly or approximately similar to a part of itself and it is a typical property of fractals. In engineering, many kinds of signals are a fractal system with statistic self-similarity, either global or local self-similarity [23,24,25,26]. It is a solution based on waveform matching and makes the extension meet the trend of original signals as far as possible to maintain the inner rules or characteristic. Focus on the left extension, the left data is x ( 1 ) and m i , n i ( i = 1 , 2 , 3 ) are defined as the maximum and minimum value of the given signal x ( t ) with the corresponding time, t m i and t n i , respectively.
  • Build a characteristic waveform which is a triangular waveform based on x ( 1 ) m 1 n 1 three points.
  • Calculate the all start points x ( t x i ) and search the integration interval x ( i ) m i n i matching best the characteristic waveform. It’s a process of self-similarity and the corresponding time is achieved in Equation (3).
    t x i = t m 1 t n i t n 1 t m i t m 1 t n 1
  • Find out the best extension of signal through the shape error parameter e ( i ) without considering the order of magnitudes.
    e ( i ) = | m i x ( t m i ) t m i t x i | + | n i m i t n i t m i | | m 1 x ( t m 1 ) t m 1 t x 1 | + | n 1 m 1 t n 1 t m 1 |
  • Extend the right end by the same way. Meanwhile, the extended signal will be achieved.
Therefore, the decomposition results and the time-frequency representation of the mono-components derived from the improved LMD in Figure 3 and Figure 4. It is clearly found in Figure 3 and Figure 4 that the edge effect has improved a lot, especially near the right end of the time-frequency representation. Therefore, the analysis results validate that the improved LMD based on self-similar continuation can significantly decrease the border distortion.

3. Permutation Entropy

Permutation entropy calculates entropy based on permutation patterns by comparing the neighboring values of the time series [19]. It’s directly accounts for the temporal information contained in the time series to detect dynamical changes and contributes to the understanding of complex and chaotic systems.
For a given time series x = { x t : t = 1 , , N } , a vector composed of the Dth subsequent values is constructed
X i D = [ x ( i ) , x ( i + τ ) , x ( i + 2 τ ) , , x ( i + ( D 1 ) τ ) ]
D is the embedding dimension which determines how much information is contained in each vector and τ is the time delay, i = 1 , 2 , , N . X i D is a new time series and it has a permutation π j = ( j 1 , j 2 , , j D ) , if it satisfies that:
{ x ( i + ( j 1 1 ) τ ) x ( i + ( j 2 1 ) τ ) x ( i + ( j D 1 ) τ ) j s 1 < j s       i f     x ( i + ( j s 1 1 ) τ ) = x ( i + ( j s 1 ) τ )
Furthermore, the relative frequency for each distribution can be defined as:
p ( π j ) = # { X i D       h a s       t y p e       π j | 1 j N ( D 1 ) τ } N ( D 1 ) τ
According to the Shannon’s entropy of the D ! distinct symbols, PE of a time series can be defined as follow:
H p ( D ) = π j    S D p ( π j )    l n ( p ( π j ) )
For convenience, Equation (8) can be normalized by l n ( D ! ) .
H p = H p ( D ) / ( l n ( D ! ) ) = 1 l n ( D ! ) i = 1 k p ( π i )    l n ( p ( π i ) )
Obviously, Equation (5) indicates that two main parameters should be determined: the embedding dimension D and the time delay τ . The evaluation of the appropriate probability distribution relies on the embedding D , since D determines the number of accessible states, D ! . For practical purpose, it is adequate to use 3 D 7 and the value of τ = 1 to calculate the PE in [27].

4. K-means Clustering Algorithm

After fault features are extracted by improved LMD and PE, it is necessary to classify the condition of the roller bearings. K-means clustering algorithm has become the most popular method because its simplicity of idea, formulation of algorithm and good convergence for unsupervised clustering [28]. The detailed process of K-means clustering algorithm is described below.
  • Random initialization of cluster centroids for a given data set.
  • Calculate the distance between the cluster centroids and every point. Distribute these points to the cluster represented by the centroids according to the shortest distance principle.
  • Find out the mean value of every cluster and it could be seen as a new cluster centroid.
  • Compare the new centroid with the previous or check the cluster objective function’s convergence property. Repeat steps (2) and (3) until the cluster centroid remains unchanged or the function is convergence.
The clustering quality of K-means algorithm highly dependent upon the initialization of cluster centers. Because of the random initial selection, the clustering quality cannot get guarantee. So, this paper selects the peak of data set’s probability density curve as the initial value which called optimized K-means. In theory, a probability density function (PDF), or density of a continuous random variable is a function that describes the relative likelihood foe this random variable to take on a given value [29]. In other words, it could describe the probability of the points near the given values. In a way, it’s reasonable to choose the maximum of PDF as the initial center of K-means algorithm. In practice, we construct the 3-dimensional data set shown in Figure 5 to compare the optimized K-means with the traditional algorithm in classification accuracy and iterations. The results of comparison are partly shown in Table 1. As the Table 1 shows, the optimized K-means has superiority in classification accuracy at the same iterations.

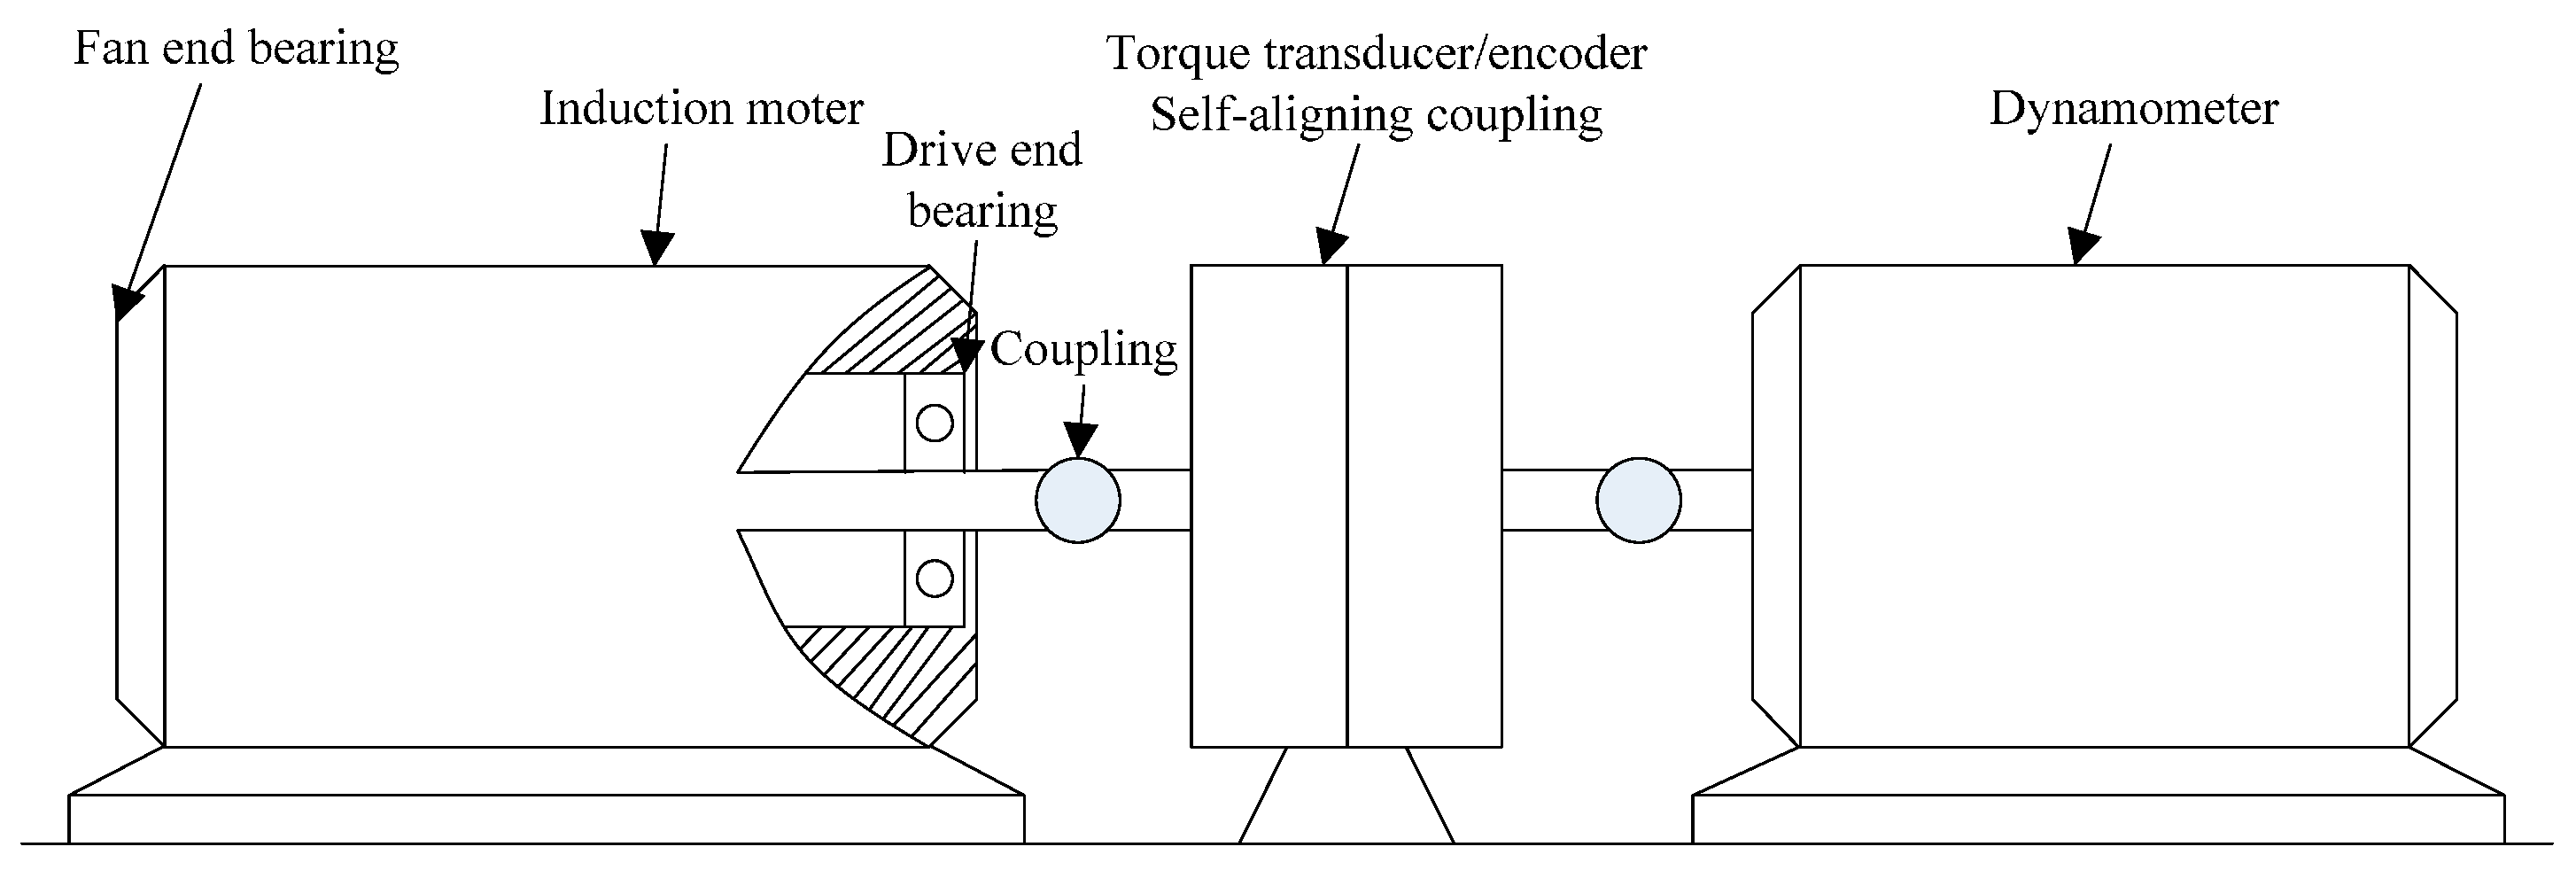
5. Application to Roller Bearing Fault Diagnosis

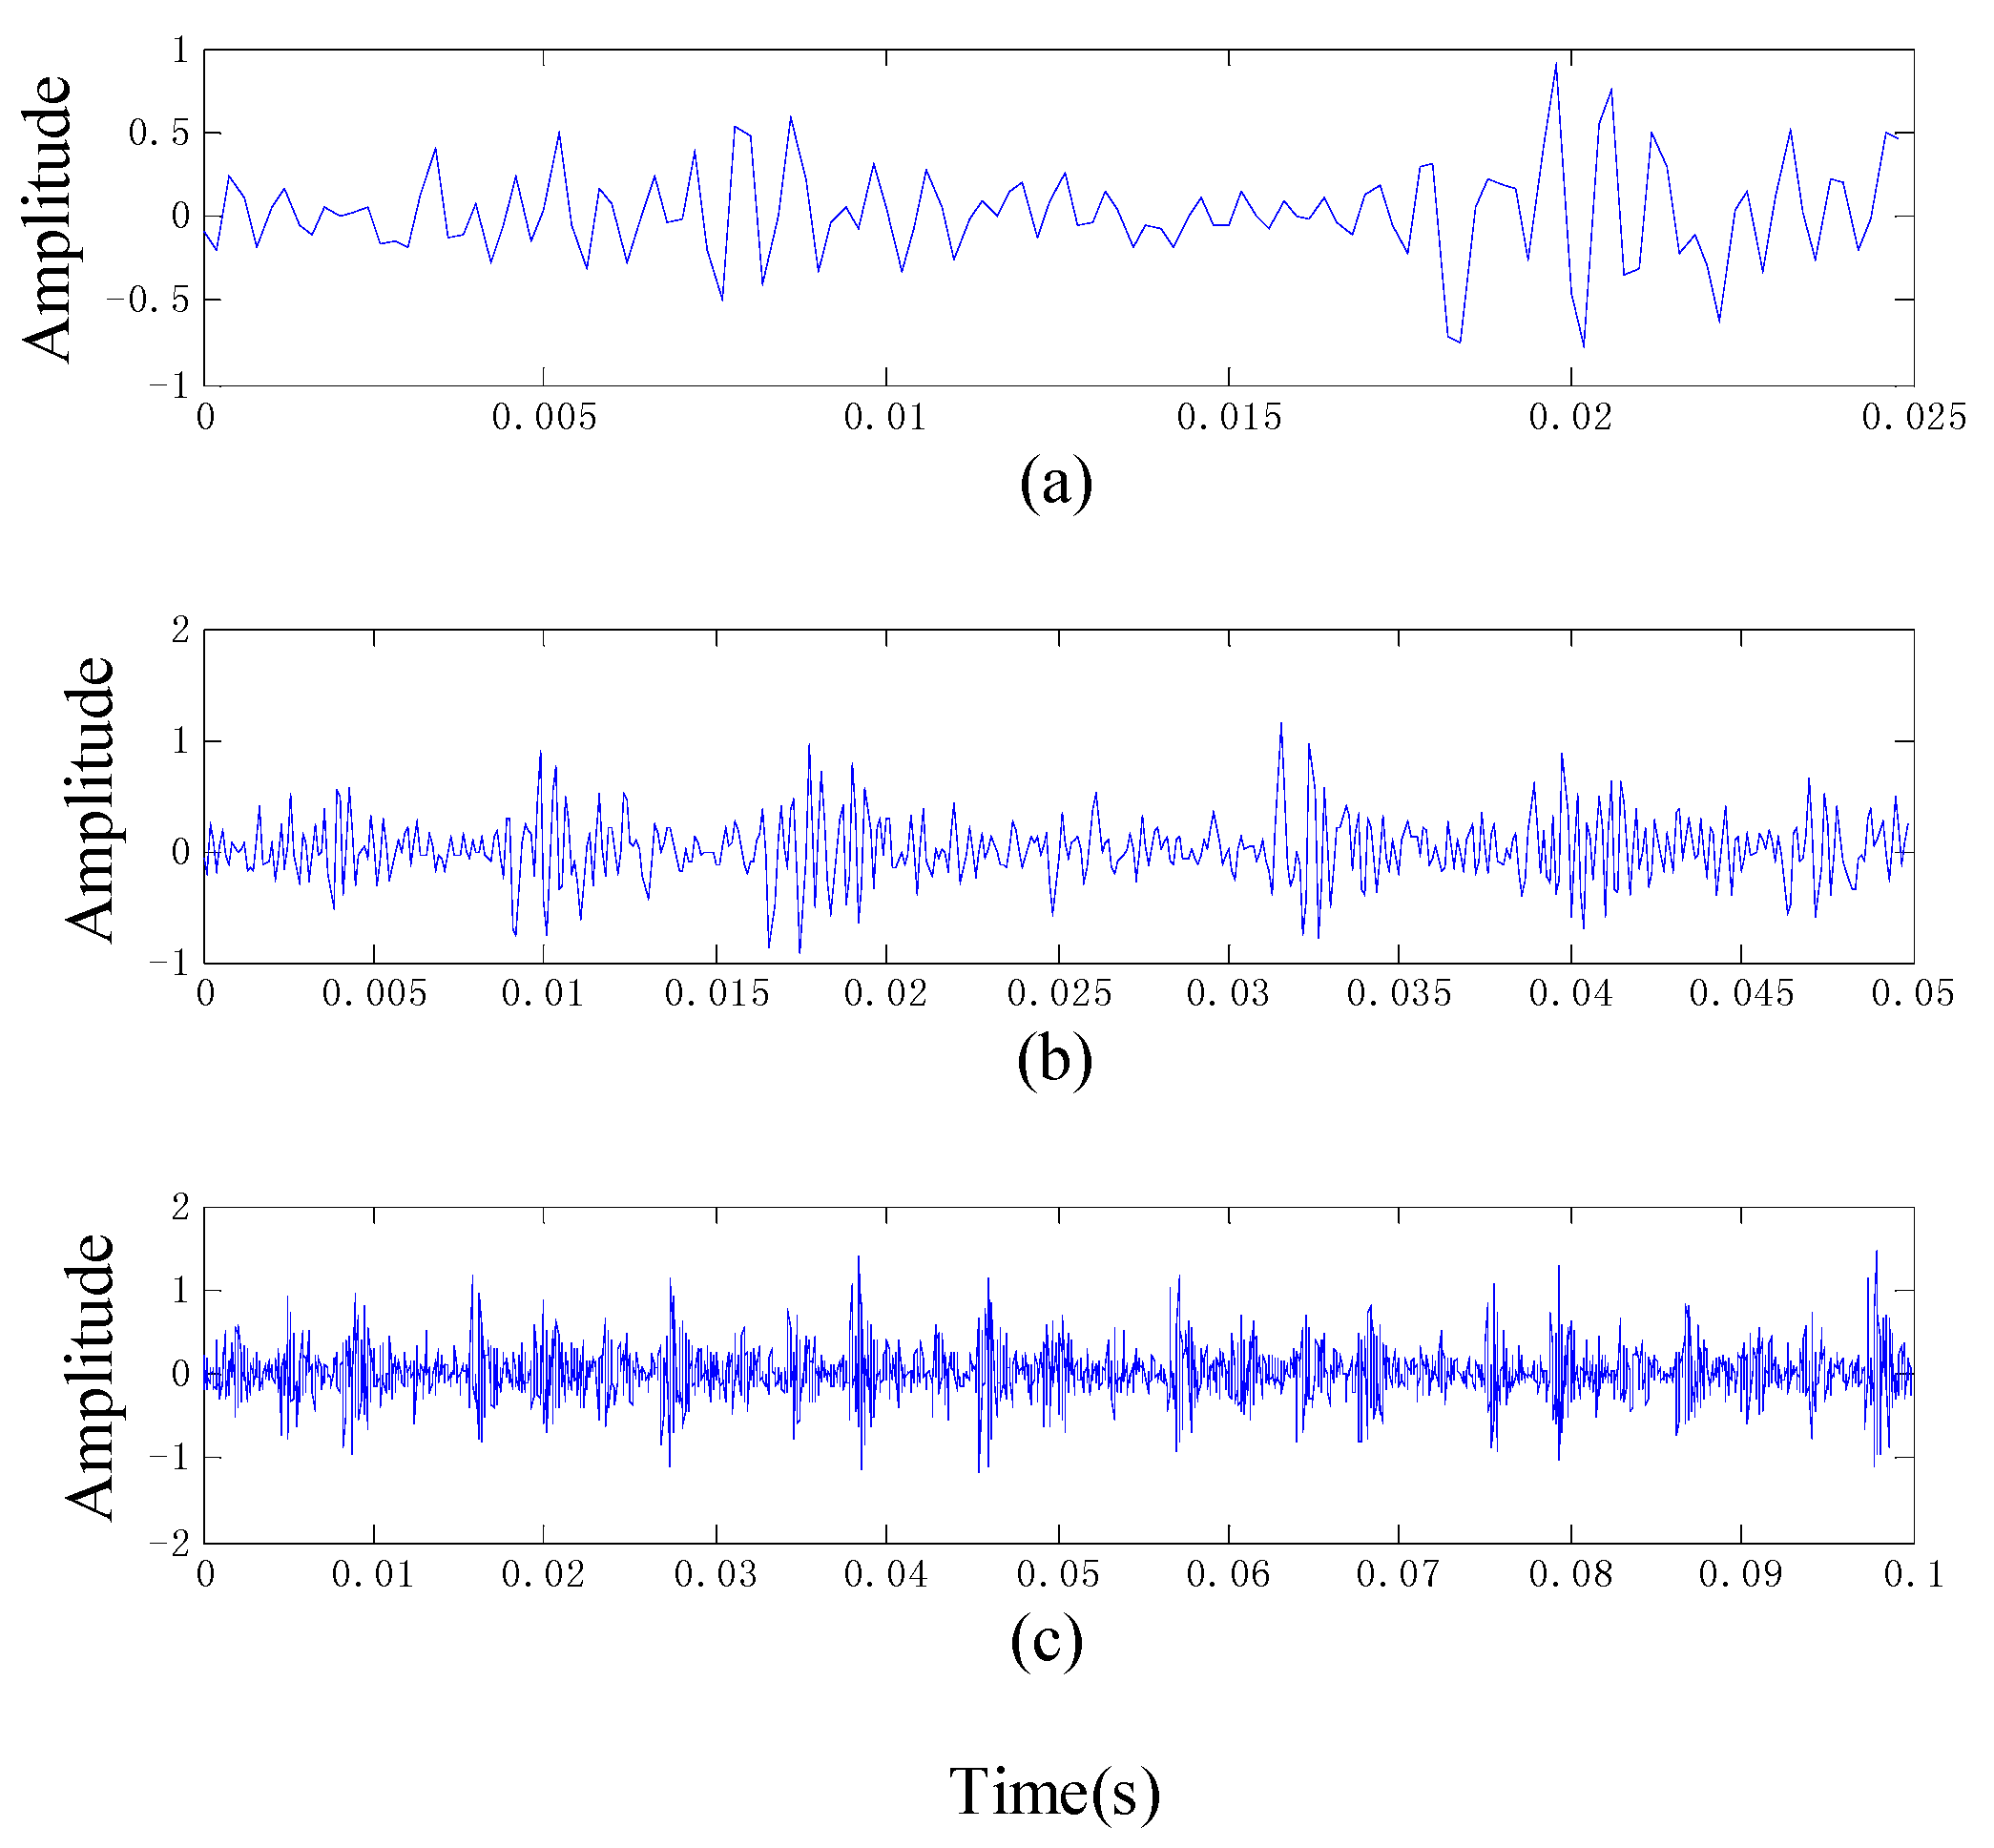
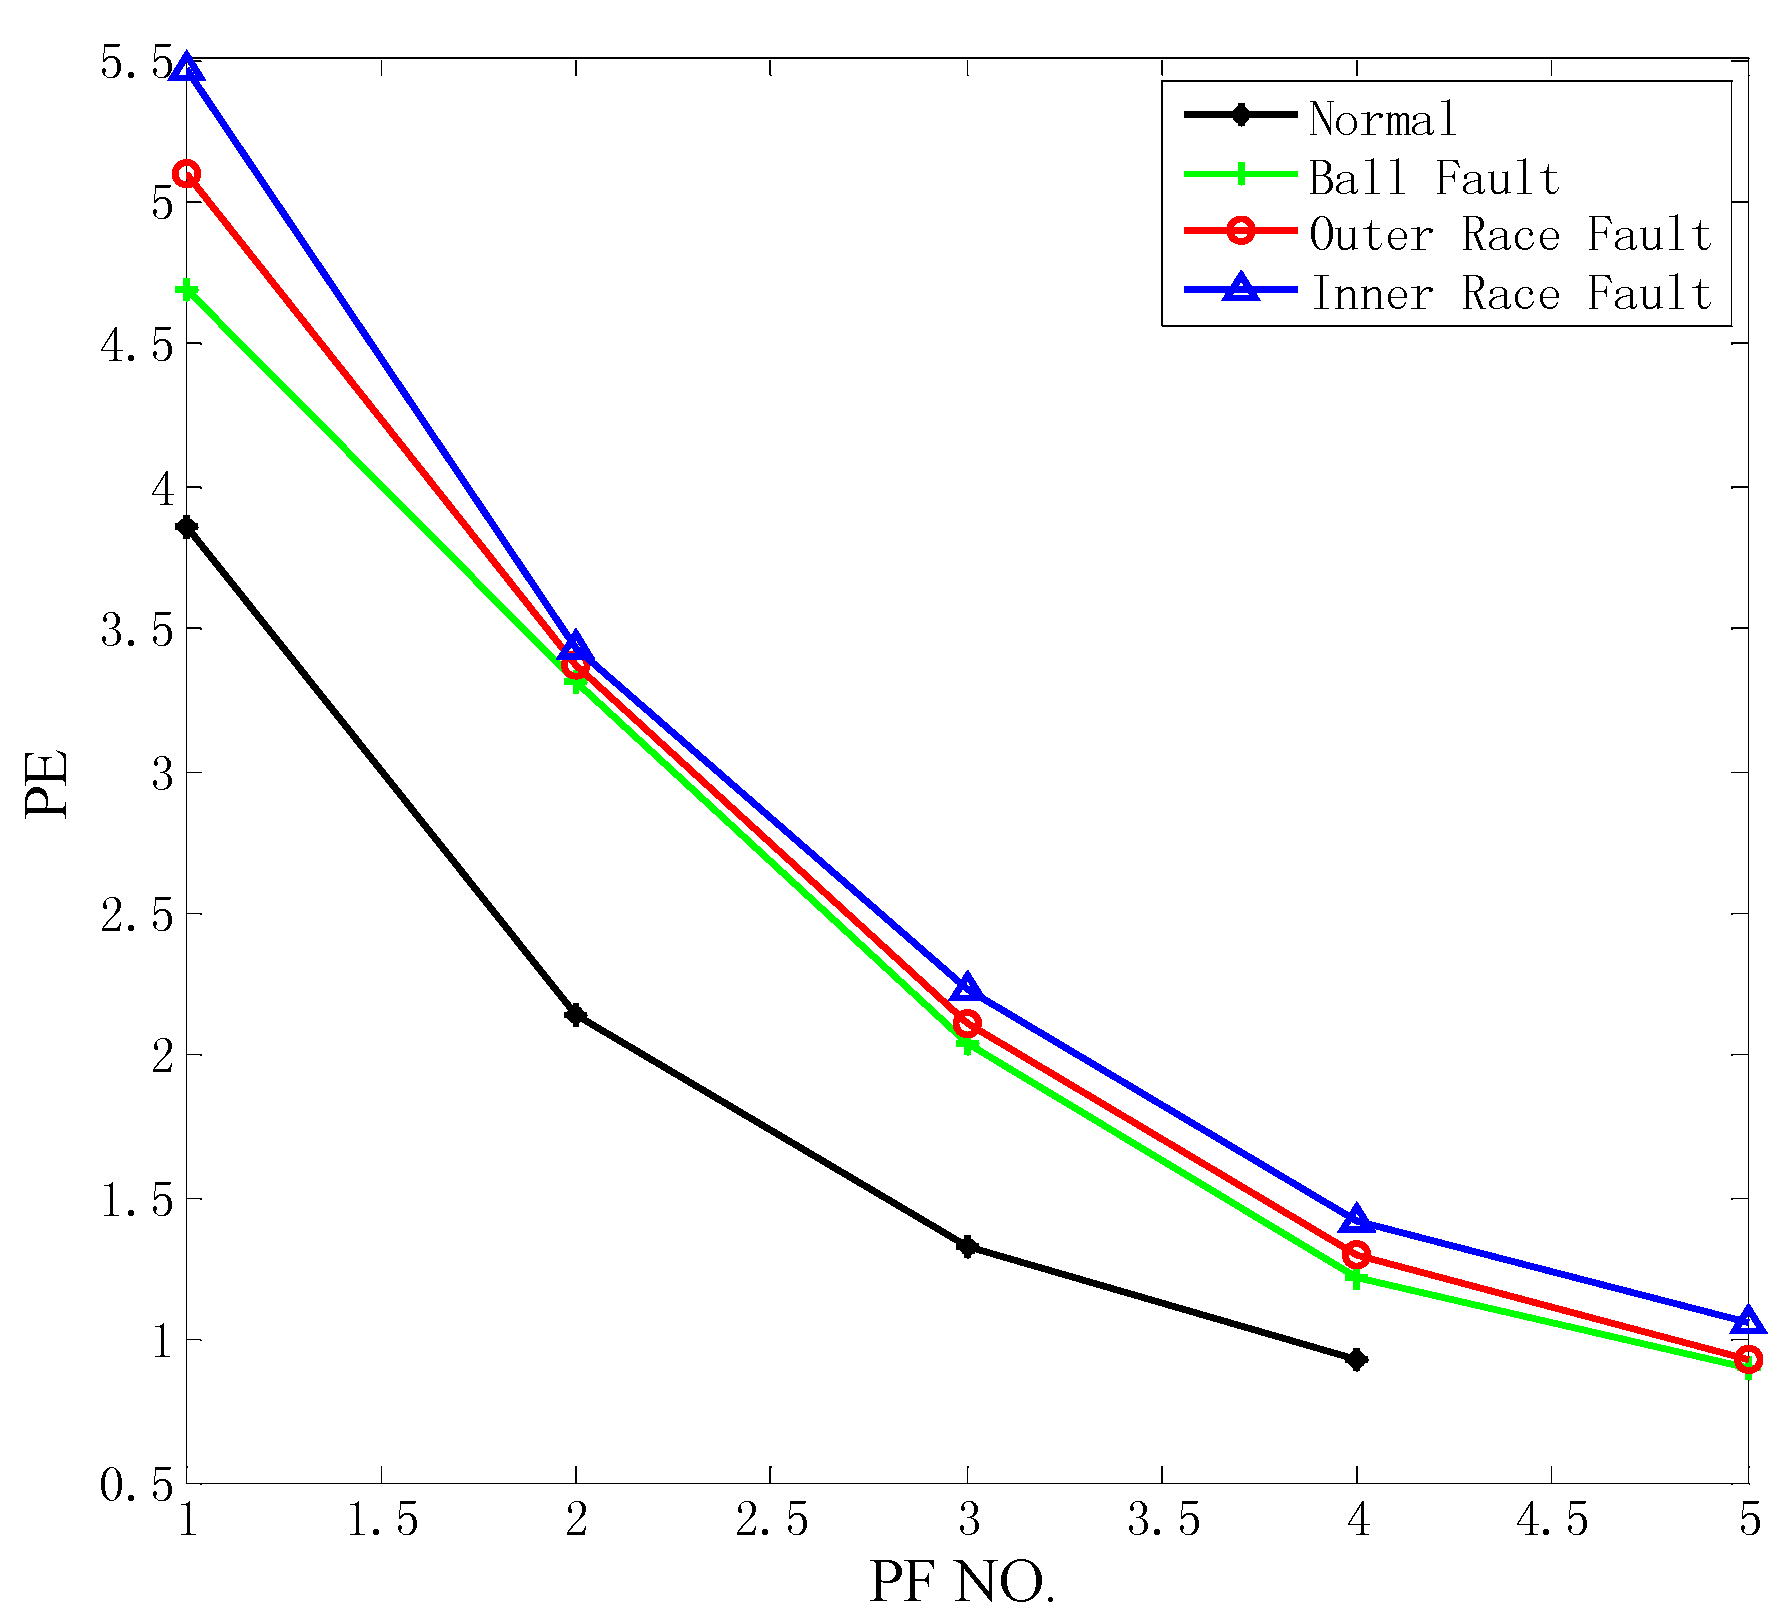
5.1. The Fault Feature Extraction Combining Improved LMD and PE

To verity the effectiveness of improved LMD and PE in the fault feature extraction, the proposed approach is applied to the experimental bearing vibration signals analysis. In this paper, all the experimental data are obtained from the website of Case Western Reverse Lab [30], and the experiment system’s sketch is given in Figure 6 in which the SKF bearing is used as experimental objective. The test stand mainly consists of a 2 hp motor, a torque transducer, a dynamometer and control electronics. The vibration signals are collected under four conditions including the normal, the inner race fault (IRF), the outer race fault (ORF) and the ball fault (BF). The test bearings using electro-discharge machining with fault diameters of 0.007 inches, 0.014 inches, 0.021 inches and 0.028 inches.
In the improved method of LMD, we utilize the self-similarity of signal to extend for suppressing the edge effect. First, we prove the self-similarity of vibration signals. For example, the Figure 7 shows the temporal distributions of roller bearing vibration signal with the same inner race fault condition in different sample frequency. It could be found that the trend of vibration signals in a high sample frequency is similar to the waveform in the lower one. So, the roller bearing vibration signals have the feature of self-similarity and the improved LMD can be used to decompose them.
The PE values for all of the four conditions are calculated and shown in Figure 8. From Figure 8 we can observe that the four conditions have been distinguished effectively and the PE values of PFs reflect the complexity of vibration signal further. PE values under normal roller bearings are smaller than that of roller bearings under fault conditions. When the fault happened on roller bearings, the dynamic system will change, resulting in one more PF which is the failure frequency and a large PE than that of normal condition. So far, the fault features of roller bearing vibration signal have been extracted based on the improved LMD and PE, and we choose the previous three PEs to classify.

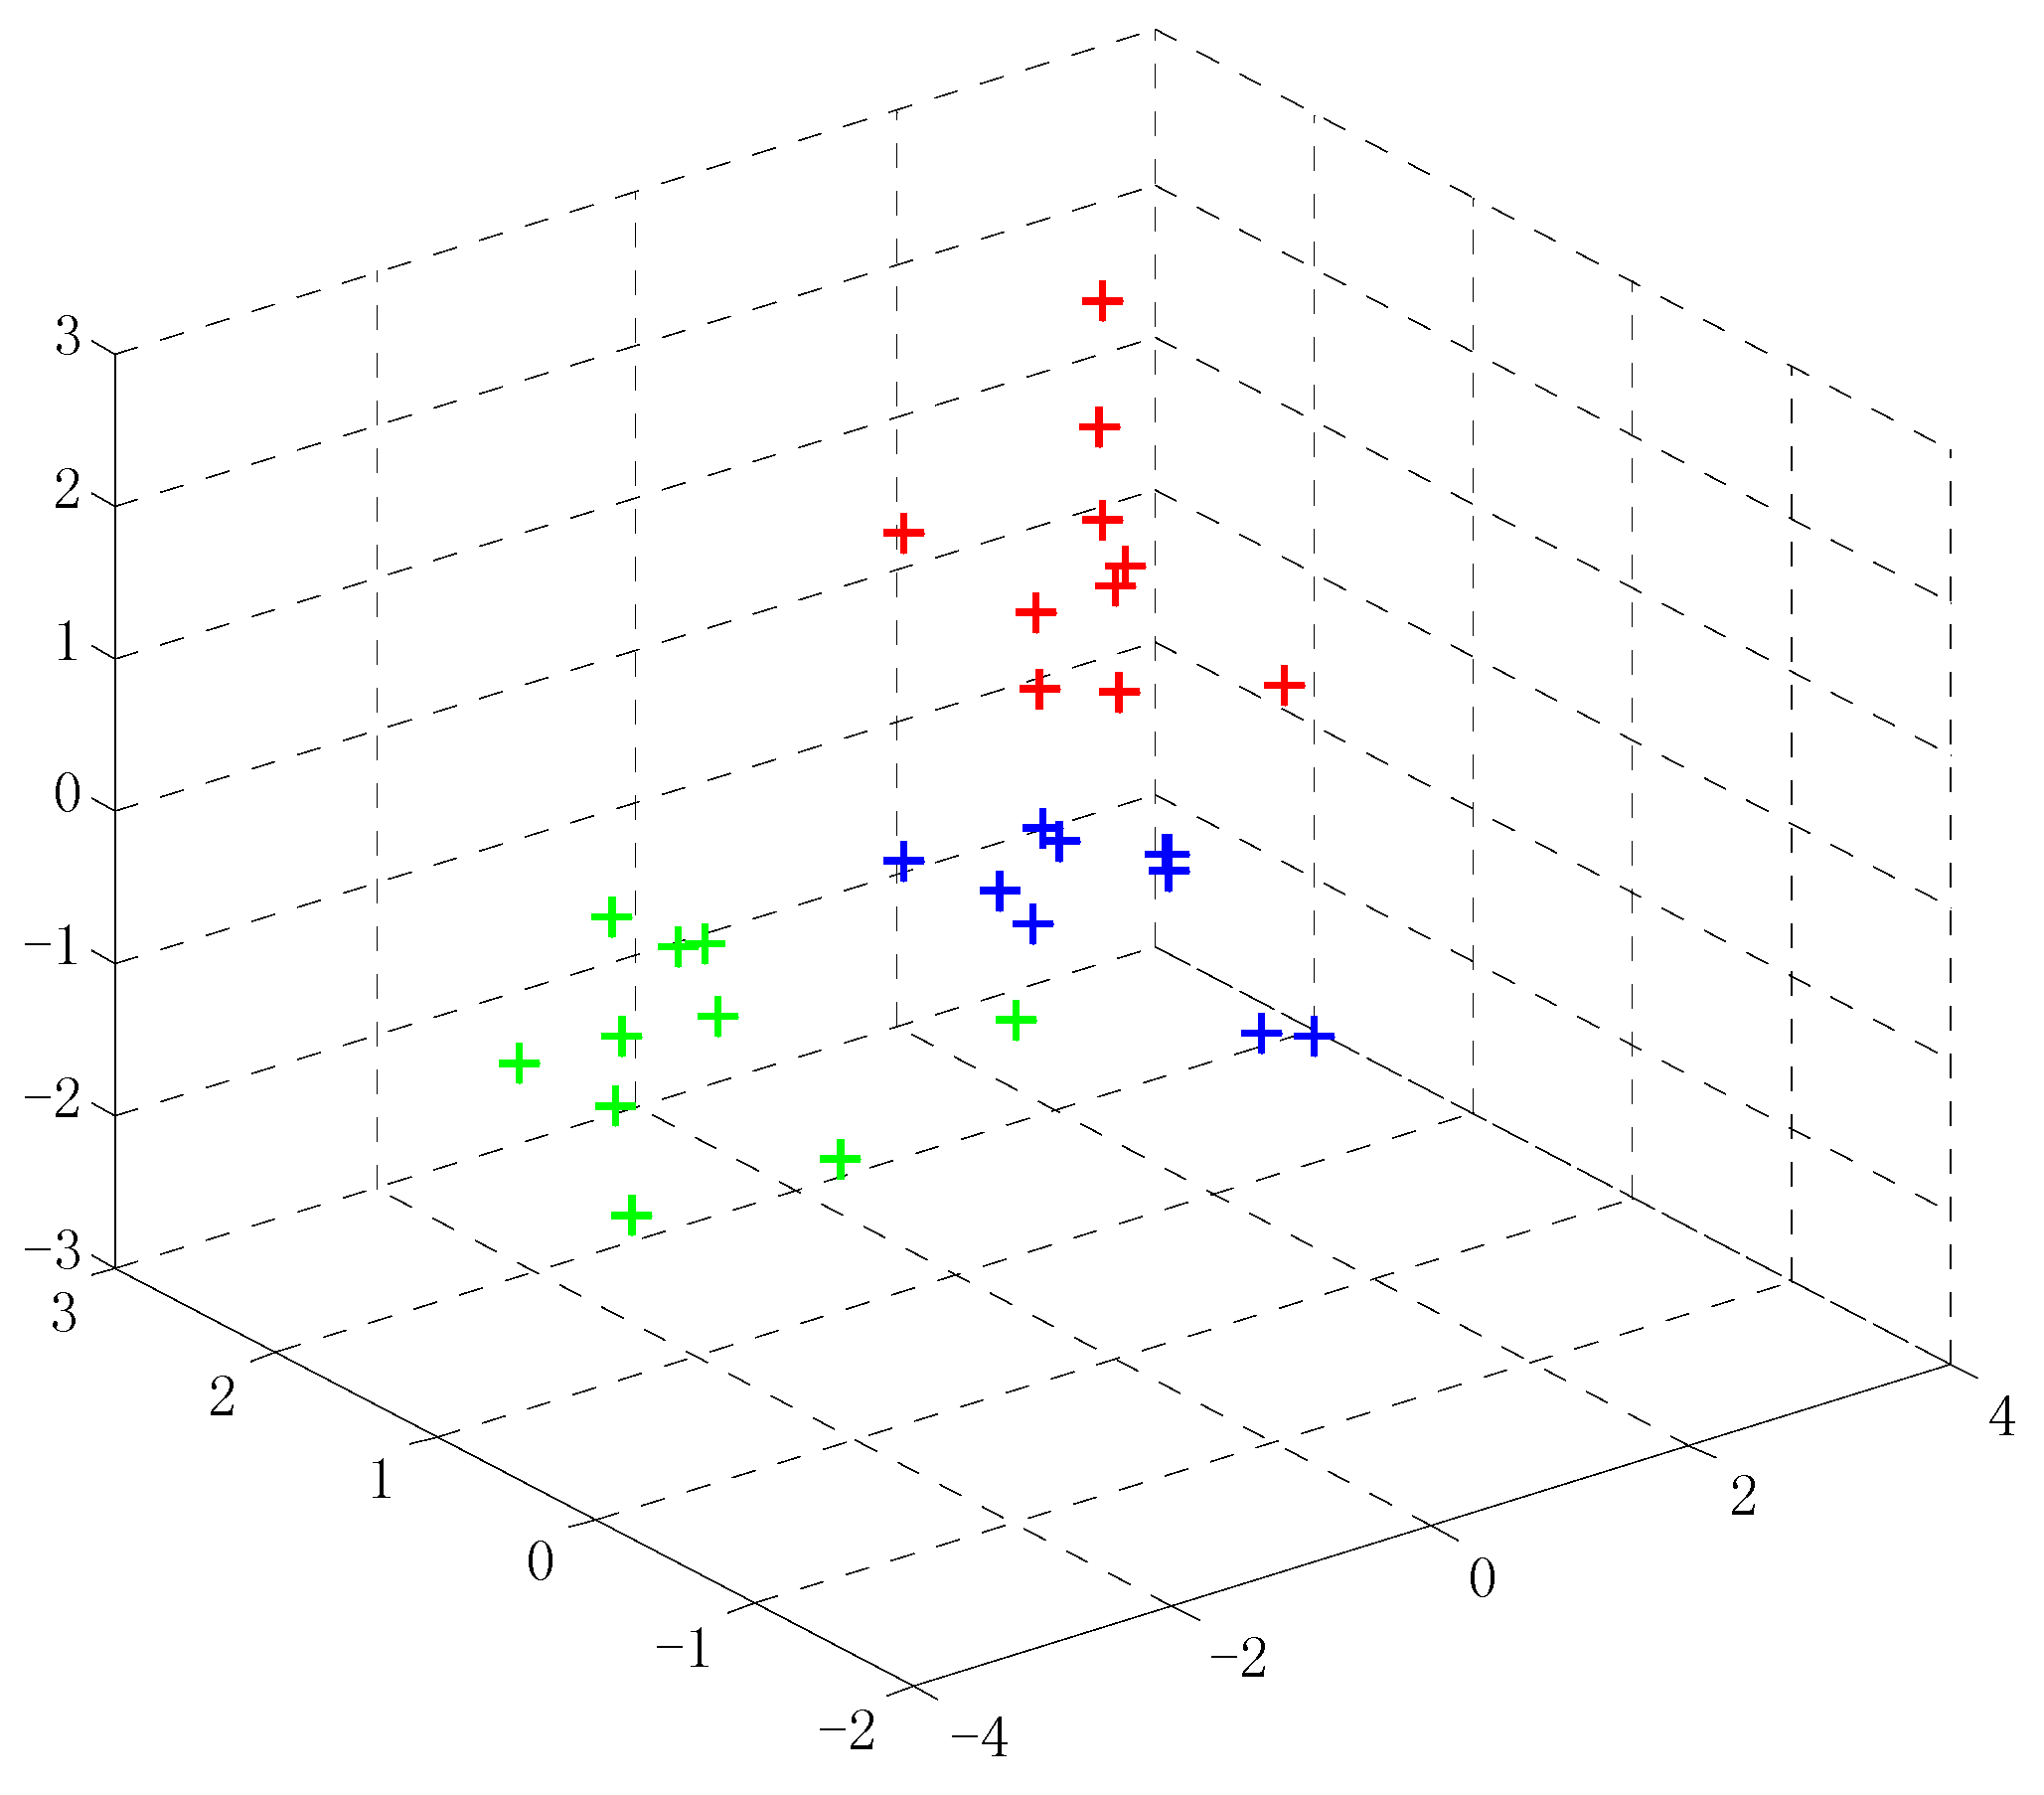
5.2. The Fault Pattern Recognition Based on the Optimized K-means Clustering Algorithm

The fault pattern recognizing of roller bearings can be done based on the fault feature vectors obtained by improved LMD and PE. State classification results of the optimized K-means are shown in Table 2, from which we can find that actual clustering quality of K-means are extremely consistent with the target ones. Thus, the proposed method combing improved LMD, PE and the optimized K-means can realize the fault feature extraction and fault pattern recognition effectively.

6. Conclusions

In order to extract the fault feature and recognize the fault pattern of bearing vibration signals, this paper proposes a novel approach combining the improved LMD, PE and the optimized K-means. The analysis results from simulation signal and experiment data demonstrate the superiority of the approach that is as follows.
1. Considering that the vibration signals are non-linear, non-Gaussian and non-stationary, the LMD method is applied to decompose the multi-component signals. And the improved LMD method suppresses the edge effect of LMD itself effectively.
2. Permutation entropy is introduced as the feature factor and can reflect the complexity of signals.
3. Four working conditions of the roller bearings can be identified accurately based on the optimized K-means clustering algorithm.

Acknowledgments

This project is supported by Shanghai Nature Science Foundation of China (Grant No. 14ZR1418500 and 14ZR1418400).

Author Contributions

Zongli Shi and Wangqing Song conceived and designed the topic and the experiments of the paper; Zongli Shi performed the experiments; Zongli Shi and Wangqing Song analyzed the data; Abdellah Saied contributed materials and made suggestions for revision. Zongli Shi wrote the paper. All of the authors read and approved the final manuscript.

Conflicts of Interest

The authors declare no conflict of interest.

References

  1. William, P.E.; Hoffman, M.W. Identification of bearing faults using time domain zero-crossings. Mech. Syst. Signal Process. 2011, 25, 3078–3088. [Google Scholar] [CrossRef]
  2. Li, X.; Zheng, A.; Li, C.; Zhang, L. Rolling element bearing fault detection using support vector machine with improved ant colony optimization. Measurement 2013, 46, 2726–2734. [Google Scholar] [CrossRef]
  3. Liu, H.; Han, M. A fault diagnosis method based on local mean decomposition and multi-scale entropy for roller bearings. Mech. Mach. Theory 2014, 75, 67–78. [Google Scholar] [CrossRef]
  4. Zheng, J.; Cheng, J.; Yang, Y. A rolling bearing fault diagnosis method based on multi-scale fuzzy entropy and variable predictive model-based class discrimination. Mech. Mach. Theory 2014, 78, 187–200. [Google Scholar] [CrossRef]
  5. Feng, Z.; Zuo, M. Vibration signal models for fault diagnosis of planetary gearboxes. J. Sound Vib. 2012, 331, 4919–4939. [Google Scholar] [CrossRef]
  6. Han, M.; Pan, J. A fault diagnosis method combined with LMD, sample entropy and energy ratio for roller bearings. Measurement 2015, 76, 7–19. [Google Scholar] [CrossRef]
  7. Cohen, L. Time-frequency distribution—A review. Proc. IEEE 1989, 7, 941–981. [Google Scholar] [CrossRef]
  8. Lee, J.-H.; Kim, J.; Kim, H.-J. Development of enhanced Wigner–Ville distribution function. Mech. Syst. Signal Process. 2001, 2, 367–398. [Google Scholar] [CrossRef]
  9. Yan, R.; Gao, R.; Chen, X. Wavelets for fault diagnosis of rotary machines: A review with applications. Signal Process. 2014, 96, 1–15. [Google Scholar] [CrossRef]
  10. Lin, J.; Qu, L. Feature extraction based on Morlet wavelet and its application for mechanical fault diagnosis. J. Sound Vib. 2000, 1, 135–148. [Google Scholar] [CrossRef]
  11. Olhede, S.; Walden, A.T. The Hilbert spectrum via wavelet projections. Proc. R. Soc. Lond. 2004, 460, 955–975. [Google Scholar] [CrossRef] [Green Version]
  12. Li, Y.; Xu, M.; Wei, Y.; Huang, W.H. An improvement EMD method based on the optimized rational Hermite interpolation approach and its application to gear fault diagnosis. Measurement 2015, 63, 330–345. [Google Scholar] [CrossRef]
  13. Smith, J.S. The local mean decomposition and its application to EEG perception data. J. R. Soc. Interface 2005, 5, 443–454. [Google Scholar] [CrossRef] [PubMed]
  14. Xue, X.; Zhou, J.; Zhang, Y.; Jian, X.; Wang, X. An extrema extension method based on support vector regression for restraining the end effects in empirical model decomposition. Appl. Mech. Mater. 2013, 404, 526–532. [Google Scholar] [CrossRef]
  15. Ren, D.; Yang, S.; Wu, Z. Research on end effect of LMD based time-frequency analysis in rotating machinery fault diagnosis. China Mech. Eng. 2012, 8, 951–956. [Google Scholar]
  16. Cai, Y.; Li, A.; Zhang, W.; Xu, P. HHT end effect processing method based on maximum Lyapunov index boundary extension model. Chin. J. Sci. Instr. 2011, 32, 1330–1336. [Google Scholar]
  17. Liu, W.Y.; Gao, Q.W.; Ye, G. A novel wind turbine bearing fault diagnosis method based on Integral Extension LMD. Measurement 2015, 74, 70–77. [Google Scholar] [CrossRef]
  18. Wu, S.; Wu, P.; Wu, C.; Ding, J.; Wang, C. Bearing fault diagnosis based on multiscale permutation entropy and support vector machine. Entropy 2012, 14, 1343–1356. [Google Scholar] [CrossRef]
  19. Zanin, M.; Zunino, L. Permutation entropy and its main biomedical and econophysics applications: A review. Entropy 2012, 14, 1553–1577. [Google Scholar] [CrossRef]
  20. Huang, G.-B.; Zhou, H.; Ding, X.; Zhang, R. Extreme learningmachine for regression andmulticlass classification. IEEE Trans. Syst.Man Cybern. Part B Cybern. 2012, 2, 513–529. [Google Scholar] [CrossRef] [PubMed]
  21. Huang, G.-B.; Ding, X.; Zhou, H. Optimization method based extreme learning machine for classification. Neurocomputing 2010, 1, 155–163. [Google Scholar] [CrossRef]
  22. Liu, W.; Zhang, W.; Han, J.; Wang, G. A new wind turbine fault diagnosis method based on the local mean decomposition. Renew. Energy 2012, 48, 411–415. [Google Scholar] [CrossRef]
  23. Li, M. Fractal time series—A tutorial review. Math. Probl. Eng. 2010. [Google Scholar] [CrossRef]
  24. Yang, J.; Zhang, Y.; Zhu, Y. Intelligent fault diagnosis of rolling element bearing based on SVMs and fractal dimension. Mech. Syst. Signal Process. 2007, 5, 2012–2024. [Google Scholar] [CrossRef]
  25. Maragos, P.; Sun, F.K. Measuring the fractal dimension of signals: Morphological covers and iterative optimization. IEEE Trans. Signal Process. 1993, 1, 108–121. [Google Scholar] [CrossRef]
  26. Zheng, Z.; Jiang, W. Gear fault diagnosis method based on local mean decomposition and generalized morphological fractal dimensions. Mech. Mach. Theory 2015, 91, 151–167. [Google Scholar] [CrossRef]
  27. Bandt, C.; Pompe, B. Permutation entropy: A natural complexity measure for time series. Phys. Rev. Lett. 2002, 88, 174102. [Google Scholar] [CrossRef] [PubMed]
  28. Karimov, J.; Ozbayoglu, M. Clustering quality improvement of k-means using a hybrid evolutionary model. Proced. Comput. Sci. 2015, 61, 38–45. [Google Scholar] [CrossRef]
  29. Probability Density Function. Available online: https://en.wikipedia.org/wiki/Probability_density_function (accessed on 15 February 2016).
  30. Bearing Data Center, Case Western Reserve University. Available online: http://csegroups.case.edu/bearingdatacenter/pages/download-data-file (accessed on 15 February 2016).
Figure 1. The local mean decomposition (LMD) decomposition of x ( t ) .
Entropy 18 00070 g001
Figure 2. The time-frequency representation of the product functions (PFs) derived from the LMD.
Entropy 18 00070 g002
Figure 3. The improved LMD decomposition results of x ( t ) .
Entropy 18 00070 g003
Figure 4. The time-frequency representation of the PFs derived from the improved LMD.
Entropy 18 00070 g004
Figure 5. The sample data sets for clustering.
Entropy 18 00070 g005
Figure 6. The roller bearing experiment system’s sketch.
Entropy 18 00070 g006
Figure 7. The temporal distributions of roller bearing vibration signal in different sample frequency. (a) 5000 Hz (b) 10,000 Hz (c) 20,000 Hz.
Entropy 18 00070 g007
Figure 8. The permutation entropy (PE) values for all of the four conditions.
Entropy 18 00070 g008
Table 1. The comparison of clustering quality based on K-means and optimized K-means.
SequenceTest SamplesClassification AccuracyIterations
K-MeansOptimized K-MeansK-MeansOptimized K-Means
11092%100%55
210
310
Table 2. State classification results of the optimized K-means.
SequenceStateOperation ConditionPEsTarget OutputActual Output
1Normal1797 r/min 0HP3.8612.1441.32511
21772 r/min 1HP4.4062.6441.44511
31750 r/min 2HP4.2372.8111.54011
41730 r/min 3HP4.1172.7501.46211
5Inner race fault1797 r/min 0HP5.4653.4262.23422
61772 r/min 1HP5.4783.4882.21222
71750 r/min 2HP5.4453.3002.24322
81730 r/min 3HP5.4513.3092.16922
9Outer race fault1797 r/min 0HP5.0983.3702.11033
101772 r/min 1HP5.0973.4302.06233
111750 r/min 2HP5.1983.4272.10933
121730 r/min 3HP5.2833.3732.12133
13Ball fault1797 r/min 0HP4.6903.3162.04344
141772 r/min 1HP4.7183.3642.01744
151750 r/min 2HP4.7253.3741.99544
161730 r/min 3HP4.6973.3082.16944

