1. Introduction
Speech signals carry a great deal of information that is essential for effective human communication. It is well known that speech can be transmitted through air and can be detected by traditional acoustic transducers, or air-borne microphones that convert acoustic energy into electrical energy [
1]. Other methods to detect speech signals include using bone conduction microphones, which are transducers that detect vibrations conducted through bone [
2,
3], and optical techniques, such as light waves or lasers [
4]. While all of these methods are commonly used, they do have some potential limitations. The directional sensitivity of microphones is quite weak and can be easily disturbed by ambient noise. Bone conduction microphones need to be applied to the throat with adhesive, which may cause discomfort to some users. Optical speech signals are strongly affected by environmental conditions, including atmospheric conditions, the composition of the target, and the properties of the objects [
5]. In addition, the details of the optical materials in use are often difficult to obtain [
6]. To overcome these limitations, microwave radar speech sensors have been employed to detect the motion of vocal cords [
7,
8,
9]; however, the research into these sensors has been concentrated primarily on the relationship between the motion of the organ and the voice activity, and has seldom been dedicated to studying the speech signal itself.
Microwave radar has many advantages, such as low range attenuation and a good sense of direction, and is noninvasive, safe, fast, and portable. For these reasons, microwave radar systems have been developed for use in a variety of remote sensing applications [
10,
11,
12]. Millimeter wave (MMW) radar can generate a larger modulated phase and has a higher sensitivity to small vibration displacements than does centimeter wave radar. Based on these advantages, the use of MMW radar in speech-detecting applications will provide many exciting possibilities in the future. In [
6], Li verified the feasibility of this method by using a 40 GHz MMW radar to acquire speech signals with a 40 GHz MMW radar and verified the feasibility of this method. However, no other examples have been found in the literature. We therefore developed a 34 GHz microwave radar sensor for non-contact speech detection [
13,
14]; however, the detection sensitivity was low and the quality of the detected speech was deemed to be unsatisfactory. We believe it is important to explore this new method to detect speech signals, but first there is an urgent need to improve the detection sensitivity of the radar sensor.
Recently, Obeid et al. used three measurement systems to detect non-contact heartbeats and determined that a high operating frequency can increase the sensitivity to small displacements [
15]. Mikhelson employed a 94 GHz radar to detect smaller displacements and successfully acquired signals that contain both the heart rate and respiration patterns of a human subject [
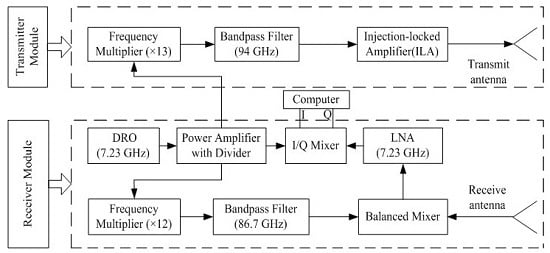
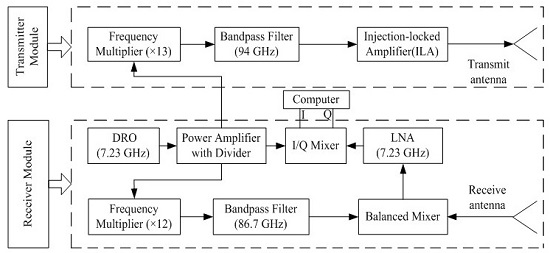
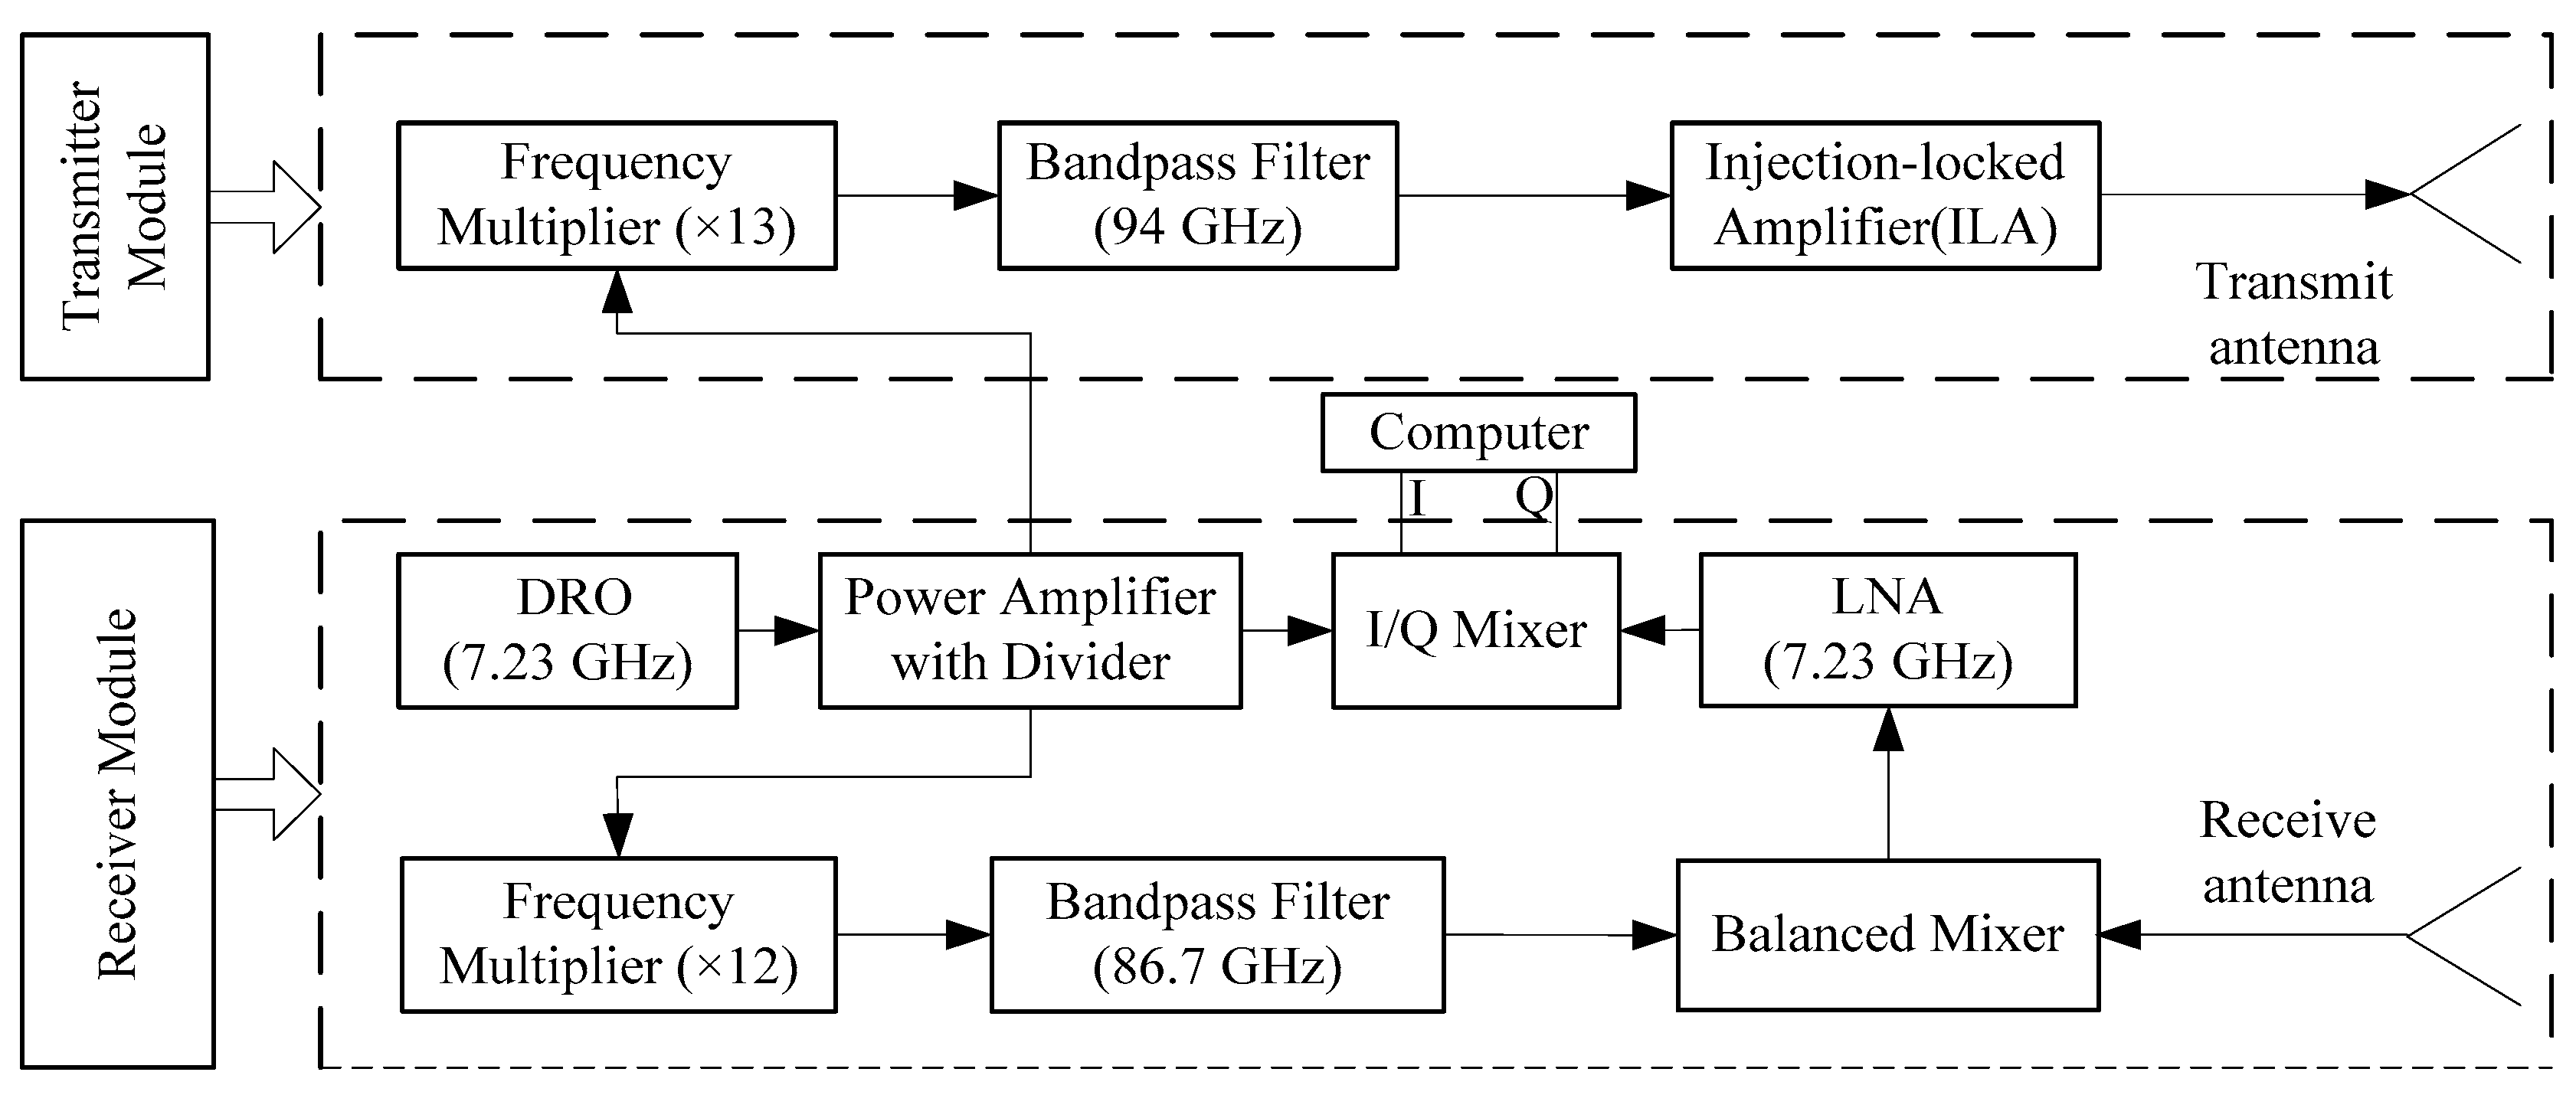
16]. These studies suggest that systems that use a high operating frequency will demonstrate a high detection sensitivity. Therefore, to improve the sensitivity of a radar sensor used to detect speech, we have employed a higher frequency radar sensor that operates at 94 GHz in our laboratory [
17]. To allay user concerns, the radar poses no risk to human health according to a new standard for safety levels with respect to human exposure to radio-frequency radiation [
18].
Although the 94 GHz radar sensor performed better than the sensor at 34 GHz when detecting speech, it also had several serious shortcomings, including reduced intelligibility and poor audibility [
17,
19]. This is because the quality of the detected speech was significantly degraded by several sources of noise, which include electromagnetic, ambient, and channel noise. These noise sources are more complex than those found in speech acquired using a traditional microphone. Therefore, a challenging task for researchers is to determine how best to reduce the level of this combined noise in order to enhance the quality of the detected speech. Traditionally, various speech enhancement approaches have been proposed to solve this problem, such as Wiener filtering and spectral subtraction [
20,
21,
22,
23]. Our laboratory has also proposed some noise reduction methods to enhance the quality of the speech detected by the radar sensor [
24,
25].
Wavelet shrinkage is a simple denoising technique based on the thresholding of the wavelet coefficients. This method was introduced by Donoho as a powerful tool for denoising signals degraded by additive white noise [
26,
27,
28,
29,
30], and has now been widely applied. For example, Chambolle et al. used the method for image denoising and compression [
31]. Achim et al. proposed a new synthetic aperture radar (SAR) image denoising method via Bayesian wavelet shrinkage [
32]. Bahoura et al. proposed a new speech enhancement method based on the time adaption of wavelet shrinkage that was able to successfully reduced the noise in speech signals [
33]. Although the principle of wavelet shrinkage for denoising signals has now been applied in many different areas, the method does require several assumptions that limit the algorithm itself [
30]. To address this, Mercorelli proposed a thresholding-free methodology that has benefits in wavelet denoising applications [
34,
35,
36]. However, there are still two important issues with the wavelet shrinkage method that need to be improved. First, the down sampling at each level of decomposition, leads to speech signal distortion and a high computational load [
37]. Second, the disadvantages of the hard and soft thresholding functions result in an unsatisfactory quality of the reconstructed speech signals.
This paper introduces a non-contact MMW radar system for acquiring high quality speech signals that addresses these problems by proposing a perceptual wavelet packet method that is able to enhance the perceptibility and intelligibility of radar-detected speech in two specific ways. First, the new method offers better resolution when decomposing signals because it allows the wavelet tree to be adjusted based on the critical bands. Second, a modified thresholding function is employed to reduce the noise in the radar-detected speech. Experimental results demonstrate that the proposed algorithm is an effective way to suppress the noise in the speech detected by the 94 GHz radar system.
3. Signal Recording and Processing
Four volunteers (three males and one female) were selected for the speech detection experiments, and all were Chinese native speakers. The radar speech sensor was positioned at distances ranging from 2 to 10 m from the subjects. In the experiment, a volunteer sat in front of the radar system with his throat at the same height as the radar antenna. The speech material selected for the volunteers consisted of two Mandarin Chinese sentences and the standard library from the TIMIT Database [
38]. In order to acquire high quality and stable speech, a loudspeaker was also used to represent the speakers and play the speech material. All of the experimental procedures were in accordance with the rules of the Declaration of Helsinki [
39].
After acquiring the radar-detected speech signals, a series of signal processing methods were employed to suppress the noise in the detected speech, as shown in
Figure 2. First, the detected speech was decomposed into a bark band tree using the perceptual wavelet packet method described in
Section 3.2. Then, an adaptive wavelet threshold and modified thresholding function were employed to remove the noise from the detected speech, as detailed in
Section 3.3. Finally, the processed signal was used to reconstruct the speech that was detected using the radar system.
3.1. Wavelet Packet Transform
The wavelet packet transform is an extension of the wavelet transform and was pioneered by Coifman et al. [
40,
41]. In contrast to the wavelet transform, the wavelet packet transform decomposes both the low frequencies and the high frequencies. It can therefore offer better resolution than the wavelet transform.
If the quadrature mirror filter coefficients of the wavelet multi-resolution analysis are
h(
k) and
g(
k), then the wavelet basic function
(
t) and its corresponding orthonormal scaling function
ψ(t) are given by:
The function cluster of
un(
t) is defined to satisfy the following equation:
where
. When
n = 0, the equation can be expressed as:
where
u0(
t) can be identified with the function
(
t), and
u1(
t) with the function
ψ(
t). Then, the collection function family
can be described as wavelet packets obtained from the function
(
t).
For a radar-detected speech signal, if the noisy signal is represented by
y(
n), the clean signal by
x(
n), and the uncorrelated additive noise signal by
d(
n), then:
where
N is the number of samples in the received radar-detected speech signal.
An approximation of an original noisy speech signal function
y(
n) using wavelet packets can be written as
,
The wavelet packet decomposes the noisy signal y(n) into subbands, with the corresponding wavelet coefficient sets as , and it denotes the nth coefficient of j-th subband for the l-th level, and n = 1,···, (N/2j) − 1, j = 1, ···, 2l, where j, n, and l can be regarded as the scale, frequency, and position indices of the corresponding wavelet packet function, respectively.
Then, the wavelet packet transform can be constructed using basic decomposition and reconstruction techniques. The wavelet packet decomposition can be given by:
where
dkj+1,2n and
dkj+1,2n+1 are called the approximation coefficients and the detail coefficients of the wavelet decomposition of
dlj,n, respectively, and
h2l−k and
g2l−k are the analysis low-pass scaling filter and the high-pass wavelet filter, respectively [
42].
After the coefficients of
dkj+1,2n and
dkj+1,2n+1 have been processed by the wavelet threshold, we obtain the updated wavelet packet coefficients
and
. The enhanced speech is then synthesized with the inverse transformation of the processed wavelet packet coefficients, and the corresponding wavelet reconstruction can be written as:
where
hk−2l and
gk−2l are the synthesis low-pass scaling filter and the high-pass wavelet filter, respectively. Then, the enhanced radar-detected speech signal can be obtained using Equation (8)
3.2. Perceptual Wavelet Packet Decomposition
Theoretically, the human auditory frequency range extends from 0 to 16 kHz. The Bark scale is a human auditory scale that was proposed by Zwicker [
43] and divides the human auditory range into approximately 24 critical bands [
43]. The perceptual wavelet packet decomposition method described in this paper is used to decompose the speech signal from 0 Hz to 16 kHz into 24 frequency subbands that approximate the 24 Bark bands. The Bark
z(
f) band can be approximately described as the relationship between the linear frequency and the critical band number [
44]:
where
f is the linear frequency in Hertz. The corresponding critical bandwidth (CBW) of the center frequencies can be expressed by [
44]:
where
fc is the center frequency in Hertz.
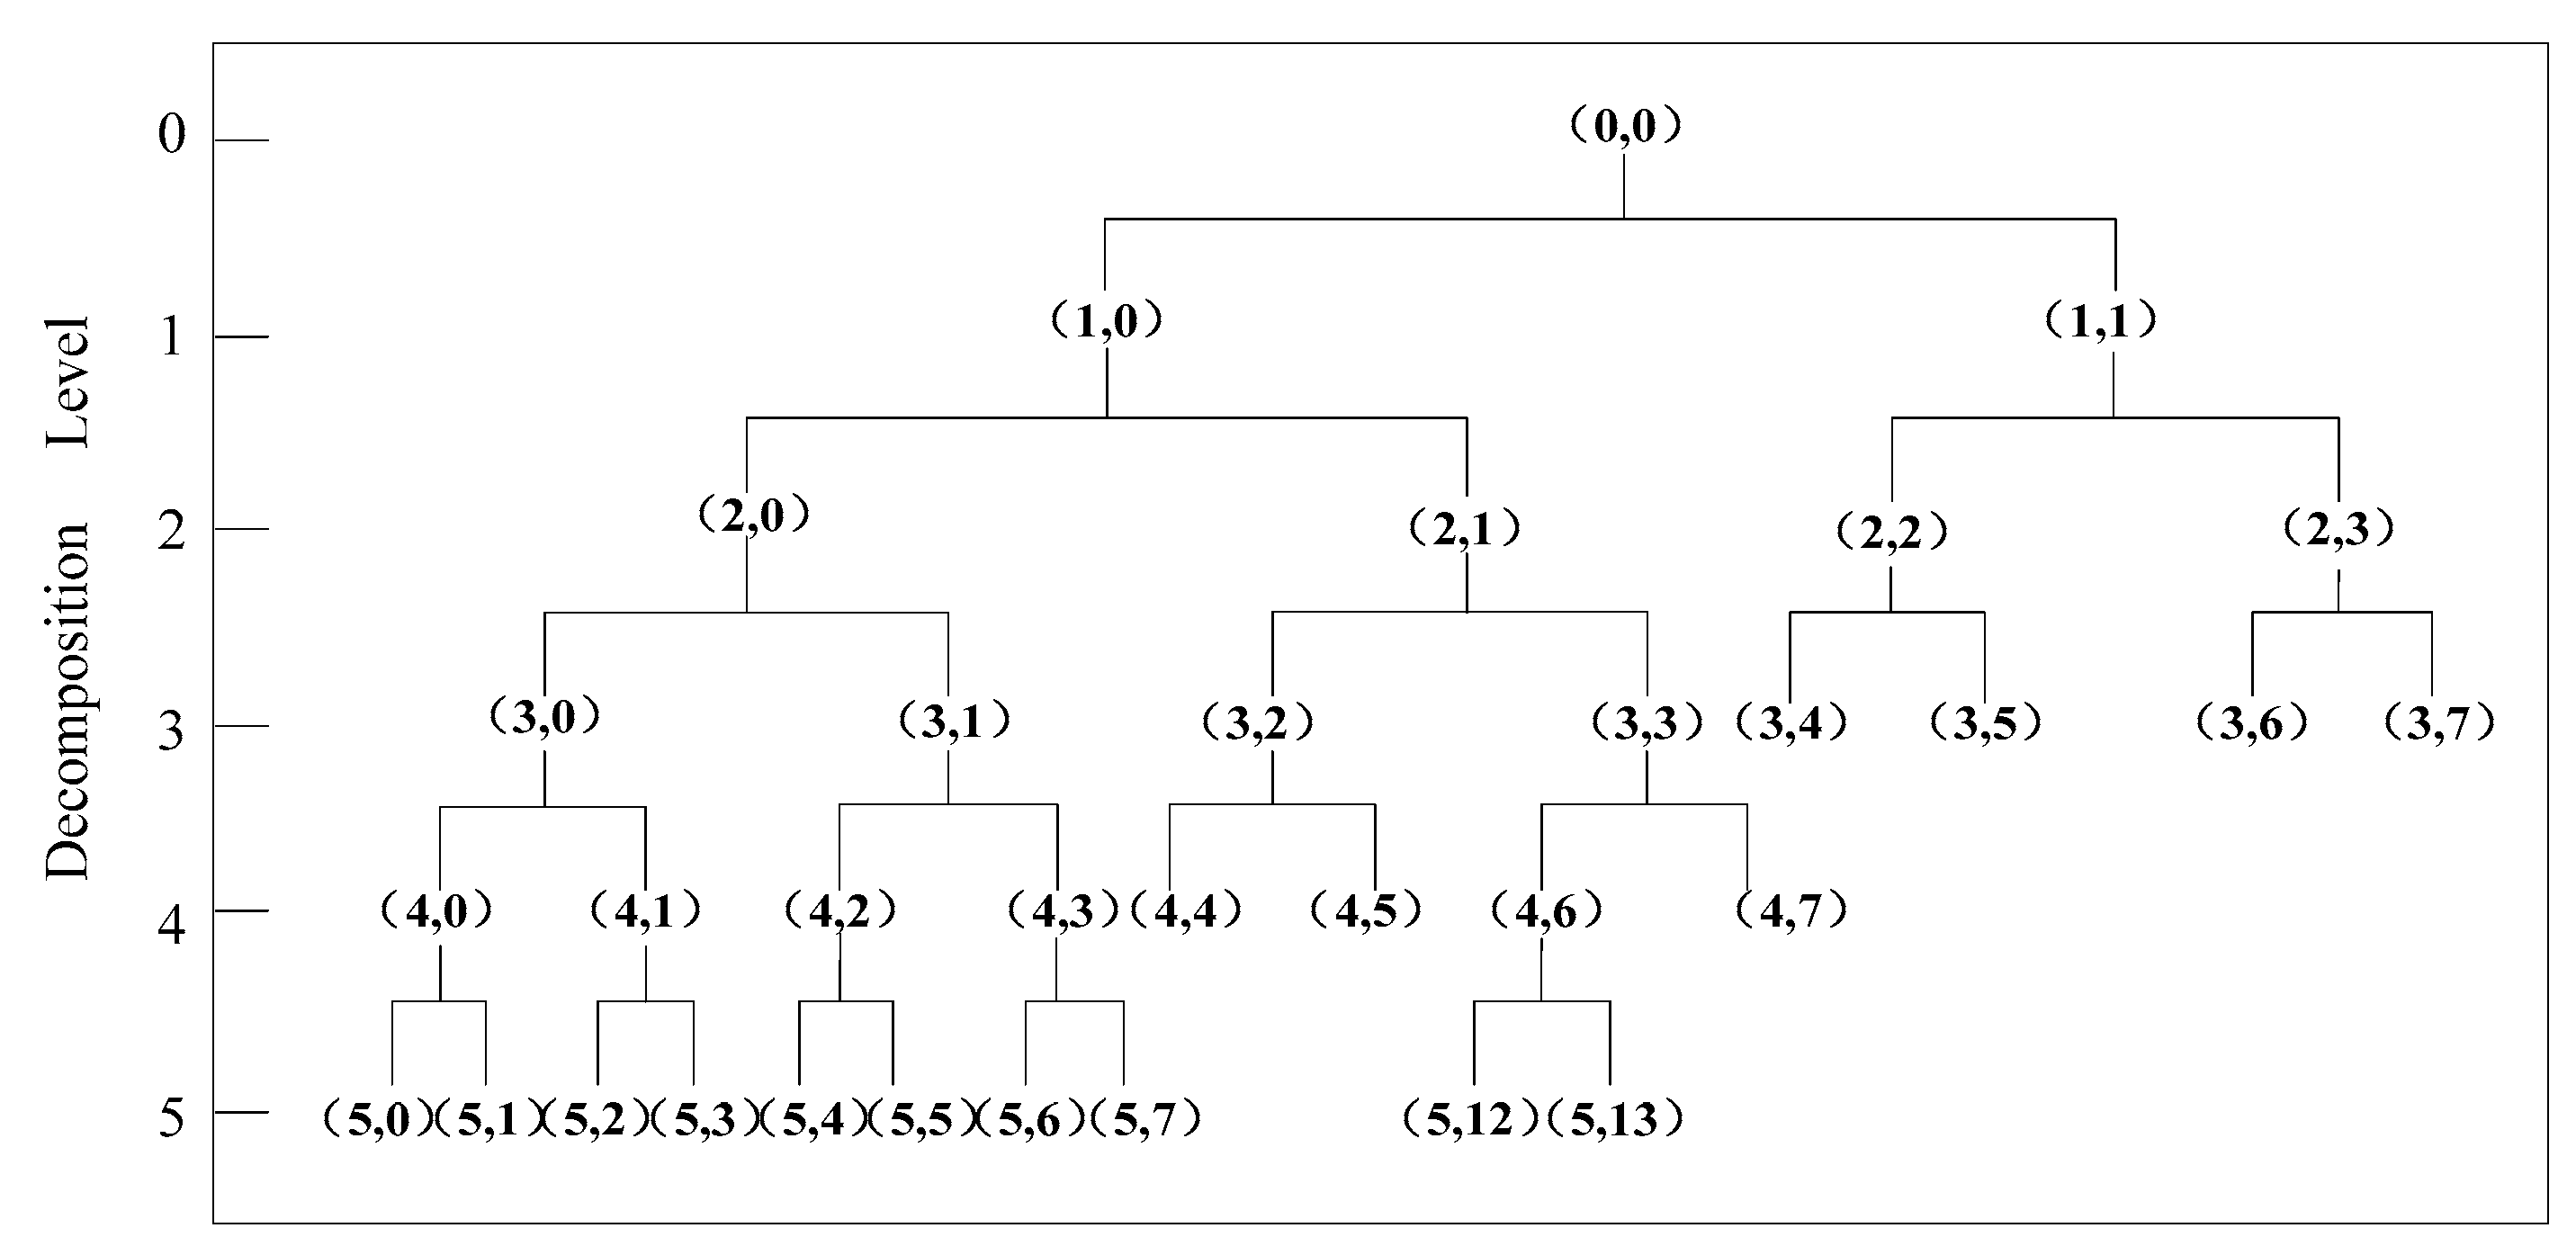
In this paper, the frequency range of the radar-detected speech is assumed to extend from 0 to 4000 Hz. According to Equation (9), there are approximately 17 critical bands. The tree structure of the perceptual wavelet packet can be decomposed into five levels, as shown in
Figure 3.
Table 1 shows the specifications for the center frequencies (
fcenter), CBW, lower cutoff frequencies (
fl) and upper cutoff frequencies (
fu) for the 17 critical bands and the perceptual wavelet packet tree.
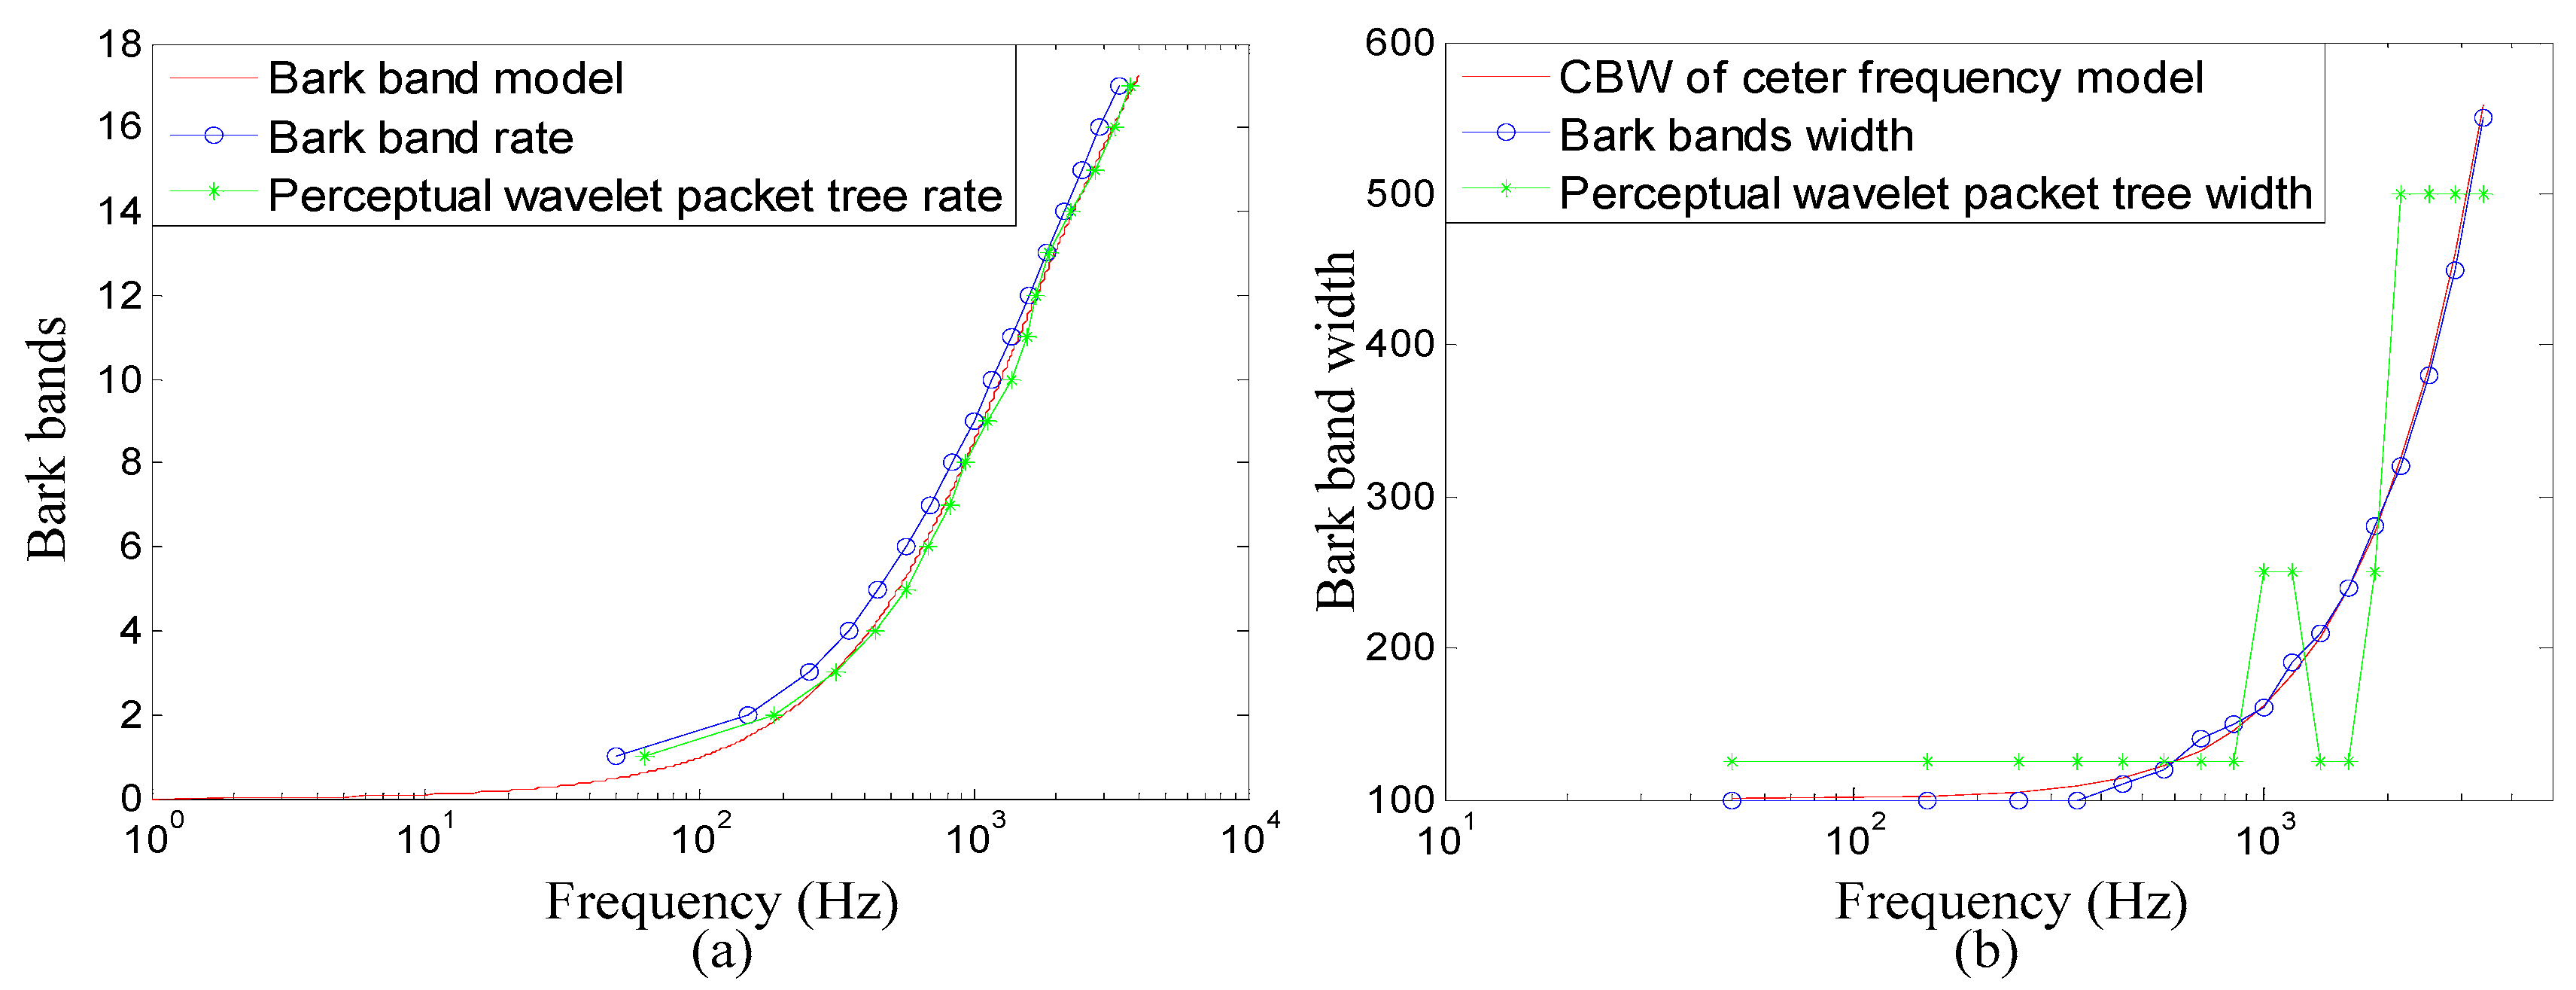
Figure 4a shows the center frequencies of the critical bands and the perceptual wavelet packet tree.
Figure 4b shows the CBW of the critical bands and the perceptual wavelet packet tree. It can be seen from
Table 1 and
Figure 4 that the perceptual wavelet packet tree closely approximates the critical bands of the human auditory system. This demonstrates that the proposed perceptual wavelet packet method decomposes the detected speech signal
y(
n) into 17 subbands that correspond to wavelet coefficient sets
dlj,n, where,
l = 3, 4, 5 and
j = 1,···, 17. It should be noted that better results can be achieved when suppressing the noise in radar-detected speech if the wavelet basis is chosen to be Daubechies6 (db6).
3.3. Modified Thresholding Function
The wavelet threshold plays an important role in suppressing the noise in radar-detected speech. Donoho has presented a very concise method to estimate the wavelet coefficients
di(
n). The threshold of Donoho was given by [
29]:
where
Nj is the signal length in scale
j, and σ is the estimated noise level and is defined by:
where MAD
j is the median absolute deviation estimated on scale
j.
The wavelet thresholding function is also an important factor in wavelet-based methods. The standard thresholding functions used in the wavelet shrinkage algorithm are the soft and hard thresholding functions. The soft thresholding function can be written as:
The hard thresholding function can be written as:
However, these thresholding functions have disadvantages that limit their further development. More specifically, the soft thresholding function tends to have a bigger bias, while the hard thresholding function tends to have a bigger variance [
45].
There are now many thresholding functions that have been proposed for wavelet applications in signal denoising. Gao et al. [
45] proposed a firm thresholding function that remedied the drawbacks of the hard and soft thresholding functions and enabled better denoised results. The firm thresholding function is defined by:
where
T1 equals 2/3
Tj.
The challenge for radar-detected speech is that the noise in radar-detected speech is more complex than traditional microphone speech. Consequently, use of the firm thresholding function results in severe speech distortion. This is because the radar-detected speech consists of predominantly low frequency components, and if all frequency components below a certain threshold are removed, then some essential signal information is also removed.
Yasser [
46] proposed a new thresholding function that is given by:
where the
γ parameter can be determined by optimization. Although this thresholding function is suitable for radar-detected speech enhancement, it also has a problem in that it preserves any high frequency noise in the detected speech.
In this paper, we propose a modified thresholding function that is intended to solve the listed problems in the two previous functions. The modified function is a combination of the previous two thresholding functions, and is defined as:
The experimental results show that when parameter γ is equal to three, this function provides better results in suppressing the noise radar-detected speech.
4. Results and Discussion
The performance of the proposed algorithm is evaluated in this section. For comparison purposes, two noise suppression algorithms that include spectral subtraction and wavelet shrinkage were also evaluated. Speech time domain waveforms and spectrograms constitute a well-suited tool for evaluating the quality of speech because they can be used to evaluate the extent of the noise reduction, residual noise, and speech distortion by comparing the original radar-detected speech to the enhanced speech. Listening tests were performed to evaluate the performance of the proposed algorithm. In the listening tests, listeners were instructed to evaluate the intelligibility of the original radar-detected speech and the enhanced radar speech based on the criteria of the mean opinion score test (MOS), which is a five-point scale (1: bad; 2: poor; 3: common; 4: good; 5: excellent). All listeners were healthy with no reported history of hearing disorders. In addition, the signal-noise ratio (SNR) was used as an objective measure to evaluate the proposed method’s performance. In this section, one sentence of Mandarin Chinese consisting of the words “1-2-3-4-5-6” spoken in sequence was used for evaluation purposes. To guarantee high quality speech signals, a distance of 2 m was selected as the representative distance from loudspeaker to sensor.
4.1. Speech Spectrograms
Figure 5a–d shows the waveforms of the original radar speech, the speech enhanced using the spectral subtraction algorithm, the speech enhanced using the wavelet shrinkage algorithm, and the speech enhanced using the proposed method.
Figure 5e–h shows the spectrograms of the original radar speech, the speech enhanced using the spectral subtraction algorithm, the speech enhanced using the wavelet shrinkage algorithm, and the speech enhanced using the proposed method.
Figure 5a,e shows the original radar-detected speech signals. It can be seen from the figures that the original radar-detected speech is contaminated by noise, and the noise is spread across all of the frequency components. As was previously noted, the sources of noise in the radar-detected speech are more complex than those in traditional microphone speech. This is because the sources of noise are a combination of electromagnetic, ambient, and channel noise.
Figure 5b,f show the original radar-detected speech after processing using the spectral subtraction method. It can be seen that this algorithm is effective in suppressing the noise in the radar-detected speech both in the speech and non-speech sections. In addition, the noise in all of the frequency components has been removed. However, some new “musical noises” [
47], which are similar to the sound of rhythmic music, have been introduced. Consequently, the level of noise reduction achieved using this method is not satisfactory.
Figure 5c,g show the original radar-detected speech after processing using the wavelet shrinkage method. It can be seen from the figures that the noises have mostly been removed, especially in the high frequency components. However, there is still too much remnant noise in the low frequency components. Consequently, the quality of the radar-detected speech has not been improved.
Figure 5d,h show that the proposed algorithm not only effectively reduces the noise in the radar-detected speech both in the speech and non-speech section, but also reduces the noise across all of the frequency components. These results demonstrate that the proposed method is able to achieve higher performance than that achieved by spectral subtraction and wavelet shrinkage algorithms because it closely approximates the critical bands of the human auditory system. For these reasons, the proposed method provides an effective way to reduce the noise in radar-detected speech.
4.2. Listening Tests
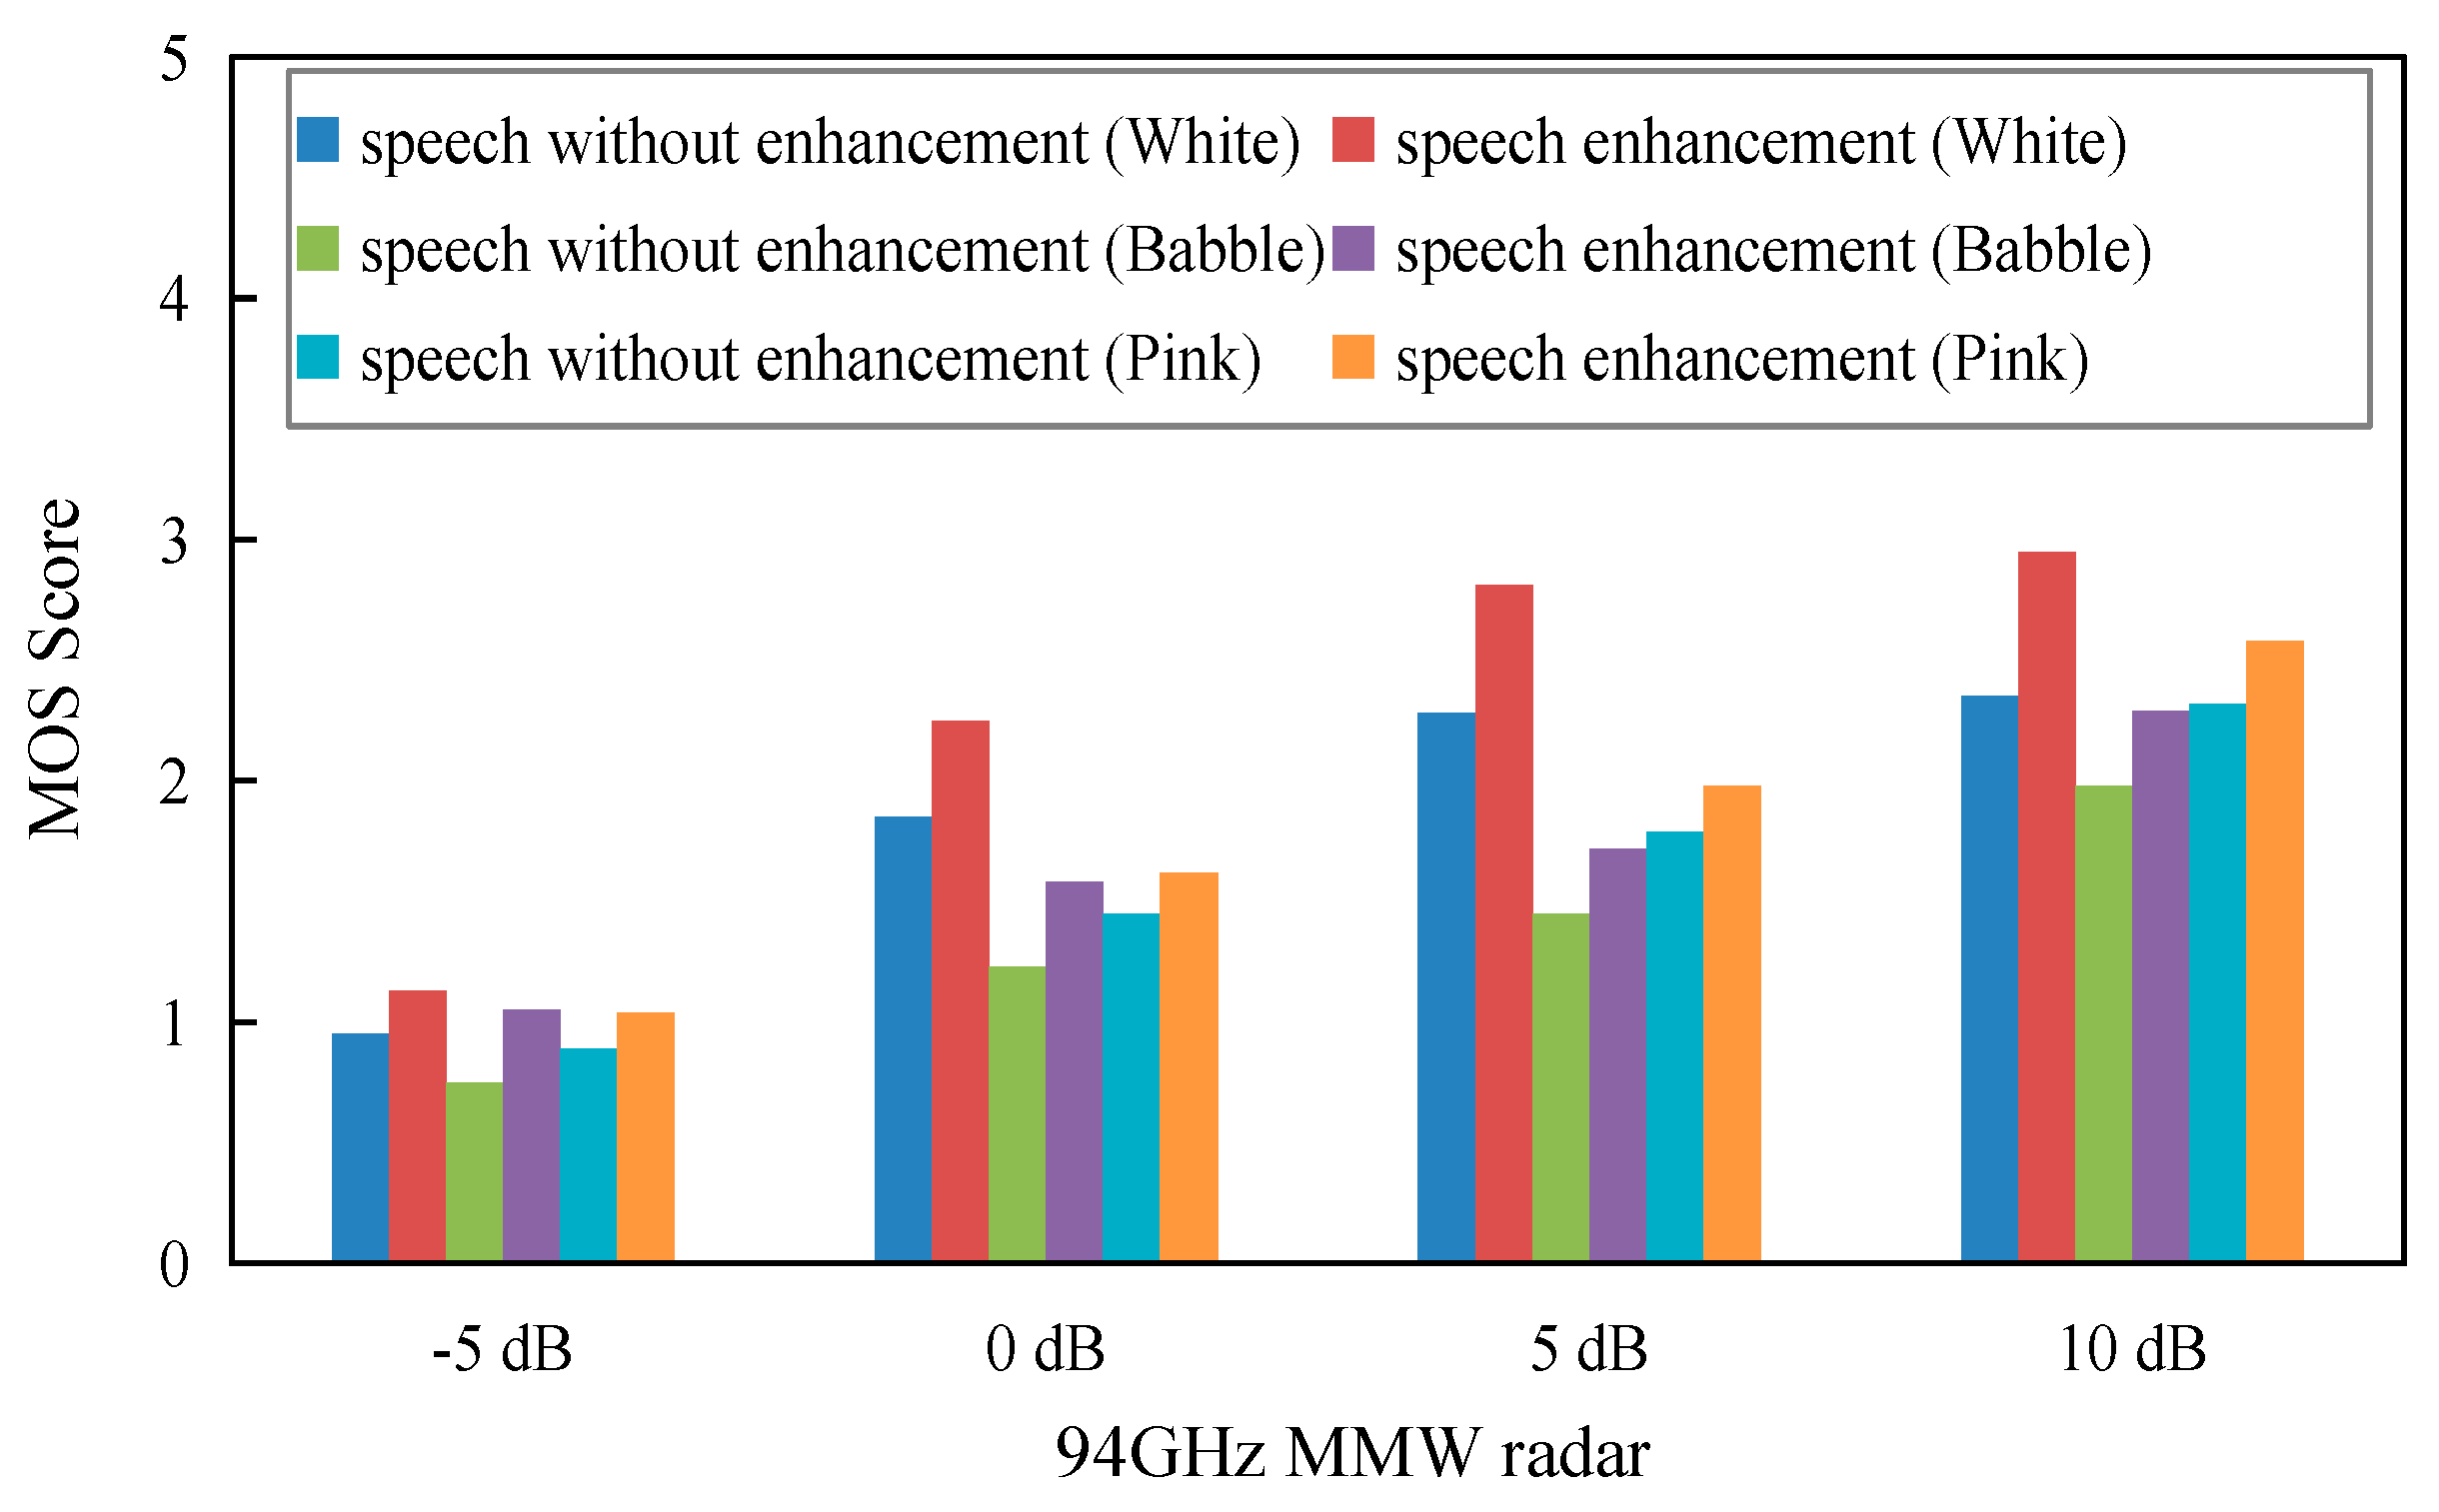
In the experiments, three types of noise were selected from the NOISEX-92 database [
48], namely white noise, pink noise and babble noise, and added to the original radar-detected speech with SNR inputs of −5, 0, 5, and 10 dB. Four listeners were instructed to evaluate the performance of the three algorithms being tested by listening to the noisy speech signals. The averaged MOS scores for the noisy radar-detected speech and the enhanced noisy radar-detected speech are presented in
Figure 6. From the figure, it can be seen that the score of the original noisy speech is approximately “2”, and this implies that the quality of the noisy speech is quite poor. However, the score of the enhanced radar speech obtained using the proposed algorithm is acceptable. It also can be seen from the figure that speech signals with higher SNR have correspondingly higher MOS scores For example, for an SNR of 10 dB, the increase in the score for white noise is 0.6; however, the score is only 0.28 when the SNR is −5 dB. This suggests that the proposed algorithm is more suitable in conditions where the SNR is higher. When we compare the three types of noise shown in
Figure 6, we find that the MOS scores in the presence of white noise are higher than the scores in the presence of babble and pink noise. This suggests that the proposed algorithm is more “sensitive” to white noise. However, it does not provide satisfactory results in the presence of babble noise.
The radar speech detection experiments demonstrated that the radar-detected speech was shown to have high directional sensitivity and to be immune to strong acoustical disturbance. Therefore, the SNR of the radar-detected speech is expected to be much higher than that of traditional microphone speech. This suggests that the perceptual wavelet packet is suitable for suppressing the noise in radar-detected speech.
The noise in the radar-detected speech was primarily white noise. Thus, in order to further evaluate the performance of the proposed method, ten listeners were selected to listen to the original radar-detected speech and the speech that was enhanced using the three algorithms. The results of the averaged MOS scores are presented in
Table 2. The average score for the original radar speech is 3.28. It can be seen from the table that all the scores for the enhanced speech using the three algorithms are improved, and the proposed method achieved the highest score. The MOS score for the spectral subtraction method was lower than both the wavelet shrinkage and the proposed methods. This is because the spectral subtraction method introduced some musical noise into the enhanced speech. The listening tests confirm that the proposed enhancement method is an effective way to suppress the noise in radar-detected speech.
4.3. Objective Evaluation
It is possible to determine the amount of noise reduction in a system by measuring the SNR. For this reason, SNR is widely used as an objective method to evaluate the performance of the proposed algorithm.
Table 3 shows a comparison between the SNR that was obtained using the different enhancement algorithms on speech signals corrupted by white noise with SNR ranging from −5 to 10 dB. As shown in the Table, the proposed method achieved higher performance than the performance of the other speech enhancement algorithms at the same SNR condition, especially when the incoming SNR was high. The spectral subtraction algorithm achieved a relatively satisfactory result under low SNR conditions; however, the results were poor under high SNR conditions. This is because the algorithm introduced some new “musical noise”. The key advantage of the proposed method is that it decomposes the speech signal using a perceptual wavelet packet, which closely approximates the critical bands in the human auditory system. These results suggested that the proposed method is suitable for the enhancement of radar-detected speech.
In order to test the computational complexity of the proposed algorithm, the running time of the three algorithms was computed for the same sentence running on the same hardware resource. The sentence that was chosen was the Mandarin Chinese “1-2-3-4-5-6”, and the hardware resource was a Pentium R 3.0 GHz CPU (Intel Corporation, Santa Clara, CA, USA), with 2 GB of RAM (Toshiba Corporation, Minato-ku, Tokyo, Japan). The running time of the spectral subtraction was 0.6428 s, and the running times for the spectral subtraction and wavelet shrinkage were 0.3239 s and 0.3391 s, respectively. These times suggest that the proposed algorithm consumes more hardware resources than the other two algorithms. This is because the proposed method decomposes the speech signal into 17 Bark bands and then removes the noise in each scale. The computational time can be reduced if the decomposition scale is decreased. Based on these results, the proposed algorithm was shown to be an effective way to remove the noise in detected speech signals.
5. Conclusions
This paper proposed a new non-contact speech acquisition and signal processing method that uses a 94 GHz millimeter wave (MMW) radar system and is useful in various applications associated with speech. One problem is that the speech detected using a MMW radar system is often degraded by various sources of noise. Therefore, in order to suppress the noise and enhance the intelligibility of the detected speech, this paper proposed a novel perceptual wavelet packet method.
In the experiments, we found that the proposed algorithm was more “sensitive” to the presence of white noise in the detected speech signals. As the noise in the radar-detected speech is primarily white noise, this new signal processing method is suitable for enhancing the quality of radar-detected speech.
This method is expected to enable promising research and development applications in speech production, speech recognition, and related topics. For example, accurate pitch extraction is always one of the most key issues in speech recognition and synthesis, and the proposed radar system will provide a promising way to extract the pitch directly from the vibration of the vocal cords.


 ,
, 


