Exergoeconomic Analysis of Corn Drying in a Novel Industrial Drying System

College of Engineering, South China Agricultural University, Guangzhou 510642, China
*
Author to whom correspondence should be addressed.
Entropy 2020, 22(6), 689; https://0-doi-org.brum.beds.ac.uk/10.3390/e22060689
Submission received: 19 May 2020
/
Revised: 12 June 2020
/
Accepted: 14 June 2020
/
Published: 20 June 2020
(This article belongs to the Section Thermodynamics)
Abstract
:The improvement of the design and operation of energy conversion systems is a theme of global concern. As an energy intensive operation, industrial agricultural product drying has also attracted significant attention in recent years. Taking a novel industrial corn drying system with drying capacity of 5.5 t/h as a study case, based on existing exergoeconomic and exergetic analysis methodology, the present work investigated the exergetic and economic performance of the drying system and identified its energy use deficiencies. The results showed that the average drying rate for corn drying in the system is 1.98 gwater/gdry matter h. The average exergy rate for dehydrating the moisture from the corn kernel is 345.22 kW and the exergy efficiency of the drying chamber ranges from 14.81% to 40.10%. The average cost of producing 1 GJ exergy for removing water from wet corn kernels is USD 25.971, while the average cost of removing 1 kg water is USD 0.159. These results might help to further understand the drying process from the exergoeconomic perspective and aid formulation of a scientific index for agricultural product industrial drying. Additionally, the results also indicated that, from an energy perspective, the combustion chamber should be firstly optimized, while the drying chamber should be given priority from the exergoeconomics perspective. The main results would be helpful for further optimizing the drying process from both energetic and economic perspectives and provide new thinking about agricultural product industrial drying from the perspective of exergoeconomics.
1. Introduction
Drying is the process of removing moisture from natural products (e.g., agricultural products, wood and fruit) or industrial materials (e.g., lignite, ceramics and medical materials) down to a specific moisture content, while ensuring prime product quality, high throughput and minimal operational costs [1]. Drying is a highly energy-intensive operation in grain industrial production. According to the literature [2,3,4], drying operations consume about 10–25% of national energy use each year. Considering the environmental effect and the limited amount of natural resources to produce energy, it is of great economic value and social significance to explore evolutionary and revolutionary technological drying technologies and processes.
In recent decades, researchers have undertaken a large number of studies of new drying technologies and processes [5,6,7,8,9]. Although the existing literature has reported new drying technologies and processes for specific materials, few works have reported on industrial-scale drying systems, especially for grain drying. An industrial drying system is a complex system composed of several parts. In the drying process, different kinds of energy resources (e.g., natural gas, coal) provide the corresponding energy for maintaining the operation of the drying system. Inherent to this process, energy is wasted in the various devices involved due to the irreversibility of energy conversion [10]. It is thus necessary to reveal where and how much energy is lost and destroyed in the drying system. Exergy analysis is an effective method to identify methods and possible benefits of designing more efficient thermal systems through the reduction of existing inefficiencies [11]. Moreover, exergy analysis is an effective tool to evaluate the sustainability and environmental impact of a production system. In 2001, Rosen and Dincer proposed an interdisciplinary triangle for exergy analysis, noting that exergy is the confluence of energy, the environment and sustainable development [12]. In the same year, Rosen and Dincer also illustrated the relationships among environmental impact, sustainability and exergy efficiency. Based on the concept of exergy and its extensions, a significant amount of research has been undertaken on the analysis of the energy utilization level of agricultural product drying systems, as tabulated in Table 1.
As mentioned above, the ultimate objective of drying is to obtain a high-quality dried product with minimal operational costs and maximum benefits. Hence, in addition to energetic performance and quality evaluation, economic evaluations should also be performed of drying systems for specific materials. Exergoeconomic analysis is an interdisciplinary subject which combines exergy analysis and economics analysis organically. The method, which is based on the second law of thermodynamics, introduces the basic ideas of system engineering, optimization theory, and decision theory, and has special advantages in analyzing and optimizing complex energy systems [20]. With the development of exergoeconomics, Lozano, M. A.; and Valero, A. proposed the exergy cost theory [21], which formulates the fundamentals and criteria that enable the description of the cost formation process and the assessment of the efficiency in energy systems. The methodology has been widely verified to be applicable to energy and economic analysis, including of bituminous coal fired power plants [22], drying systems [23] and municipal solid waste digestion plants [24]. Although a large number of reports based on the exergy cost theory have been published in recent years, few works have been reported on the application of the theory to industrial-scale agricultural product drying systems [25,26,27].
In order to achieve the aim of efficient, economical and environmentally-friendly post-harvest processing of grain, researchers have made significant efforts to develop innovative drying systems. For example, Sarker M. S. H. et al., reported an industrial fluidized bed dryer with drying capacity of 22 t/h in 2015. Results of analysis showed that the energy efficiency of the drying process ranged from 5.24% to 13.92%, and the study recommended that energy efficiency should be further improved by recycling the waste energy in the exhaust air and enhancing the insulation of the dryer body [28]. Ma X. Z. et al., introduced a grain counter-flow drying system with drying capacity of 12.5 t/h; the authors found that the heat loss in outlet air ranges from 1.86% to 21.26% of the total heat supply and exergy efficiency should be improved by recycling the waste heat in flue gases [29]. Considering these recommendations and based on our previous work, the present study proposes a novel industrial-scale drying system with a waste heat recovery function developed by our team. The existing advanced energy–exergy methodology was employed to estimate the energetic and exergetic performance and heat recovery behavior of the drying system, while an exergoeconomic methodology was adopted to reveal the costs related to each exergy stream and each component of the complex drying system. In addition, quality aspects, including impurities and the damage ratio of the product, were also investigated to increase the economic benefit in the corn processing industry.
2. Materials and Methods
The corn (Variety: Changcheng 799#) was freshly harvested from a local farm at Xinzhou City, Shanxi Province, China. The average initial moisture content of the corn kernel was ascertained to be 32.2 %d.b. using the 105 °C constant weight methodology [30], and the final moisture content of the dried product was considered to be 14 %d.b. [31].
2.1. System Description and the Working Principle
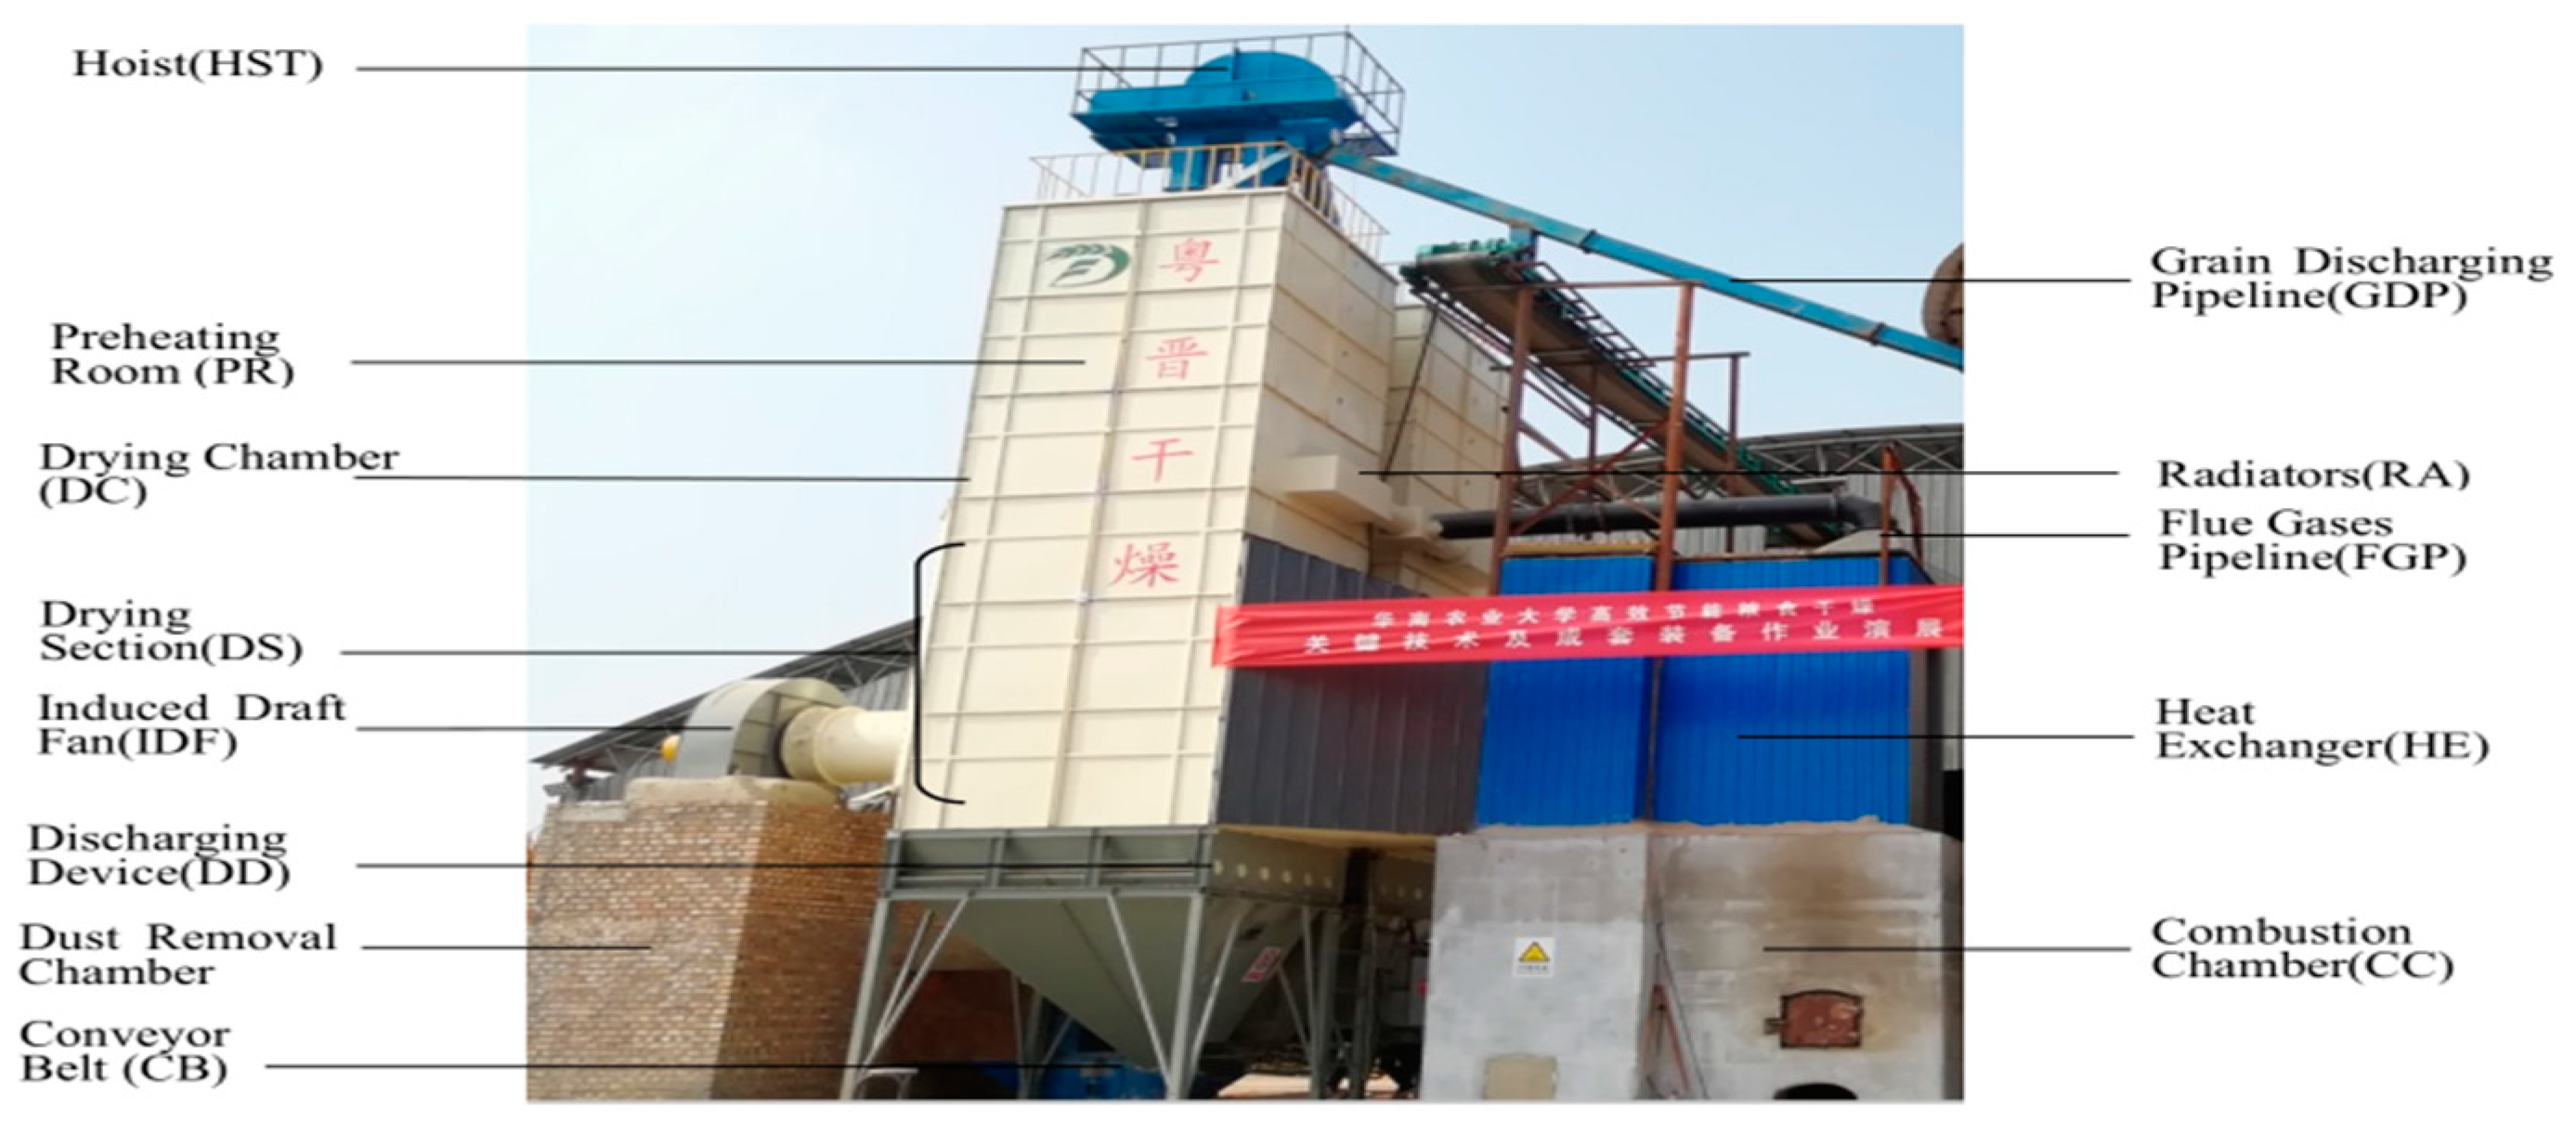
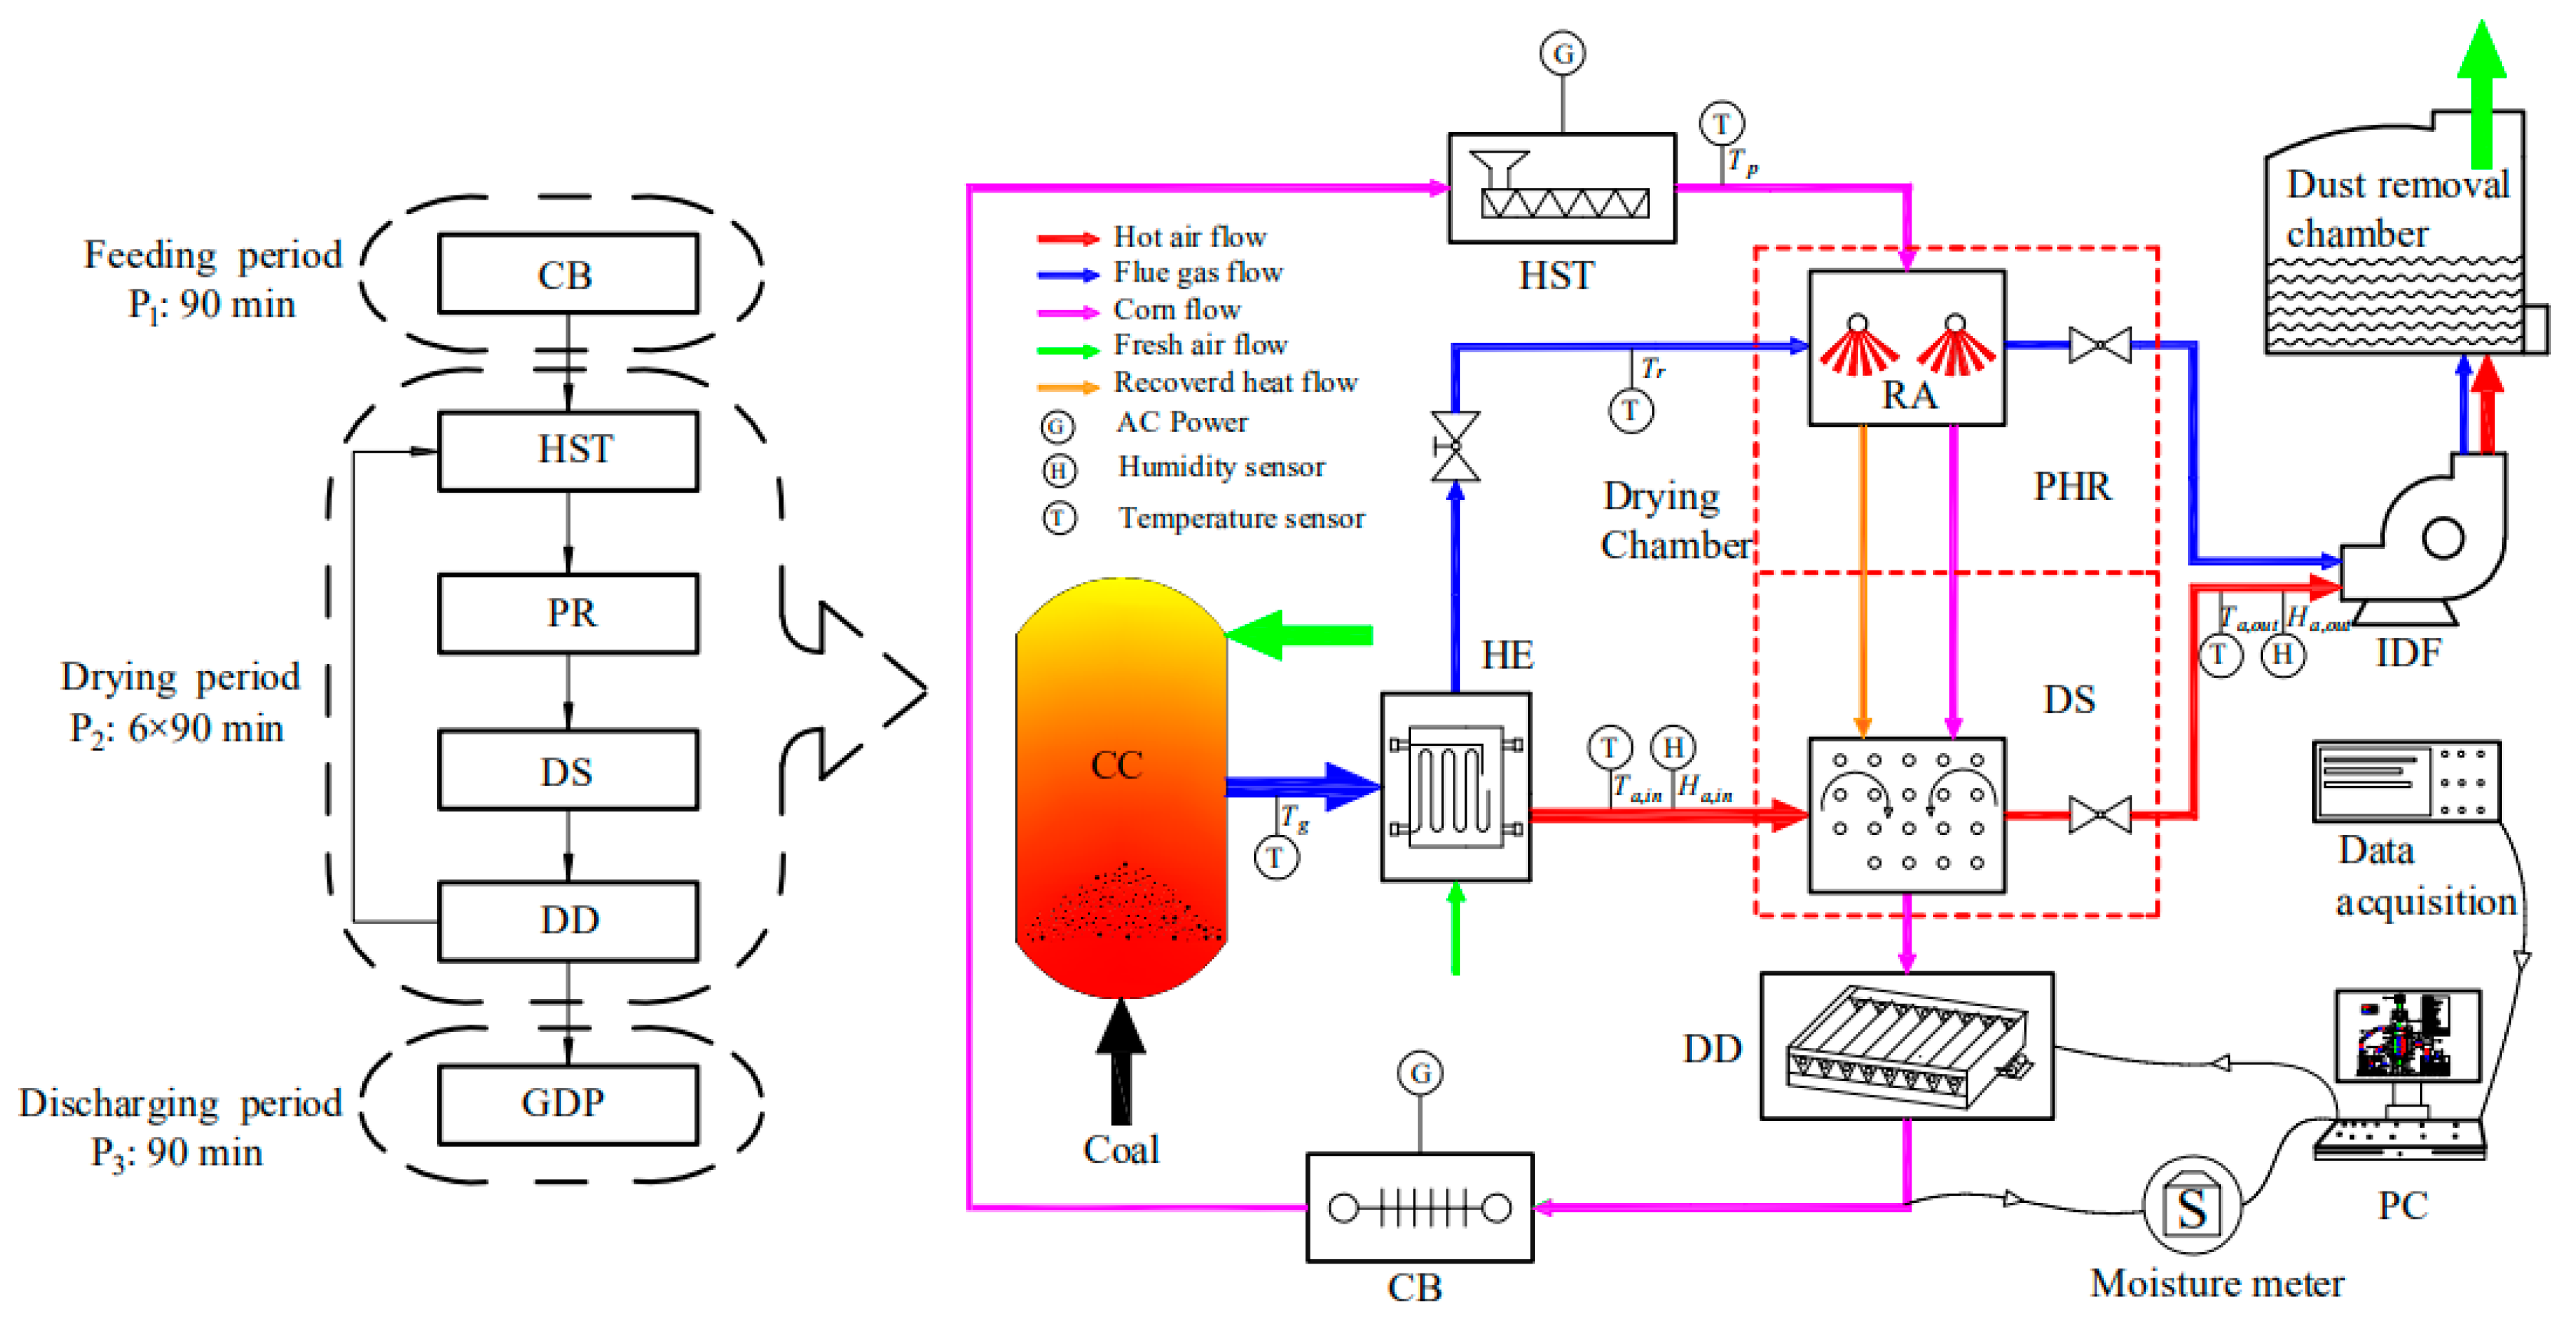
The industrial drying system with drying capacity of 5 t/h is shown in Figure 1. As can be clearly seen from the figure, the system consists of eight main components: combustion chamber (CC), heat exchanger (HE), hoist (HST), preheating room (PR) consisting of eight far infrared radiators, drying chamber (DC), induced draft fan (IDF), discharging device (DD), and dust removal chamber. The overall drying operation consists of three periods: Feeding Period (P1)—the corn is lifted by hoist and the drying chamber is completely full after 90 min. Drying Period (P2)—after the drying chamber is full, the pre-combustible drying chamber, induced draft fan and discharging device are sequentially opened and the whole system then runs for about 9 h. Discharging Period (P3)—when the moisture content is about 15 %d.b., the induced draft fan in the drying chamber is shut down, the grain discharge valve on the top of the dryer is opened, and the dried corn is discharged through the grain discharging pipeline, as shown in Figure 1. This period lasts about 90 min. The drying process and the time needed for each period are shown in the Figure 2. The operating data of the system is shown in Table 2.
2.2. Data Collection
During the overall drying operation, the temperatures of the drying chamber (TDC), inlet flue gases (Tg,in), outlet flue gases (Tg,out), outlet corn (Tc,out), inlet air flux (Ta,in), outlet air flux (Ta,out), ambient air (T0) and radiators (Tr) were measured by temperature sensors inserted into the corresponding components. The humidity of the inlet air flux (Ha,in), outlet air flux (Ha,out) and ambient air (H0) were measured by corresponding humidity sensors. The measured data were collected by a self-developed data acquisition system. Moreover, the moisture content of the outlet corn (MC) was measured at 90-min intervals (the design time for cycling the full dryer is 90 min) using the 105 °C constant weight methodology [27]. Details of the measurement instruments are shown in Table 3.
2.3. Drying Kinetics
In this work, the dry basis moisture content (MC) and the drying rate (DR) were adopted to investigate the drying kinetics of industrial corn drying, and can be calculated according to Equations (1) and (2) [32]:
where mt is the weight of the material at time t, g; md is the weight of absolute dry matter determined using the 105 °C constant weight methodology.
In addition, the average dehydrated water (mdehy) from the material in any period Δt can be calculated with Equation (3):
2.4. Uncertainty Analysis
In the present work, the uncertainties of the obtained data were ascertained by means of the methodology introduced by Holman in 2001 [33]; the equation is shown in Equation (4). The results showed that the uncertainties of the experimental data ranged from 0.6 to 3.3, indicating that the reliability of the data used for calculating the indicators adopted in the present work was good, in addition to confirming reproducibility [34].
2.5. Theoretical Consideration
To investigate the drying system, several assumptions were taken into consideration in the present work, as follows:
- The drying system and its main components were considered to be run under a steady-state regime.
- The initial weight of the corn was considered to be 50,000 kg.
- The temperature gradient existing inside a single rice grain was ignored.
- The inertial flow exergy loss of the air in the chamber was ignored.
- The temperature and the relative humidity of the ambient air on the day of the experiment were considered constant.
- The reference state temperature, pressure and relative humidity were considered to be 281.15 K, 101.325 kPa and 85%, respectively.
- The salvage cost was considered to be 10% of the investment cost and the maintenance cost was taken as 2% of the investment cost [23].
- The oxygen (Oar), moisture (Mar), and ash (Aar) content, and low calorific value (LHV) of the coal as received were assumed to be 3.19%, 8.0%, 19.02%, and 6700 kcal/kg, respectively [35].
2.6. Exergy Analysis
The generally used exergy balance equation [36] was adopted to analyze the exergy rate of each of the components of the drying system, and is expressed as Equation (5):
The exergy rate for removing moisture from the material was determined with Equations (6) and (7) [37,38]:
The radiant exergy rate () recovered by the radiators was computed using Equation (8) [39]:
The exergy rates of the steam entering and leaving the drying chamber were computed by considering the chemical and physical exergies as follows [40]:
According to the literature [37,38,41], the physical and chemical exergy rates of steam can be calculated using Equations (13) and (14):
The physical exergy rate of the inlet and outlet corn seed was calculated with Equation (16):
In the present work, coal (anthracite) without preheating was used as the fuel of the combustion chamber, and its chemical exergy in rate form was determined using Equation (17) [42]:
where φ is the chemical exergy factor of solid coal, which was determined by the following [42]:
Flue gas is a mixture of many chemical components, and its specific heat and exergy depends on the chemical composition of fuels, excess air ratio, and gas temperature. The exergy calculation model developed by C. Coskun et al. was adopted to calculate the exergy of the flue gas [43]:
As mentioned in the introduction, exergy is the confluence of energy, environment and sustainable development. Exergy efficiency (ηex), exergetic sustainability index (SI) [41] and exergy destruction ratio (rD) [44] were adopted to evaluate the exergetic performance of the components and the overall system, and were calculated using Equations (22)–(24):
The values of the parameters needed for the calculations mentioned above are shown in Table 4.
2.7. Exergoeconomic Analysis
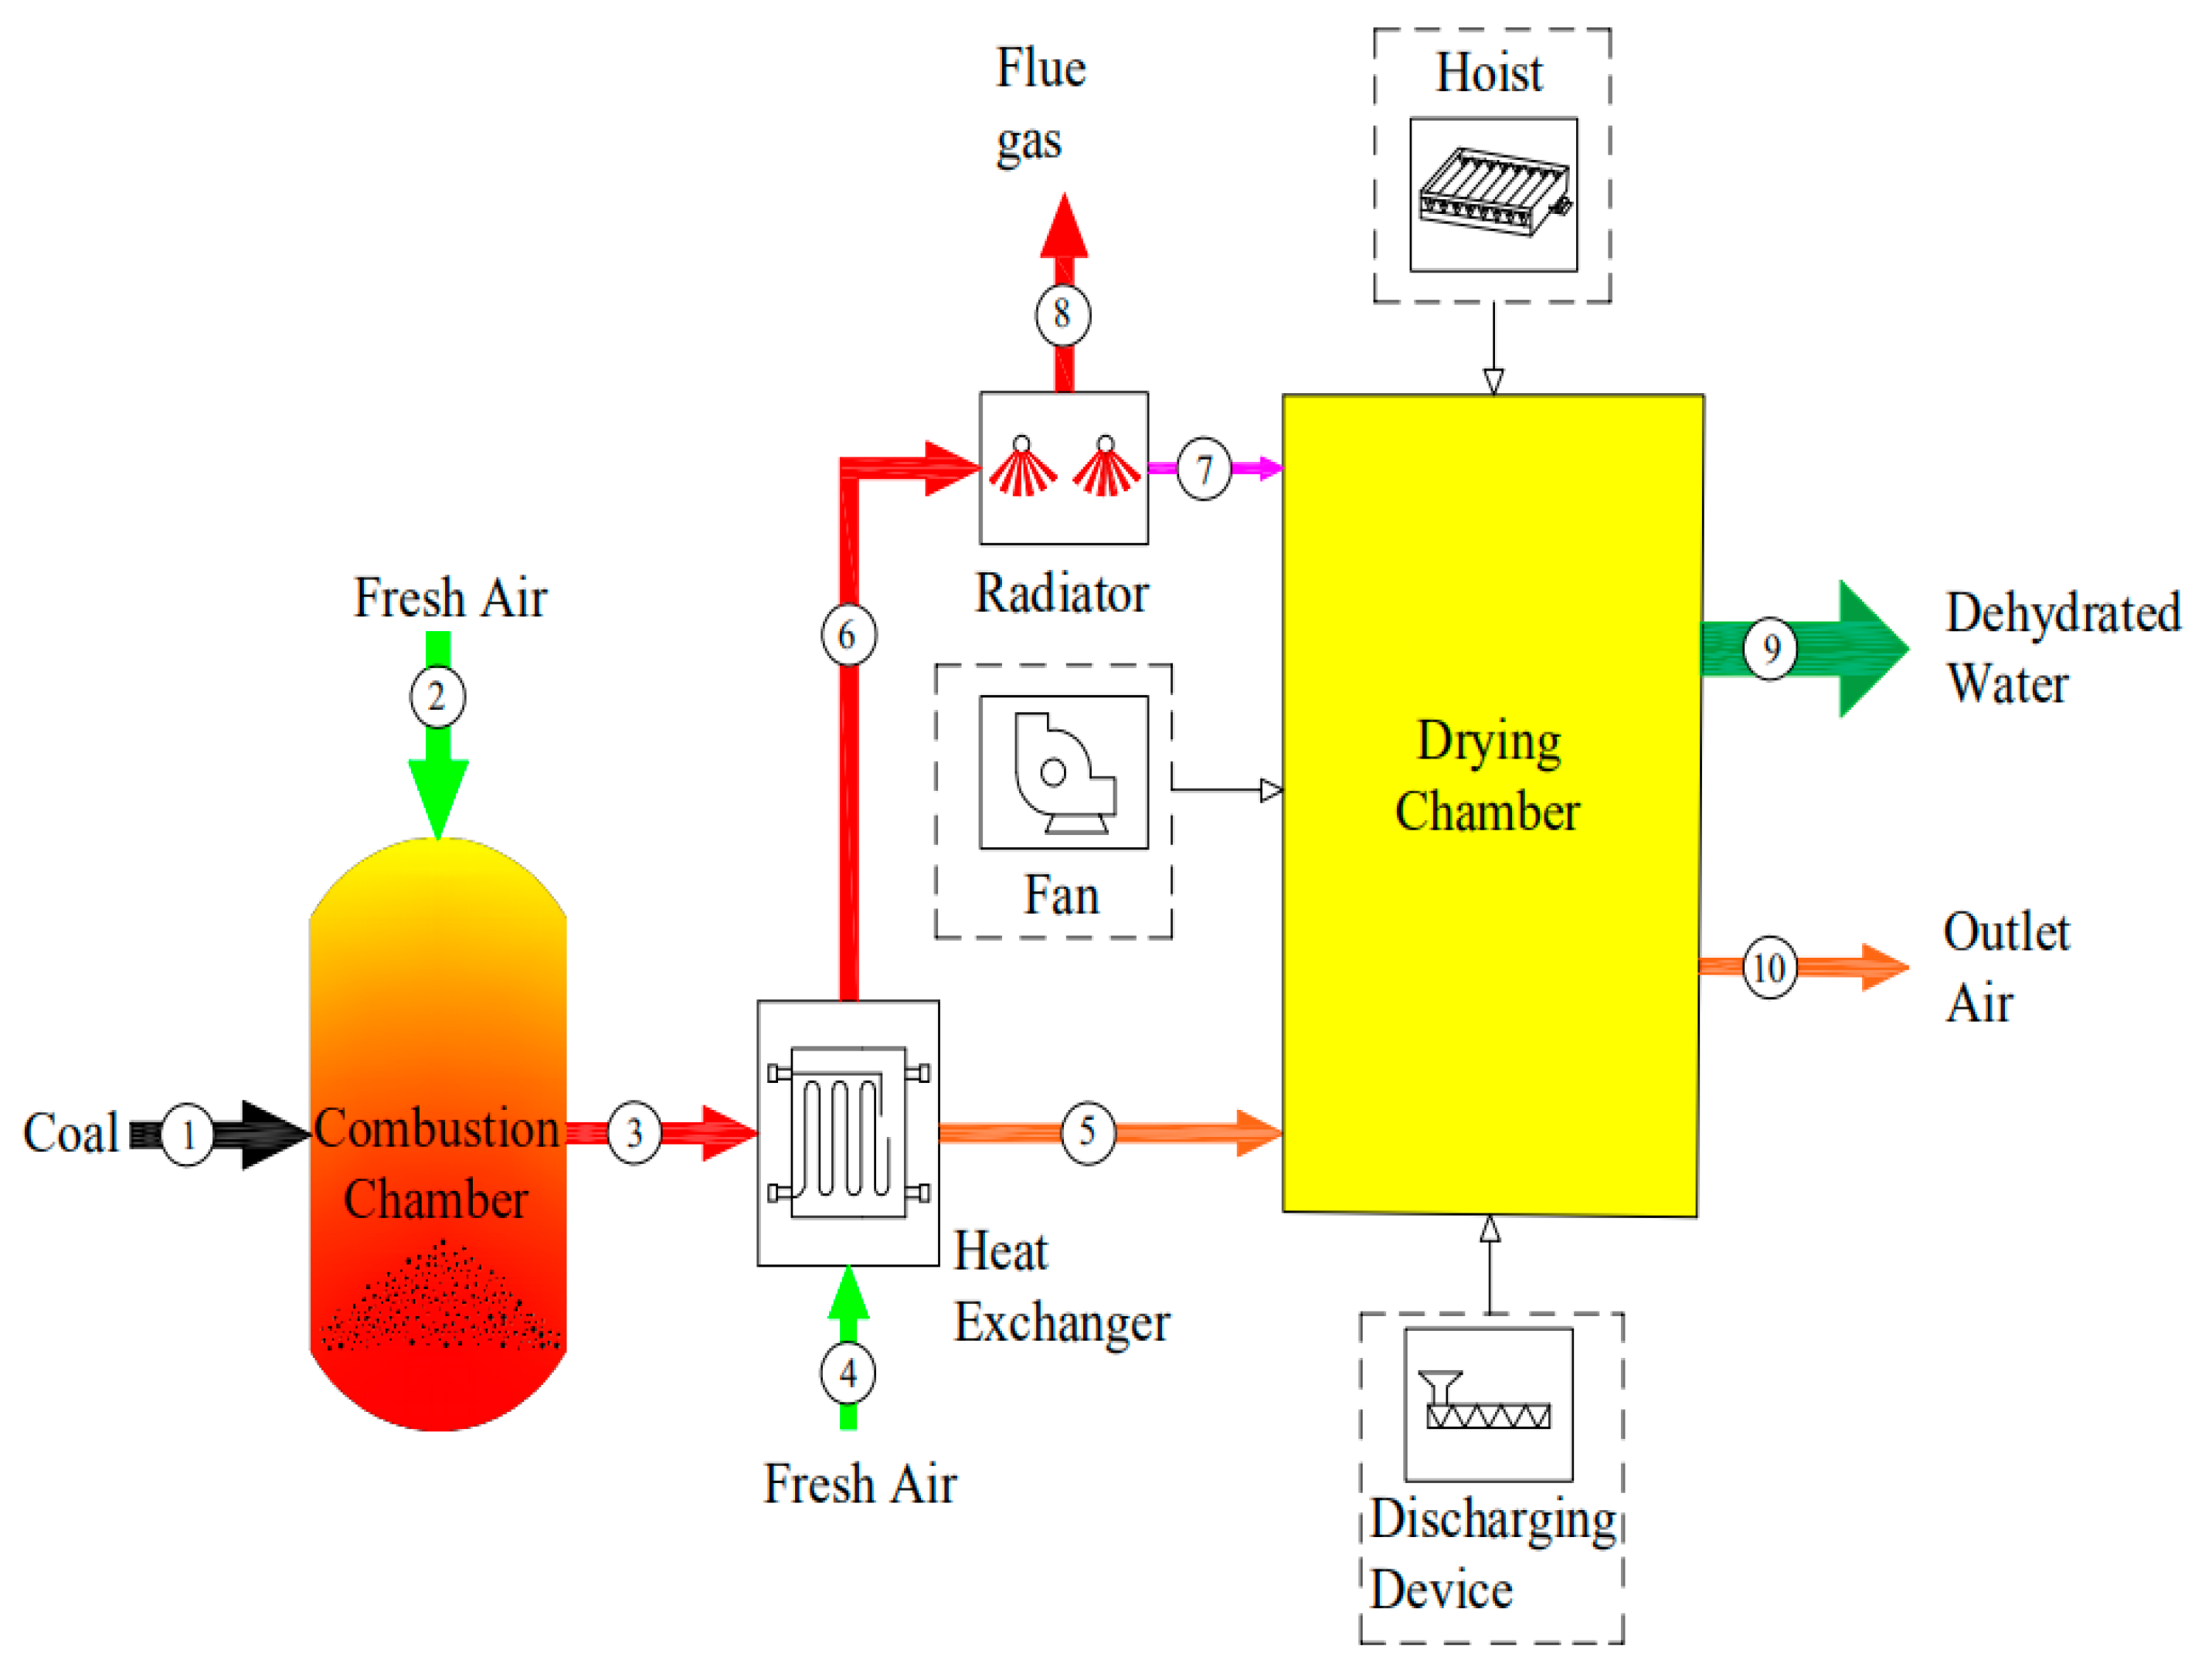
One of the most important concepts in exergoeconomic analysis is the “goal”, which is closely related to the reason why the given components are taken into consideration in the design of a system. From an energy perspective, and for a given component or certain process, the fuel is defined to be the amount of exergy provided by the stream inlet into the component, and the product is the exergy provided by the product streams [37]. The ultimate physical goal of the drying is to remove the moisture from the material. Accordingly, as a basic concept of the exergoeconomic analysis, the present work regarded the removed water as the final product of the system, which is affected by multiple exergy flows (chemical exergy, physical exergy and mechanical exergy). The developed productive structure of the drying system is shown in Figure 3, and the exergy balance equations for each component are shown in Table 5.
Exergoeconomic cost is one of the most important elements of exergoeconomics analysis. For any two adjacent components of the system, the transmission of exergy and cost can be depicted as shown in Figure 4. According to the definition of “product cost = energetic cost + nonenergetic cost” in exergoeconomics analysis [37], the exergoeconomic cost balance equation for a subsystem can be expressed as shown in the figure [48].
The exergoeconomic cost of each of the flows (Ci) making up the product of the i-th component is proportional to its exergy flow, which can be expressed as [27]:
where ci is the unit exergoeconomic cost of the i-th component.
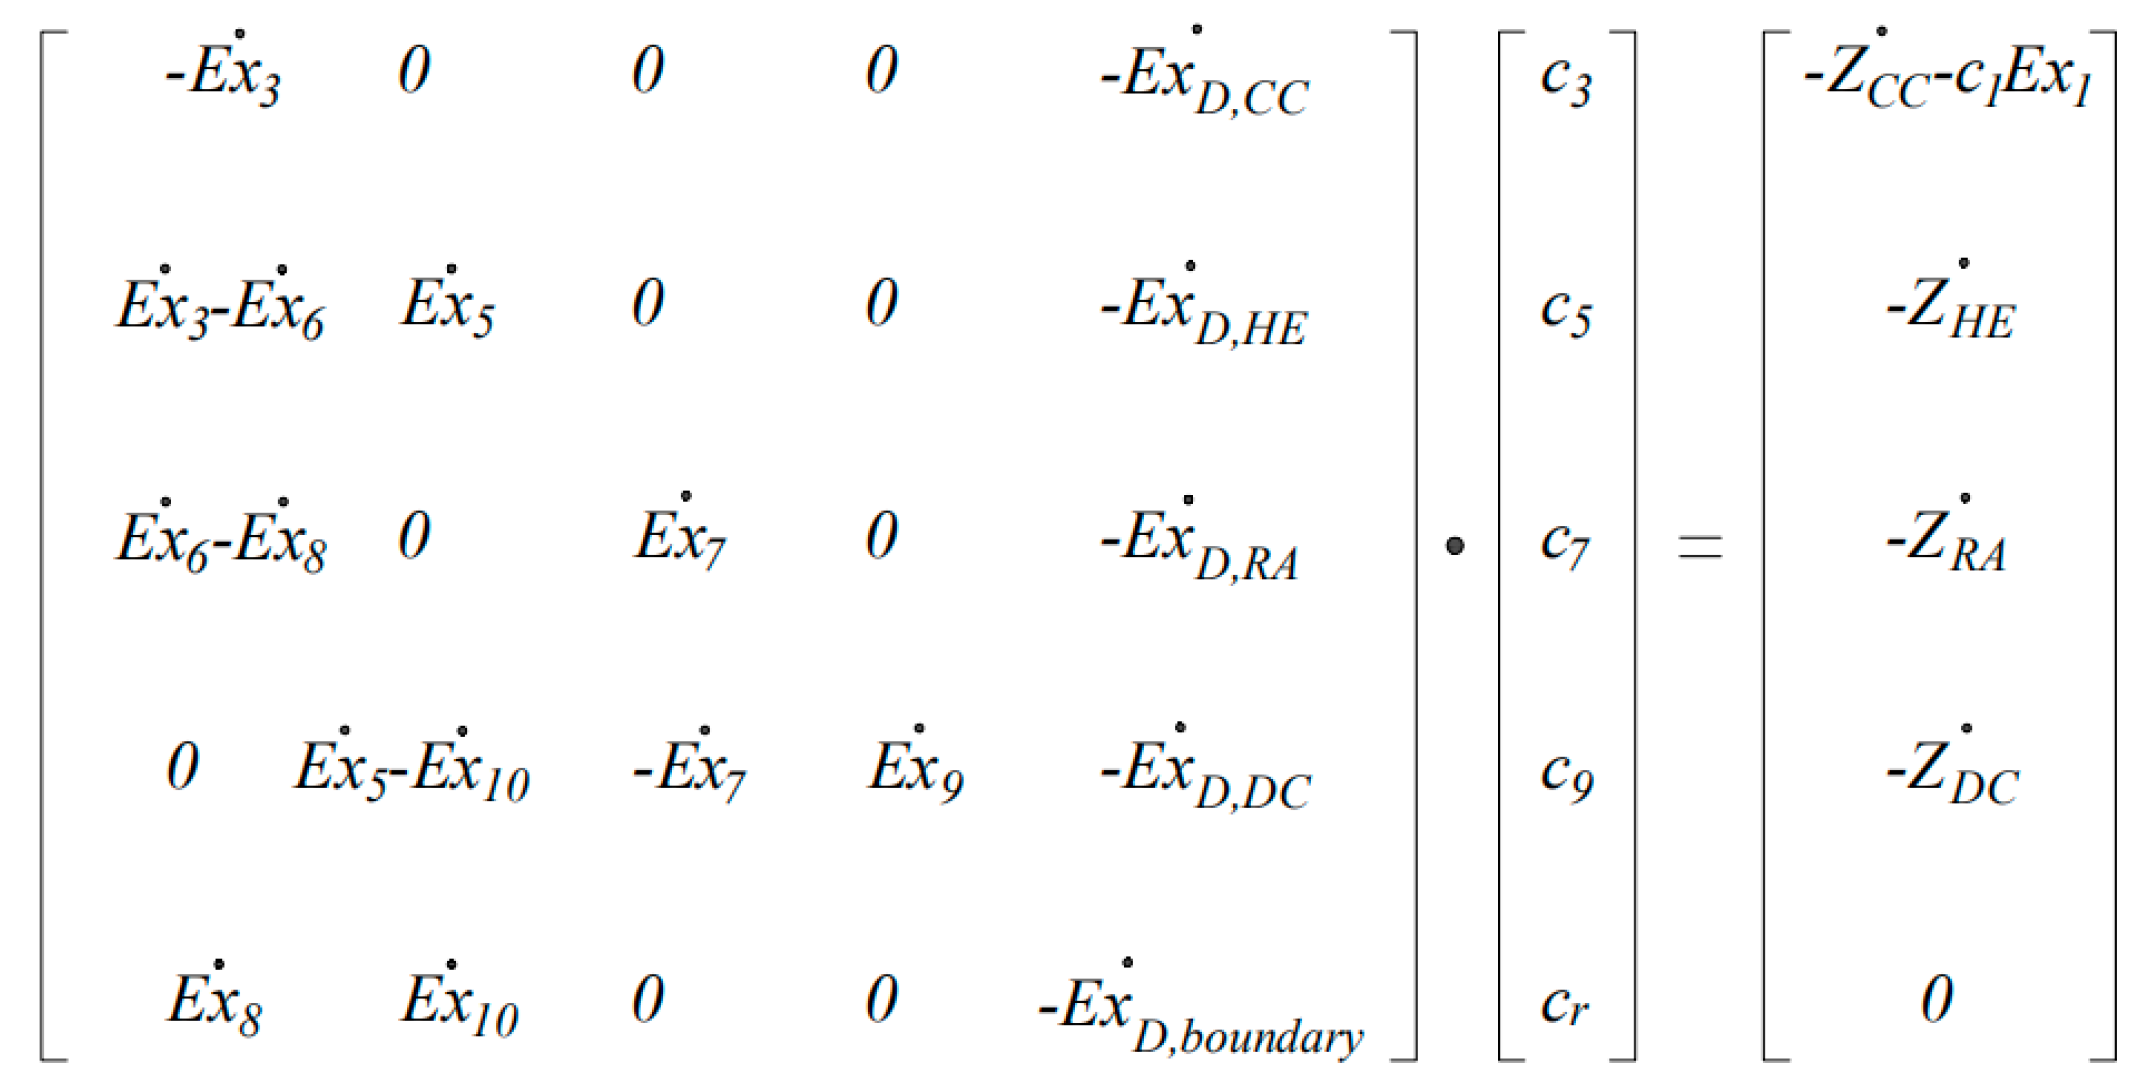
In the present work, the modified productive structure analysis method (MOPSA) introduced by Kim et al. [49] was employed to analyze the exergoeconomic performance of the drying system. Based on the main concept of the methodology, the cost-balance equation for the overall system can be expressed as:
One of the advantages of the MOPSA method compared with the traditional specific exergy costing method is that the cost flow rate related to the waste flow streams dissipated at the boundary of a given thermal system can be allocated to each component as the source [50,51]. The cost flow rate of waste of the present system mainly occurs in the flue gas stream at the RA (number 8 in Figure 3) and hot air flux at the DC (number 10 in Figure 3); therefore, the auxiliary equation at the boundary of the overall system can be written as [52]:
Based on the operation schedule shown in Table 2 and the assumptions in Section 2.5, the hourly Zic, Zsc and Zmc were respectively calculated using Equations (29)–(31) and the results are tabulated in Table 6.
Based on the exergy analysis in Section 2.6 and the exergoeconomic analysis in Section 2.7, the exergoeconomic balance equations of the components are shown in Table 7 and the cost structure of the system is depicted in Figure 5. The relative cost difference (rc,i) between the product cp,i and the fuel cf,i, and the exergoeconomic factor (fc,i), which indicates the relative contribution of the component-related cost to the sum of costs associated with the i-th component [44], were employed to evaluate the energetic and economic performance of the components, and calculated as follows:
3. Results and Discussion
The stream type and calculation-related parameters used for analyzing the exergoeconomic performance of the industrial corn drying system are listed in the Table 8. The mass flow rate, temperatures, and pressure of the corresponding stream are the average measured values of the overall drying operation unit, while the specific exergy and exergy rates are the calculated values based on the exergy analysis in Section 2.5.
3.1. Drying Kinetics
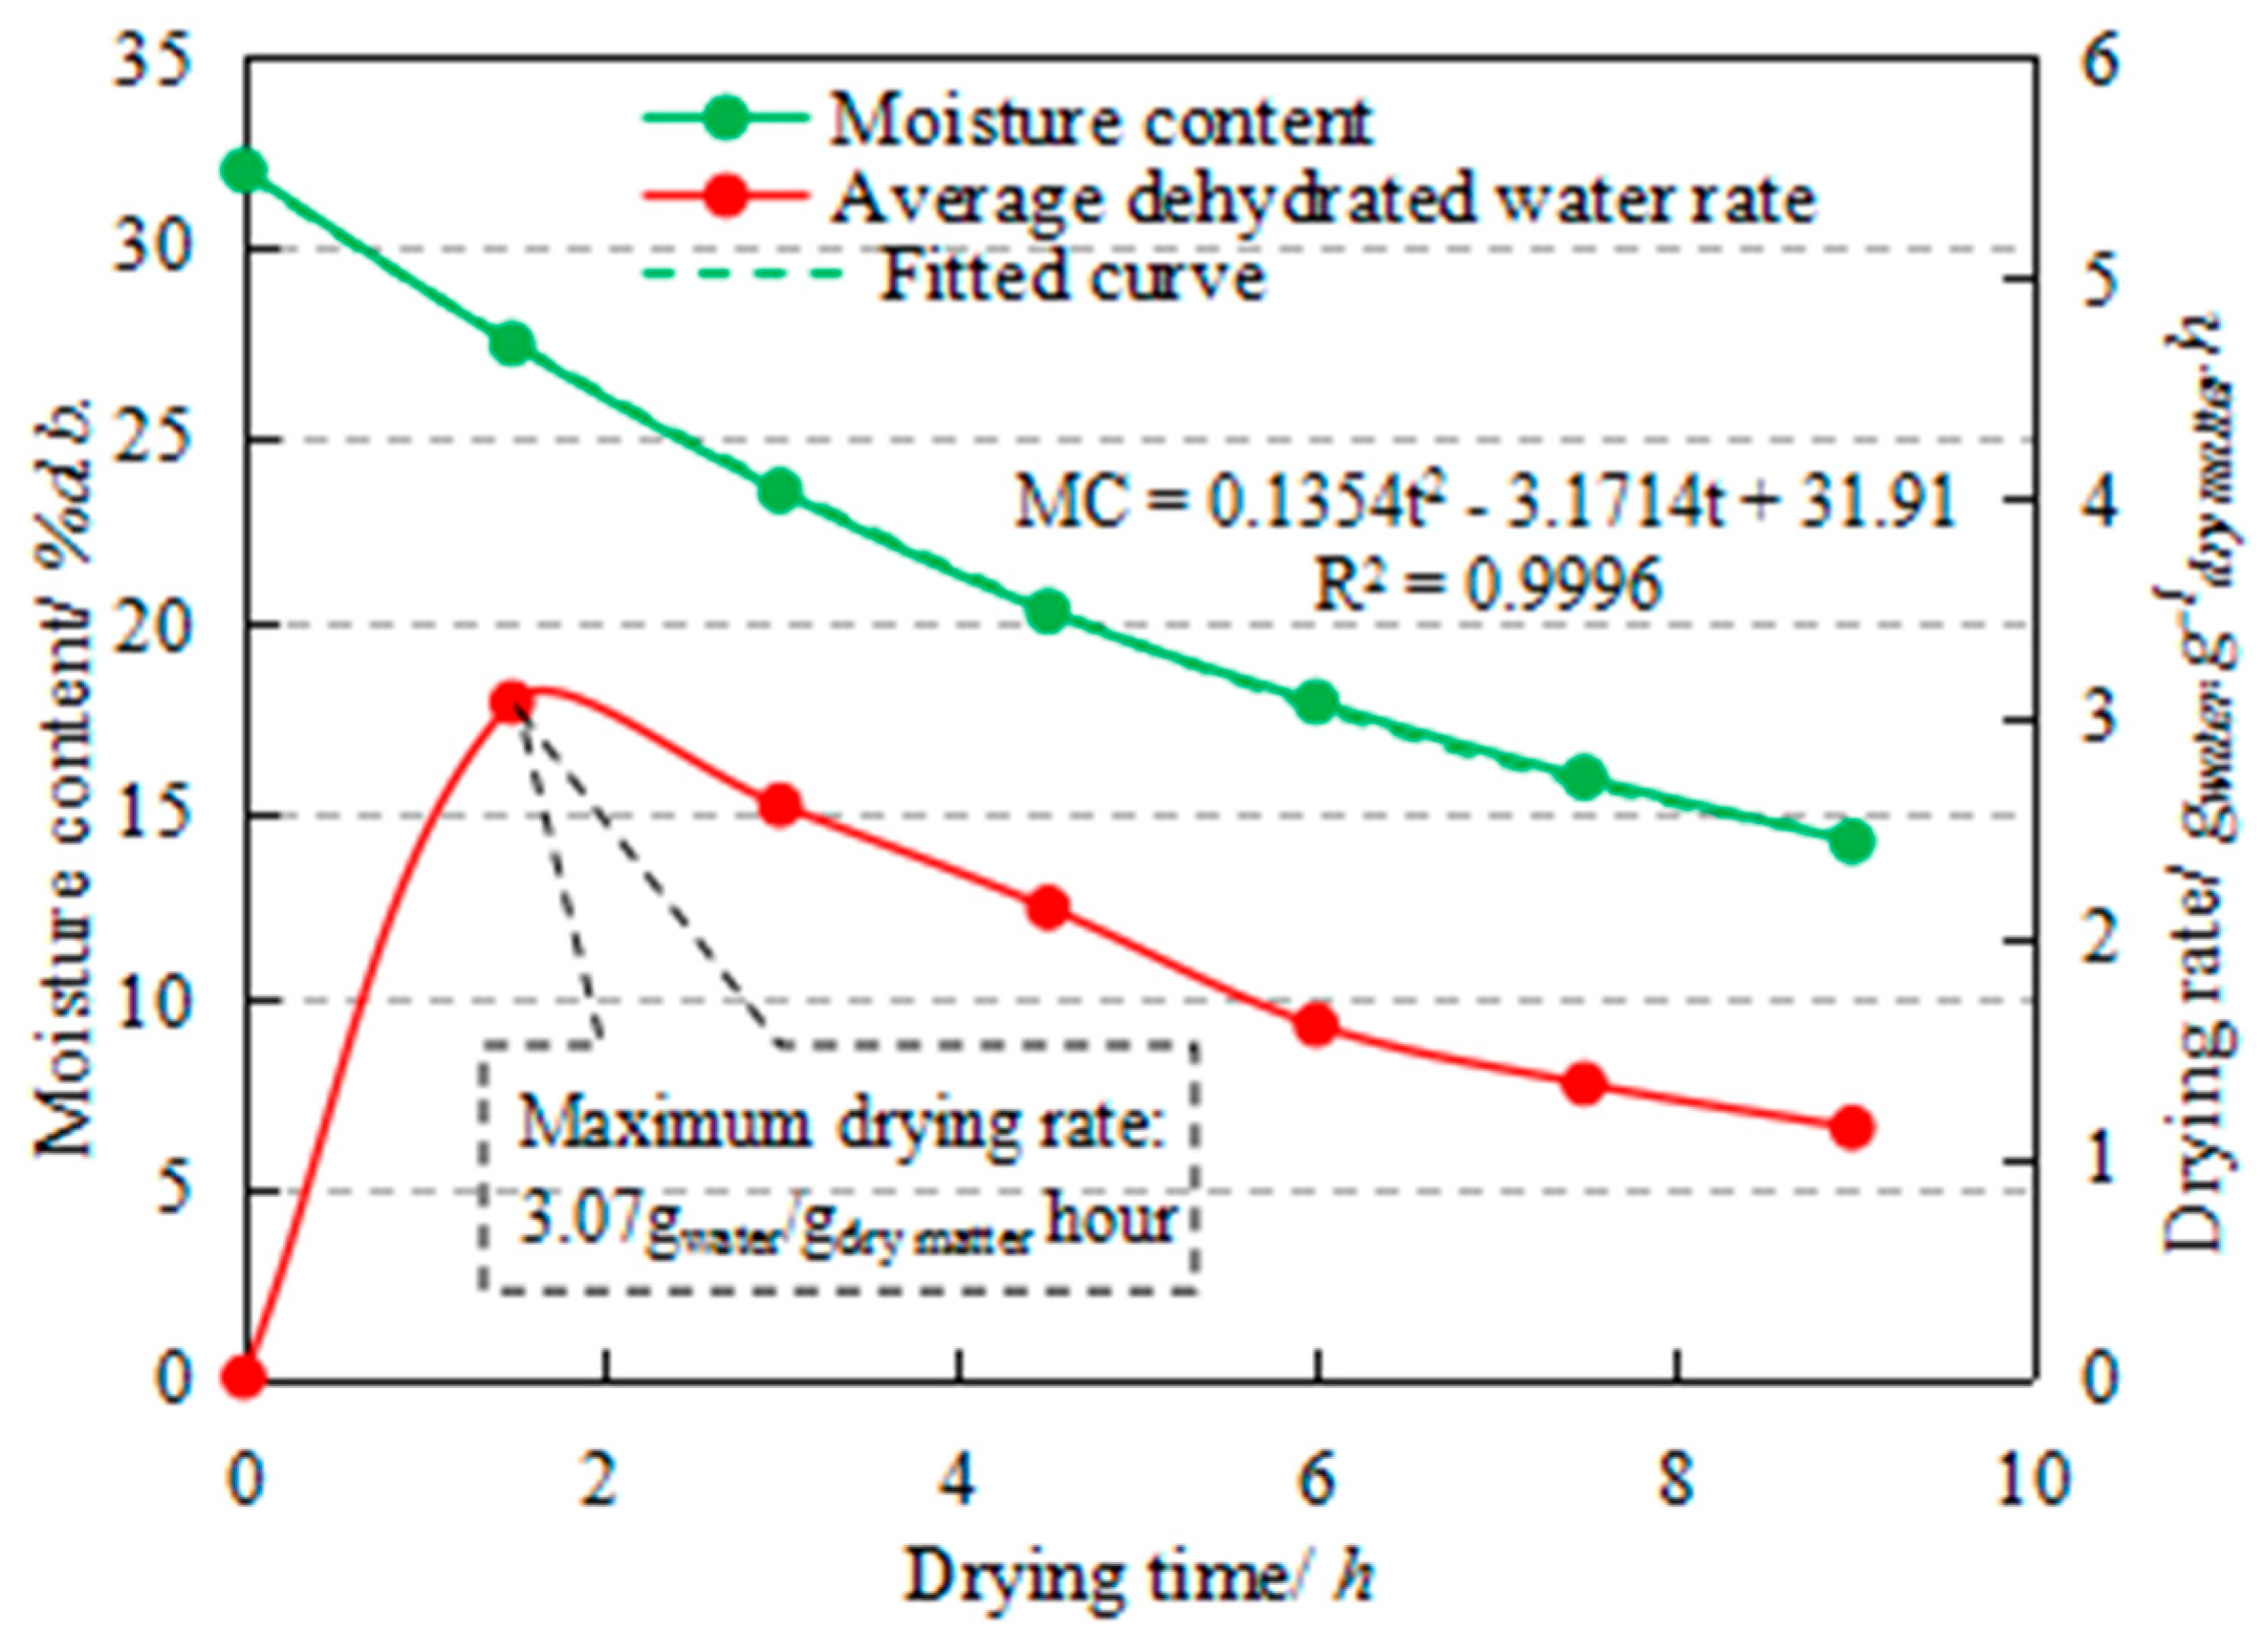
In the present work, the drying kinetics of corn kernels in an industrial dryer with drying capacity of 5.5 t/h were investigated. As mentioned above, the cycling time of the fully loaded dryer was ascertained to be 1.5 h and the moisture content of the corn was measured using the 105 °C constant weight methodology [30] at 90-min intervals. The variations of moisture content and the drying rate with drying time are shown in the Figure 6.
According to the results depicted in Figure 6, the MC and DR decrease with the increase of drying time, DR varied from the minimal 1.13 gwater/gdry matter h to the maximum 3.07 gwater/gdry matter h, and the average DR was ascertained to be 1.98 gwater/gdry matter h for the whole drying process. The maximum drying rate (DRmax = 3.07 gwater/gdry matter h) was found during the first 90 min, which might be because the moisture evaporation of the high moisture content of the material can be considered to be free water evaporation [10]. From the perspective of drying technology, Li CY et al. proposed a variable temperature drying technology that increased the hot air temperature in high moisture content (above 25 %d.b.) to improve the drying rate at a reasonable level of energy consumption for paddy drying [38]. Similar drying technology might be adopted to maximize the drying rate and optimize the energy consumption of corn drying in future work. Experimental data were also simulated and the relationship between MC and t was found to be MC = 0.14t2 − 3.17t + 31.91 (R2 = 0.9996), which could help predict the moisture content of corn in the drying process.
3.2. Exergetic Performance
To identify inefficient energy-consumption components of the drying system and further improve the exergy efficiency of the drying process, the exergetic performance of the components for the overall drying system and the exergetic performance of the drying chamber during the drying process were investigated by applying SI and rD, which respectively reflect the influence of exergy efficiency change on sustainability and the contribution of component-related exergy destruction to overall exergy destruction [53]. The results are shown in Table 9.
As can be seen from the table, for a total drying operation (9 h), the sustainability indexes of the RA (1.15) and DC (1.35) are lower than 2 [14], while those of CC and HE have high values of 2.40 and 5.64, respectively, which indicates that the RA and DC should be improved while HE and CC show a good exergetic performance. For the latter, it is difficult to improve the exergy efficiency of the HE (82.28%) while there is substantial improvement potential for the CC owing to the largest exergy destruction rate, for example, by enhancing the insulation of the combustion chamber wall. Considering the main purpose of the RA is to recycle the waste energy in flue gas, and the rD of the RA achieved the lowest value (1.83%) among the four components, the improvement priority of the RA is ranked last, even if its SI value is the lowest. The exergy destruction ratio analysis shows that the contributors to the total exergy destruction, in ascending order of importance, are as follows: RA, HE, DC and CC. Thus, efforts should firstly be made to improve the CC, followed by the DC, HE and RA.
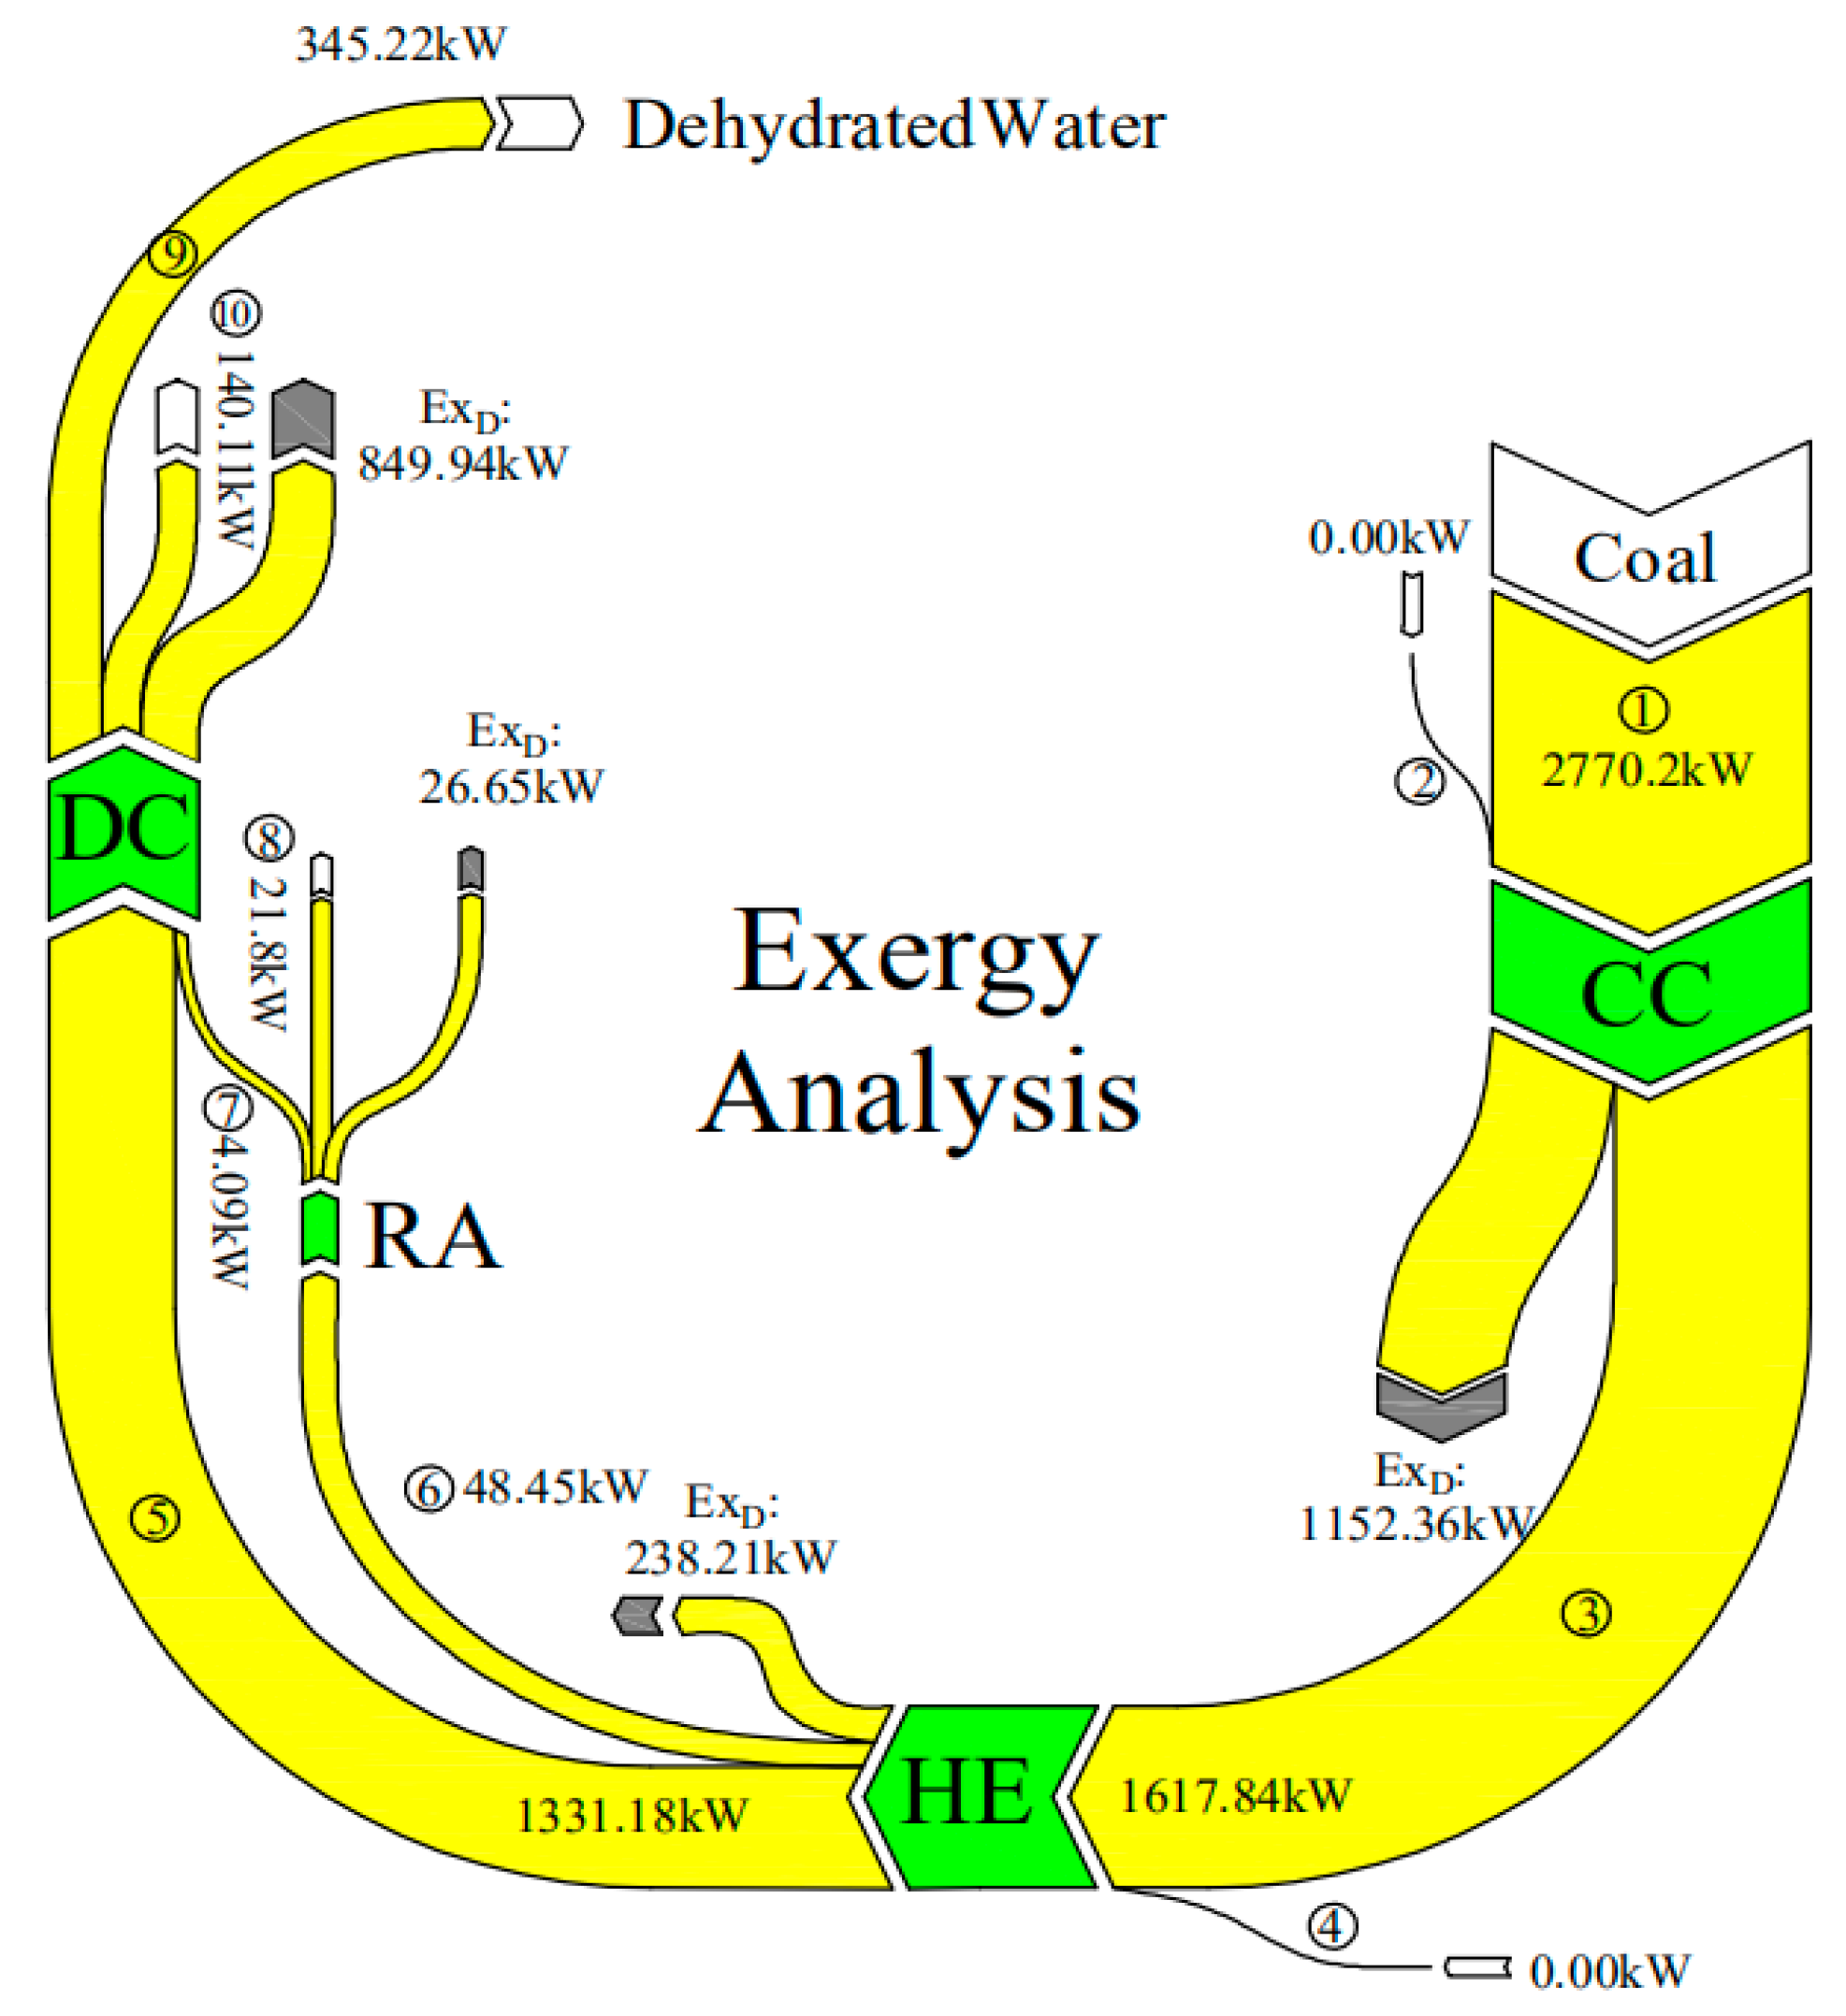
The exergy carried by the fresh air flux was considered to be zero in the present work. Figure 7 depicts the exergy flux among the four main components of the whole drying system. As can be seen from the figure, the initial exergy input rate into the CC is 2770.2 kW. Moreover, there is a significant exergy destruction rate in the CC (1152.36 kW), which indicates that the CC can be greatly improved by reducing its exergy destruction. Such attempts could relate to the fuel types (e.g., natural gas, biomass fuel), insulation of the combustion chamber wall, and physical structure of the drying chamber to improve exergy efficiency, as recommended by Yuanyuan Zhang et al. [54]. For the HE, the fuel is the input flue gas (③ in Figure 7) and the products are the hot air (⑤) and flue gas (⑥). Only 238.21 kW exergy is destroyed, and there is an exergy flow of 48.45 kW into the RA, which respectively account for 14.72% and 2.99% of the total input exergy rate, indicating the HE has a good exergetic performance. More details about the self-developed heat exchanger can be found in the patent (CN104482751A) [55]. Although only 4.09 kW of radiant exergy is recycled by the RA, the improvement of the seed tissue function caused by the far-infrared wavelength cannot be ignored. As reported by Zhu Wenxue et al., corn grains have the highest absorption rate of far-infrared radiation when the far-infrared wavelength is near 9 μm [56]. The average exergy rate for dehydrating moisture from corn kernels was found to be 345.22 kW. Furthermore, there was a high exergy destruction rate in the DC, with the average exergy efficiency ascertained to be 25.85%, indicating the exergy efficiency can be greatly improved.
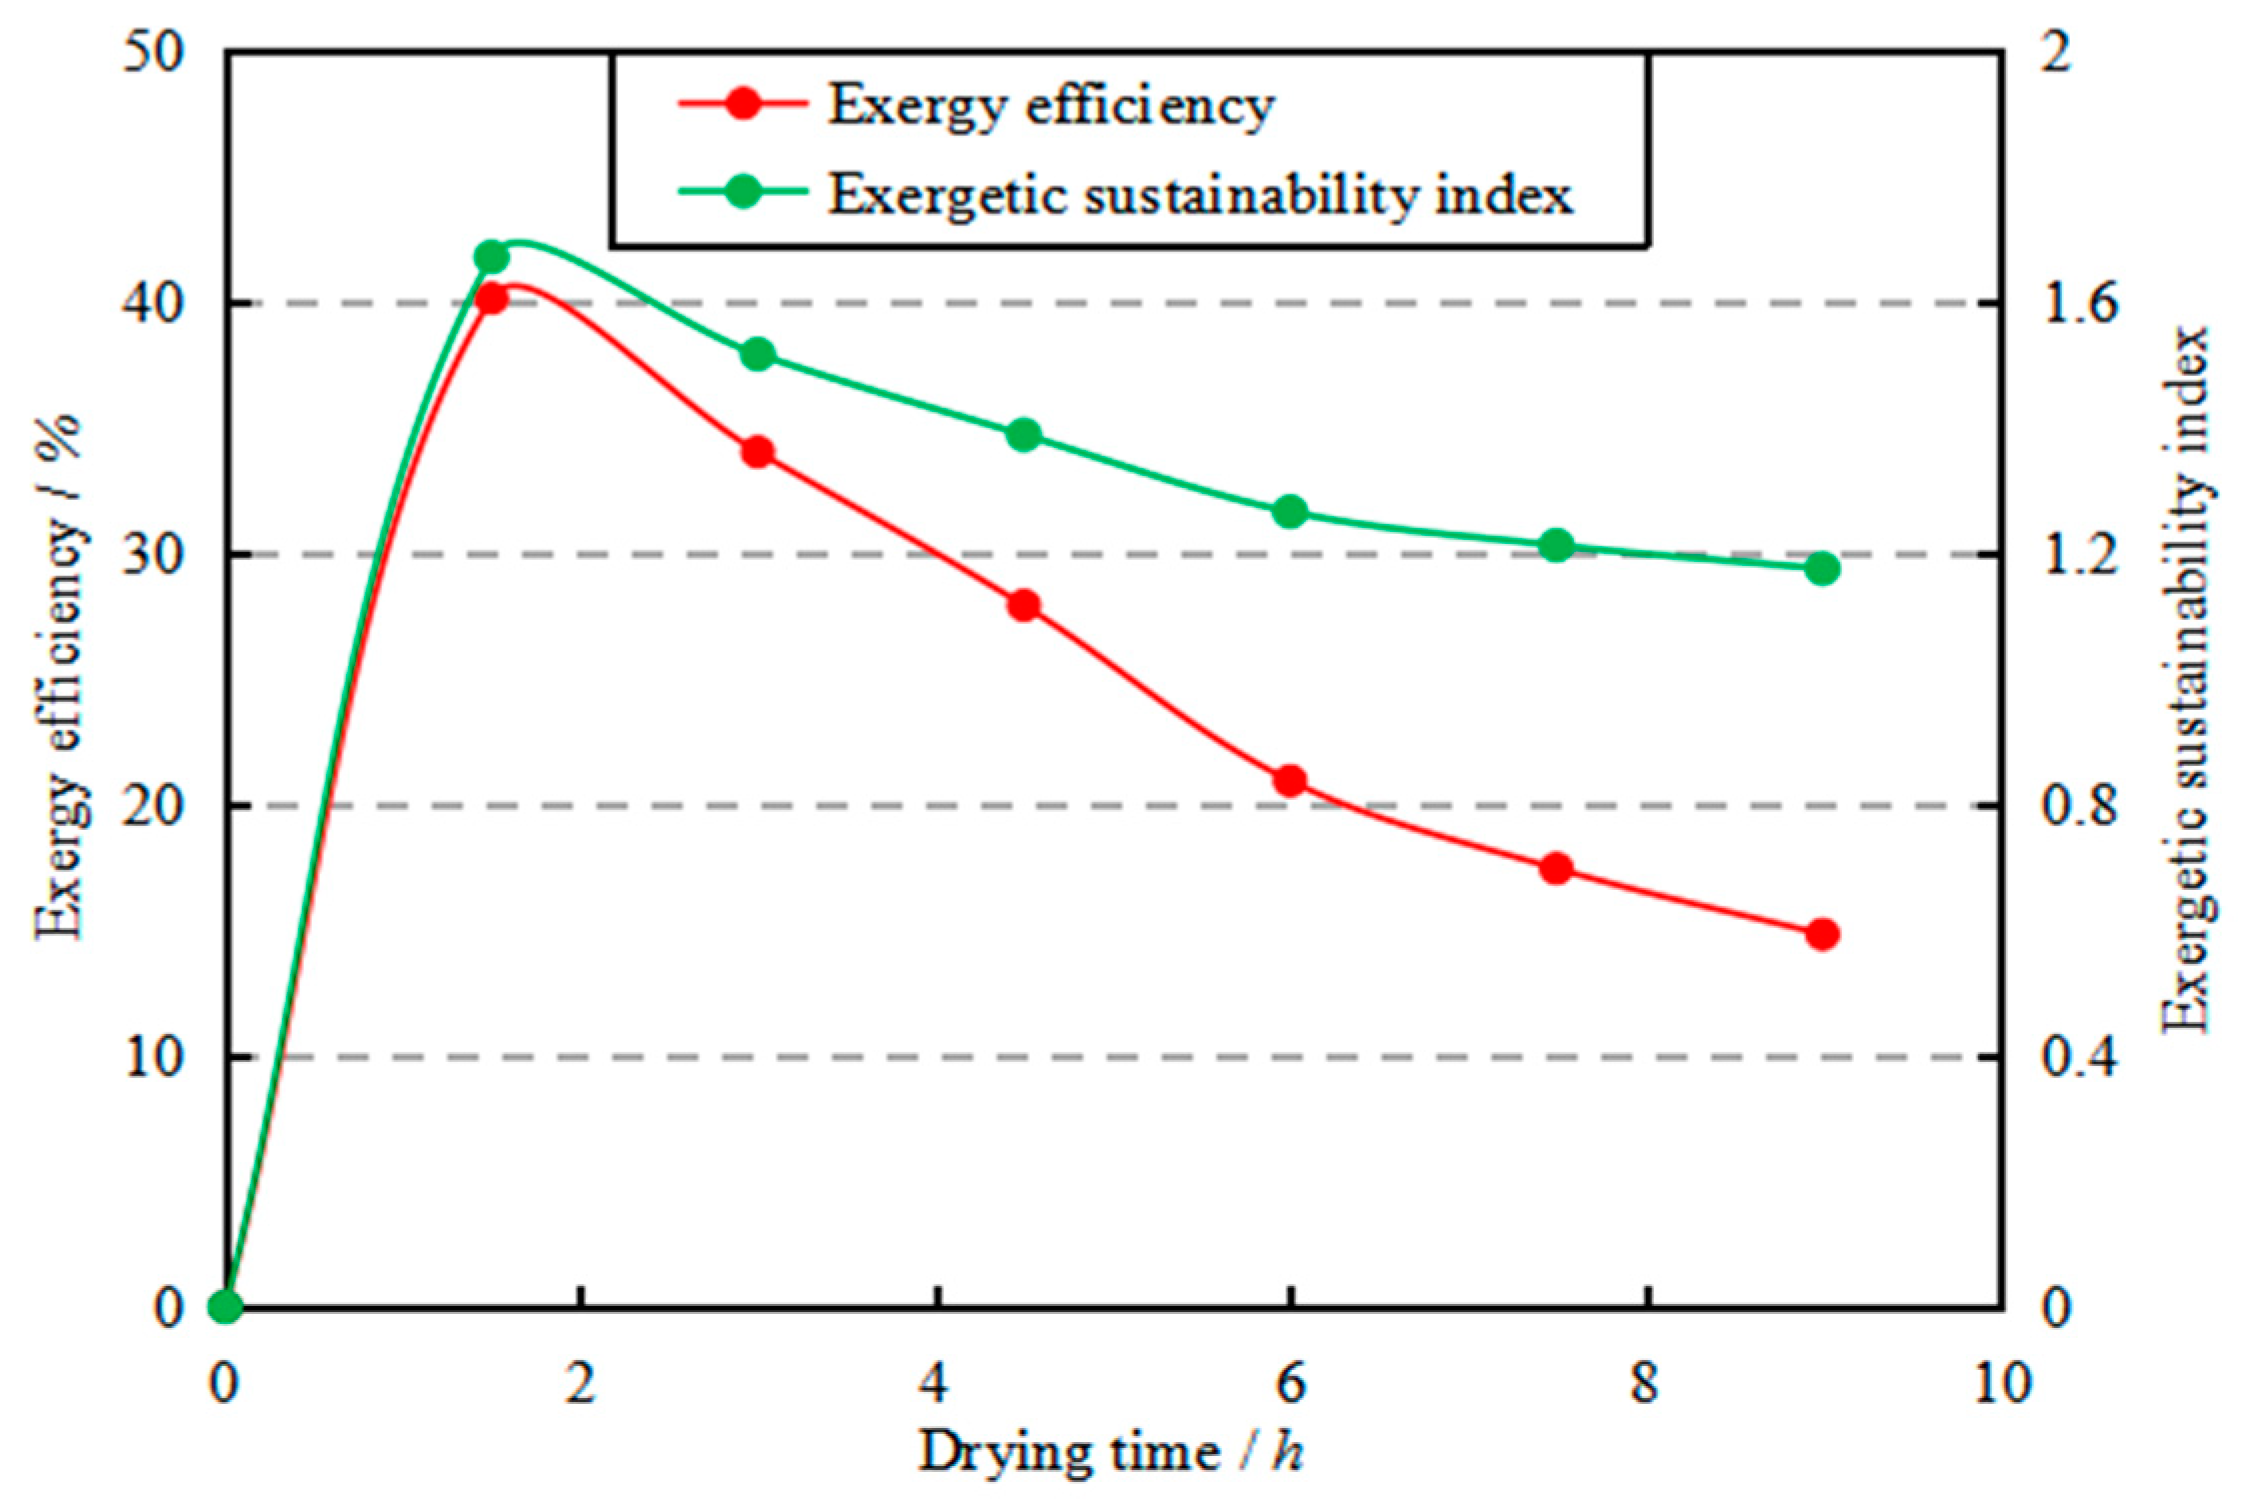
In order to fully investigate the exergetic performance of the DC, the variation of ηex,DC with drying time was investigated; results are shown in Figure 8. The figure clearly shows that ηex,DC and SI decrease with the increase of drying time, and respectively range from 14.81% to 40.10% and 1.17 to 1.67. These results are close to those in similar agricultural product industrial dryers, such as an industrial tray dryer for cassava starch drying (16.04% ≤ ηex ≤ 30.65%; 1.19 ≤ SI ≤ 1.44) [57] and a semi-industrial continuous band microwave dryer for paddy drying (4.13% ≤ ηex ≤ 13.88%; 1.04 ≤ SI ≤ 1.16) [49]. After six hours, ηex,DC was lower than 20%, indicating that attention should be paid to the optimization of the drying kinetic in this period. A lower drying temperature (≤39 °C) might improve the exergy efficiency for a reasonable energy usage, as recommended by M.S.H. Sarker et al. [28].
3.3. Exergoeconomic Performance
Based on the exergoeconomic analysis in Section 2.7, the non-energy cost and the exergetic cost of the fuel () and the product () for the i-th component were investigated. The relative cost difference (rc,i) and the exergoeconomic factor (fc,i) were also employed to evaluate the exergoeconomic performance of the system. The results are shown in Table 10.
The non-energetic costs of the i-th component were converted into hourly costs in the present work. As can be seem from Table 10, the main contributor to the total non-energetic costs is the DC, which is because the operating and investment costs of the overall system are focused on the DC (Table 5). It can be seen that rc,RA obtains the highest value (45.6%) among the four components. According to the literature [58], an exorbitant relative cost difference might be caused by low exergy efficiency or exorbitant non-energetic costs of the component. Therefore, the lowest exergy efficiency (Table 9) of the RA can explain the highest value of rc,RA, while the exorbitant non-energetic costs of the DC can explain the exorbitant value of rc,DC. In ascending order, the exergoeconomic factors of each component are ranked CC, HE, RA, and DC, indicating that efforts should primarily be made to reduce the investment cost of the DC while maintaining an appropriate exergy efficiency.
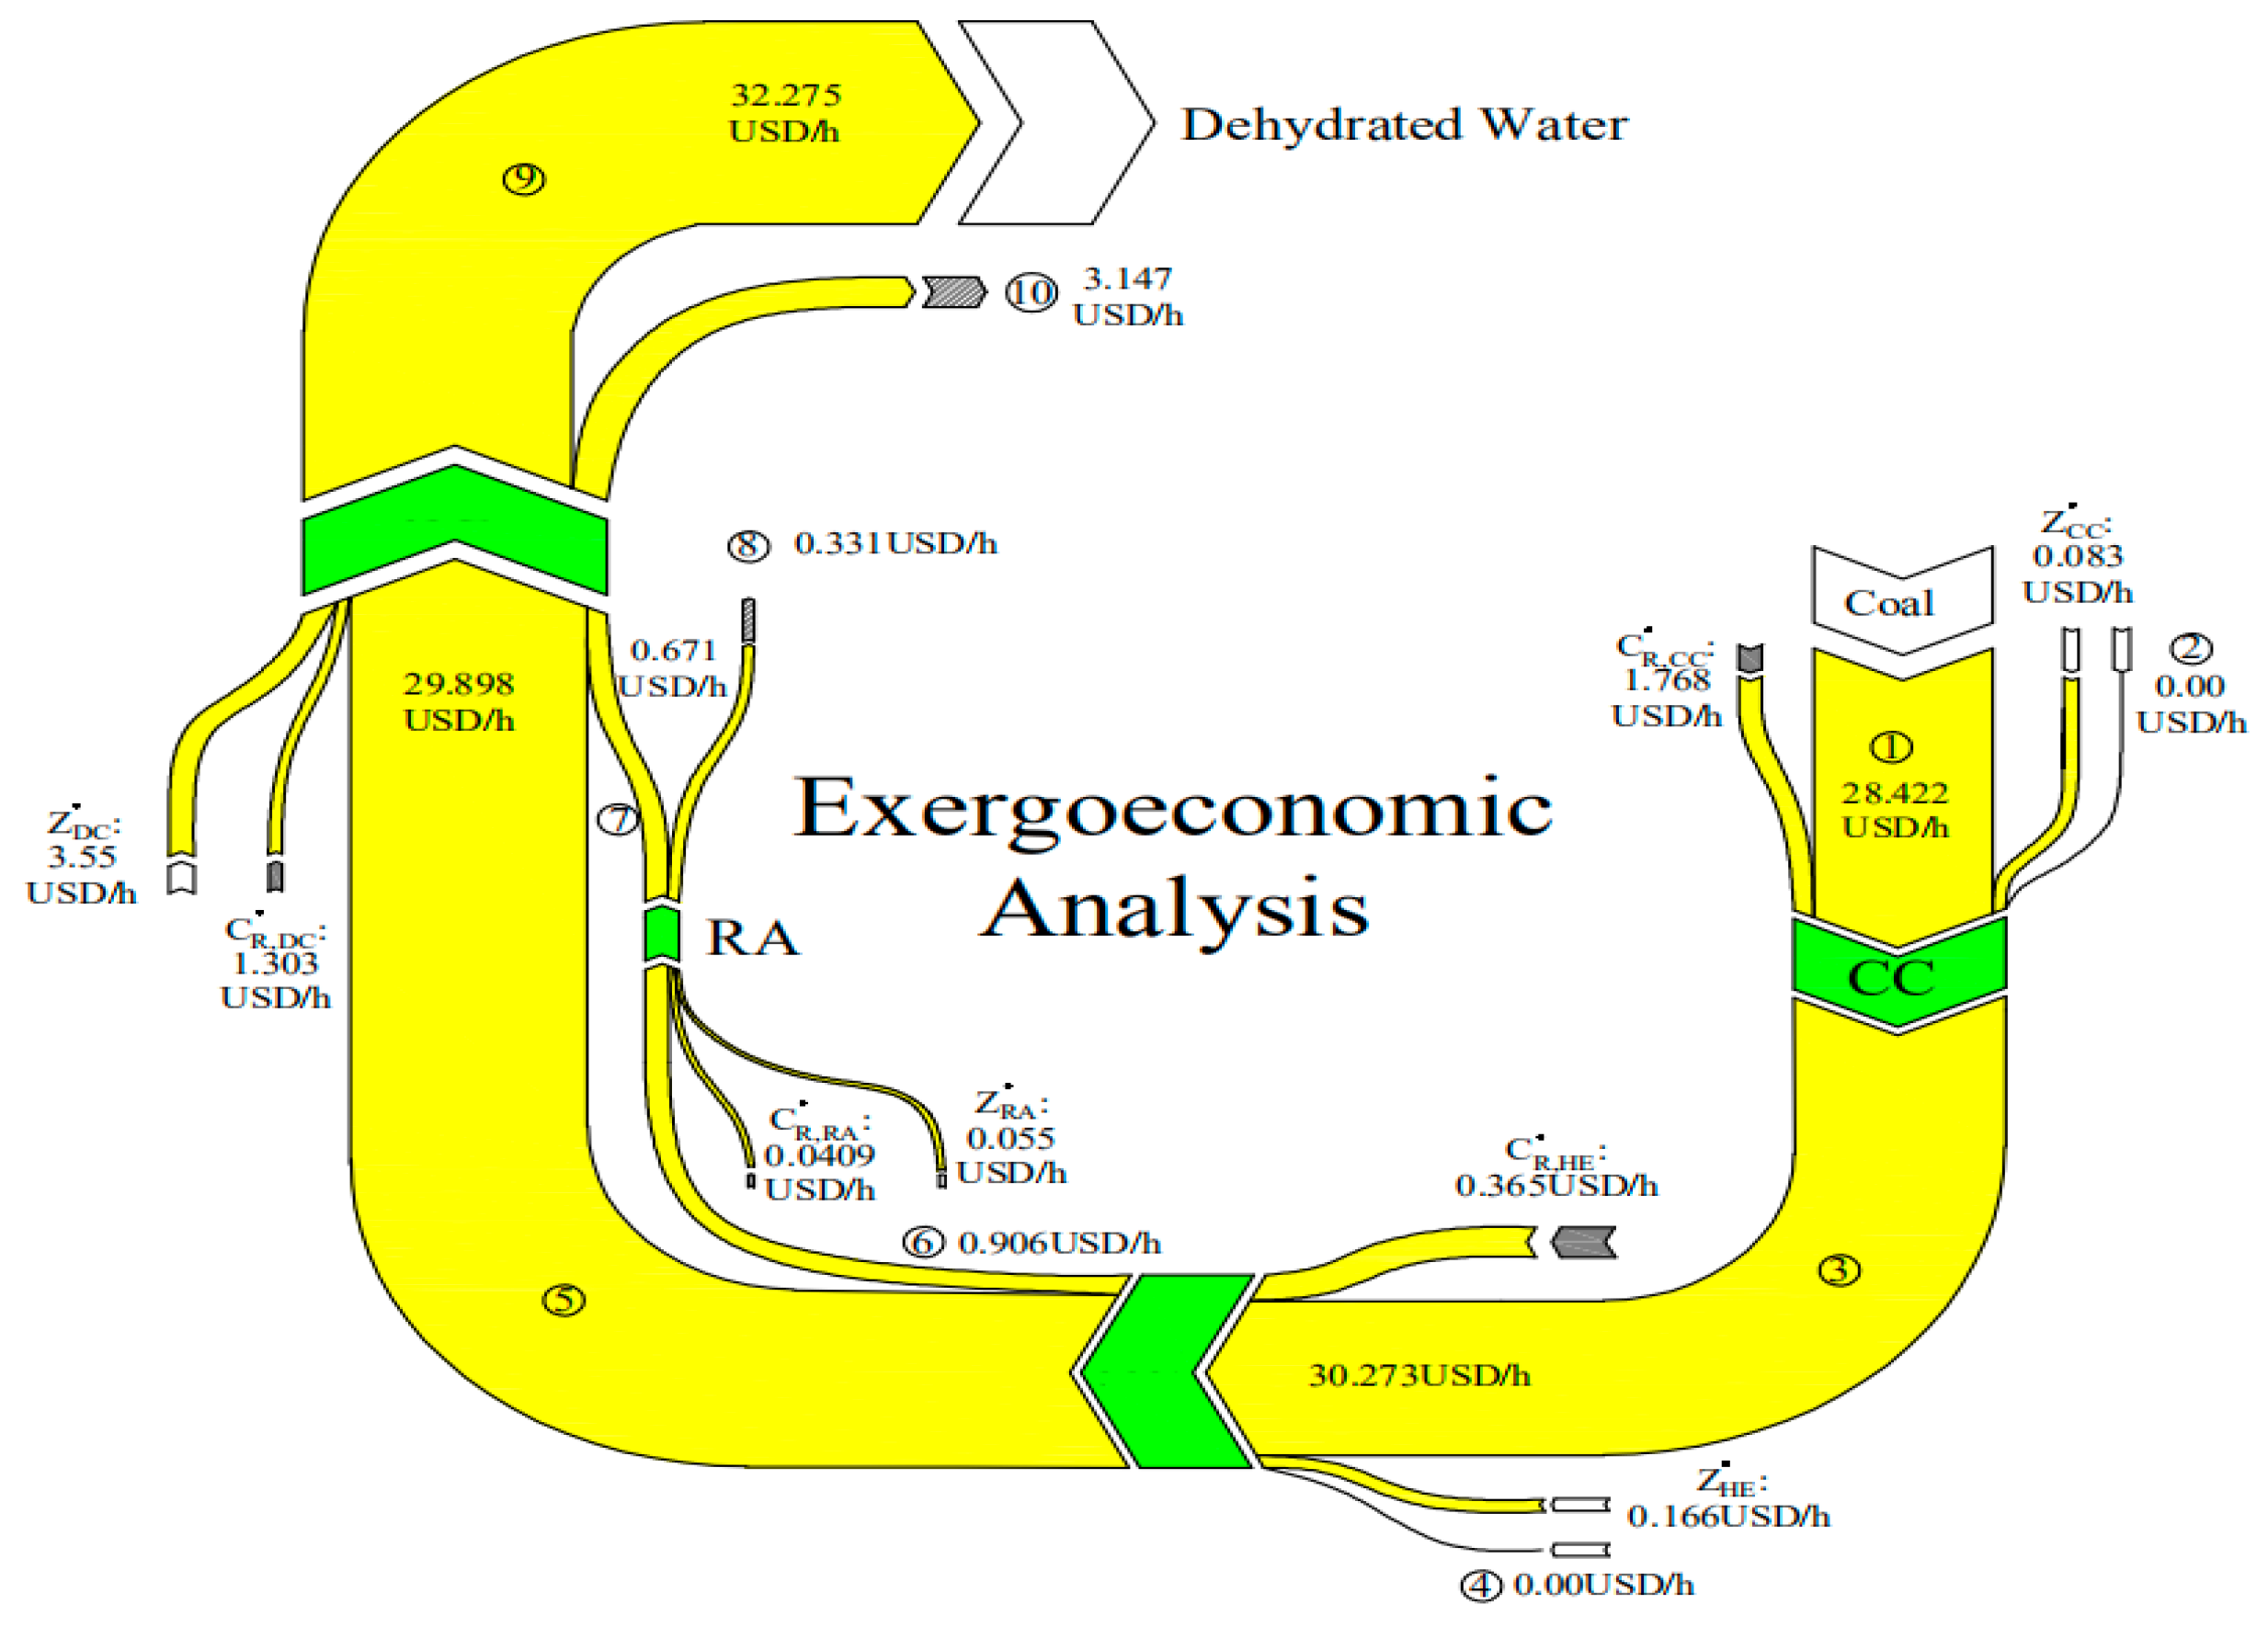
Based on the arbitrary assumption that the unit exergoeconomic cost of the fresh air stream is equal to zero, the hourly economic costs of all of the streams were calculated; results are depicted in Figure 9. It is clear that the hourly economic cost for dehydrating moisture from corn kernels has a maximum value of 32.275 USD/h. As the final operation unit of the system, Cic, DC (3.55 USD/h) and CR,DC (1.303 USD/h) are much higher than those of the other components, which might explain the result. In addition, it is notable that almost 74.06% of the total hourly economic input costs of the RA were recycled, indicating that the RA has a good economic performance. However, based on the exergetic analysis of the RA in Section 3.2, its economic performance can be still improved by reducing the exergy loss in the outlet flue gas or by utilizing material with higher potential IR radiation.
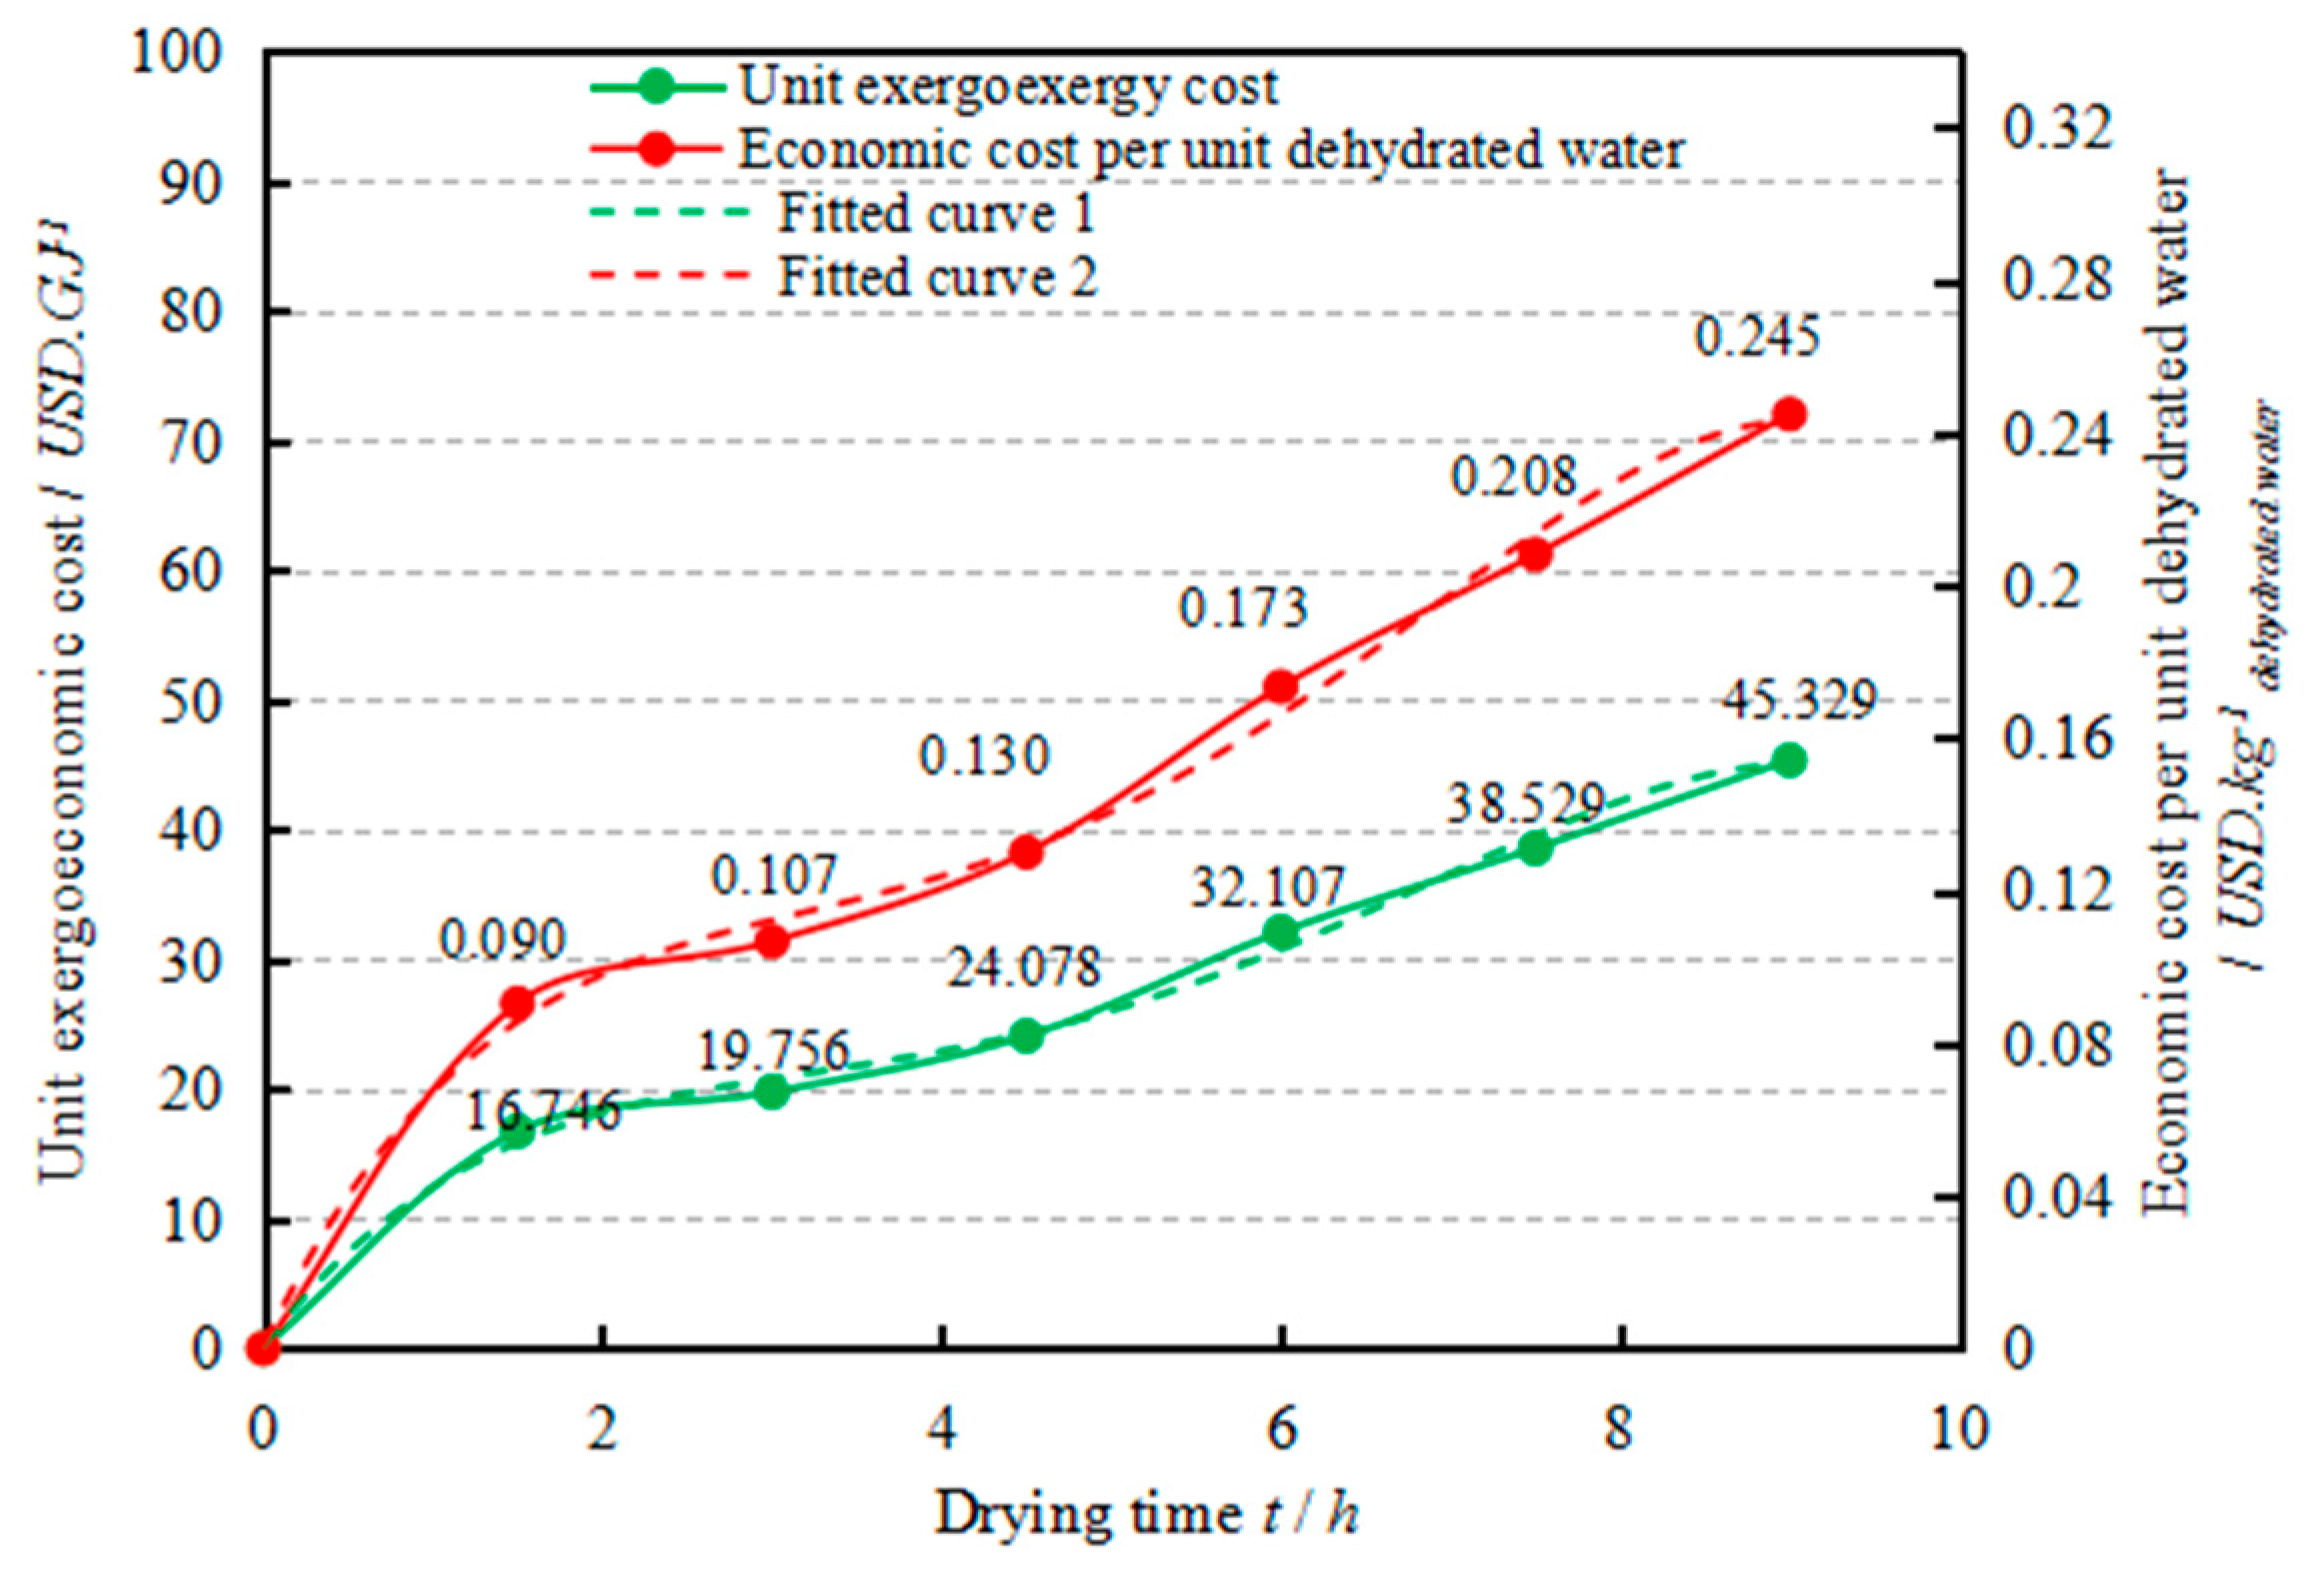
In order to comprehensively understand the economic performance of the drying process, the unit exergoeconomic cost () and economic cost per unit of dehydrated water () were investigated, where was calculated by the equation: = ·/. As can be seen from Figure 10, and increase with the increase of drying time, which might due to the fact that more energy is needed to overcome the binding energy between the moisture molecule and the adsorption site in the low moisture content area of the corn kernel [59]. Respectively, and vary from 16.746 to 45.329 USD/GJ and 0.09 to 0.245 USD/kgdehydrated water. The drying cost after six hours was twice that of the first three hours, indicating that the drying process should be further optimized (e.g., by utilizing the residual heat of the combustion chamber [60]). Average and were ascertained to be 25.971 USD/GJ and 0.159 USD/kgdehydrated water, respectively. Thus, in the presented industrial drying system, the economic cost to produce 1 GJ exergy for removing water is USD 25.971 and the economic cost for removing 1 kg water from wet corn kernels is USD 0.159.
To simplify the economic cost calculation and enhance the practicability of the exergoeconomic analysis methodology in drying operations, the relationships between and , and drying time t, were established by fitting the corresponding curves (Equations (34) and (35)). These relationships could help in formulating an efficient drying process and predicting the associated drying cost.
4. Conclusions
The present work considers dehydrated water as the ultimate productive goal of an industrial drying system. The exergetic and exergoeconomic performances of the drying system were comprehensively investigated. Based on the results achieved, the following conclusions can be drawn:
- (1)
- The drying rate of corn kernels decreases with the increase of drying time, and the average drying rate for corn kernels in the system was ascertained to be 1.98 gwater/gdry matter h.
- (2)
- The contributors to the total exergy destruction are as follows in ascending order of importance: RA, HE, DC and CC. This indicates that efforts should firstly be made to improve the CC, followed by the DC, HE and RA.
- (3)
- The average exergy rate for dehydrating moisture from corn kernels was found to be 345.22 kW and the exergy efficiency of the drying chamber ranges from 14.81% to 40.10%.
- (4)
- The drying chamber should be firstly optimized because it has the highest exergoeconomic factor of 73.14%. Efforts should also be made to reduce the investment cost of the drying chamber and improve its exergy efficiency.
- (5)
- The average cost of producing 1 GJ exergy for removing water from wet corn kernels is USD 25.971, and the average cost of removing 1 kg water is USD 0.159.
The present work revealed the existing energy use deficiencies in the drying system. Thus, the main results would be helpful for further optimizing the drying process from both energetic and economic perspectives, and also indicate possible areas for enhancing the energy utilization level. Further study is recommended to identify the appropriate drying temperature and air flows for faster drying of corn kernels, to achieve better quality corn at a reasonable economic cost. Furthermore, the environmental impact of the drying operation should also be studied.
Author Contributions
Data curation, B.L., C.L. and J.H.; Formal analysis, B.L.; Funding acquisition, C.L.; Investigation, B.L., C.L. and J.H.; Methodology, B.L.; Project administration, C.L.; Software, B.L. and J.H.; Supervision, C.L.; Writing–original draft, B.L. All authors have read and agreed to the published version of the manuscript.
Funding
This work was supported by the National Natural Science Foundation of China (No. 31671783; No. 31371871) and Science and Technology Planning Project of Guangdong Province, China (No. 2014B020207001).
Acknowledgments
The authors would like to thank the editors and reviewers for their valuable and constructive comments.
Conflicts of Interest
The authors declare that we have no known competing financial interests or personal relationships that could have appeared to influence the work reported in this paper.
References
- Defraeye, T. Advanced computational modelling for drying processes—A review. Appl. Energy 2014, 131, 323–344. [Google Scholar] [CrossRef]
- Mujumdar, A.S. Handbook of Industrial Drying, 3rd ed.; Taylor & Francis Group LLC; CRC Press: Boca Raton, FA, USA, 2006. [Google Scholar] [CrossRef]
- Kudra, T. Energy aspects in drying. Dry Technol. 2004, 22, 917–932. [Google Scholar] [CrossRef]
- Kemp, I.C. Fundamentals of energy analysis of dryers. In Modern Drying Technology–Energy Savings; Tsotsas, E., Mujumdar, A.S., Eds.; Wiley-VCH Verlag GmbH: Weinheim, Germany, 2011; pp. 1–46. [Google Scholar] [CrossRef]
- Apinya, K.; Salinee, S.; Sung, H.P. Potential application of infrared assisted freeze drying (IRAFD) for banana snacks: Drying kinetics, energy consumption, and texture. LWT 2019, 99, 355–363. [Google Scholar] [CrossRef]
- Zhang, S.Z.; Luo, J.L.; Wang, Q.; Chen, G.M. Step utilization of energy with ejector in a heat driven freeze drying system. Energy 2018, 164, 734–744. [Google Scholar] [CrossRef]
- Patipat, T.; Pakamon, P.; Kajorndej, P. Utilization of Biomass Energy in Drying of Glutinous Rice Crackers. Energy Procedia 2017, 138, 331–336. [Google Scholar] [CrossRef]
- Wang, Z.; Zhang, Y.; Zhang, B. Analysis on Energy Consumption of Drying Process for Dried Chinese Noodles. Appl. Therm. Eng. 2016, 110, 941–948. [Google Scholar] [CrossRef]
- Essohouna, T.; Tcha-Esso, T.B.; Ouézou, Y.A. Effects of drying conditions on energy consumption and the nutritional and organoleptic quality of dried bananas. Journal of Food Engineering. 2020, 268, 109747. [Google Scholar] [CrossRef]
- Li, C.Y. Theoretical analysis of exergy transfer and conversion in grain drying process. Trans. Chin. Soc. Agric. Eng. 2018, 34, 1–8. [Google Scholar] [CrossRef]
- Li, C.Y.; Ma, X.Z.; Fang, Z.D. Thermal energy structure of grain hot air drying and analytical method. Trans. Chin. Soc. Agric. Eng. 2014, 30, 220–228. [Google Scholar] [CrossRef]
- Rosen, M.A.; Dincer, I. Exergy as the confluence of energy, environment and sustainable development. Int. J. Exergy 2001, 1, 3–13. [Google Scholar] [CrossRef]
- Aviara, N.A.; Igbeka, J.C. Modeling for Drying of Thin Layer of Native Cassava Starch in Tray Dryer. J. Biosyst. Eng. 2016, 41, 342–356. [Google Scholar] [CrossRef]
- Beigi, M.; Tohidi, M.; Torki-Harchegani, M. Exergetic Analysis of Deep-Bed Drying of Rough Rice in a Convective Dryer. Energy 2017, 140. [Google Scholar] [CrossRef]
- Folayan, J.A.; Osuolale, F.N.; Anawe, P.A.L. Data on exergy and exergy analyses of drying process of onion in a batch dryer. Data Brief 2018, 21, 1784–1793. [Google Scholar] [CrossRef]
- Zare, D.; Ranjbaran, M. Simulation and Validation of Microwave-Assisted Fluidized Bed Drying of Soybeans. Dry. Technol. 2012, 30, 12. [Google Scholar] [CrossRef]
- Darvishi, H.; Zarein, M.; Farhudi, Z. Energetic and exergetic performance analysis and modeling of drying kinetics of kiwi slices. J. Food Sci. Technol. 2016, 53, 2317–2333. [Google Scholar] [CrossRef] [Green Version]
- Salih, C.; İbrahim, D.; Cüneyt, T. Investigation of drying kinetics of tomato slices dried by using a closed loop heat pump dryer. Heat Mass Transf. 2016, 53, 1–9. [Google Scholar] [CrossRef]
- Yogendrasasidhar, D.; Setty, Y.P. Drying kinetics, exergy and energy analyses of Kodo millet grains and Fenugreek seeds using wall heated fluidized bed dryer. Energy 2018, 151, 799–811. [Google Scholar] [CrossRef]
- Tsatsaronis, G.; Park, M.H. On avoidable and unavoidable exergy destructions and investment costs in thermal systems. Energy Convers. Manag. 2002, 43, 1259–1270. [Google Scholar] [CrossRef]
- Lozano, M.A.; Valero, A. Theory of the exergetic cost. Energy 1993, 18, 939–960. [Google Scholar] [CrossRef]
- Xu, C.; Xu, G.; Zhu, M.; Dong, W.; Zhang, D. Thermodynamic analysis and economic evaluation of a 1000 MW bituminous coal fired power plant incorporating low-temperature pre-drying (LTPD). Appl. Therm. Eng. 2016, 96, 613–622. [Google Scholar] [CrossRef]
- Senturk, A.M.; Arslan, O. Exergo-economic Evaluation of a New Drying System Boosted by Ranque-Hilsch Vortex Tube. Appl. Therm. Eng. 2017, 124. [Google Scholar] [CrossRef]
- Aghbashlo, M.; Tabatabaei, M.; Soltanian, S.; Ghanavati, H.; Dadak, A. Comprehensive exergoeconomic analysis of a municipal solid waste digestion plant equipped with a biogas genset. Waste Manag. 2019, 87, 485–498. [Google Scholar] [CrossRef] [PubMed]
- Chen, J.; Han, D.; Bai, G.P.; Zheng, M.R.; Gu, J.M. Thermodynamic analysis of a novel wood drying system based on self-heat recuperation technology. Energy Sources Part A Recovery Util. Environ. Eff. 2019, 41, 1–17. [Google Scholar] [CrossRef]
- Atalay, H. Comparative assessment of solar and heat pump dryers with regards to exergy and exergoeconomic performance. Energy 2019, 189, 116180. [Google Scholar] [CrossRef]
- Ozturk, M.; Dincer, I. Exergoeconomic analysis of a solar assisted tea drying system. Dry. Technol. 2019, 38, 1–8. [Google Scholar] [CrossRef]
- Sarker, M.S.H.; Ibrahim, M.N.; Abdul, A.N. Energy and exergy analysis of industrial fluidized bed drying of paddy. Energy 2015, 84, 131–138. [Google Scholar] [CrossRef]
- Ma, X.Z.; Fang, Z.D.; Li, C.Y. Energy efficiency evaluation and experiment on grain counter-flow drying system based on exergy analysis. Trans. Chin. Soc. Agric. Eng. 2017, 33, 285–291. [Google Scholar] [CrossRef]
- LI, B.; Peng, G.L.; Wu, S.F. Vacuum drying characteristics and modeling of kinetics for konjac. Food Ferment. Ind. 2017, 8, 119–126. [Google Scholar] [CrossRef]
- Bridges, T.C.; Ross, I.J.; White, G.M. Determination of the Optimum Drying Depth for Batch-In-Bin Corn Drying Systems. Trans. ASAE 1980, 23, 228–232. [Google Scholar] [CrossRef]
- Syahrul, S.; Hamdullahpur, F.; Dincer, I. Thermal analysis in fluidized bed drying of moist particles. Appl. Therm. Eng. 2002, 22. [Google Scholar] [CrossRef]
- Holman, J.P. Analysis of experimental data. In Experimental Methods for Engineers; McGraw Hill: Singapore, 2001; pp. 48–143. [Google Scholar]
- Aghbashlo, M.; Tabatabaei, M.; Jazini, H. Exergoeconomic and exergoenvironmental co-optimization of continuous fuel additives (acetins) synthesis from glycerol esterification with acetic acid using Amberlyst 36 catalyst. Energy Convers. Manag. 2018, 65, 183–194. [Google Scholar] [CrossRef]
- Zhao, L.Y. A Statistical Analysis of the Composition of Coal from Shanxi. Collected Works of Institute of Geomechanics; Chinese Academy of Geosciences: Beijing, China, 1983. (In Chinese) [Google Scholar]
- Akpinar, E.K.; Midilli, A.; Bicer, Y. The first and second law analyses of thermodynamic of pumpkin drying process. J. Food Eng. 2006, 72, 320–331. [Google Scholar] [CrossRef]
- Agudelo, A.; Valero, A.; Torres, C. Allocation of waste cost in thermoeconomic analysis. Energy 2012, 45, 634–643. [Google Scholar] [CrossRef]
- Li, C.Y. Engineering Thermodynamics and Heat Transfer; China Agricultural University Press: Beijing, China, 2012. (In Chinese) [Google Scholar]
- De Lima, J.A.S.; Santos, J. Generalized Stefan-Boltzmann law. Int. J. Ther. Phys 1995, 34, 127–134. [Google Scholar] [CrossRef]
- Soufiyan, M.M.; Dadak, A.; Hosseini, S.S.; Nasiri, F.; Dowlati, M.; Tahmasebi, M. Comprehensive exergy analysis of a commercial tomato paste plant with a double-effect evaporator. Energy 2016, 111, 910–922. [Google Scholar] [CrossRef]
- Yildirim, N.; Genc, S. Energy and exergy analysis of a milk powder production system. Energy Convers. Manag. 2017, 149, 698–705. [Google Scholar] [CrossRef]
- Zhang, Q.; Yi, H.N.; Yu, Z.H.; Gao, J.T.; Wang, X.Z.; Lin, H.Y.; Shen, B. Energy-exergy analysis and energy efficiency improvement of coal-fired industrial boilers based on thermal test data. Appl. Therm. Eng. 2018, 144, 614–627. [Google Scholar] [CrossRef]
- Coskun, C.; Oktay, Z.; Ilten, N. A new approach for simplifying the calculation of flue gas specific heat and specific exergy value depending on fuel composition. Energy 2009, 34, 1898e902. [Google Scholar] [CrossRef]
- Aghbashlo, M.; Rosen, M.A. Exergoeconoenvironmental analysis as a new concept for developing thermodynamically, economically, and environmentally sound energy conversion systems. J. Clean. Prod. 2018, 187, 190–204. [Google Scholar] [CrossRef] [Green Version]
- Tohidi, M.; Sadeghi, M.; Torki-Harchegani, M. Energy and quality aspects for fixed deep bed drying of paddy. Renew. Sustain. Energy Rev. 2017, 70, 519–528. [Google Scholar] [CrossRef]
- Aghbashlo, M.; Mobli, H.; Rafiee, S. Energy and exergy analyses of the spray drying process of fish oil microencapsulation. Biosyst. Eng. 2012, 111, 229–241. [Google Scholar] [CrossRef]
- Khanali, M.; Aghbashlo, M.; Rafiee, S. Exergetic performance assessment of plug flow fluidised bed drying process of rough rice. Int. J. Exergy 2013, 13, 387–408. [Google Scholar] [CrossRef]
- Mahmoudi, S.M.S.; Khani, L. Thermodynamic and exergoeconomic assessments of a new solid oxide fuel cell-gas turbine cogeneration system. Energy Convers. Manag. 2016, 123, 324–337. [Google Scholar] [CrossRef]
- Kim, S.M.; Oh, S.D.; Kwon, Y.H.; Kwak, H.Y. Exergoeconomic analysis of thermal systems. Energy 1998, 23, 393–406. [Google Scholar] [CrossRef]
- Uysal, C.; Kwak, H.-Y. Role of Waste Cost in Thermoeconomic Analysis. Entropy 2020, 22, 289. [Google Scholar] [CrossRef] [Green Version]
- Kwak, H.Y.; Kim, D.J.; Jeon, J.S. Exergetic and thermoeconomic analyses of power plants. Energy 2003, 28, 343–360. [Google Scholar] [CrossRef]
- Hoo-Suk, O.; Youngseog, L.; Ho-Young, K. Diagnosis of combined cycle power plant based on thermoeconomic analysis: A computer simulation study. Entropy 2017, 19, 643. [Google Scholar] [CrossRef] [Green Version]
- Zhang, Y.Y.; Zhang, Z.Z.; Zhu, M.M.; Cheng, F.Q.; Zhang, D.K. Decomposition of key minerals in coal gangues during combustion in O2/N2 and O2/CO2 atmospheres. Appl. Therm. Eng. 2019, 148, 977–983. [Google Scholar] [CrossRef]
- Li, C.Y.; Ma, X.Z.; Fang, Z.D. A Method and Device for Eliminating Thermal Inertia of Hot Air Dryer. Patent NO CN104482751A, 22 February 2017. [Google Scholar]
- Zhu, W.; Zhang, Z. Research on characteristics of infrared absorption of grain. Grain Storage 2003, 32, 38–41. [Google Scholar]
- Aviara, N.A.; Onuoha, L.N.; Falola, O.E. Energy and exergy analyses of native cassava starch drying in a tray dryer. Energy 2014, 73, 809–817. [Google Scholar] [CrossRef]
- Jafari, H.; Kalantari, D.; Azadbakht, M. Semi-industrial continuous band microwave dryer for energy and exergy analyses, mathematical modeling of paddy drying and it’s qualitative. Energy 2017, 138, 1016–1029. [Google Scholar] [CrossRef]
- Zhao, Y.H.; Luo, Y.H.; Lu, F.; Yan, Y.L. A thermal-economic analysis method and its application to a sealed condensate water recovery system. Chin. J. Power Eng. 2005, 1, 125–134. [Google Scholar]
- Li, C.Y.; Mai, Z.W.; Fang, Z.D. Analytical study of grain moisture binding energy and hot air drying dynamics. Trans. Chin. Soc. Agric. Eng. 2014, 30, 236–242. [Google Scholar] [CrossRef]
- Zhang, H.; Dong, L.; Li, H.Q.; Chen, B.; Tang, Q.; Tsuyoshi, F. Investigation of the residual heat recovery and carbon emission mitigation potential in a Chinese steelmaking plant: A hybrid material/energy flow analysis case study. Sustain. Energy Technol. Assess. 2013, 2, 67–80. [Google Scholar] [CrossRef]
Figure 1.
Picture of the industrial drying system.

Figure 2.
Schematic diagram of the drying system.

Figure 3.
Productive structure of the convective drying system.

Figure 4.
Schematic diagram of the transmission of exergy and cost between any two adjacent subsystems.
Figure 4.
Schematic diagram of the transmission of exergy and cost between any two adjacent subsystems.

Figure 5.
Cost structure of the drying system.

Figure 6.
Drying kinetics of the corn industrial drying.

Figure 7.
Sankey diagram for the exergy analysis of the overall drying system.

Figure 8.
Variations of exergy efficiency and sustainability with drying time.

Figure 9.
Sankey diagram of the exergoeconomic analysis for the overall drying system.

Figure 10.
Variation of the unit exergoeconomic cost and economic cost per unit of dehydrated water with drying time for the drying chamber.
Figure 10.
Variation of the unit exergoeconomic cost and economic cost per unit of dehydrated water with drying time for the drying chamber.


Table 1.
Recent works on energy and exergy analyzes for agricultural product drying systems.
| Agro-Product | Drying System | Main Conclusions | References |
|---|---|---|---|
| Cassava starch | Tray dryer | Exergy inflow, exergy outflow and exergy loss increased with increase in both drying air temperature and energy utilization. | [13] |
| Rough rice | Convective dryer | Exergy efficiencies of the drying process and chamber are in the ranges of 5.10% and 29.41%, and 32.64–67.75%, respectively. | [14] |
| Onion | Batch dryer | The maximum exergy efficiency is 75.2% while the minimum exergy efficiency is 36.5%. | [15] |
| Soybeans | microwave-assisted fluidized bed dryer | The microwave power could enhance the thermodynamic efficiency of fluidized bed dryers. | [16] |
| Kiwi | Microwave drying | Energy and exergy efficiency increased with increasing microwave power and decreasing slice thickness while values of energy efficiency (15.15–32.27%) were higher than exergy efficiency (11.35–24.68%). | [17] |
| Tomato slices | Heat pump dryer | The highest mean specific moisture extraction ratio and coefficient of performance of heat pump drying system are 0.324 kg/kWh and 2.71, respectively. | [18] |
| Grains and Fenugreek seeds | Wall heated fluidized bed dryer | The energy utilization ratio increased with increasing wall temperature, air velocity, bed height and initial moisture content and decreased with drying time. | [19] |
Table 2.
Data on operating period.
| Item | Values |
|---|---|
| Corn drying month for a year (month/year) | 2 |
| Duration of drying period (hour/month) | 720 |
| Economic life (year) | 20 |
| Local market price of anthracites (USD/t) | 85.3 |
| Electricity price for industrial production (USD/kWh) | 0.105 |
Table 3.
Details of the experimental instruments.
| Devices | Model | Measurement Range | Precision |
|---|---|---|---|
| Thermal resistance | PT100 | −200–450 °C | ±0.1 °C |
| Thermocouple | WRN-130/230 | 0–1300 °C | ±0.1 °C |
| Anemometer | DT-8893 | 0.001–45 m/s | 0.01 m/s |
| Temperature and humidity sensors | AM2301 | 0–100%/−40–80 °C | ±3%/±0.5 °C |
| Data acquisition system | Self-developed | - | - |
Table 4.
The values of the parameters adopted in the present work.
| Parameter Name | Value/Equation | Unit | Reference |
|---|---|---|---|
| Ra | 0.287 | kJ·kg−1·K−1 | [45] |
| Rv | 0.462 | kJ·mol−1·K−1 | |
| σ | 5.67 × 10⁻⁸ | W·m–2·K−4 | [39] |
| εr | 0.9 | - | |
| Ar | 16.6 | m2 | |
| p | 9.26 | kg·s−1 | |
| hlh | kJ·kg−1 | [46] | |
| Cv | kJ·kg−1·K−1 | [47] | |
| Ca | kJ·kg−1·K−1 | ||
| Radiator size | D0 = 0.22; Di = 0.2; L = 3 | m |
Table 5.
Fuel exergy, product exergy, exergy dissipation and exergy efficiency of the components of the system.
Table 5.
Fuel exergy, product exergy, exergy dissipation and exergy efficiency of the components of the system.
| Component | Fuel Exergy | Product Exergy | Exergy Dissipation | Exergy Efficiency |
|---|---|---|---|---|
| CC | ||||
| HE | ||||
| RA | ||||
| DC |
Table 6.
Non-energetic costs of the subsystems.
| Subsystem | Zic (USD/h) | Zsc (USD/h) | Zmc (USD/h) | Total Non-Energy Cost (USD/h) |
|---|---|---|---|---|
| CC | 7.41 × 10⁻² | 7.41 × 10⁻³ | 1.48 × 10⁻³ | 8.30 × 10⁻² |
| HE | 1.48 × 10⁻¹ | 1.48 × 10⁻² | 2.96 × 10⁻³ | 1.66 × 10⁻¹ |
| RA | 4.94 × 10⁻² | 4.94 × 10⁻³ | 9.88 × 10⁻⁴ | 5.53 × 10⁻² |
| DC | 3.17 | 3.17 × 10⁻¹ | 6.34 × 10⁻² | 3.55 |
| Whole system | 3.44 | 3.44 × 10⁻¹ | 6.88 × 10⁻² | 3.85 |
| Real time exchange rate: 1 USD = 7.0308 CNY | ||||
Table 7.
Cost balance equations, F-rules [44] and arbitrary assumptions computed for all of the components of the drying system.
Table 7.
Cost balance equations, F-rules [44] and arbitrary assumptions computed for all of the components of the drying system.
| Component | Cost Balance | Unit Exergoeconomic Cost |
|---|---|---|
| CC | c1 = 2.85 USD/GJ; c2 = 0 (arbitrary assumption) | |
| HE | c3 = c6 (F-rule); c4 = 0 (arbitrary assumption) | |
| RA | c6 = c8 (F-rule) | |
| DC | c5= c10 (F-rule); c9 (final product exergy cost) |
Table 8.
The stream type, physical parameters, and corresponding exergy rate and specific exergy used for analyzing the exergoeconomic performance of the drying system for the overall drying process.
Table 8.
The stream type, physical parameters, and corresponding exergy rate and specific exergy used for analyzing the exergoeconomic performance of the drying system for the overall drying process.
| No. | Stream Type | Temperature (K) | Pressure (bar) | Mass Flow Rate (kg·s−1) | Enthalpy Rate (kW) | Entropy J/kg.K | Exergy Rate (kW) | Specific Exergy (kJ·kg−1) |
|---|---|---|---|---|---|---|---|---|
| 1 | Coal | 281.15 | - | 0.093 | - | - | 2770.20 | 29,918.11 |
| 2 | Fresh air | 281.15 | 1.01 | 1.74 | 0 | 0 | 0.00 | 0.00 |
| 3 | Flue gas | 1056.34 | 3.42 | 1.78 | 2382.17 | 1326.94 | 1617.84 | 908.90 |
| 4 | Fresh air | 281.15 | 1.01 | 6.98 | 0 | 0 | 0.00 | 0.00 |
| 5 | Hot air | 358.75 | 2.20 | 6.98 | 2525.07 | 22.35 | 1331.18 | 195.76 |
| 6 | Flue gas | 388.46 | 2.62 | 1.78 | 644.23 | 27.64 | 48.45 | 27.22 |
| 7 | Radiation flux | - | - | - | - | 4.09 | - | |
| 8 | Flue gas | 344.45 | 1.84 | 1.78 | 551.74 | 10.59 | 17.71 | 9.95 |
| 9 | Dehydrated water | - | - | 0.1387 | 538.38 | 345.22 | 2488.37 | |
| 10 | Outlet air | 297.25 | 1.21 | 6.98 | 2083.27 | 4.06 | 140.1 | 20.0 |
Note: density of the fresh air at 8 °C, 1.01 bar was ascertained to be 1.256 kg·m−3.
Table 9.
The exergetic performance of the components for the overall drying system.
| Components | ηex (%) | SI | rD (%) | Improvement Priority | |||
|---|---|---|---|---|---|---|---|
| CC | 2770.2 | 1617.84 | 1152.36 | 58.41 | 2.40 | 47.52 | 1 |
| HE | 1617.84 | 1379.63 | 238.21 | 82.28 | 5.64 | 9.82 | 3 |
| RA | 48.45 | 21.8 | 26.65 | 13.08 | 1.15 | 1.83 | 4 |
| DC | 1335.27 | 485.33 | 849.94 | 25.85 | 1.35 | 40.83 | 2 |
Table 10.
The exergoeconomic performance of the components for the overall drying system.
| Components | rc,i (%) | fc,i (%) | Improvement Priority | |||
|---|---|---|---|---|---|---|
| CC | 8.30 × 10⁻² | 2.85 | 5.20 | 82.46 | 4.48 | 4 |
| HE | 1.66 × 10⁻¹ | 5.20 | 6.24 | 20 | 31.24 | 3 |
| RA | 5.53 × 10⁻² | 5.20 | 45.60 | 776.89 | 57.49 | 2 |
| DC | 3.55 | 6.36 | 25.97 | 308.33 | 73.14 | 1 |
© 2020 by the authors. Licensee MDPI, Basel, Switzerland. This article is an open access article distributed under the terms and conditions of the Creative Commons Attribution (CC BY) license (http://creativecommons.org/licenses/by/4.0/).
Share and Cite
MDPI and ACS Style
Li, B.; Li, C.; Huang, J.; Li, C. Exergoeconomic Analysis of Corn Drying in a Novel Industrial Drying System. Entropy 2020, 22, 689. https://0-doi-org.brum.beds.ac.uk/10.3390/e22060689
AMA Style
Li B, Li C, Huang J, Li C. Exergoeconomic Analysis of Corn Drying in a Novel Industrial Drying System. Entropy. 2020; 22(6):689. https://0-doi-org.brum.beds.ac.uk/10.3390/e22060689
Chicago/Turabian StyleLi, Bin, Chengjie Li, Junying Huang, and Changyou Li. 2020. "Exergoeconomic Analysis of Corn Drying in a Novel Industrial Drying System" Entropy 22, no. 6: 689. https://0-doi-org.brum.beds.ac.uk/10.3390/e22060689
Note that from the first issue of 2016, this journal uses article numbers instead of page numbers. See further details here.