
Information Generating Function of Ranked Set Samples


1
Department of Statistics, Faculty of Mathematical Sciences, Vali-e-Asr University of Rafsanjan, Rafsanjan P.O. Box 518, Iran
2
Department of Mathematics and Statistics, McMaster University, Hamilton, ON L8S 4L8, Canada
*
Author to whom correspondence should be addressed.
Entropy 2021, 23(11), 1381; https://0-doi-org.brum.beds.ac.uk/10.3390/e23111381
Submission received: 9 September 2021
/
Revised: 15 October 2021
/
Accepted: 18 October 2021
/
Published: 21 October 2021
(This article belongs to the Special Issue Entropies, Divergences, Information, Identities and Inequalities)
Abstract
:In the present paper, we study the information generating (IG) function and relative information generating (RIG) function measures associated with maximum and minimum ranked set sampling (RSS) schemes with unequal sizes. We also examine the IG measures for simple random sampling (SRS) and provide some comparison results between SRS and RSS procedures in terms of dispersive stochastic ordering. Finally, we discuss the RIG divergence measure between SRS and RSS frameworks.
1. Introduction
Moment generating function (MGF) plays an important role in statistical distribution theory. Its derivatives evaluated at zero yield the moments of the considered distribution. Information generating (IG) functions have also been used in information theory, in addition to the moment generating function, to generate some well-known information measures such as Shannon entropy and Kullback–Leibler divergence.
The IG function of a probability model f was first introduced by Golomb [1], whose first derivative evaluated at one provides Shannon entropy for that probability model.
Suppose the variable X has an absolutely continuous probability density function (PDF) f. Then, the IG function of density for any is defined as
when the integral is finite. In order to simplify the notation, we do not use in the integration with respect to throughout the article, unless a distinction needs to be made. The following properties of in (1) have been stated in Golomb [1]:
where is the Shannon entropy defined as In particular, when , the IG measure is simply , known as informational energy (IE) function. The IG function and its extensions have been used extensively in chemistry and physics to discuss the atomic structure of a given phenomena or system; for more details, one may see López-Ruiz et al. [2]. In addition, the IG function, known as entropic moment in chemistry and physics literature, plays a key role in chaos theory and non-extensive thermodynamics. Note that the IG function is closely linked to Tsallis and Rényi entropies. The entropic moment measure, as well as the information entropy, reflect on the degree of spread of a probabilistic model, see Bercher [3].
Recently, Clark [4] has presented an analogous IG function for stochastic processes to assist in the derivation of information measures for point processes.
Guiasu and Reischer [5] proposed relative information generating (RIG) function between two density functions, whose first derivative evaluated at 1, yields Kullback–Leibler (KL) divergence (Kullback and Leibler, [6]) measure.
Suppose the variables X and Y have absolutely continuous density functions f and g, respectively. Then, the RIG function, for any , is defined as
when the integral is finite. The KL divergence is then obtained, from its first derivative, as
One may refer to Clark [4] and Mares et al. [7] for some discussions on the usefulness and applications of the RIG function
The main objective of this paper is to study the IG and RIG information measures associated with ranked set sampling (RSS) schemes. The analysis of information content in various sampling strategies is of great importance in sampling theory. In this regard, information theory provides specifically a framework for the quantification of information content in a given source with a probabilistic structure under different sampling strategies. Among various strategies discussed in sampling theory, we focus here on some well-known strategies that are known to be efficient. A cost-effective survey sampling method, known as ranked set sampling (RSS), was first introduced by McIntyre [8]. He specifically introduced RSS to estimate the mean of a population based on a given simple random sample (SRS) of size n and observed that the estimator based on RSS is an unbiased estimator with a smaller variance as compared to the mean of a SRS. The RSS and some of its generalizations have been discussed rather extensively in the literature. For example, Frey [9]; Park and Lim [10]; and Chen, Bai, and Sinha [11] have all discussed the information content in RSS based on Fisher entropy, while Tahmasebi et al. [12] have studied the Tsallis entropy based on maximum RSS scheme. Therefore, considering the importance of this issue and the connection between information theory and ranked set sampling theory, a systematic study of the IG function as generator function of some well-known information measures, in the framework of RSS strategy, seems to be necessary. This forms the primary motivation for the present study.
We now briefly introduce SRS and RSS strategies that will be used in the sequel. Let X be an absolutely continuous random variable with PDF f. Then, a SRS of size n, derived from the random variable X, is denoted by Further, suppose a random sample of size is selected and is randomly divided into n groups of equal size n. Then, a one-cycle RSS is observed in the following manner:
As we see from the above representation, the recorded sample in each group of SRS with size n corresponds to the ith order statistic. Thus, the RSS vector of observations is given by , where is the ith order statistic based on a given SRS of size n with PDF f and cumulative distribution function (CDF) F. Then, the PDF of is known to be
Here, corresponds to the ith order statistic, and with that taking the value x, there will be observations less than x each with probability and observations greater than x each with probability . For pertinent details, one may refer to the authoritative book on this subject by Arnold et al. [13].
Maximum and minimum ranked set sampling schemes are two useful modifications of ranked set sampling procedure. A maximum RSS is given by , where is the largest order statistic based on a SRS of size i from f. Similarly, a minimum RSS is given by , where is the smallest order statistic based on a SRS of size i from f. From (5), the PDF of is given by
where is the survival function of X. Similarly, the PDF of is given by
The corresponding CDFs of (6) and (7) are given by and , respectively.
The purpose of this work is twofold. The first part is to derive IG measures for the SRS and RSS, and especially in maximum and minimum RSS frameworks, and provide some comparison results associated with IG measures of these observations based on dispersive stochastic ordering. In the second part, we further study the RIG divergence measure between SRS and RSS, and specifically the RIG divergence measure between minimum and maximum RSS procedures.
The rest of this paper is organized as follows. In Section 2, we consider the information generating function and establish some results for SRS and RSS procedures. We show that the IG measures of SRS and RSS can be expressed based on different orders of fractional Shannon entropy. Moreover, we examine the monotonicity properties of IG measure for vectors and based on a sample of size n, under a mild condition. In Section 3, we discuss the comparison of information generating functions for SRS and RSS frameworks in terms of dispersive stochastic ordering. Next, in Section 4, we study the RIG measures for vectors , and . Finally, we make some concluding remarks in Section 5.
2. IG Measures Based on SRS and RSS Schemes
In this section, we first consider the IG measure for SRS and then for RSS schemes. Specifically, we discuss the IG measure for the maximum and minimum RSS schemes.
2.1. IG Measure Based on SRS Scheme
Let be a SRS of size n obtained from PDF f. Then, the IG measure of vector is given by
Lemma 1.
Suppose the random variable X has density function f. Then, we have
where is the extended fractional Shannon entropy of order n defined as For more details about fractional Shannon entropy, one may refer to Xiong et al. [14].
2.2. IG Measure Based on RSS Scheme
Suppose are independent and identically distributed (iid) variables from an absolutely continuous CDF F and PDF f, and are the corresponding order statistics. We then present the IG measure of vector in the following theorem.
Theorem 1.
Let denote a RSS from density function f. Then, the IG measure of vector , for , is given by
where , and has distribution with PDF
Proof.
From the definition of IG measure in (1) for vector and setting , we have
as required. □
Based on the definition of fractional Shannon entropy and Lemma 1 of Kharazmi and Balakrishnan [15], we can present an alternative representation for as
where is the fractional Shannon entropy of order j and is the PDF of as given in (5).
Example 1.
Next, we discuss the IG measure for maximum and minimum RSS schemes with vectors and , respectively.
Theorem 2.
Let and denote the minimum and maximum RSS schemes from density function f, respectively. Then, the IG measures of vectors and , for , are given by
and
respectively, where has and has distributions, with
Proof.
Example 2.
- (i)
- ,
- (ii)
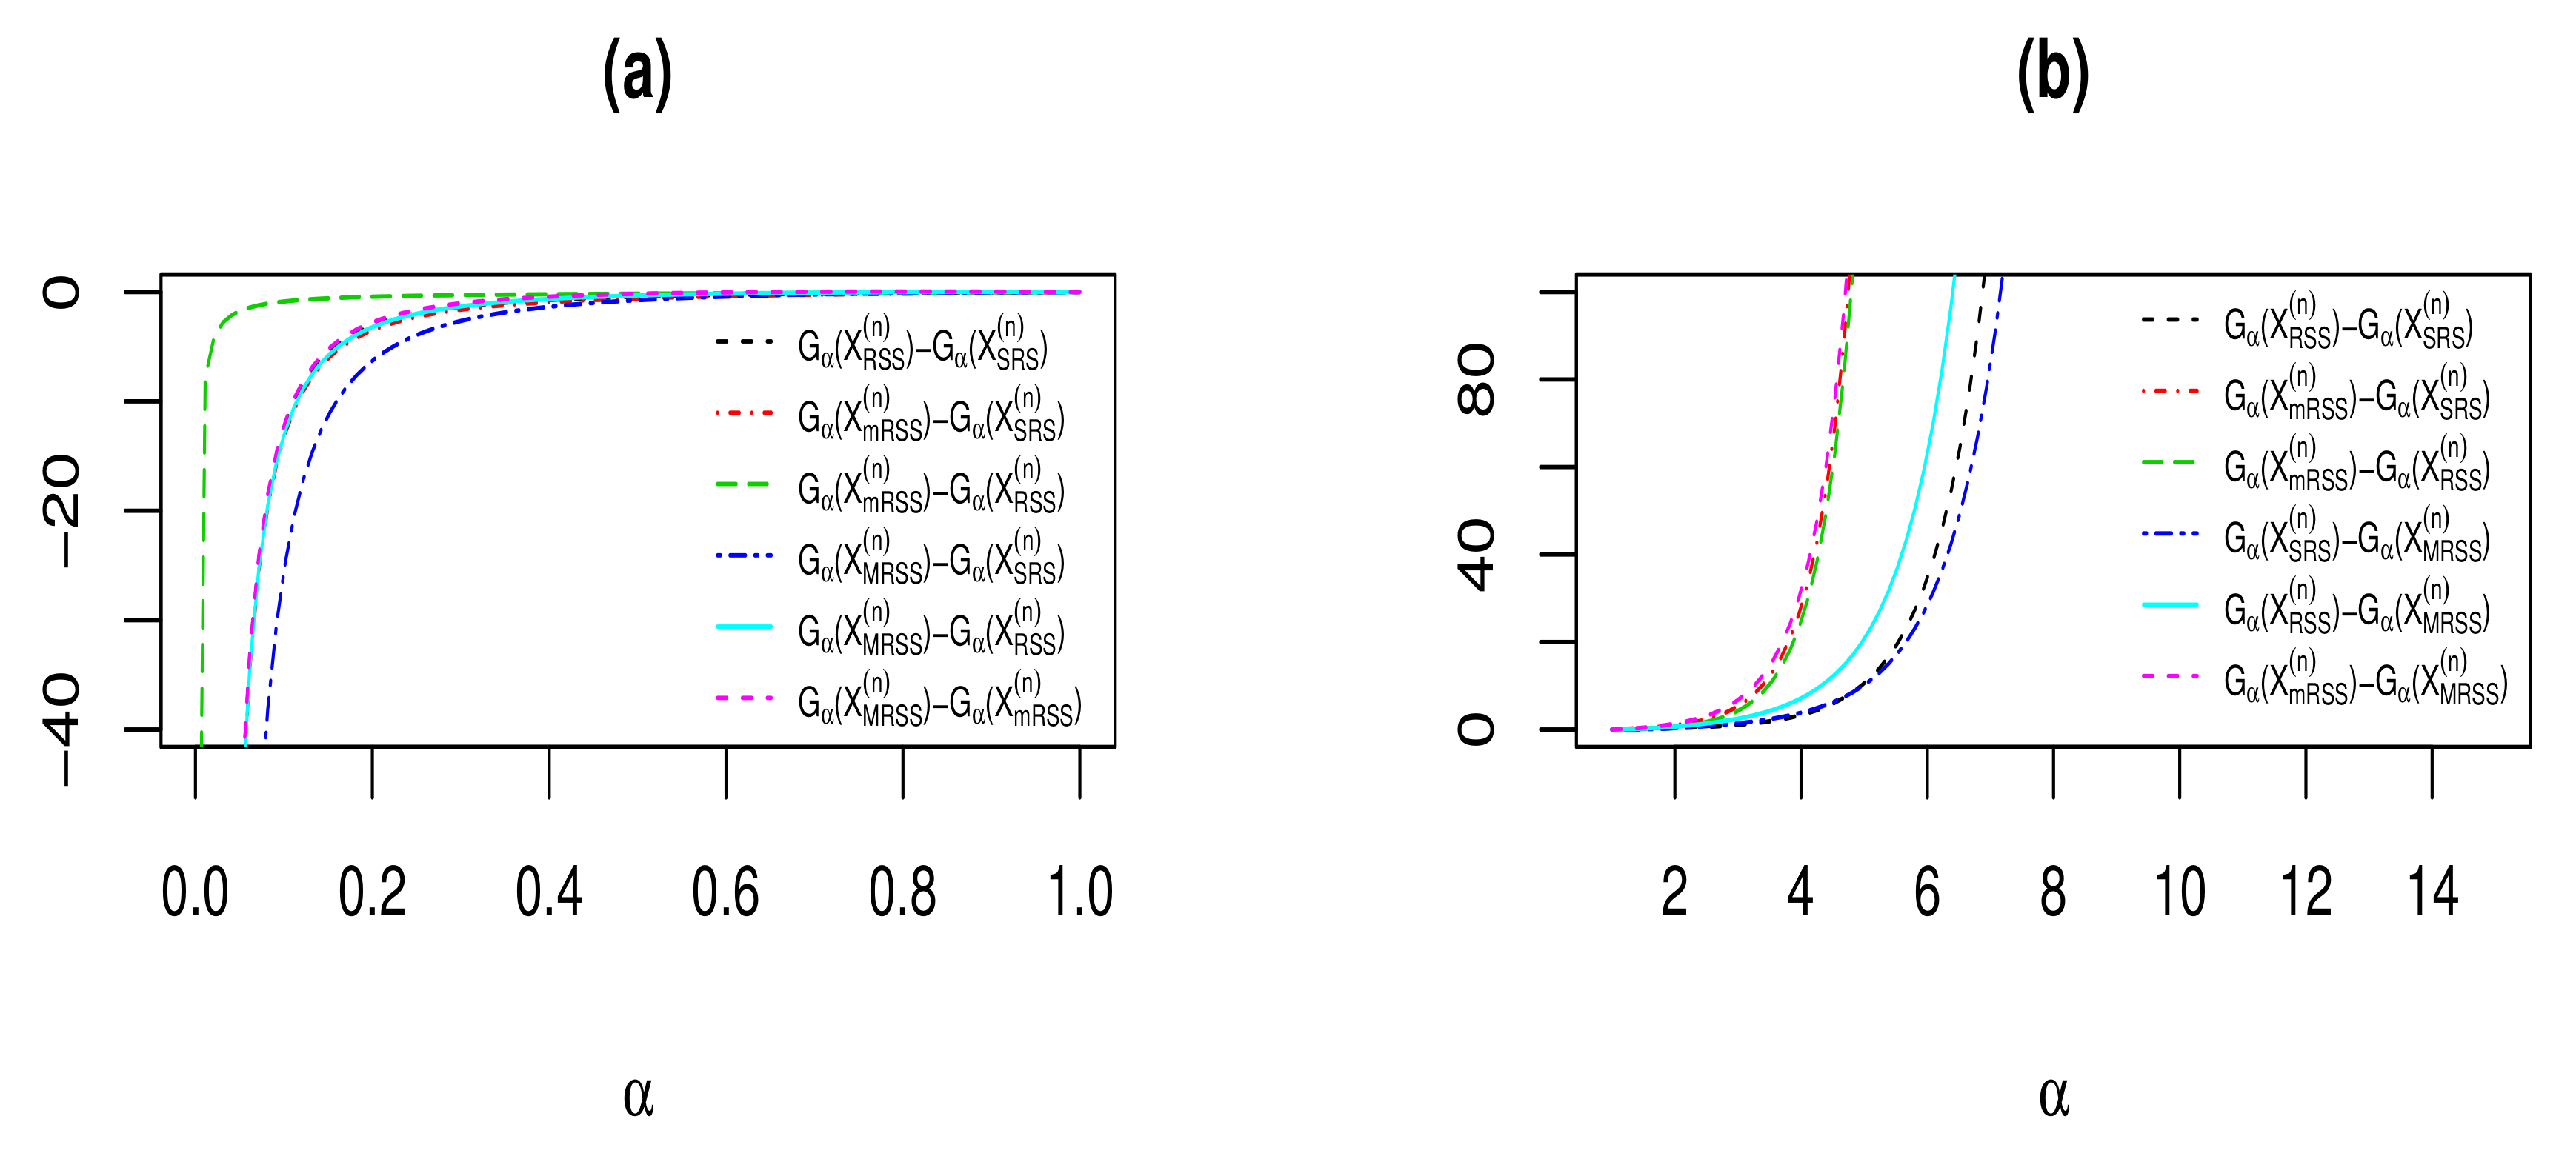
Figure 1 shows the differences between IG measures of vectors , , , and in Examples 1 and 2, for different values of and . From Figure 1, it is easy to observe that for , the IG differences are negative and increasing (Panel (a)), while for , the IG differences are positive and increasing (Panel (b)).
Suppose X has CDF F and PDF f, and the vectors and are the associated maximum and minimum RSS schemes based on a sample of size n. Then, the following results present the monotonicity properties of IG measures for vectors and .
Theorem 3.
Consider the IG measure of vector . If for all , then:
- (i)
- If , is increasing in n;
- (ii)
- If , is decreasing in n.
Proof.
By using the assumption and the definition of IG measure for the vector in (11), we have
which proves Part (i). Part (ii) can be proved in an analogous manner. □
Theorem 4.
Consider the IG measure of vector . If for all , then:
- (i)
- If , is increasing in n;
- (ii)
- If , is decreasing in n.
Proof.
By using the assumptions and the definition of IG measure for the vector in (10), we have
which proves Part (i). Part (ii) can be proved in an analogous manner. □
Next, we compare the IG measure of vector with those of and .
Theorem 5.
Consider the IG measures , and . Then:
- (i)
- If , ;
- (ii)
- If , .
Proof.
By the definition of IG measures of vectors and , we find
which proves Part (i). Part (ii) can be proved in an analogous manner. □
3. IG Ordering Results Based on the RSS Scheme
An important criterion for comparing the dispersions (or variabilities) of two variables (or distributions) is dispersive ordering. Let the variables X and Y have CDFs F and G and PDFs f and g, respectively. Then, X said to be less dispersed than Y (denoted by ) if for all ; see, for instance, Shaked and Shanthikumar [16] for relevant details.
Definition 1.
Let X and Y be two variables with IG measures and , respectively. Then, X is said to be less than Y in the sense of information generating function, denoted by , if .
Lemma 2.
Suppose . Then:
- (i)
- If , ;
- (ii)
- If , .
Proof.
See Kharazmi and Balakrishnan [15] for a detailed proof. □
Now, we present the following theorem about the IG ordering for RSS schemes.
Theorem 6.
Let be a sequence of i.i.d. variables from a deceasing failure rate (DFR) distribution. Then:
- (i)
- If , ;
- (ii)
- If , .
Proof.
From the DFR assumption of the underling distribution, it is known that
see Shaked and Shantikumar (2007). Therefore, from Lemma 2 and for , we get
and consequently,
Now, from the above inequality and definitions of the IG measures for vectors , and we immediately obtain
which is equivalent to
which proves Part (i). Part (ii) can be proved in an analogous manner. □
Theorem 7.
Let X and Y be independent random variables with densities f and g, respectively, and . Then:
- (i)
- If , ;
- (ii)
- If , .
Proof.
By the definition of IG measure for RSS in (9), we have
Because , we have for all , and so for , we get Now, making use of this inequality, we obtain
which proves Part (i). Part (ii) can be proved in an analogous manner. □
Corollary 1.
Let X and Y be independent random variables with densities f and g, respectively, and . Then:
- (i)
- If , ;
- (ii)
- If , ;
- (iii)
- If , ;
- (iv)
- If ,
4. RIG Divergence Measure Based on RSS Scheme
Let denote a SRS of size n from density function (PDF) f and cumulative distribution function F. Further, let , and be the corresponding RSS, minimum RSS and maximum RSS vectors, respectively. We now consider the RIG measure between variable X and each of the vectors and . From the definition of RIG measure in (3), the RIG divergence between with density in (6) and X is given by
It is evident from the above results that which is free of the underling distribution F.
Theorem 8.
Consider the vectors and from density function f. Then, we have:
- (i)
- ;
- (ii)
where
Proof.
From the definition of RIG divergence between vectors and , we find
which proves Part (i). Part (ii) can be proved in an analogous manner. □
With the result that in Theorem 8, we have plotted the RIG measure between vectors and , for some selected choices of and sample size n, in Figure 2. From Figure 2, it is easy to observe that for , the RIG divergence measure between and is decreasing with respect to sample size n (Panels (a) and (b)), while for , the considered RIG measure is increasing with respect to sample size n (Panels (c) and (d)). Therefore, for , the similarity between the density functions of the considered sampling vectors and gets increased. For , the result is the opposite, i.e., the similarity between the two sampling vectors gets decreased.
Theorem 9.
Consider the vectors and from density function f. Then, we have:
- (i)
- ;
- (ii)
where .
Proof.
From the definition of RIG measure between vectors and , we have
which proves Part (i). Part (ii) can be proved in a similar manner. □
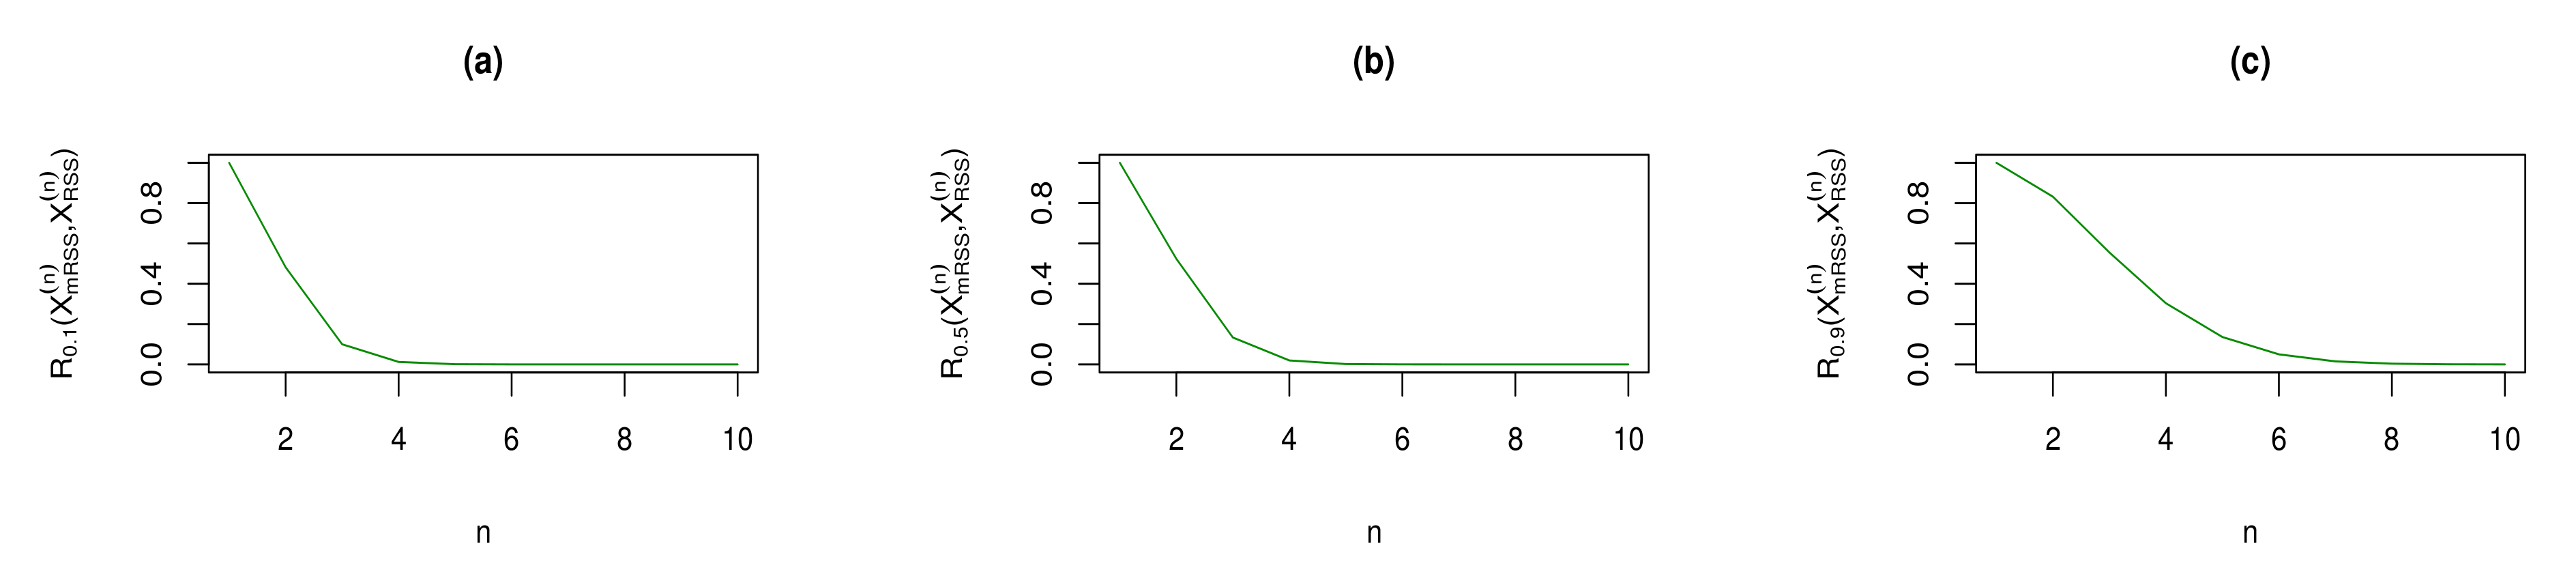
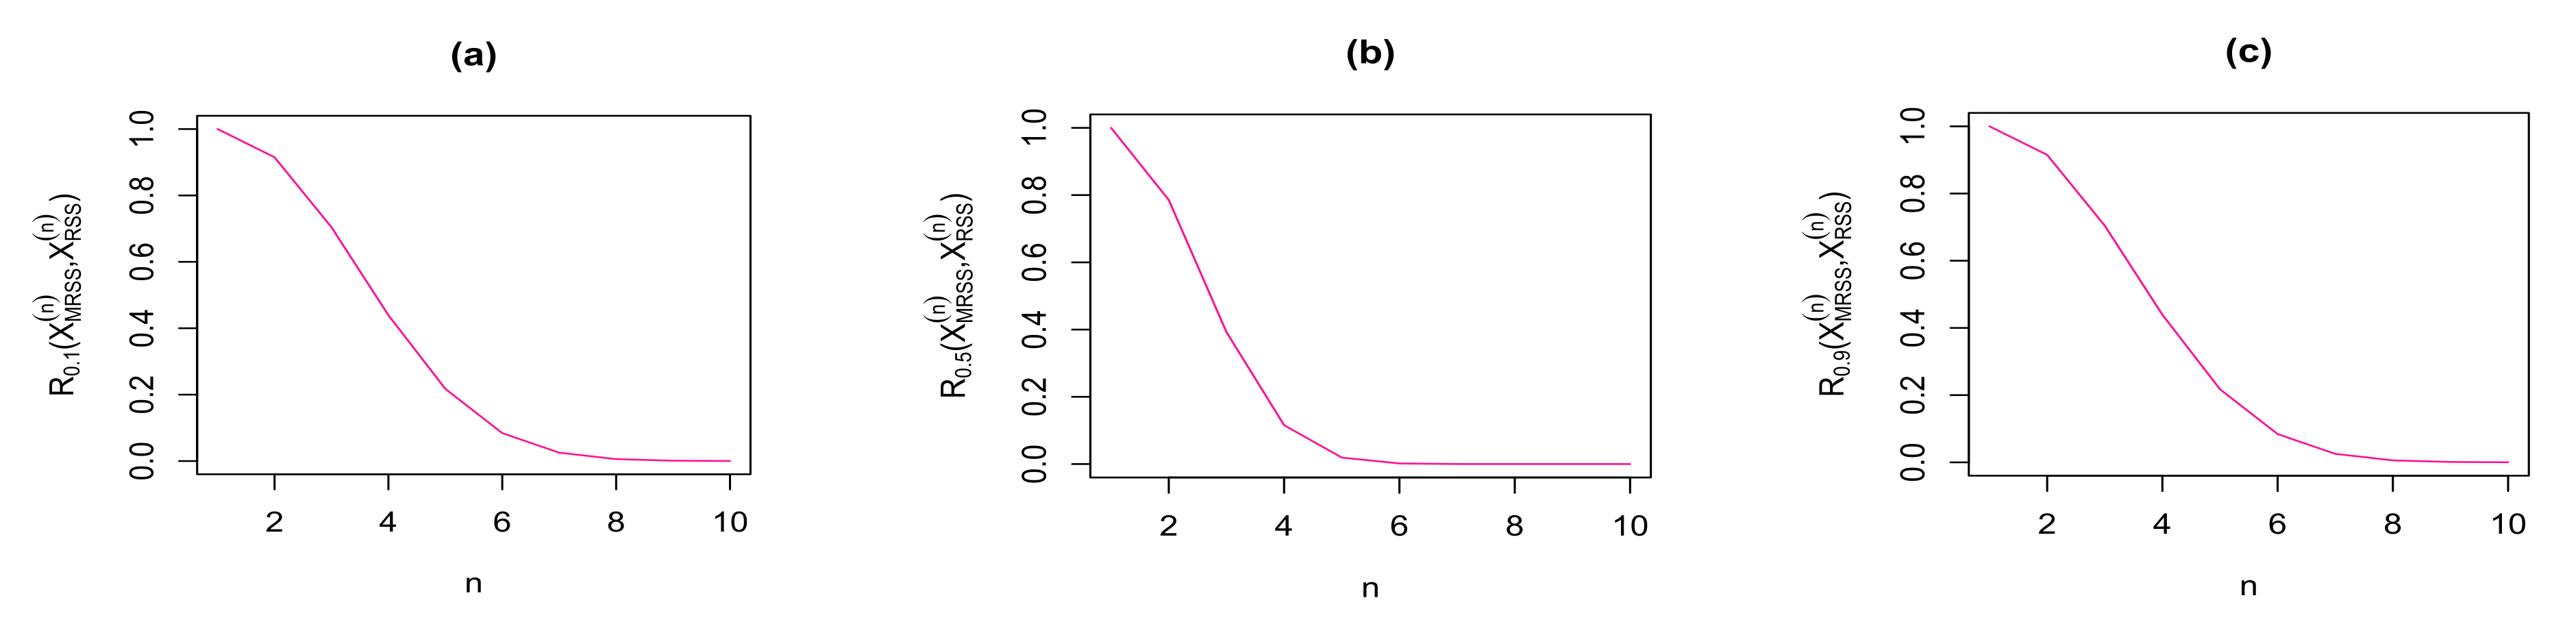
We have plotted the results of Theorem 9 in Figure 3 and Figure 4 for some choices of . From these figures, we observe that for , both RIG measures in Theorem 9 are deceasing with respect to sample size n. Therefore, the similarity between the density functions of the considered sampling vectors and gets increased with increasing sample size n.
5. Concluding Remarks
In this paper, we have studied the information generating (IG) function and relative information generating (RIG) function measures associated with SRS and RSS strategies. Specifically, we have examined the IG function for maximum and minimum RSS schemes. We have shown that, under a mild condition on the density function f, for , the IG function associated with the sampling vector is increasing with respect to sample size n. On the other hand, for , this function is decreasing. Similar results are established for the IG function of sampling vector based on values of and n. We have shown that for values of , we can provide upper bounds for and based on . We have also provided some comparative results for RSS schemes in terms of dispersive stochastic ordering. Based on this stochastic ordering, we have established some ordering results among the IG functions of sampling vectors , and in terms of (or ). Finally, we have examined the RIG measure between the vectors , , and . The corresponding results associated with RIG divergence have been plotted in Figure 2, Figure 3 and Figure 4. For example, Figure 3 and Figure 4 present both RIG measures presented in Theorem 9 for some choices of . We have demonstrated that the similarity between the density functions of the considered sampling vectors and gets increased when the sample size n increases.
Author Contributions
All authors contributed equally to this work. All authors have read and agreed to the published version of the manuscript.
Funding
This research received no external funding.
Data Availability Statement
Data sharing not applicable.
Conflicts of Interest
The authors declare no conflict of interest.
References
- Golomb, S. The information generating function of a probability distribution (corresp.). IEEE Trans. Inf. Theory 1966, 12, 75–77. [Google Scholar] [CrossRef]
- López-Ruiz, R.; Mancini, H.L.; Calbet, X. A statistical measure of complexity. Phys. Lett. A 1995, 209, 321–326. [Google Scholar] [CrossRef] [Green Version]
- Bercher, J.F. Some properties of generalized Fisher information in the context of non-extensive thermostatistics. Phys. A Stat. Mech. Appl. 2013, 392, 3140–3154. [Google Scholar] [CrossRef] [Green Version]
- Clark, D.E. Local entropy statistics for point processes. IEEE Trans. Inf. Theory 2019, 66, 1155–1163. [Google Scholar] [CrossRef]
- Guiasu, S.; Reischer, C. The relative information generating function. Inf. Sci. 1985, 35, 235–241. [Google Scholar] [CrossRef]
- Kullback, S.; Leibler, R.A. On information and sufficiency. Ann. Math. Stat. 1951, 22, 79–86. [Google Scholar] [CrossRef]
- Mares, C.; Mares, I.; Dobrica, V.; Demetrescu, C. Quantification of the direct solar impact on some components of the hydro-climatic system. Entropy 2021, 23, 691. [Google Scholar] [CrossRef] [PubMed]
- McIntyre, G.A. A method for unbiased selective sampling, using ranked sets. Aust. J. Agric. Res. 1952, 3, 385–390. [Google Scholar] [CrossRef]
- Frey, J. A note on Fisher information and imperfect ranked-set sampling. Commun. Stat.-Theory Methods 2014, 43, 2726–2733. [Google Scholar] [CrossRef]
- Park, S.; Lim, J. On the effect of imperfect ranking on the amount of Fisher information in ranked set samples. Commun. Stat.-Theory Methods 2012, 413, 3608–3620. [Google Scholar] [CrossRef]
- Chen, Z.; Bai, Z.; Sinha, B. Ranked Set Sampling: Theory and Applications; Springer: New York, NY, USA, 2013. [Google Scholar]
- Tahmasebi, S.; Longobardi, M.; Kazemi, M.R.; Alizadeh, M. Cumulative Tsallis entropy for maximum ranked set sampling with unequal samples. Phys. A Stat. Mech. Appl. 2020, 556, 124763. [Google Scholar] [CrossRef]
- Arnold, B.C.; Balakrishnan, N.; Nagaraja, H.N. A First Course in Order Statistics; John Wiley & Sons: New York, NY, USA, 1992. [Google Scholar]
- Xiong, H.; Shang, P.; Zhang, Y. Fractional cumulative residual entropy. Commun. Nonlinear Sci. Numer. Simul. 2019, 78, 104879. [Google Scholar] [CrossRef]
- Kharazmi, O.; Balakrishnan, N. Jensen-information generating function and its connections to some well-known information measures. Stat. Probab. Lett. 2020, 170, 108995. [Google Scholar] [CrossRef]
- Shaked, M.; Shanthikumar, J.G. Stochastic Orders; Springer: New York, NY, USA, 2007. [Google Scholar]
Figure 1.
The differences between IG measures for exponential distribution with and when (a) and (b).
Figure 1.
The differences between IG measures for exponential distribution with and when (a) and (b).

Figure 2.
for some selected choices of parameter and sample size n.

Figure 3.
for some choices of parameter and sample size n.

Figure 4.
for some choices of parameter and sample size n.

Publisher’s Note: MDPI stays neutral with regard to jurisdictional claims in published maps and institutional affiliations. |
© 2021 by the authors. Licensee MDPI, Basel, Switzerland. This article is an open access article distributed under the terms and conditions of the Creative Commons Attribution (CC BY) license (https://creativecommons.org/licenses/by/4.0/).
Share and Cite
MDPI and ACS Style
Kharazmi, O.; Tamandi, M.; Balakrishnan, N. Information Generating Function of Ranked Set Samples. Entropy 2021, 23, 1381. https://0-doi-org.brum.beds.ac.uk/10.3390/e23111381
AMA Style
Kharazmi O, Tamandi M, Balakrishnan N. Information Generating Function of Ranked Set Samples. Entropy. 2021; 23(11):1381. https://0-doi-org.brum.beds.ac.uk/10.3390/e23111381
Chicago/Turabian StyleKharazmi, Omid, Mostafa Tamandi, and Narayanaswamy Balakrishnan. 2021. "Information Generating Function of Ranked Set Samples" Entropy 23, no. 11: 1381. https://0-doi-org.brum.beds.ac.uk/10.3390/e23111381
Note that from the first issue of 2016, this journal uses article numbers instead of page numbers. See further details here.