
Tolerance, Cultural Diversity and Economic Growth: Evidence from Dynamic Panel Data Analysis


1
Karoly Ihrig Doctoral School of Management and Business, University of Debrecen, 4032 Debrecen, Hungary
2
Institute for the Development of Enterprises, Corvinus University of Budapest, 1093 Budapest, Hungary
3
Institute of Applied Informatics and Logistics, Faculty of Economics and Business, University of Debrecen, 4032 Debrecen, Hungary
4
Department of Statistics and Methodology, Institute of Statistics and Methodology, Faculty of Economics and Business, University of Debrecen, 4032 Debrecen, Hungary
*
Author to whom correspondence should be addressed.
Economies 2021, 9(1), 20; https://0-doi-org.brum.beds.ac.uk/10.3390/economies9010020
Submission received: 14 December 2020
/
Revised: 23 January 2021
/
Accepted: 28 January 2021
/
Published: 5 February 2021
(This article belongs to the Special Issue The Application of Time Series Analysis in Economic Growth)
Abstract
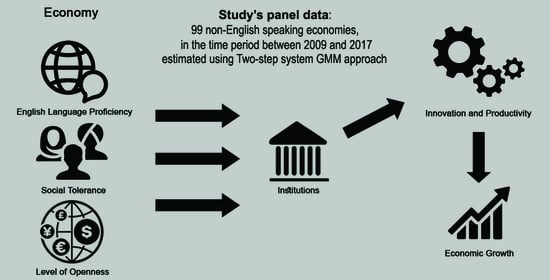
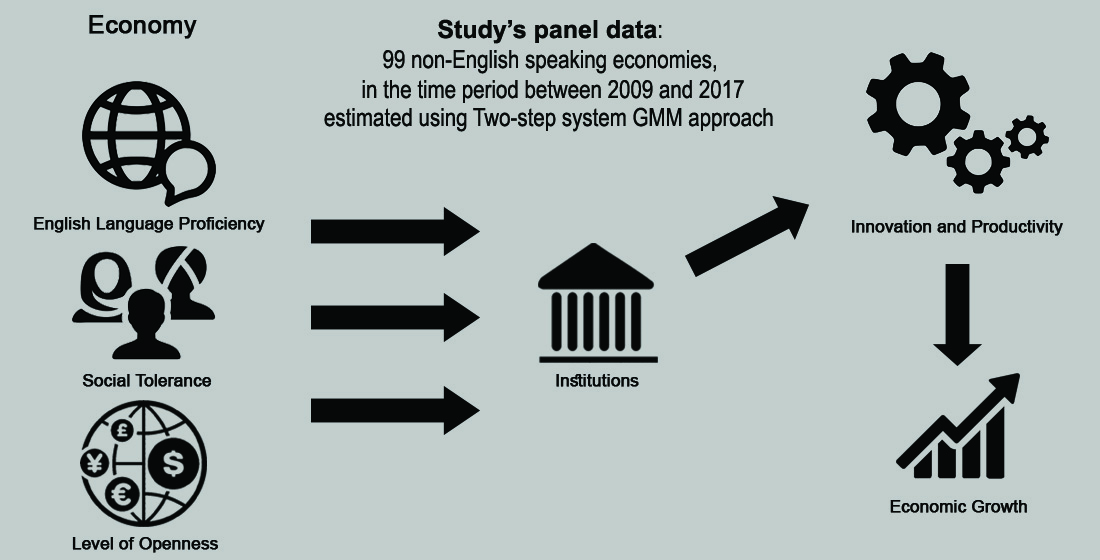
:This study aims to examine the impact of social tolerance of cultural diversity, and the ability to speak widely spoken languages, on economic performance. Based on the literature, the evidence is still controversial and unclear. Therefore, the study used panel data relating to (99) non-English speaking economies during the time period between 2009 and 2017. Following the augmented Solow model approach, the related equation was expanded, in this study, to include (besides human capital) social tolerance, the English language (as a lingua franca) and the level of openness. The model was estimated using the two-step system GMM approach. The results show that social tolerance of diversity and English language competence have a positive, but insignificant impact on the economy. Regarding policy implications, government and decision-makers can avoid the costs deriving from cultural diversity by adopting democratic and effective institutions that aim to achieve cultural justice and recognition, which, in turn, enhance the level of tolerance, innovation and productivity in the economy. Moreover, to ease intercultural communication within heterogeneous communities, it is necessary to invest in enhancing the quality of second language education which is necessary to make society more tolerant and the country more open to the global economy.
1. Introduction
Cultural diversity is an extremely interesting topic and has attracted the interest of economists as well as social scientists. It has also been frequently mentioned in the press in recent times. The reason behind this is that it is linked to the complications and problems that accompany cultural diversity due to globalization (as well as migration). Specifically, globalization results in the following three different but related complications or issues. Firstly, it has increased the tensions between migration and citizenship. Secondly, it has provoked the development of a national politics of identity. Thirdly, it has escalated what is called nationalistic xenophobia (Appadurai and Stenou 2000).
In the current period, especially during the second half of the 20th century, the ethnic makeup of populations has dramatically changed in different continents, including North America, Europe and Australia. In these geographic regions, communities have become more multiethnic and diverse over a relatively short time period (Triandafyllidou and Iryna 2013).
On the other hand, these trends have intensified the academic debate about whether migration and cultural diversity can bring benefits to the economy, or not. According to the literature, the impact of migration on the well-being of native-born citizens is still a debatable issue. Whereas some studies consider cultural diversity a good thing, others argue that a high level of migration could harm the interests of native-born citizens (Borjas 1994).
In fact, cultural diversity has recently attracted the attention of economics, especially labor economics. Based on previous studies, cultural diversity can result in economic benefits (Ottaviano and Peri 2006) or costs (Easterly and Levine 1997). Therefore, it can be considered a controversial topic. Regarding its economic value, some authors have argued that cultural diversity is a strategic element in the success of cities such as London, New York, Paris and Tokyo. These cities can be characterized as global cities where economic growth and innovation take place (Sassen 1994; Bairoch 1988).
According to Richard Florida (2002a), cities with tolerant and diverse attributes are probably more able to attract creative people, industries such as high technology and research which depends on innovation and creativity (which are necessary for economic development). Based on this observation, being tolerant is a beneficial feature that derives from ethnic, cultural and religious diversity. In this study, the concept of tolerance indicates how well society respects and benefits from the diversity of peoples’ religious beliefs, ethnicities, origins and sexualities. To some extent, this statement matches the definition of Florida (2003) in which tolerance is understood to mean “openness, inclusiveness, and diversity to all ethnicities, races, and walks of life”. Therefore, based on previous studies, tolerance and cultural diversity can be used interchangeably (Chen 2011; Florida 2005; Florida and Gates 2001), However, the current study suggests that the economic benefits of cultural diversity can occur as long as a society exhibits a high level of tolerance. This statement can be justified in the following way. Firstly, tolerance is important because it helps to remove the barriers to entry. Moreover, diversity signifies the presence of diverse cultures, foods and entertainments. There is no doubt that together they play an important role in attracting and maintaining human capital and resources, which are economically important at both the company (Popescu and Popescu 2019) and country level (Qian 2013). Secondly, tolerance helps to manage cultural and religious diversity. In the last few decades, tolerance has become a fashionable topic at the level of organizations and economic regions (such as the European Union, the United Nations, etc.) due to its importance in achieving multicultural justice, as well as peace. Therefore, these entities have an interest in developing suitable policies that are necessary to enhance and boost social tolerance (Verkuyten et al. 2019).
Another issue that should be taken into consideration in this study is the linguistic diversity within the economy, or even within the economic region. It may represent a challenge or an obstacle that hinders economic performance. For example, communication between two individuals speaking different languages could result in what is called transaction costs (Ginsburgh et al. 2007). In fact, these costs could increase with time as in the case of the European Union. For instance, translation costs in the EU (with 15 member states at that time) amounted to about €686 million per year. After expansion, these costs increased to more than €1123 million (Ginsburgh and Weber 2011). Therefore, having a common language helps to overcome this problem. At the same time, it also eases intercultural communication and enhances social tolerance. According to Zaripov et al. (2017), learning a foreign language facilitates the adjustment to different countries’ cultures and the dialogue between different cultures. Therefore, it could shape the tolerant personality of individuals. This explains why it is important for developed economies to invest in second language education and achieve a high degree of compatibility between language education policy and economic strategy (Suárez 2005). In this paper, the English language was chosen over other languages due to its data availability as well as its feature as a multinational and multicultural language (Honna 2000).
Consequently, the study aims to investigate whether social tolerance of diversity and the English language (as a lingua franca) have a positive effect on economic performance, or not. Following the approach of Mankiw et al. (1992), the study uses the augmented Solow model in order to estimate the effect of social tolerance and the English language on economic growth. Therefore, panel data analysis is the most suitable technique to achieve this. This method evaluates the effect of each variable during a specific time period for a determined number of economies.
As a result, the study contributes in different ways to the literature on tolerance of diversity and language, and its impact on development. Firstly, the literature on the effect of the English language on the economy is not sufficient. Secondly, this is one of the few studies which provides quantitative evidence on the effect of social tolerance and the English language on economic performance (using panel data analysis). Thirdly, according to the results of this study, human capital and physical investments are considered critical factors for economic development in the short and long term. Besides this, social tolerance, the English language and openness all play an important role in attracting human capital and enhancing economic performance. Fourthly, the study contributes to the literature by providing important information that might be useful for decision-makers and economists and help them to formulate suitable policies and rules aimed to achieve economic, social and political justice.
The study is organized in the following way. Section 2 provides a literature review of previous studies related to the social tolerance of diversity, language and economic growth. Section 3 discusses the methodology adopted, and the data and variables used. Section 4 provides the empirical results and the discussion. Section 5 concludes the paper.
2. Literature Review
2.1. Tolerance, Language and Cultural Diversity
After the great work of Florida (2002b), The Rise of the Creative Class, the literature started to pay attention to the impact of tolerance, openness and cultural diversity on economic development. According to Florida (2002a, 2003, 2005), and Florida and Gates (2001), tolerance and cultural diversity are usually used interchangeably. In this regard, Florida mainly measures tolerance using three types of measurement, that is, the gay index, the bohemian index and the melting pot index. These measurements cover the regional population density for gays, lesbians, bohemians and immigrants in a series. However, other studies have criticized Florida’s scientific work. For example, Qian (2013) argued that tolerance and diversity are not conceptually similar. Consequently, the measurements used to evaluate them should not be the same. For instance, tolerance might not be well measured using the gay index (Inglehart and Norris 2003; Inglehart and Welzel 2005), and Florida et al. (2008) constructed a special measurement of tolerance called the tolerance index, which can be estimated by merging the gay index and the bohemian index. However, these indexes are not suitable for measuring cultural diversity because they cannot cover people’s distribution across cultural groups. On the other hand, cultural diversity can be measured using the widely known Herfindahl–Hirschman index (HHI) (Schaeffer 2013). Furthermore, the definition of tolerance is not the same as that of cultural diversity since tolerance represents a positive attitude that provides individuals with space in order to comprehend others. This attitude could help to create harmony within society (Peter 2011; Brewer and Pierce 2005). In contrast, cultural diversity indicates the coexistence of diversity in terms of religions, languages, genders, ethnicities, nationalities, sexual orientation, etc. (Lin 2019). In this regard, the role of economists is to understand the heterogeneity of people’s preferences and perspectives and how this could influence the economy. One of the main challenges related to cultural diversity is ethnic conflict due to heterogeneity, manifest in terms of policies and public goods (Alesina et al. 2005). The existence of ethnic conflict is accompanied by opportunity costs such as lost time and resources which could instead be invested in economic development (Yong 2019). Currently, cultural diversity results in many problems such as hate crimes, racism, color bias, ethnic discrimination, xenophobia, anti-Semitism, anti-feminism and homophobia. In the real world, a number of well-known organizations, such as the European Council and the United Nations, consider tolerance the best solution to overcome these problems (Verkuyten et al. 2019). As a result, the best way to manage and economically benefit from cultural diversity is by promoting social tolerance in the economy.
Another problem that cultural diversity causes is linguistic diversity. This study argues that speaking or learning a common language represents another form of tolerance that helps to manage ethnic diversity as well as immigrants’ social integration in the economy. In accordance with the study of Zaripov et al. (2017), speaking a foreign language is the answer to the problems of how to understand the world’s specialized knowledge, to adapt to the culture of other counties and to converse with different cultures. It increases people’s awareness of being global citizens rather than just belonging to their native country. Based on the study of Liu and Pizzi (2018), it has been proved that there is no evidence indicating the negative influence of ethnic-linguistic diversity on economic development, since their study shifts the attention to the official language, takes second language speakers into the account and also checks this population over time. As a result, their study comes to the following conclusion. Firstly, when an ethnically diverse population can speak the state language, this can help to reduce the transaction costs of economic exchanges. As a result, this efficiency eases economic development. Secondly, it was found that this could help to reduce the problem of inequality that minorities face. For example, Singapore is considered one of the homes of linguistic diversity, being made up of Chinese (74.2%), Malays (13.3%) and Indians (9.2%). Singapore became independent in 1965, following the British colonial period. At that time, about 21% of the population claimed the ability to read and write the English language (Dixon 2005). The education system was neglected until 1978. At that time, the education ministry faced many serious problems which were reviewed by a team called the Daring Dozen, consisting of 12 people led by education minister Goh Keng Swee (Tan 2007). His report can be considered one of the most important factors in establishing Singapore’s educational policy and had historic significance. Since then, education policies have concentrated on enhancing social efficiency rather than social equity (Kwok 1999). In the last few years, according to statistics, English has become the native language of 40% of Singapore’s population (Dixon 2005). Furthermore, it is spoken as a second language by about another 50% (Lewis et al. 2014). Considering this example, languages are necessary to draw the boundaries between ethnic groups, and they are also used as means of communication (Marschak 1965). In this regard, business exchanges can be carried out with higher efficiency. This efficiency is very necessary to facilitate the economic process, as in the cases of both Singapore and Indonesia (Liu and Pizzi 2018).
As a result, learning a foreign language plays an important role in achieving a high level of efficiency, especially in commerce, and it solves the challenges presented by linguistic diversity, allows one to manage and benefit from cultural diversity, and thus helps to enhance economic development. Based on this, this study hypothesizes that language and social tolerance together could help to make cultural diversity more worthwhile and more efficient for economic performance. It is also important to shed light on the fact that languages are not equal (Liu 2015). For example, some languages are spoken by the majority (Safran and Liu 2012). Others have economic value in terms of their association with an increase in investments (Kim et al. 2015), trade (Hutchinson 2002) or wages (Ginsburgh et al. 2007). In addition, some languages are characterized by their underlying legal and linguistic basis (Melitz 2008). In this study, the English language was chosen due to its importance as a multicultural language (Honna 2000) and its role in international commerce (Ku and Zussman 2010).
2.2. How Do Social Tolerance and Languages Boost Economic Development?
First of all, based on the literature, cultural diversity has economic importance on both the micro- and macroeconomic level. For example, regarding the microeconomic aspect, on the level of management sciences, the focus was on the diversity of teams and groups and reached the following findings (Hoogendoorn and van Praag 2012). For example, cultural diversity helps to create an abundant pool of various types of expertise and experience. This can help to encourage organizational synergies. However, it may also result in linguistic diversity, as well as a lack of ability to trust others. This could consequently lead to serious problems such as increases in transaction costs and incompatibility or conflicts between different groups (Horwitz and Horwitz 2007). On the other hand, cultural diversity results in innovation, which enhances economic growth through a series of relationships, such as the following. For example, suppose that there is an increase in cultural diversity in terms of religious, ethnic and cultural backgrounds, in a given economic region (such as Europe (Alesina et al. 2016)). As a result, the level of innovation may increase and take various forms, such as research and development (R&D), new products or services, new companies and university-business technology transfers, all of which are necessary for economic development (Freel and Robson 2004). In fact, innovation can result from people’s demand for products and services (Schmookler 1966). Firms usually aim to improve their current services or products and develop new ones through their customers’ feedback (Jovanovic and Rob 1987). Therefore, a culturally diverse population is linked with preference diversity among consumers (Alesina et al. 2005). As a result, this will encourage start-up projects to develop, which could become competitive with existing firms. At the same time, existing firms will do their best to compete with new ones by innovating and developing new products (or services) that meet the demands of people with other ethnic identities (Aghion et al. 2009). Consequently, the study argues that it is possible to manage and benefit from cultural diversity’s economic benefits on the macroeconomic level, through tolerance. In this study, tolerance can take two forms in each economy: social tolerance and common language proficiency.
According to Temple (1999), cross-country studies have drawn economists’ attention to the idea that physical capital and labor are not the only predictors of economic growth, as is demonstrated in growth theory. There are other factors which should be taken into consideration. For example, the literature indicates other determinants of economic development, such as the quality of legal institutions (Knack and Keefer 1995), political institutions (Barro 1996) and the size of government (Bergh and Karlsson 2010). Besides this, social factors can be part of the economic process; these include social capital (Zak and Knack 2001) and income inequality (Aghion et al. 1999). In this sense, this study suggests that social tolerance can be another necessary social factor (Buchanan and Tullock 1962; Buchanan and Congleton 1997).
As is generally known from the literature, tolerance and cultural diversity have the same role in attracting human capital. Regarding cultural diversity, based on the study by Alesina and La Ferrara (2005), cultural diversity enhances and strengthens productivity through skills. Besides this, according to Solow’s growth model, total factor productivity is determined by unobservable changes in production technology (Snowdon and Vane 2005). Therefore, it is possible to consider cultural diversity as an important component of total factor productivity (which was explained by Solow (1957)). This can be confirmed by the studies by Aghion and Howitt (1992) and Romer (1990) in which productivity can be predicted by knowledge. This knowledge can be introduced by educated and skilled immigrants as in the case of Germany (Bouncken 2004). Accordingly, given that tolerance and diversity are similar in their function of attracting human capital, the study aims to include and investigate the impact of social tolerance on economic development (using an augmented Solow equation). This is demonstrated by the fact that both tolerance and diversity create an attractive environment for human capital, which is necessary for economic growth (Chen 2011). This can be proved by the fact that highly-educated people are usually attracted to places that are characterized by their inclusiveness and diversity (Florida 2005). This theory is called the creative capital theory, and was developed by Florida in 2002. It differs from human capital theory in two aspects. Firstly, it targets a special category of human capital, the creative class, which is necessary for economic growth. Secondly, it helps to determine the factors influencing the category’s choice of location. This category is defined as a creative class that may include people who are engaged in knowledge-intensive industries. Consequently, a positive attitude toward diversity has played an important role throughout history. For example, the Netherlands’, the United Kingdom’s and Sweden’s acceptance of and openness toward various religious minorities attracted immigrants with prolific abilities to be part of the economy in a positive way (Grell and Porter 2000). In addition, according to Mokyr (1990), technological progress study, diversity and tolerance are considered important requirements of innovation. This argument was also supported in the study by Florida and his co-authors in which tolerance is positively correlated with economic development.
Furthermore, tolerance helps to facilitate the spread of knowledge (Florida et al. 2008). This knowledge is a necessary input for economic development (Acs et al. 2002). As a result, there is a positive relationship between tolerance, technology and innovation. In addition, tolerance promotes entrepreneurship since entrepreneurs are considered a part of a talent pool. Therefore, they may be attracted to regions characterized by tolerance and diversity (Cheng and Li 2012; Lee et al. 2004). Consequently, tolerance helps to enhance economic growth since both innovation and entrepreneurship represent important components of regional competitiveness (Acs 2002; Fritsch 2008).
Finally, other economic models concentrate on the negative impact of diversity, such as ethnic segregation, and a lack of social capital and of efficiency because of communication barriers. This kind of model neglects the indirect impact of diversity, which may result in disagreement, crimes or even war. For instance, studies by Ottaviano and Peri (2005) and Prat (2002) did not take into account the cost of diversity. Instead, they assumed that a more heterogeneous population is better than a less heterogeneous one. On the contrary, Lazear (1999) has proved that diversity can cause costs that are incurred as a result of communication difficulties. Furthermore, Easterly and Levine (1997) argue that diverse communities increase the likelihood of conflicts which may hinder the process of economic growth. Based on this, cultural diversity requires social tolerance and toleration in order to avoid these costs. This can be achieved by developing the appropriate institutions that promote tolerance of diversity. For example, Collier (2001) found that democratic institutions promote and improve the performance of a diverse community compared to a homogenous one in the private sector. Therefore, these institutions could reduce diversity costs and achieve the optimal level of tolerance which is necessary for economic development.
On the other hand, learning common languages enhances economic development. For instance, transactions and exchanges which are carried out in a diverse community or economic region might require translation services (in order to save time and reduce the risk of misunderstandings). These services represent costs, which may hinder economic performance. Moreover, these business exchanges cannot flow efficiently, and efficiency is necessary for economic growth (Liu and Pizzi 2018). Furthermore, languages can be considered an important component of human capital because of their role as valuable and productive assets in the labor market (Chiswick and Miller 2007; Chiswick 2008). Also, it is important to add here that languages are responsible for human capital movement between nations. For example, learning and speaking the language of a destination economy facilitates migration and the inclusion of immigrants in the labor market (Bleakley and Chin 2004).
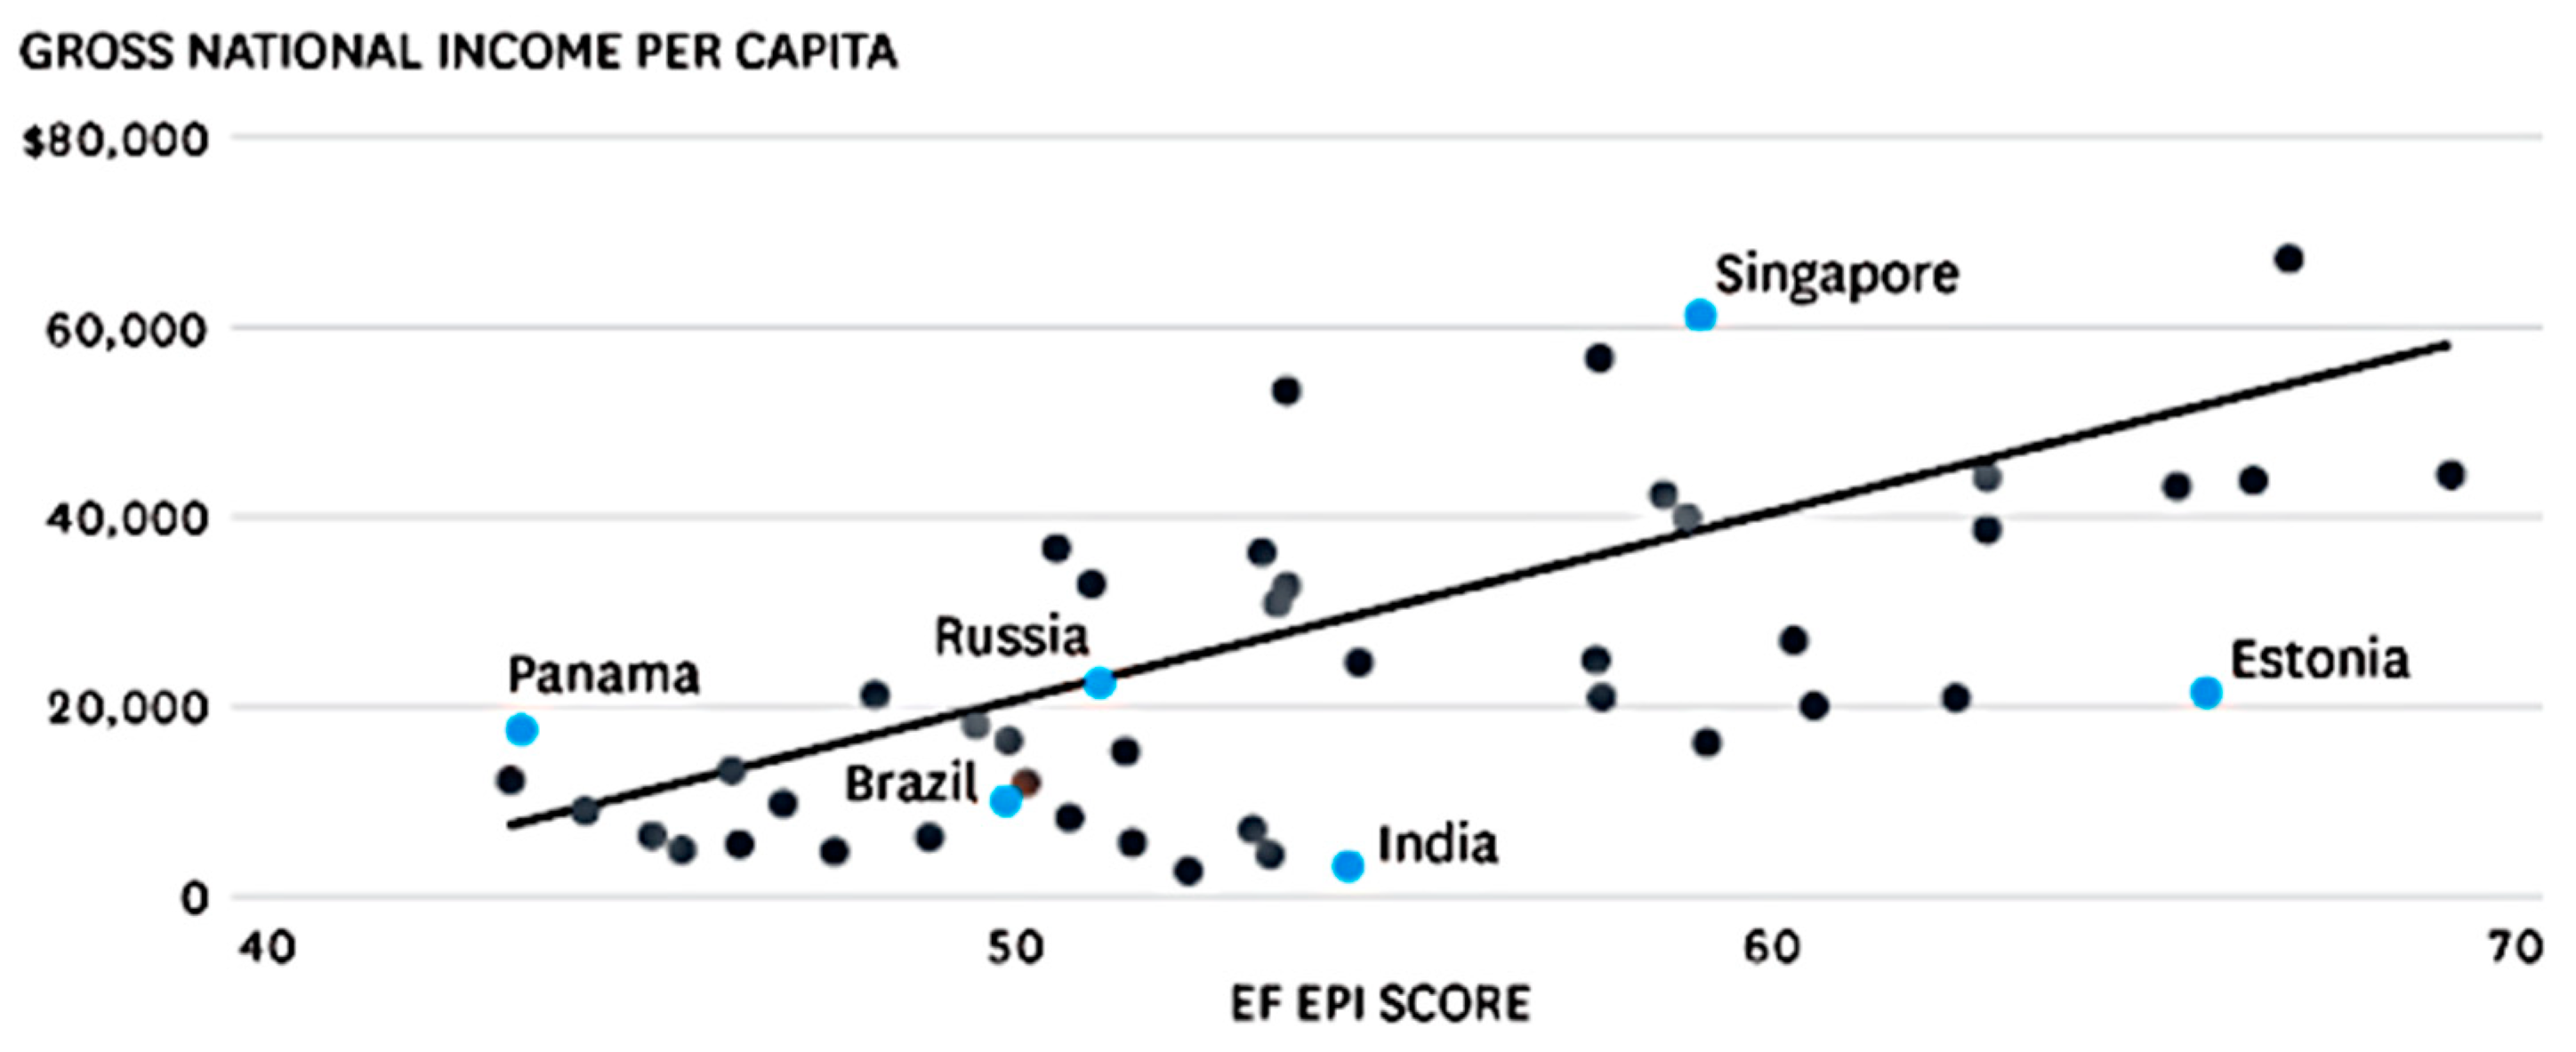
In this study, the English language was chosen due to its role in globalizing the economy and making it more tolerant of other cultures. Based on the literature, English proficiency (by country) is associated with a rise in wages, the attraction of foreign capital and economic development, as in the case of Singapore and Ireland (Suárez 2005). Furthermore, widely spoken languages enhance and increase international migration (Adserà and Pytliková 2015). Therefore, this will help to increase the level of diversity and hence innovation (Fassio et al. 2019). The English language is regarded as a multinational and multicultural language (Honna 2000) and consequently helps to solve the problem of transaction costs (Pool 1996) and removes barriers or related obstacles. For example, the European Union, informally, uses the English language as a common language for communication and commerce, besides the freedom of mobility and tariff cost reduction aspects (Chiswick 2008). According to McCormick (2013), it has been statistically proven that there is a positive relationship between English language proficiency and gross national income per capita for each country, as is shown in Figure 1.
Based on the above discussion, learning a common language is another form of tolerance, which is required in order to deal with linguistic diversity. The study also argues that an optimal level of tolerance can be achieved when decision-makers and economists can successfully develop the policies and institutions that are necessary to enhance both foreign language education and social tolerance of diversity. In this way, the economy can manage and benefit from the existence of cultural diversity in an efficient and effective way and enhance economic growth.
3. Methodology
In order to investigate whether a high social tolerance of diversity, as well as English language proficiency, is good for the economy or not, it was appropriate to use the panel data analysis approach. The countries listed in the panel were chosen based on the availability of the data. The initial number of countries was 141. After data cleaning, the number was reduced to 99 (see Appendix A). In addition, because the study aims to analyze the effect of English language proficiency on economic performance, the analysis only focused on non-English speaking economies.
Regarding panel data properties, the number of cases (economies) included in the panel is 99 (which is indicated by N). In addition, the analysis took into account the change in economic indicators during the time period between 2009 to 2017 (which is indicated by T = 9). Based on this, the two-step system GMM test (which is also known as the Dynamic panel-data estimation) was appropriate for this type of data because the time period is less than the number of cases (T < N) in this study. Stata (Version 16) was used to conduct the analysis.
3.1. Augmented-Solow Model
Initially, in order to determine the main predictors of economic growth, the study started building the model using Solow’s equation (Solow 1956) which is the following:
where the output level (indicated by ) is predicted by three determinants: the knowledge level (A), labor (L) and capital (K). (α) represents output elasticity in terms of capital and (t) indicates time.
Following the work of Mankiw et al. (1992), it is possible to expand this equation in order to also include human capital (H) in the following way:
where β indicates the change in the output variable for every one unit of change in the predictor. In this study, this equation (which is also known as the augmented-Solow model) was used as a baseline model through which the analysis can be carried out.
To estimate the effect of human capital on output, it is necessary to calculate output per labor (by dividing the output level over labor, Y/L). It is also necessary to take the logarithm of both sides of the equation to meet the steady state of income per labor, as shown below:
where
where indicates the per labor investment of physical capital, employment growth rate and per labor human capital. With respect to knowledge advancement and depreciation rates , their values are assumed to be constant across the countries in the panel data. The reason behind this is that knowledge advancement cannot be clearly determined among countries, since knowledge is universal and available all around the globe. Also, due to the unavailability of the data, it is not possible to measure depreciation rates. Finally, A(0) indicates the technology, natural resources, institutions, etc. that could differ from one country to another. As shown above, A(0) is estimated by a constant value and the shocks a country experiences as .
3.2. Two-Step System GMM Estimation
Based on the panel data properties, the two-step system GMM technique is more likely to be the appropriate way to examine the effect of social tolerance on diversity, and English language proficiency on economic performance. Initially, it is usually preferable to use the difference GMM (Arellano and Bond 1991) in order to address the endogeneity problem. It increases the consistency of the estimation because of its ability to remove unobserved country-specific fixed effects. Despite this, in some cases, these effects can be very important. Consequently, a difference in GMM may lead to a wrongly-specified model and weak instruments. In order to avoid this problem, the two-system GMM (Arellano and Bover 1995; Blundell and Bond 1998) was used to conduct the analysis. This helps to eliminate weak instruments using two systems of equations (a differenced equation and an equation in levels). As a result, using the two-step system GMM, the equation of economic growth can be generally written as the following:
in which:
in which:
where and indicate the number of countries and the time period included, respectively, and denotes the first difference factor. and represent real GDP (as an indicator of economic growth) and their values lagged by one year. The rest of the equation includes explanatory variables and their lags Furthermore, the error can be calculated by adding unobserved country fixed effects to idiosyncratic disturbance
The Hansen and Arellano–Bond Test (AR2)
In order to be sure that the model is valid and fits the panel data, it is necessary to check the validity of each instrument as well as the autocorrelation/serial correlation of the error term. Instrument validity can be checked using the Hansen test, where the p-value should be between 0.1 and 0.25 (Roodman 2009). Furthermore, autocorrelation can be examined through the Arellano–Bond test (AR2). In this test, the p-value should be higher than 0.05. Based on the results shown in Table 1 in the next section, the two-step system GMM can be used to estimate and predict the model used in this study.
3.3. Data and Model Specification
Based on the above, the economic growth equation of this study can be written as the following:
ln(GDP per capita)it = β0 + β1 ln (GDP per capita)it−1 + β2 ln (n + g + δ)it + β3 ln (sk)it +
β4 ln (h)it + β5 ln (TOEFL score)it + β6 ln (Social tolerance)it + β7 ln (Openness)it + μt + uit
β4 ln (h)it + β5 ln (TOEFL score)it + β6 ln (Social tolerance)it + β7 ln (Openness)it + μt + uit
As shown in the equation, logarithm (ln) was taken for both sides and, (μt) denotes sets of country dummies and time effects, and (uit) is an error term with E(uit) = 0 for all (i) and (t). In addition, GDP per capita was calculated by dividing output-side real GDP at chained PPP by the number of persons engaged (in millions) in the labor market. Also, in order to enhance the consistency of the estimation, a lagged endogenous variable (GDP per capita)it−1 was used as an explanatory one. Also, (g + δ) was assumed to equal 0.05. (See Appendix B, which describes in detail the variables included in the model, their sources and definitions).
Finally, year dummies in the model help to describe the changes in GDP across the panel data’s countries and time. Besides this, the GMM technique can help to estimate the long-run effect of the variables that have significant p-values. Hence, the long term impact can be calculated through the following formula: in which indicates a significant variable in the short run, and represents ln(GDP per capita)it−1.
4. Results and Discussion
Based on the results shown in Table 1, social tolerance toward diversity has a positive impact on economic growth. However, this impact is not significant in this study. In other words, a percentage change in social tolerance is associated with a 0.018% increase in economic development (in the short run). This result matches the findings of Florida et al. (2008); Lopes et al. (2011); Ottaviano and Peri (2006); Boschma and Fritsch (2007), etc. As explained in Appendix B, social tolerance refers to the extent to which a given economy is tolerant toward ethnic minorities, LGBT individuals, immigrants and religions. Based on the panel data, Norway, Luxembourg, Iceland, Switzerland, Sweden, Finland, Denmark, Belgium, Austria, Germany, France, Spain, Portugal, Brazil, Uruguay, Chile, Costa Rica, Ecuador, Paraguay, Hong Kong SAR, China and Nepal are categorized as economies which are highly tolerant of cultural diversity. For example, Lauring (2009) explained how knowledge can be shared among the heterogeneous workforce in Danish companies. One of the most important ways is to avoid inequalities of power, which could result in political relations and hence negatively harm the useful role of cultural diversity. In the case of Sweden, in 2009, the objectives of a new national cultural policy were developed. These objectives encourage intercultural exchange among people. Furthermore, Sweden’s municipalities, as well as councils, spent about SEK 26 billion on culture in 2015 (according to the Sweden 2016 report) (UNESCO 2020). Also, cultural diversity policies can be considered on the city level (in what is called intercultural cities). For example, the minorities in Oslo (Norway) are mostly from Pakistan, Somalia, Turkey, Iraq, Vietnam, Iran and India. Therefore, the city developed certain policies (known as OXLO, Oslo Extra Large) to promote intercultural competence and social tolerance. OXLO mainly aims to increase people’s awareness of cultural diversity by avoiding racism and ensuring equality in accessing city services. Stuttgart (Germany) also developed a set of policies targeting civil, public and private society. These policies focus on equality and social cohesion. The motivation behind the adoption of these policies is that successful integration can help to attract foreigners, foreign direct investment and economic prosperity. Based on the statistics, Stuttgart recorded the lowest rates of crime and unemployment (Council of Europe 2009). Another example is Nepal where legal reforms were established in order to protect LGBT individuals in society by adopting anti-discrimination laws (in 2015) to enhance the level of tolerance in the country (Legatum Institute 2018). As a result, in order to benefit from cultural diversity, it is necessary to keep the economy tolerant and flexible using strong and effective policies and institutions.
As regards language, TOEFL mean scores represent the linguistic ability of test-takers per nation. Based on the TOEFL dataset, scores differ from one country to another. This can be explained by an economy’s quality of education, cultural diversity, linguistic proximity and the level of openness of the country. As observed in Table 1, the TOEFL variable’s p-value is also insignificant. However, it has a positive influence on economic performance, since, for every unit increase in TOEFL score means per nation, there is an increase in its economic growth of 0.123%. These results also match the findings of Suárez (2005); Seargeant and Erling (2011); Lee (2011). In addition, the openness of the economy also has an insignificant but positive impact on development (Rivera-Batiz and Romer 1991).
Based on the panel data regarding the TOEFL report, countries with high score means include Switzerland, Luxembourg, Germany, Iceland, Finland, Denmark, Belgium, Austria, Singapore, Uruguay and South Africa. Accordingly, this leads to the following observations. Firstly, these countries are categorized as highly proficient in speaking the English language as reported in the Education First dataset (see the Education First (2017)). Secondly, some economies, such as Germany, Belgium, Finland, etc., adopt different social integration strategies, policies and programs in order to show tolerance to ethnic minorities and migrants who may be diverse in terms of language and culture (European Commission 2020). Thirdly, a high level of openness and international commerce is one of the reasons why the economy’s population is proficient in speaking the English language (Levinsohn 2007; Ku and Zussman 2010), as in the case of Singapore and Luxembourg.
Regarding (sk) physical investment and (h) human capital, these two variables have a significant and positive effect on economic growth in both the short and the long run (as indicated in Table 1 and Table 2, respectively). As shown in Table 2, physical investment has a highly significant effect (at the significance level of 0.01), where for every unit increase in physical investment there is an increase in economic growth of 0.426% in the long term. On the other hand, human capital has a positive influence on the economy at the significance level of 0.001, where for every unit increase in human capital there is an increase in economic development of 2.795% in the long run.
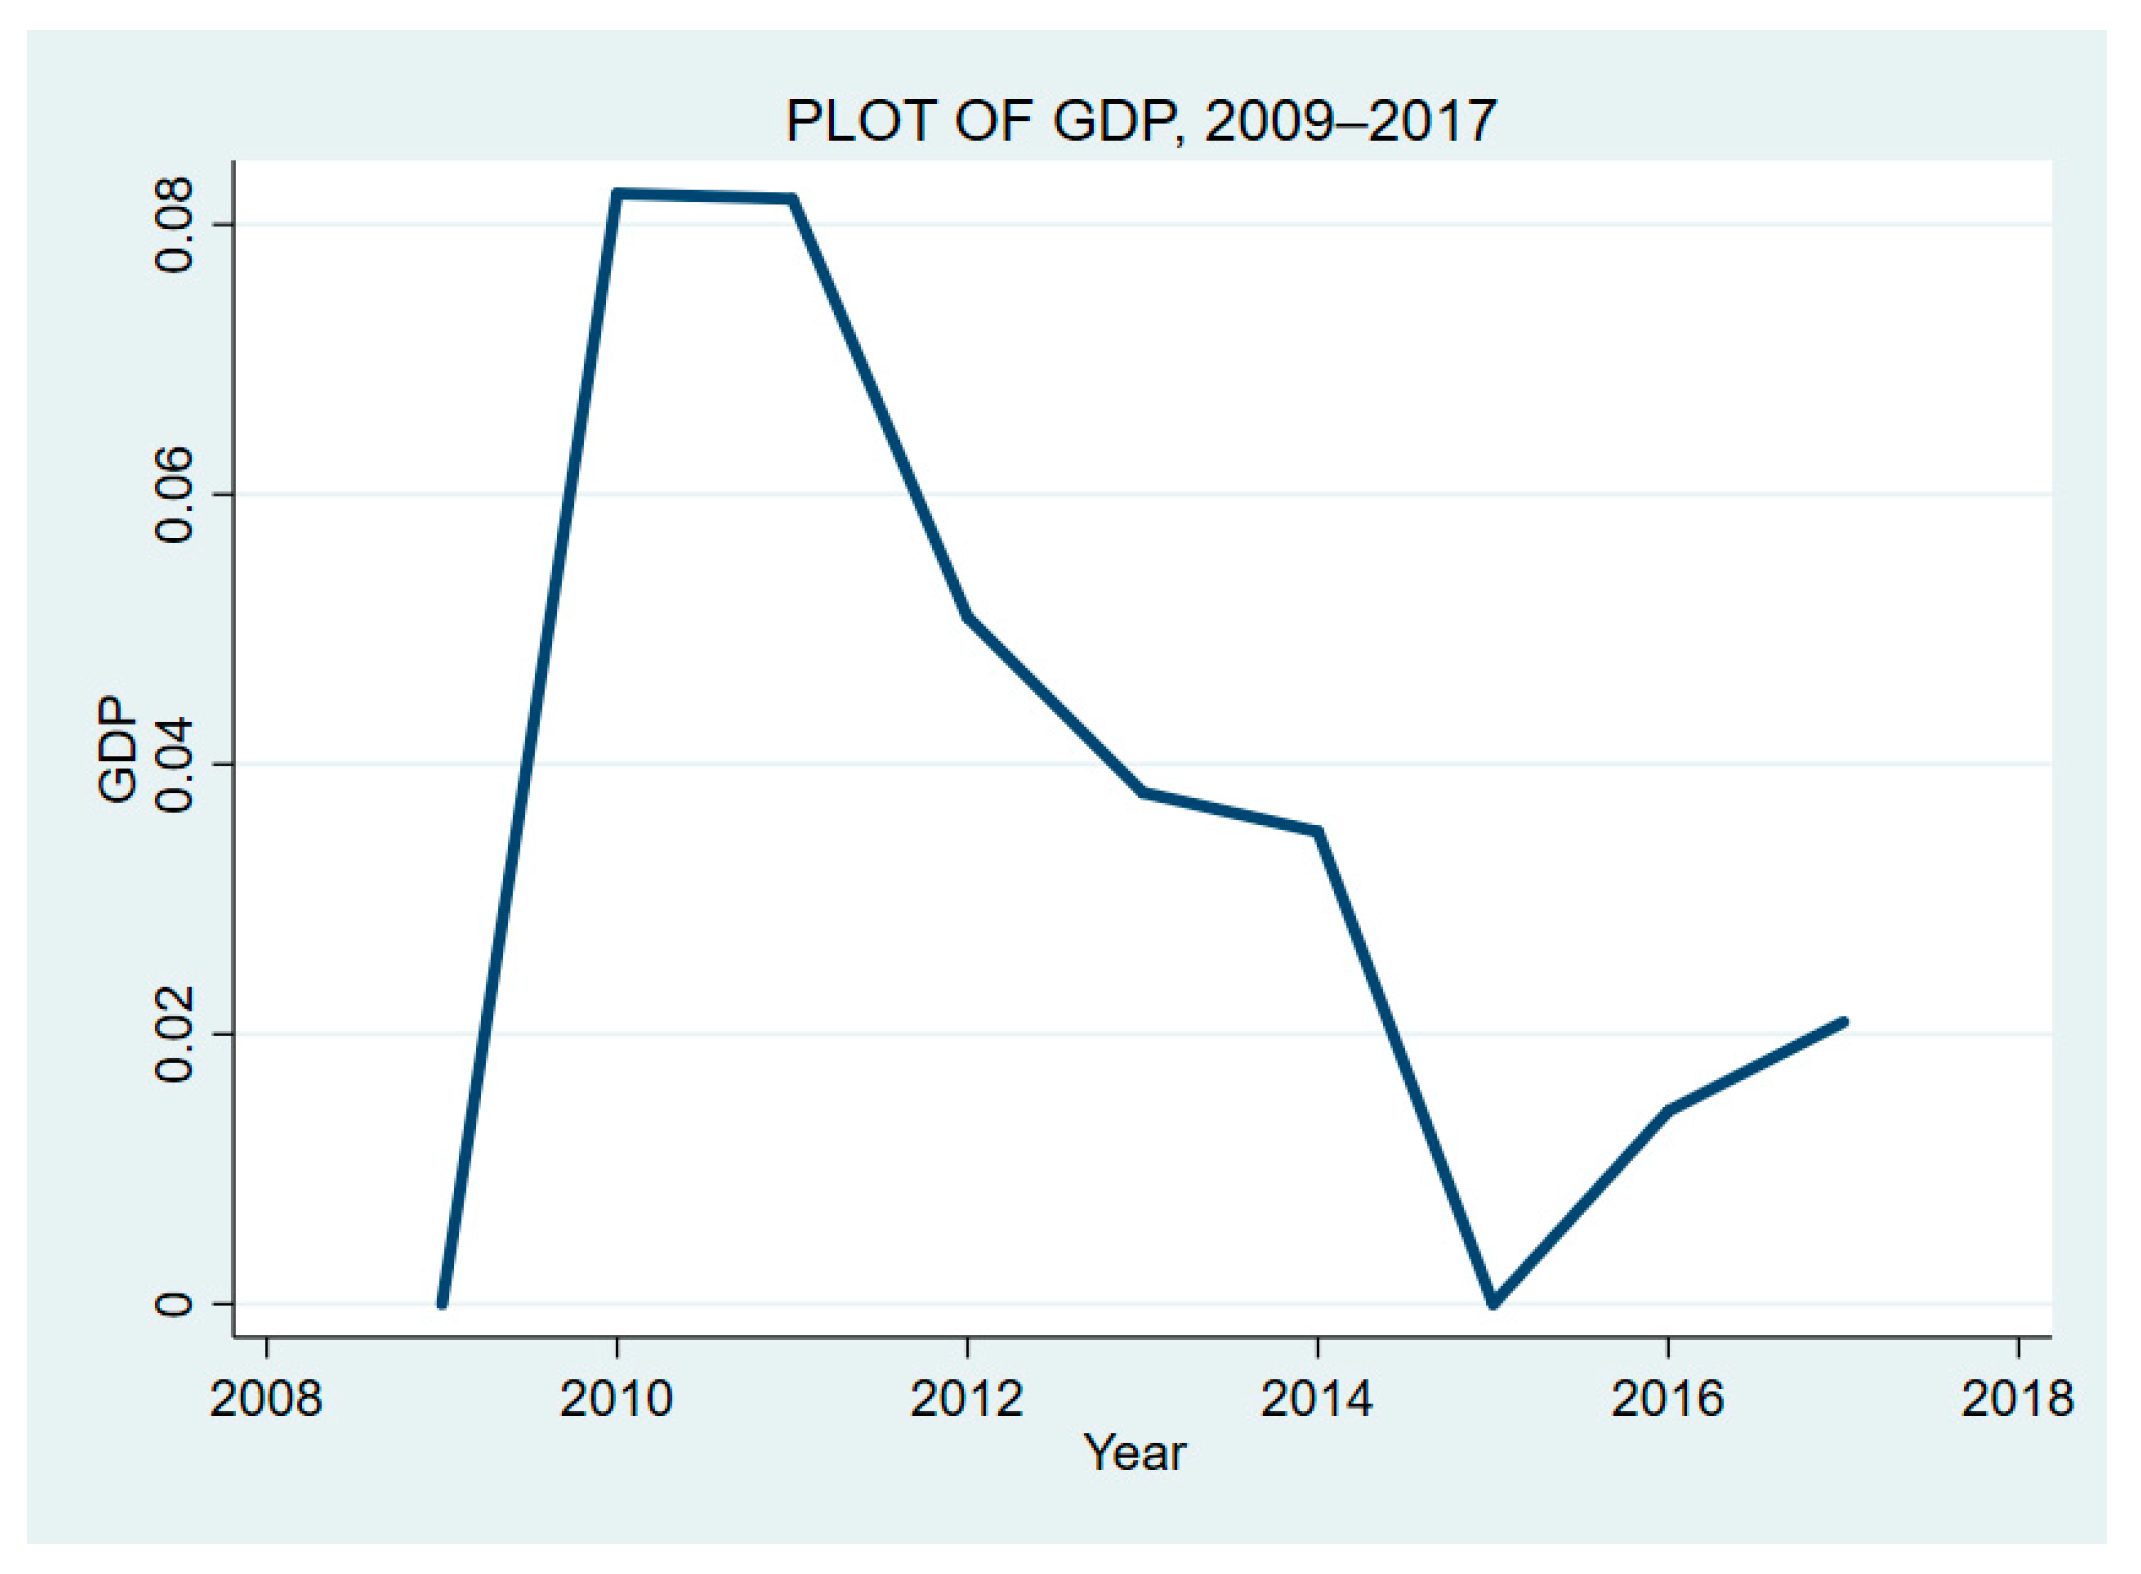
Regarding the year dummies included in the model, the time of the panel data is the period from 2009 to 2017. In this way, year dummies can help to estimate the change in GDP over time. In order to show the change in GDP per year, it is necessary to use the following formula: (eβ − 1) × 100, where (e) is exponent and β equal the coefficients for every year. After calculating the change in GDP for every year, it is possible to graph the change, as shown in Figure 2.
Based on the graph, GDP in the year 2010 is, on average and ceteris paribus, 8.578% higher than in 2009 (post-global financial crisis). Subsequently, from 2010 to 2015 GDP decreased sharply (due to the European Debt crisis and the Japanese earthquake and tsunami in 2011). From 2016 to 2017 it started to gradually rise again.
5. Conclusions
Social tolerance of cultural diversity plays an important role in enhancing creativity, innovation and the level of productivity. As is generally known, cultural diversity occurs as a result of migration among different economies. Furthermore, migration may occur as a result of language proximity between two different economies, or the existence of widely spoken languages (such as English, Chinese or Arabic, etc.). These languages help to ease intercultural communication and decrease the costs of transaction and translation (as in the case of the European Union).
As proved by Aghion and Howitt (1992) and Romer (1990), productivity can be identified with the knowledge that is also brought by skilled and educated migrants. Based on this, cultural diversity can be considered a very important component of total factor productivity, a point which was raised by Solow (1957). Despite this, cultural diversity also has related costs, such as an increase in conflict and predacious behavior, which negatively influence economic growth, as proved by the study of Easterly and Levine (1997). However, recent studies have cast doubt on this and confirmed that having a diverse community does not damage economic performance (Lian and Oneal 1997). Indeed, it is possible to avoid these costs by adopting tolerant policies and democratic institutions, which can help the economy to benefit from cultural diversity (see the study of Collier (2001)).
Based on the results of this study, an economy’s social tolerance of diversity, and the English language, together play an important role in increasing economic growth. Therefore, decision-makers need to develop policies that help to make the population very tolerant of ethnic minorities and migrants. At the same time, it is important to invest in second language education (especially, widely spoken languages). This could help to ease the process of social inclusion and integration within society. Also, this leads to an increase in foreign direct investment and the level of openness in non-English speaking economies. As an observation, this also explains why social tolerance and English language proficiency are high in developed economies such as Sweden, Germany, Finland and Singapore, etc.
Regarding policy implications, government policies should enhance cultural recognition and consider it as the main right of human beings. Furthermore, economic, social and political justice can be established by achieving cultural justice. Therefore, cultural recognition and economic-political equality should be considered within a single framework. Moreover, anti-discriminatory policies should be included in education and in all government programs, especially in developing economies. Language education policies should also be compatible with the country’s economic strategy in order to reach the optimal level of development.
Finally, future studies should take into consideration other economic as well as social factors to explain changes in economic growth. For instance, they should address the question of how tolerance and diversity can influence firm performance, and how corporate governance promotes tolerance and hence innovation. Furthermore, other social factors should be taken into account, such as social capital and trust and their impact on the level of tolerance and economic development.
Author Contributions
Conceptualization, O.A. and P.B.; methodology, O.A. and J.T.; software, O.A. and P.L.; validation, P.B., J.T. and P.L.; formal analysis, O.A.; investigation, J.T.; resources, P.B.; data curation, P.L.; writing—original draft preparation, O.A. and P.B.; writing—review and editing, J.T. and P.B.; visualization, O.A. and P.L.; supervision, P.B.; project administration, O.A.; funding acquisition, P.B. All authors have read and agreed to the published version of the manuscript.
Funding
This publication is supported by the EU-funded Hungarian grant EFOP-3.6.3.-VEKOP-16-2017-00007, for the project entitled “From Talent to Young Researchers”—Supporting the Career-developing Activities of Researchers in Higher Education.
Conflicts of Interest
The authors declare no conflict of interest.
Appendix A

Table A1.
The panel data of this study includes the following (99) countries.
| African Countries | Latin Countries | European Countries | Asian Countries | Middle Eastern Countries | |
|---|---|---|---|---|---|
| Angola | Bolivia | Austria | Romania | Bangladesh | Algeria |
| Botswana | Brazil | Belgium | Russian | Cambodia | Bahrain |
| Burkina Faso | Chile | Bulgaria | Federation | China | Egypt, Arab Rep. |
| Burundi | Colombia | Croatia | Serbia | Hong Kong SAR, China | Iran, Islamic Rep. |
| Cameroon | Costa Rica | Cyprus | Slovenia | India | Iraq |
| Congo, Rep. | Dominican Republic | Czech Republic | Spain | Indonesia | Israel |
| Gabon | Ecuador | Denmark | Sweden | Japan | Jordan |
| The Gambia | El Salvador | Estonia | Switzerland | Kazakhstan | Kuwait |
| Ghana | Guatemala | Finland | Turkey | Korea, Rep. | Morocco |
| Kenya | Honduras | France | Ukraine | Malaysia | Qatar |
| Liberia | Jamaica | Germany | Albania | Mongolia | Saudi Arabia |
| Mauritius | Mexico | Hungary | Armenia | Nepal | United Arab Emirates |
| Nigeria | Nicaragua | Iceland | Pakistan | ||
| Rwanda | Panama | Italy | Philippines | ||
| Sierra Leone | Paraguay | Latvia | Singapore | ||
| South Africa | Peru | Lithuania | Sri Lanka | ||
| Tanzania | Uruguay | Luxembourg | Thailand | ||
| Togo | Moldova | Vietnam | |||
| Tunisia | Norway | ||||
| Uganda | Poland | ||||
| Portugal | |||||
Appendix B
Table A2.
Data sources and variable description.
| Data Source | Variable Name | Definition | Sign |
|---|---|---|---|
| Penn world table (PWT 9.1) | Economic Growth | Output-side real GDP at chained PPP (in million USD in 2011) | (GDP per capita) |
| Employment growth | Calculated using the number of persons engaged in the labor market in a specific time period (instead of population growth) | (n) | |
| Physical investment | Share of gross capital formation at current PPPs | (Sk) | |
| Human capital | Measured by the Human Capital Index, based on years of schooling and returns to education. | (h) | |
| TOEFL iBT Tests (2020) | English Language proficiency of test takers per nation | Estimated by TOEFL score means per country. Scores reflect linguistic skills of test-takers in every country. | (TOEFL score) |
| Legatum Prosperity Index (2019) | Social tolerance of diversity | Indicated by social tolerance: how well society respects and benefits from a diversity of peoples’ religious beliefs, ethnicities, origins and sexualities. Note: tolerance and diversity are usually used interchangeably (Florida 2005). | (Social tolerance) |
| World Bank, World Development Indicators (2020) | Openness | Measured by the sum of exports and imports of goods and services measured as a share of gross domestic product. | (Openness) |
Note: Penn world table (PWT 9.1) reference is (Feenstra et al. 2015).
References
- Acs, Zoltán J. 2002. Innovation and the Growth of Cities. Cheltenham: Edward Elgar. [Google Scholar]
- Acs, Zoltan J., Luc Anselin, and Attila Varga. 2002. Patents and innovation counts as measures of regional production of new knowledge. Research Policy 31: 1069–85. [Google Scholar] [CrossRef]
- Adserà, Alícia, and Mariola Pytliková. 2015. The role of language in shaping international migration. The Economic Journal 125: F49–F81. [Google Scholar] [CrossRef] [PubMed] [Green Version]
- Aghion, Philippe, Eve Caroli, and Cecilia Garcia-Penalosa. 1999. Inequality and economic growth: The perspectives of the new growth theories. Journal of Economic Literature 37: 1615–60. [Google Scholar] [CrossRef]
- Aghion, Philippe, and Peter Howitt. 1992. A model of growth through creative destruction. Econometrica 60: 323. [Google Scholar] [CrossRef]
- Aghion, Philippe, Richard Blundell, Rachel Griffith, Peter Howitt, and Susanne Prantl. 2009. The effects of entry on incumbent innovation and productivity. Review of Economics and Statistics 91: 20–32. [Google Scholar] [CrossRef] [Green Version]
- Alesina, Alberto, and Eliana La Ferrara. 2005. Ethnic Diversity and Economic Performance. Journal of Economic Literature 43: 762–800. [Google Scholar] [CrossRef] [Green Version]
- Alesina, Alberto, Enrico Spolaore, and Romain Wacziarg. 2005. Trade, growth and the size of countries. In Handbook of Economic Growth. Amsterdam: Elsevier, vol. 1, pp. 1499–542. [Google Scholar]
- Alesina, Alberto, Johann Harnoss, and Hillel Rapoport. 2016. Birthplace diversity and economic prosperity. Journal of Economic Growth 21: 101–38. [Google Scholar] [CrossRef] [Green Version]
- Appadurai, Arjun, and Katerina Stenou. 2000. Sustainable pluralism and the future of belonging. In World Culture Report: Cultural Diversity, Conflict and Pluralism. Paris: UNESCO, pp. 111–23. [Google Scholar]
- Arellano, Manuel, and Olympia Bover. 1995. Another look at the instrumental variable estimation of error-components models. Journal of Econometrics 68: 29–51. [Google Scholar] [CrossRef] [Green Version]
- Arellano, Manuel, and Stephen Bond. 1991. Some Tests of Specification for Panel Data: Monte Carlo Evidence and an Application to Employment Equations. The Review of Economic Studies 58: 277. [Google Scholar] [CrossRef] [Green Version]
- Bairoch, Paul. 1988. Cities and Economic Development: From the Dawn of History to the Present. Oxford: Oxford University Press. [Google Scholar]
- Barro, Robert J. 1996. Democracy and Growth. Journal of Economic Growth 1: 1–27. [Google Scholar] [CrossRef]
- Bergh, Andreas, and Martin Karlsson. 2010. Government size and growth: Accounting for economic freedom and globalization. Public Choice 142: 195–213. [Google Scholar] [CrossRef] [Green Version]
- Bleakley, Hoyt, and Aimee Chin. 2004. Language Skills and Earnings: Evidence from Childhood Immigrants. Review of Economics and Statistics 84: 481–96. [Google Scholar] [CrossRef]
- Blundell, Richard, and Stephen Bond. 1998. Initial conditions and moment restrictions in dynamic panel data models. Journal of Econometrics 87: 115–43. [Google Scholar] [CrossRef] [Green Version]
- Borjas, George. 1994. The Economics of Immigration. Journal of Economic Literature, American Economic Association 32: 1667–717. [Google Scholar]
- Boschma, Ron A., and Michael Fritsch. 2007. Creative Class and Regional Growth—Empirical Evidence from Eight European Countries. SSRN Electronic Journal. [Google Scholar] [CrossRef] [Green Version]
- Bouncken, Ricarda B. 2004. Cultural Diversity in Entrepreneurial Teams: Findings of New Ventures in Germany. Creativity and Innovation Management 13: 240–53. [Google Scholar] [CrossRef]
- Brewer, Marilynn B., and Kathleen P. Pierce. 2005. Social identity complexity and outgroup tolerance. Personality and Social Psychology Bulletin 31: 428–37. [Google Scholar] [CrossRef] [PubMed] [Green Version]
- Buchanan, James M., and Gordon Tullock. 1962. The Calculus of Consent: Logical Foundations of Constitutional Democracy. Ann Arbor: University of Michigan Press. [Google Scholar]
- Buchanan, James M., and Roger D. Congleton. 1997. Politics by Principle, Not Interest: Toward Nondiscriminatory Democracy. Cambridge: Cambridge University Press. [Google Scholar]
- Chen, Xinxiang. 2011. Tolerance and Economic Performance in American Metropolitan Areas: An Empirical Investigation. Sociological Forum 26: 71–97. [Google Scholar] [CrossRef]
- Cheng, Shaoming, and Huaqun Li. 2012. New firm formation facing cultural and racial diversity. Papers in Regional Science 91: 759–74. [Google Scholar] [CrossRef]
- Chiswick, Barry R. 2008. The Economics of Language: An Introduction and Overview. IZA Discussion Papers 3568. Bonn: Institute of Labor Economics (IZA), Available online: https://papers.ssrn.com/sol3/papers.cfm?abstract_id=1155862 (accessed on 4 February 2021).
- Chiswick, Barry R., and Paul W. Miller. 2007. The Economics of the Language: International Analyses. New York: Routledge. [Google Scholar]
- Collier, Paul. 2001. Implications of ethnic diversity, Economic Policy. A European Forum 1: 127–55. [Google Scholar]
- Council of Europe. 2009. Intercultural Cities: Towards a Model for Intercultural Integration. Available online: https://rm.coe.int/16802ff5ef (accessed on 18 October 2020).
- Dixon, L. Quentin. 2005. Bilingual Education Policy in Singapore. International Journal of Bilingual Education and Bilingualism 8: 25–47. [Google Scholar] [CrossRef]
- Easterly, William, and Ross Levine. 1997. Africa’s Growth Tragedy: Policies and Ethnic Divisions. The Quarterly Journal of Economics 112: 1203–50. [Google Scholar] [CrossRef] [Green Version]
- Education First EPI. 2013. EF English Proficiency Index. Education First. Available online: https://www.ef.com/assetscdn/WIBIwq6RdJvcD9bc8RMd/legacy/__/~/media/centralefcom/epi/downloads/full-reports/v3/ef-epi-2013-report-en.pdf (accessed on 4 January 2021).
- Education First. 2017. EF EPI 2017 RANKINGS. Available online: https://www.ef.com/assetscdn/WIBIwq6RdJvcD9bc8RMd/legacy/__/~/media/centralefcom/epi/downloads/full-reports/v7/ef-epi-2017-english.pdf (accessed on 20 October 2020).
- European Commission. 2020. Migrant Integration Information and Good Practices. Available online: https://ec.europa.eu/migrant-integration/home (accessed on 20 October 2020).
- Fassio, Claudio, Fabio Montobbio, and Alessandra Venturini. 2019. Skilled migration and innovation in European industries. Research Policy 48: 706–18. [Google Scholar] [CrossRef]
- Feenstra, Robert C., Robert Inklaar, and Marcel P. Timmer. 2015. The Next Generation of the Penn World Table. American Economic Review 105: 3150–82. [Google Scholar] [CrossRef] [Green Version]
- Florida, Richard, Charlotta Mellander, and Kevin Stolarick. 2008. Inside the black box of regional development: Human capital, the creative class and tolerance. Journal of Economic Geography 8: 615–49. [Google Scholar] [CrossRef] [Green Version]
- Florida, Richard, and Gary Gates. 2001. Technology and Tolerance: The Importance of Diversity to High-Technology Growth. In Center for Urban and Metropolitan Polity. Survey Series; Washington, DC: Brookings Institution. [Google Scholar]
- Florida, Richard. 2002a. Bohemia and economic geography. Journal of Economic Geography 2: 55–71. [Google Scholar] [CrossRef]
- Florida, Richard. 2002b. The Rise of the Creative Class. New York: Basic Books. [Google Scholar]
- Florida, Richard. 2003. Cities and the creative class. City and Community 2: 3–19. [Google Scholar] [CrossRef]
- Florida, Richard. 2005. Cities and the Creative Class. New York: Routledge. [Google Scholar]
- Freel, Mark S., and Paul J. A. Robson. 2004. Small Firm Innovation, Growth and Performance: Evidence from Scotland and Northern England. International Small Business Journal: Researching Entrepreneurship 22: 561–75. [Google Scholar] [CrossRef]
- Fritsch, Michael. 2008. How does new business formation affect regional development? Introduction to the special issue. Small Business Economics 30: 1–14. [Google Scholar] [CrossRef] [Green Version]
- Ginsburgh, Victor, and Shlomo Weber. 2011. How Many Languages Do We Need? The Economics of Linguistic Diversity. Princeton: Princeton University Press. [Google Scholar]
- Ginsburgh, Victor, Ignacio Ortuño-Ortín, and Shlomo Weber. 2007. Learning Foreign Languages: Theoretical and Empirical Implications of the Selten and Pool Model. Journal of Economic Behavior and Organization 64: 337–47. [Google Scholar] [CrossRef] [Green Version]
- Grell, O. P., and R. Porter, eds. 2000. Toleration in Enlightenment Europe. Cambridge: Cambridge University Press. [Google Scholar]
- Honna, Nobuyuki. 2000. Some remarks on the multiculturalism of Asian Englishes. Intercultural Communication Studies 10: 9–16. [Google Scholar]
- Hoogendoorn, Sander, and Mirjam van Praag. 2012. Ethnic Diversity and Team Performance: A Field Experiment. Tinbergen Institute Discussion Paper 12-068/3. Available online: https://papers.ssrn.com/sol3/papers.cfm?abstract_id=2105284 (accessed on 4 February 2021).
- Horwitz, Sujin K., and Irwin B. Horwitz. 2007. The Effects of Team Diversity on Team Outcomes: A Meta-Analytic Review of Team Demography. Journal of Management 33: 987–1015. [Google Scholar] [CrossRef]
- Hutchinson, William K. 2002. Does Ease of Communication Increase Trade? Commonality of Language and Bilateral Trade. Scottish Journal of Political Economy 49: 544–56. [Google Scholar] [CrossRef]
- Inglehart, Ronald, and Christian Welzel. 2005. Modernization, Cultural Change and Democracy. New York: Cambridge University Press. [Google Scholar]
- Inglehart, Ronald, and Pippa Norris. 2003. Rising Tide. New York: Cambridge University Press. [Google Scholar]
- Jovanovic, Boyan, and Rafael Rob. 1987. Demand-Driven Innovation and Spatial Competition over Time. The Review of Economic Studies 54: 63. [Google Scholar] [CrossRef]
- Kim, Moonhawk, Amy H. Liu, Kim-Lee Tuxhorn, David S. Brown, and David Leblang. 2015. Lingua Mercatoria: Language and Foreign Direct Investment. International Studies Quarterly 59: 330–43. [Google Scholar] [CrossRef] [Green Version]
- Knack, Stephen, and Philip Keefer. 1995. Institutions and economic performance: Cross-country tests using alternative institutional measures. Economics and Politics 7: 207–27. [Google Scholar] [CrossRef]
- Ku, Hyejin, and Asaf Zussman. 2010. Lingua Franca: The Role of English in International Trade. Journal of Economic Behavior & Organization 75: 250–60. [Google Scholar]
- Kwok, Kian-Woon. 1999. The Social Architect: Goh Keng Swee. In Lee’s Lieutenants. Edited by Peng Er Lam and Kevin Y. L. Tan. St. Lenoards: Allen and Unwin, pp. 45–69. [Google Scholar]
- Lauring, Jakob. 2009. Managing cultural diversity and the process of knowledge sharing: A case from Denmark. Scandinavian Journal of Management 25: 385–94. [Google Scholar] [CrossRef]
- Lazear, Edward P. 1999. Culture and Language. Journal of Political Economy 107: S95–S126. [Google Scholar] [CrossRef]
- Lee, Chew Ging. 2011. English Language and Economic Growth: Cross-Country Empirical Evidence. Journal of Economic and Social Studies 1: 5–20. [Google Scholar] [CrossRef] [Green Version]
- Lee, Sam Youl, Richard Florida, and Zoltan Acs. 2004. Creativity and entrepreneurship: A regional analysis of new firm formation. Regional Studies 38: 879–91. [Google Scholar] [CrossRef] [Green Version]
- Legatum Institute. 2018. 2018 Legatum Prosperity Index. Available online: https://li.com/reports/2018-legatum-prosperity-index/ (accessed on 20 October 2020).
- Legatum Prosperity Index. 2019. Social Tolerance Indicator Annual Reports from 2009 to 2017. Available online: https://www.prosperity.com/ (accessed on 29 July 2020).
- Levinsohn, James. 2007. Globalization and the returns to speaking English in South Africa. In Globalization and Poverty. Edited by Ann Harrison. Chicago: University of Chicago Press, pp. 629–46. [Google Scholar]
- Lewis, Paul M., Gary F. Simons, and Charles D. Fenning. 2014. Ethnologue: Languages of the World, 17th ed. Dallas: SIL International. [Google Scholar]
- Lian, Brad, and John R. Oneal. 1997. Cultural Diversity and Economic Development: A Cross-National Study of 98 Countries, 1960–1985. Economic Development and Cultural Change 46: 61–77. [Google Scholar] [CrossRef]
- Lin, C. 2019. Understanding Cultural Diversity and Diverse Identities. In Quality Education. Encyclopedia of the UN Sustainable Development Goals. Edited by Leal Filho Walter, Azul Anabela Marisa, Brandli Luciana Londero, Özuyar Pinar Gökçin and Wall Tony. Cham: Springer. [Google Scholar]
- Liu, Amy H., and Elise Pizzi. 2018. The Language of Economic Growth: A New Measure of Linguistic Heterogeneity. British Journal of Political Science 48: 953–80. [Google Scholar] [CrossRef]
- Liu, Amy H. 2015. Standardizing Diversity. Philadelphia: University of Pennsylvania Press. [Google Scholar]
- Lopes, Miguel Pereira, Patricia Jardim da Palma, and Miguel Pina e Cunha. 2011. Tolerance is not enough: The moderating role of optimism on perceptions of regional economic performance. Social Indicators Research 102: 333–50. [Google Scholar] [CrossRef] [Green Version]
- Mankiw, N. Gregory, David Romer, and David N. Weil. 1992. A Contribution to the Empirics of Economic Growth. The Quarterly Journal of Economics 107: 407–37. [Google Scholar] [CrossRef]
- Marschak, Jacob. 1965. Economics of Language. Behavioral Science 10: 135–40. [Google Scholar] [CrossRef] [PubMed]
- McCormick, Christopher. 2013. Countries with Better English Have Better Economies. Harvard Business Review. Available online: https://hbr.org/2013/11/countries-with-better-english-have-better-economies (accessed on 4 January 2021).
- Melitz, Jacques. 2008. Language and Foreign Trade. European Economic Review 52: 667–99. [Google Scholar] [CrossRef] [Green Version]
- Mokyr, Joel. 1990. The Lever of Riches: Technological Creativity and Economic Progress. Oxford: Oxford University Press. [Google Scholar]
- Ottaviano, Gianmarco I. P., and Giovanni Peri. 2005. Cities and cultures. Journal of Urban Economics 58: 304–37. [Google Scholar] [CrossRef]
- Ottaviano, Gianmarco I. P., and Giovanni Peri. 2006. The economic value of cultural diversity: Evidence from US cities. Journal of Economic Geography 6: 9–44. [Google Scholar] [CrossRef] [Green Version]
- Byrne, Peter. 2011. Religious Tolerance, Diversity, and Pluralism. Royal Institute of Philosophy Supplements 68: 287–309. [Google Scholar] [CrossRef]
- Pool, Jonathan. 1996. Optimal language regimes for the European Union. International Journal of the Sociology of Language 121: 159–79. [Google Scholar] [CrossRef]
- Popescu, Cristina R. G., and Gheorghe N. Popescu. 2019. An Exploratory Study Based on a Questionnaire Concerning Green and Sustainable Finance, Corporate Social Responsibility, and Performance: Evidence from the Romanian Business Environment. Journal of Risk and Financial Management 12: 162. [Google Scholar] [CrossRef] [Green Version]
- Prat, Andrea. 2002. Should a team be homogeneous? European Economic Review 46: 1187–207. [Google Scholar] [CrossRef]
- Qian, Haifeng. 2013. Diversity Versus Tolerance: The Social Drivers of Innovation and Entrepreneurship in US Cities. Urban Studies 50: 2718–35. [Google Scholar] [CrossRef]
- Rivera-Batiz, Luis A., and Paul M. Romer. 1991. International trade with endogenous technological change. European Economic Review 35: 971–1001. [Google Scholar] [CrossRef] [Green Version]
- Romer, Paul Michael. 1990. Endogenous Technological Change. Journal of Political Economy 98, Pt 2: S71–S102. [Google Scholar] [CrossRef] [Green Version]
- Roodman, David. 2009. A Note on the Theme of Too Many Instruments. Oxford Bulletin of Economics and Statistics 71: 135–58. [Google Scholar] [CrossRef]
- Safran, William, and Amy H. Liu. 2012. Nation-Building, Collective Identity, and Language Choices. Nationalism and Ethnic Politics 18: 269–92. [Google Scholar] [CrossRef]
- Sassen, Saskia. 1994. Cities in a World Economy. Thousand Oaks: Pine Forge Press. [Google Scholar]
- Schaeffer, Merlin. 2013. Can competing diversity indices inform us about why ethnic diversity erodes social cohesion? A test of five diversity indices in Germany. Social Science Research 42: 755–74. [Google Scholar] [CrossRef] [PubMed] [Green Version]
- Schmookler, Jacob. 1966. Invention and Economic Growth. Cambridge: Harvard University Press. [Google Scholar]
- Seargeant, Philip, and Elizabeth J. Erling. 2011. The discourse of ‘English as a language for international development’: Policy assumptions and practical challenges. In Dreams and Realities: Developing Countries and the English Language. Edited by Hywel Coleman. London: British Council, pp. 248–67. ISBN 978-086355-659-3. [Google Scholar]
- Snowdon, Brian, and Howard R. Vane. 2005. Modern Macroeconomics: Its Origins, Development and Current State. Cheltenham and Northhampton: E. Elgar. [Google Scholar]
- Solow, Robert Merton. 1956. A Contribution to the Theory of Economic Growth. The Quarterly Journal of Economics 70: 65. [Google Scholar] [CrossRef]
- Solow, Robert Merton. 1957. Technical Change and the Aggregate Production Function. The Review of Economics and Statistics 39: 312. [Google Scholar] [CrossRef] [Green Version]
- Suárez, Sandra L. 2005. Does English Rule? Language Instruction and Economic Strategies in Singapore, Ireland, and Puerto Rico. Comparative Politics 37: 459. [Google Scholar] [CrossRef]
- Tan, Siok Sun. 2007. Goh Keng Swee. Singapore: Editions Didier Millet. [Google Scholar]
- Temple, Jonathan. 1999. The new growth evidence. Journal of Economic Literature 37: 112–56. [Google Scholar] [CrossRef] [Green Version]
- TOEFL iBT Tests. 2020. TOEFL Test and Score Data Summary 2009 to 2017 Editions. Toefl Score Means Per Country. Available online: https://www.ets.org/toefl (accessed on 20 October 2020).
- Triandafyllidou, Anna, and Ulasiuk Iryna. 2013. Cultural Diversity: Advantage or Liability? Global Governance Programme, Policy Briefs, Cultural Pluralism. Firenze: Cadmus, European University Institute Research Repository. [Google Scholar]
- UNESCO. 2020. Sweden 2016 Report. Overview of Cultural Policy Context. Available online: https://en.unesco.org/creativity/governance/periodic-reports/2016/sweden#:~:text=Sweden's%20cultural%20policy%20objectives%2C%20which,steer%20central%20government%20cultural%20policy.&text=Everyone%20is%20to%20have%20the,integral%20parts%20of%20society's%20development (accessed on 18 October 2020).
- United Nations. 2012. GNI Per Capita in PPP Terms (Constant 2011 PPP$). Available online: http://hdr.undp.org/en/content/gni-capita-ppp-terms-constant-2011-ppp (accessed on 4 February 2021).
- Verkuyten, Maykel, Kumar Yogeeswaran, and Levi Adelman. 2019. Intergroup Toleration and Its Implications for Culturally Diverse Societies. Social Issues and Policy Review 13: 5–35. [Google Scholar] [CrossRef] [PubMed] [Green Version]
- World Bank, World Development Indicators. 2020. Openness Indicator: 2009–2017. Available online: https://data.worldbank.org/indicator/NE.TRD.GNFS.ZS (accessed on 29 July 2020).
- Yong, Enn Lun. 2019. Understanding cultural diversity and economic prosperity in Europe: A literature review and proposal of a culture–economy framework. Asian Journal of German and European Studies 4: 1–34. [Google Scholar] [CrossRef] [Green Version]
- Zak, Paul J., and Stephen Knack. 2001. Trust and Growth. Economic Journal, Royal Economic Society 111: 295–321. [Google Scholar] [CrossRef]
- Zaripov, Ayrat R., Aida G. Sadykova, Luiza R. Zakirova, and Alla P. Minjar Belorucheva. 2017. Tolerance formation in the process of teaching foreign languages. Revista QUID 1 (Special Issue), 812–17. Available online: https://revistas.proeditio.com/iush/quid/article/view/1869 (accessed on 4 February 2021).
Figure 1.
English proficiency index and gross national income per capita. Source: United Nations (2012) (GNI Per capita 2012, Education First EPI 2013).
Figure 1.
English proficiency index and gross national income per capita. Source: United Nations (2012) (GNI Per capita 2012, Education First EPI 2013).

Figure 2.
Plotting year dummies, Source: Authors’ own calculations.

Table 1.
Two-step System GMM Results (Dependent variable: ).
| Variables | Coef. | Corrected Std. Err. |
|---|---|---|
| ln(GDP per capita)it−1 | 0.698 **** | (0.140) |
| ln (n+g+δ)it | −0.223 | (0.432) |
| ln (sk)it | 0.129 * | (0.071) |
| ln(h)it | 0.845 ** | (0.421) |
| ln (TOEFL score)it | 0.123 | (0.184) |
| ln (Social tolerance)it | 0.018 | (0.025) |
| ln (Openness)it | 0.003 | (0.027) |
| Year Dummies | Yes | |
| No. of observations | 693 | |
| F statistic | 58,876.35 | |
| Groups/Instruments | 99/21 | |
| AR (2) | 0.052 | |
| Hansen Statistics | 0.320 |
Notes: ****, **, * are statistically significant at 0.1%, 1%, 5% and 10% levels respectively; t-statistics (in parentheses) are based on white heteroscedasticity-consistent std. errors; p-values reported for AR (2) and Hansen statistic. Source: Authors’ own calculations.
Table 2.
Long Run GMM Coefficients.
| Variables | Coefficients | Std. Err. |
|---|---|---|
| ln (sk)it | 0.426 *** | (0.148) |
| ln(h)it | 2.795 **** | (0.270) |
Notes: ****, ***, are statistically significant at the 0.1%, 1%, 5% and 10% levels respectively; z-statistics (in parentheses) are based on white heteroscedasticity-consistent std. errors. Source: Authors’ own calculations.
Publisher’s Note: MDPI stays neutral with regard to jurisdictional claims in published maps and institutional affiliations. |
© 2021 by the authors. Licensee MDPI, Basel, Switzerland. This article is an open access article distributed under the terms and conditions of the Creative Commons Attribution (CC BY) license (http://creativecommons.org/licenses/by/4.0/).
Share and Cite
MDPI and ACS Style
Alhendi, O.; Tóth, J.; Lengyel, P.; Balogh, P. Tolerance, Cultural Diversity and Economic Growth: Evidence from Dynamic Panel Data Analysis. Economies 2021, 9, 20. https://0-doi-org.brum.beds.ac.uk/10.3390/economies9010020
AMA Style
Alhendi O, Tóth J, Lengyel P, Balogh P. Tolerance, Cultural Diversity and Economic Growth: Evidence from Dynamic Panel Data Analysis. Economies. 2021; 9(1):20. https://0-doi-org.brum.beds.ac.uk/10.3390/economies9010020
Chicago/Turabian StyleAlhendi, Osama, József Tóth, Péter Lengyel, and Péter Balogh. 2021. "Tolerance, Cultural Diversity and Economic Growth: Evidence from Dynamic Panel Data Analysis" Economies 9, no. 1: 20. https://0-doi-org.brum.beds.ac.uk/10.3390/economies9010020
Note that from the first issue of 2016, this journal uses article numbers instead of page numbers. See further details here.