
From a Recession to the COVID-19 Pandemic: Inflation–Unemployment Comparison between the UK and India


Abstract
:1. Introduction
2. Literature Review
2.1. Theoretical Foundation
2.2. Empirical Results of Studies from India and the UK
2.3. The New Policy Initiatives and Indian Economy
2.4. Brexit and the UK Economy
2.5. India and the UK in the Wake of COVID-19
3. Materials and Methods
3.1. Data Description
3.2. Methods
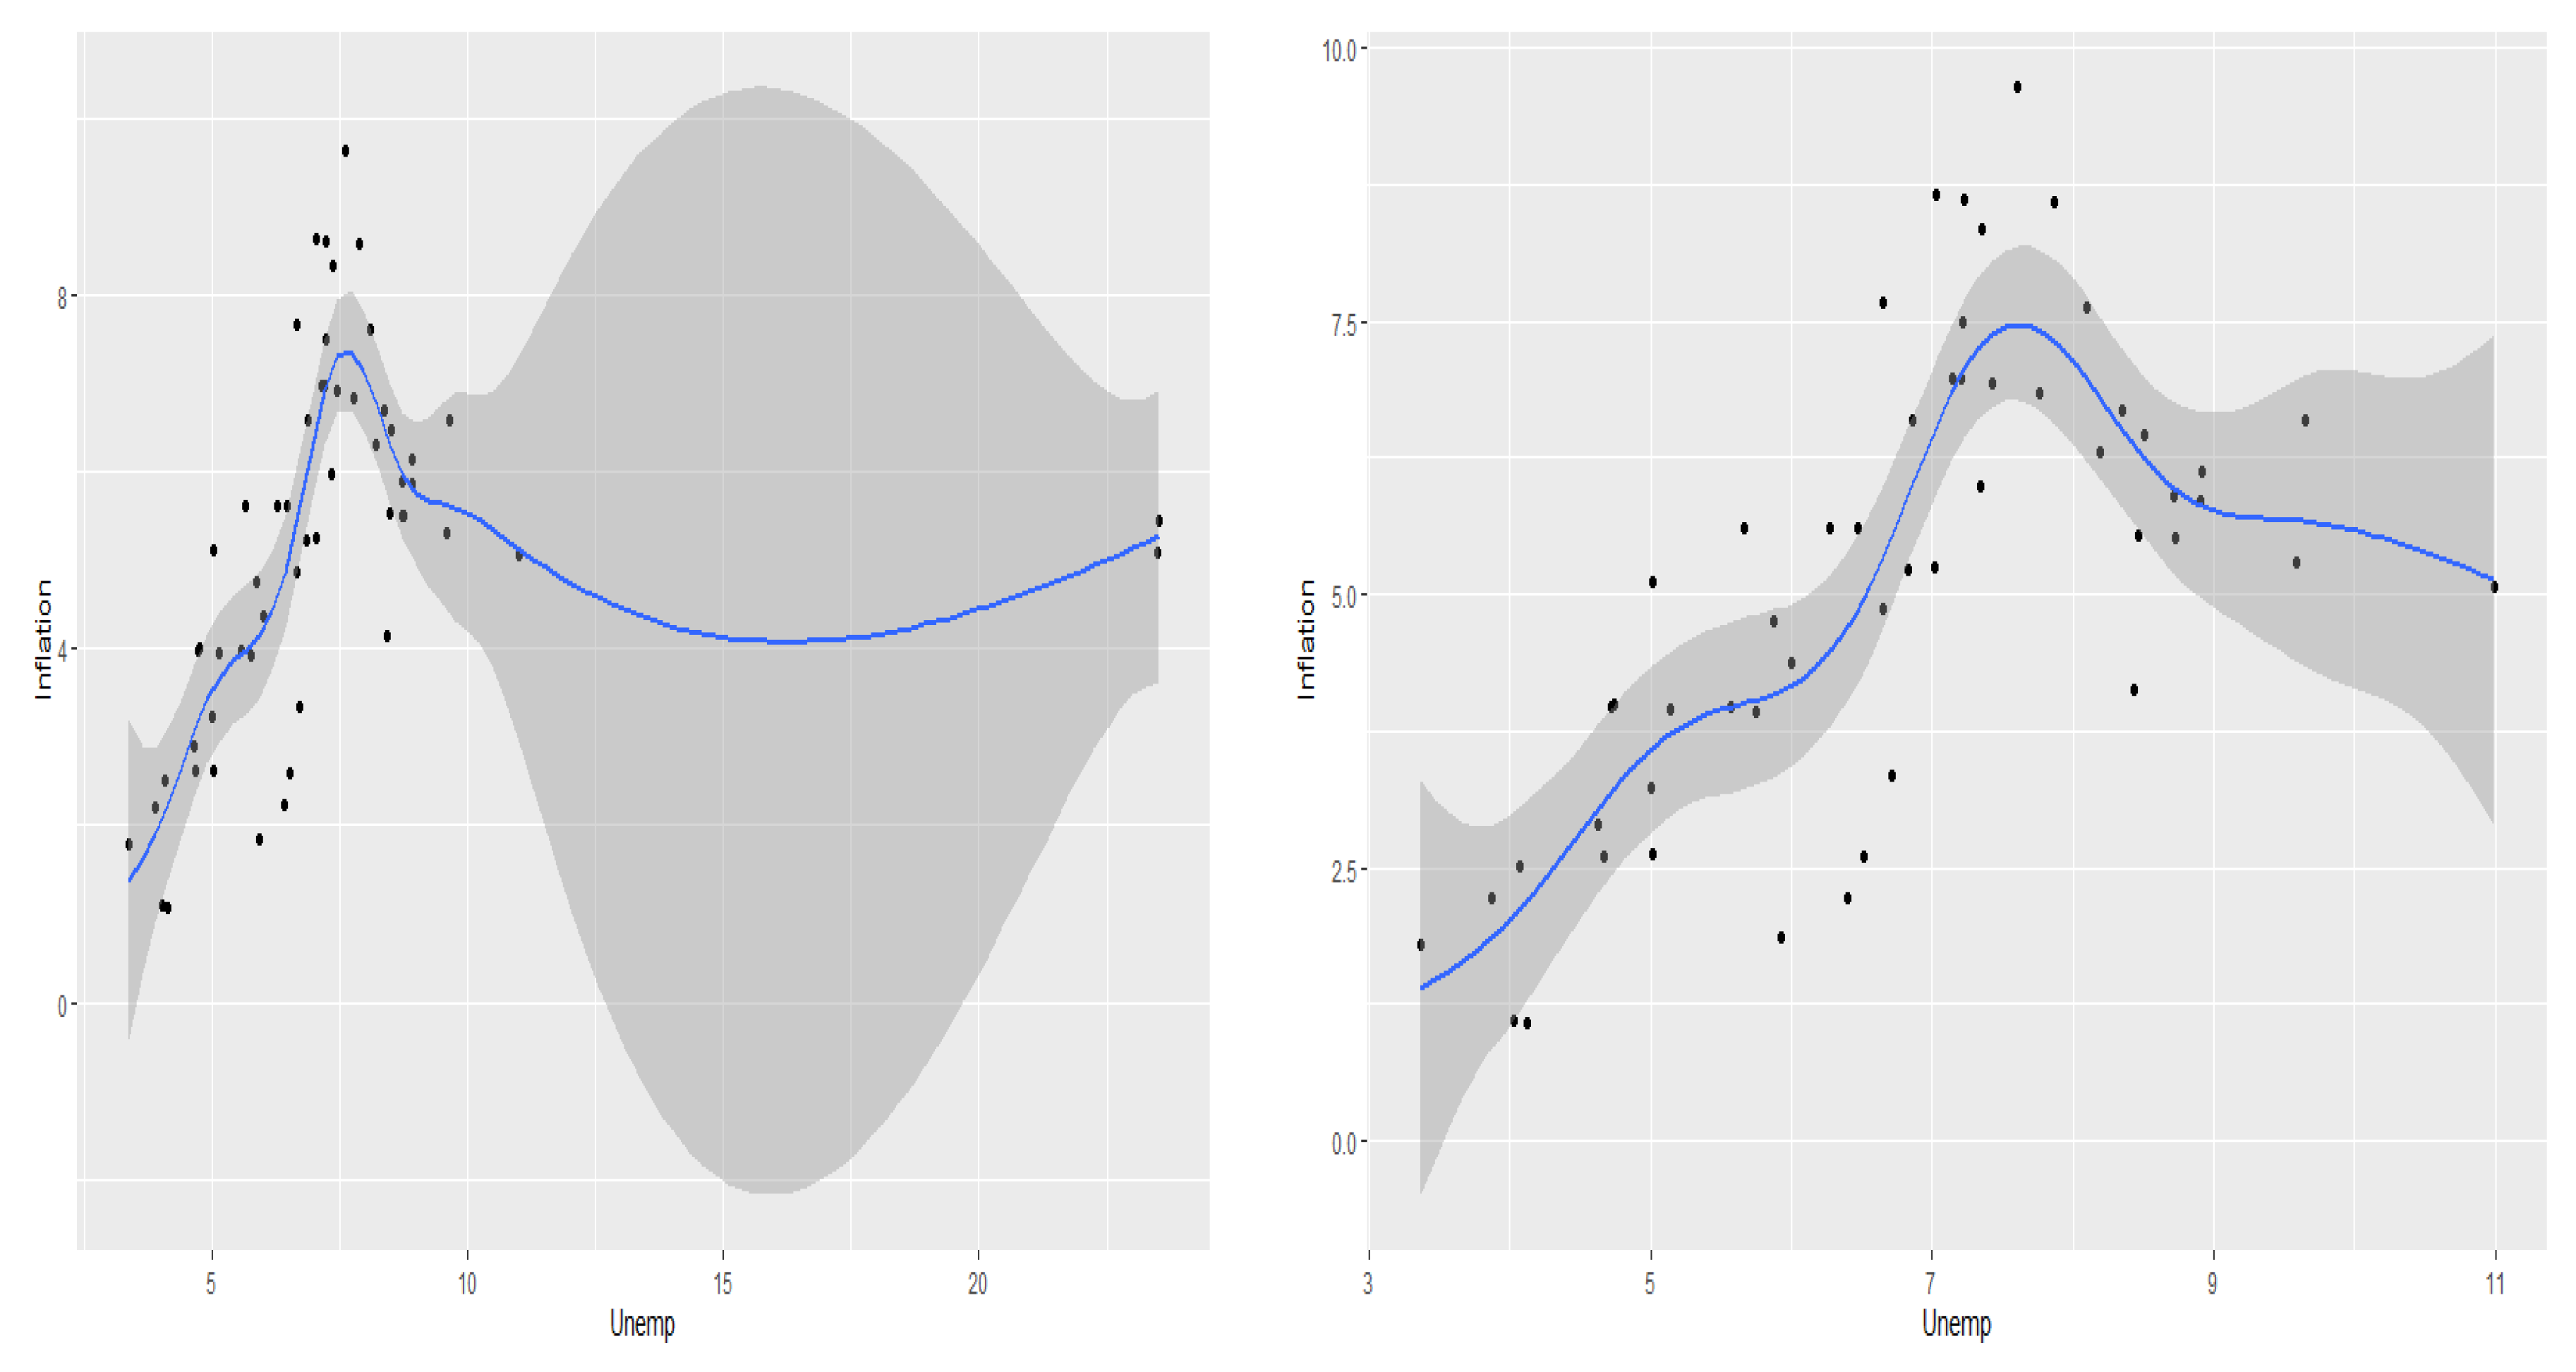
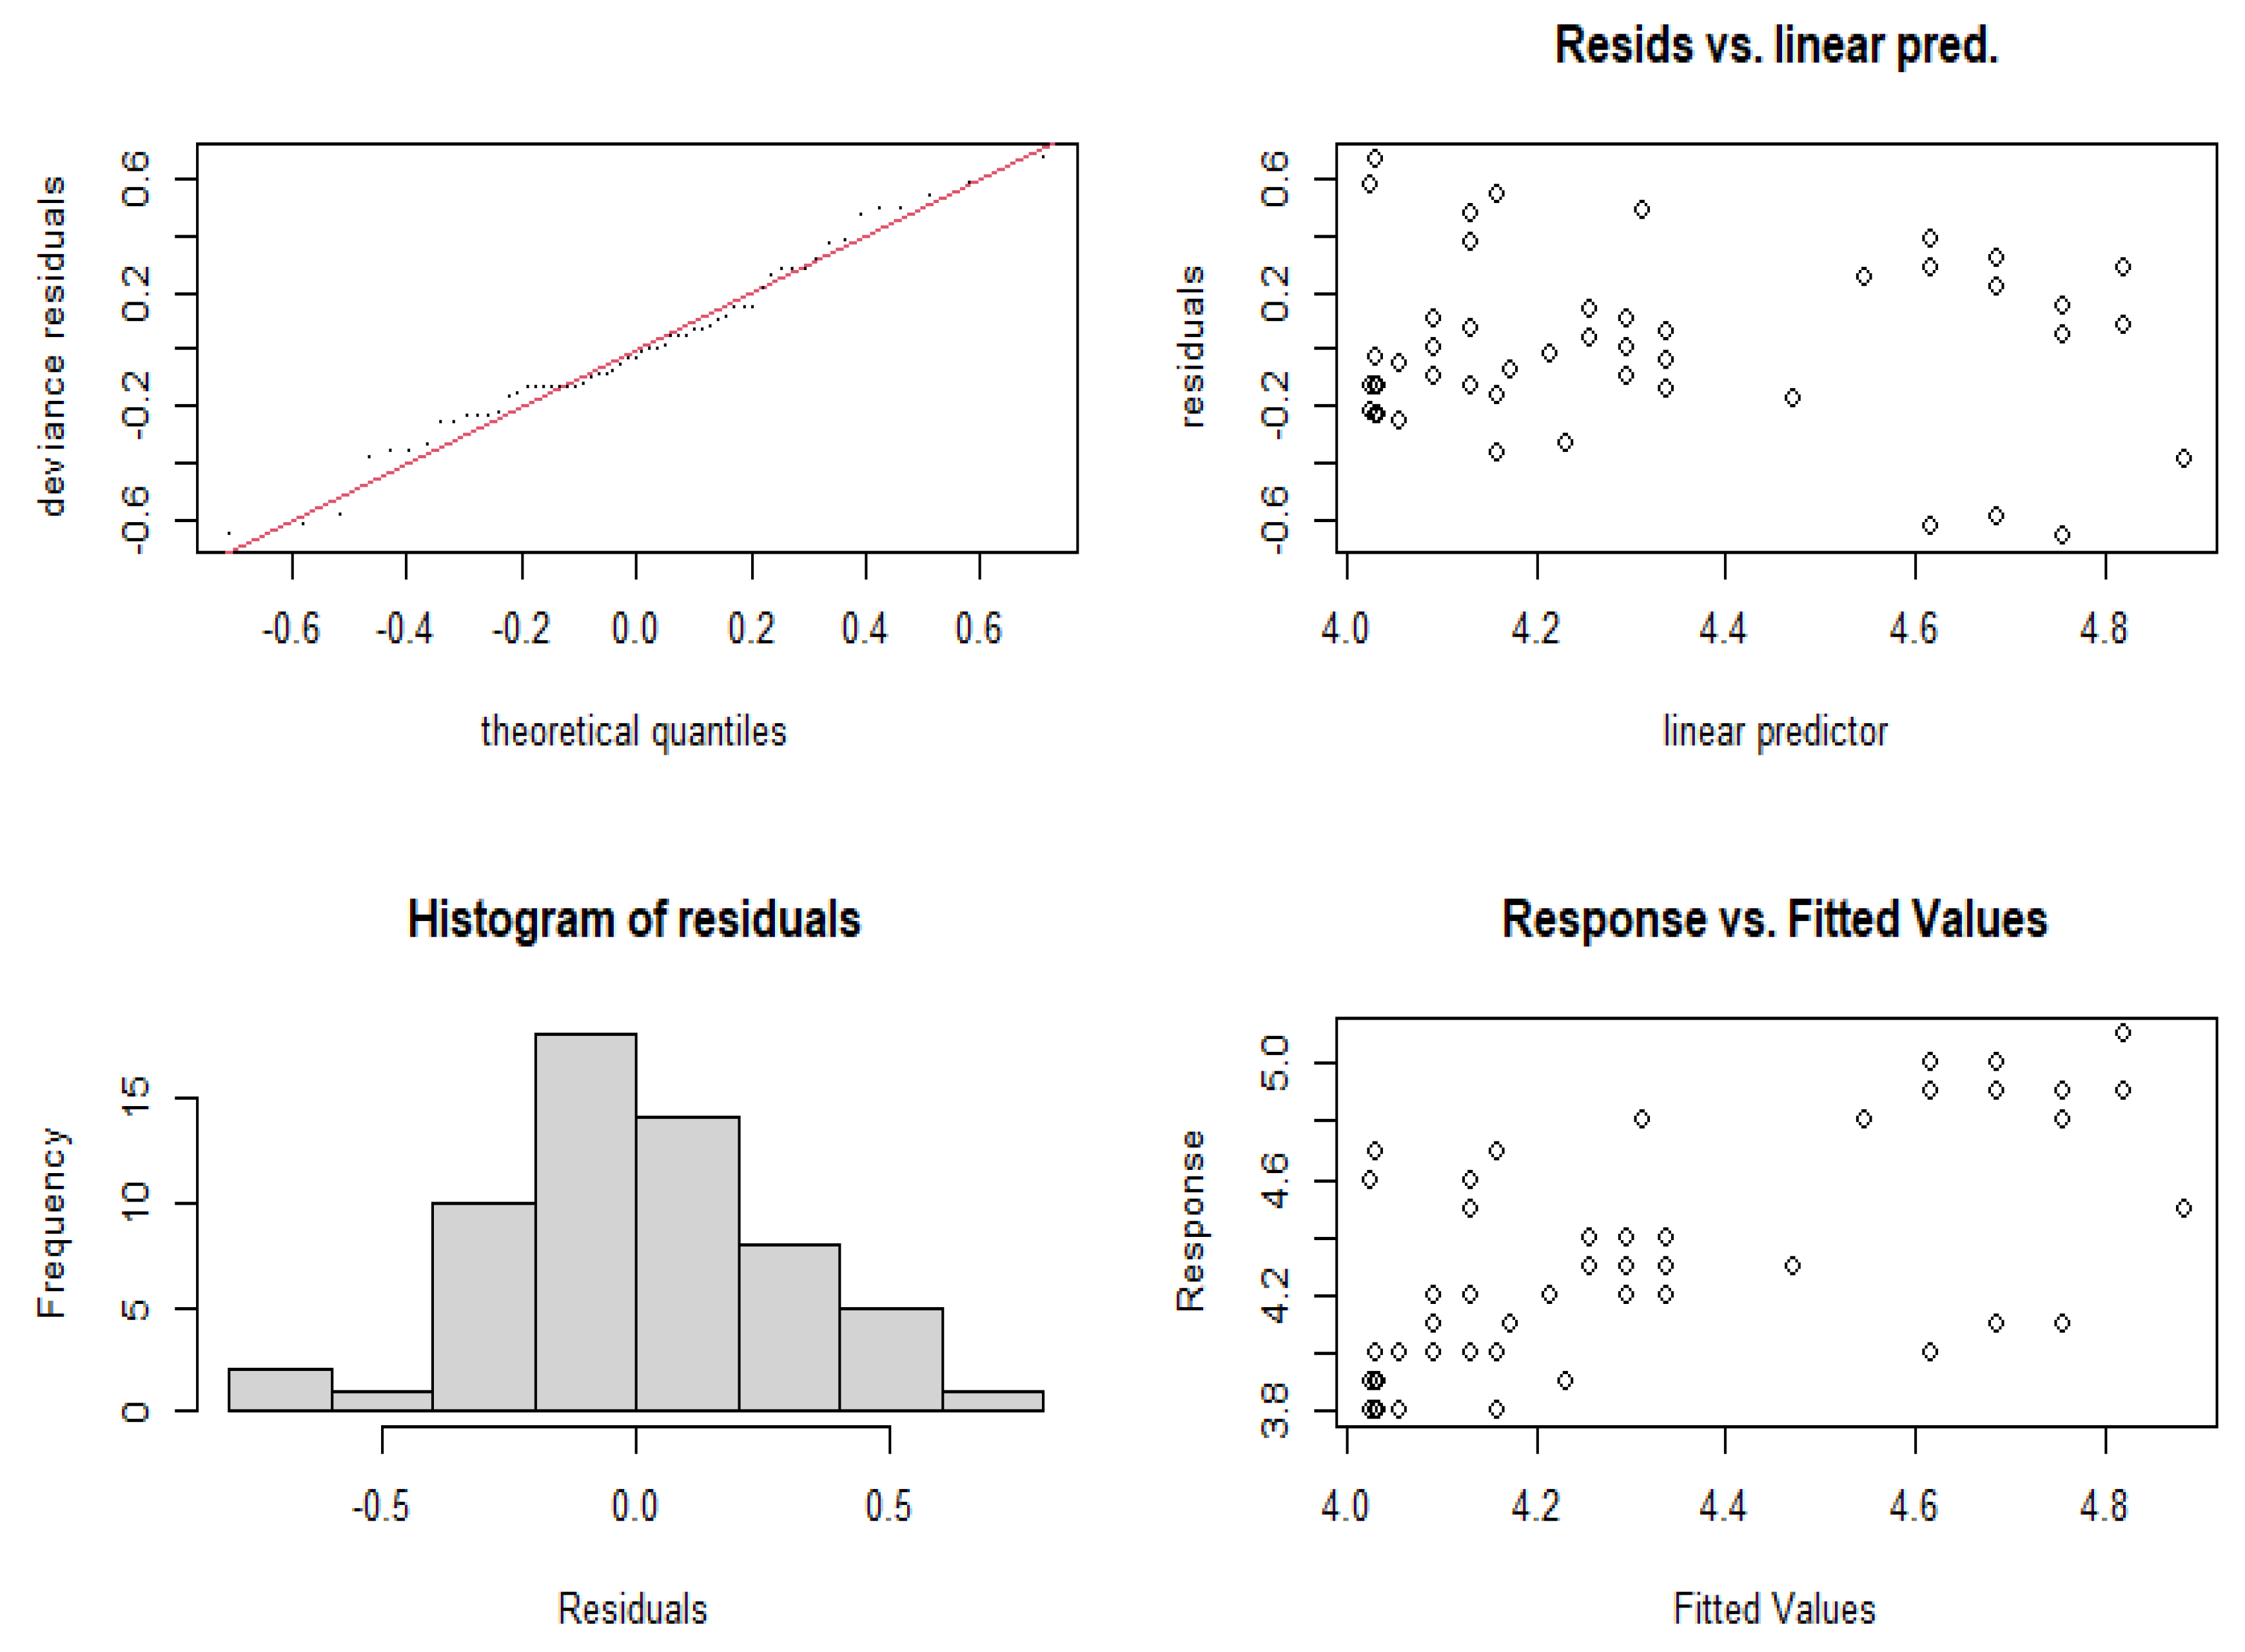
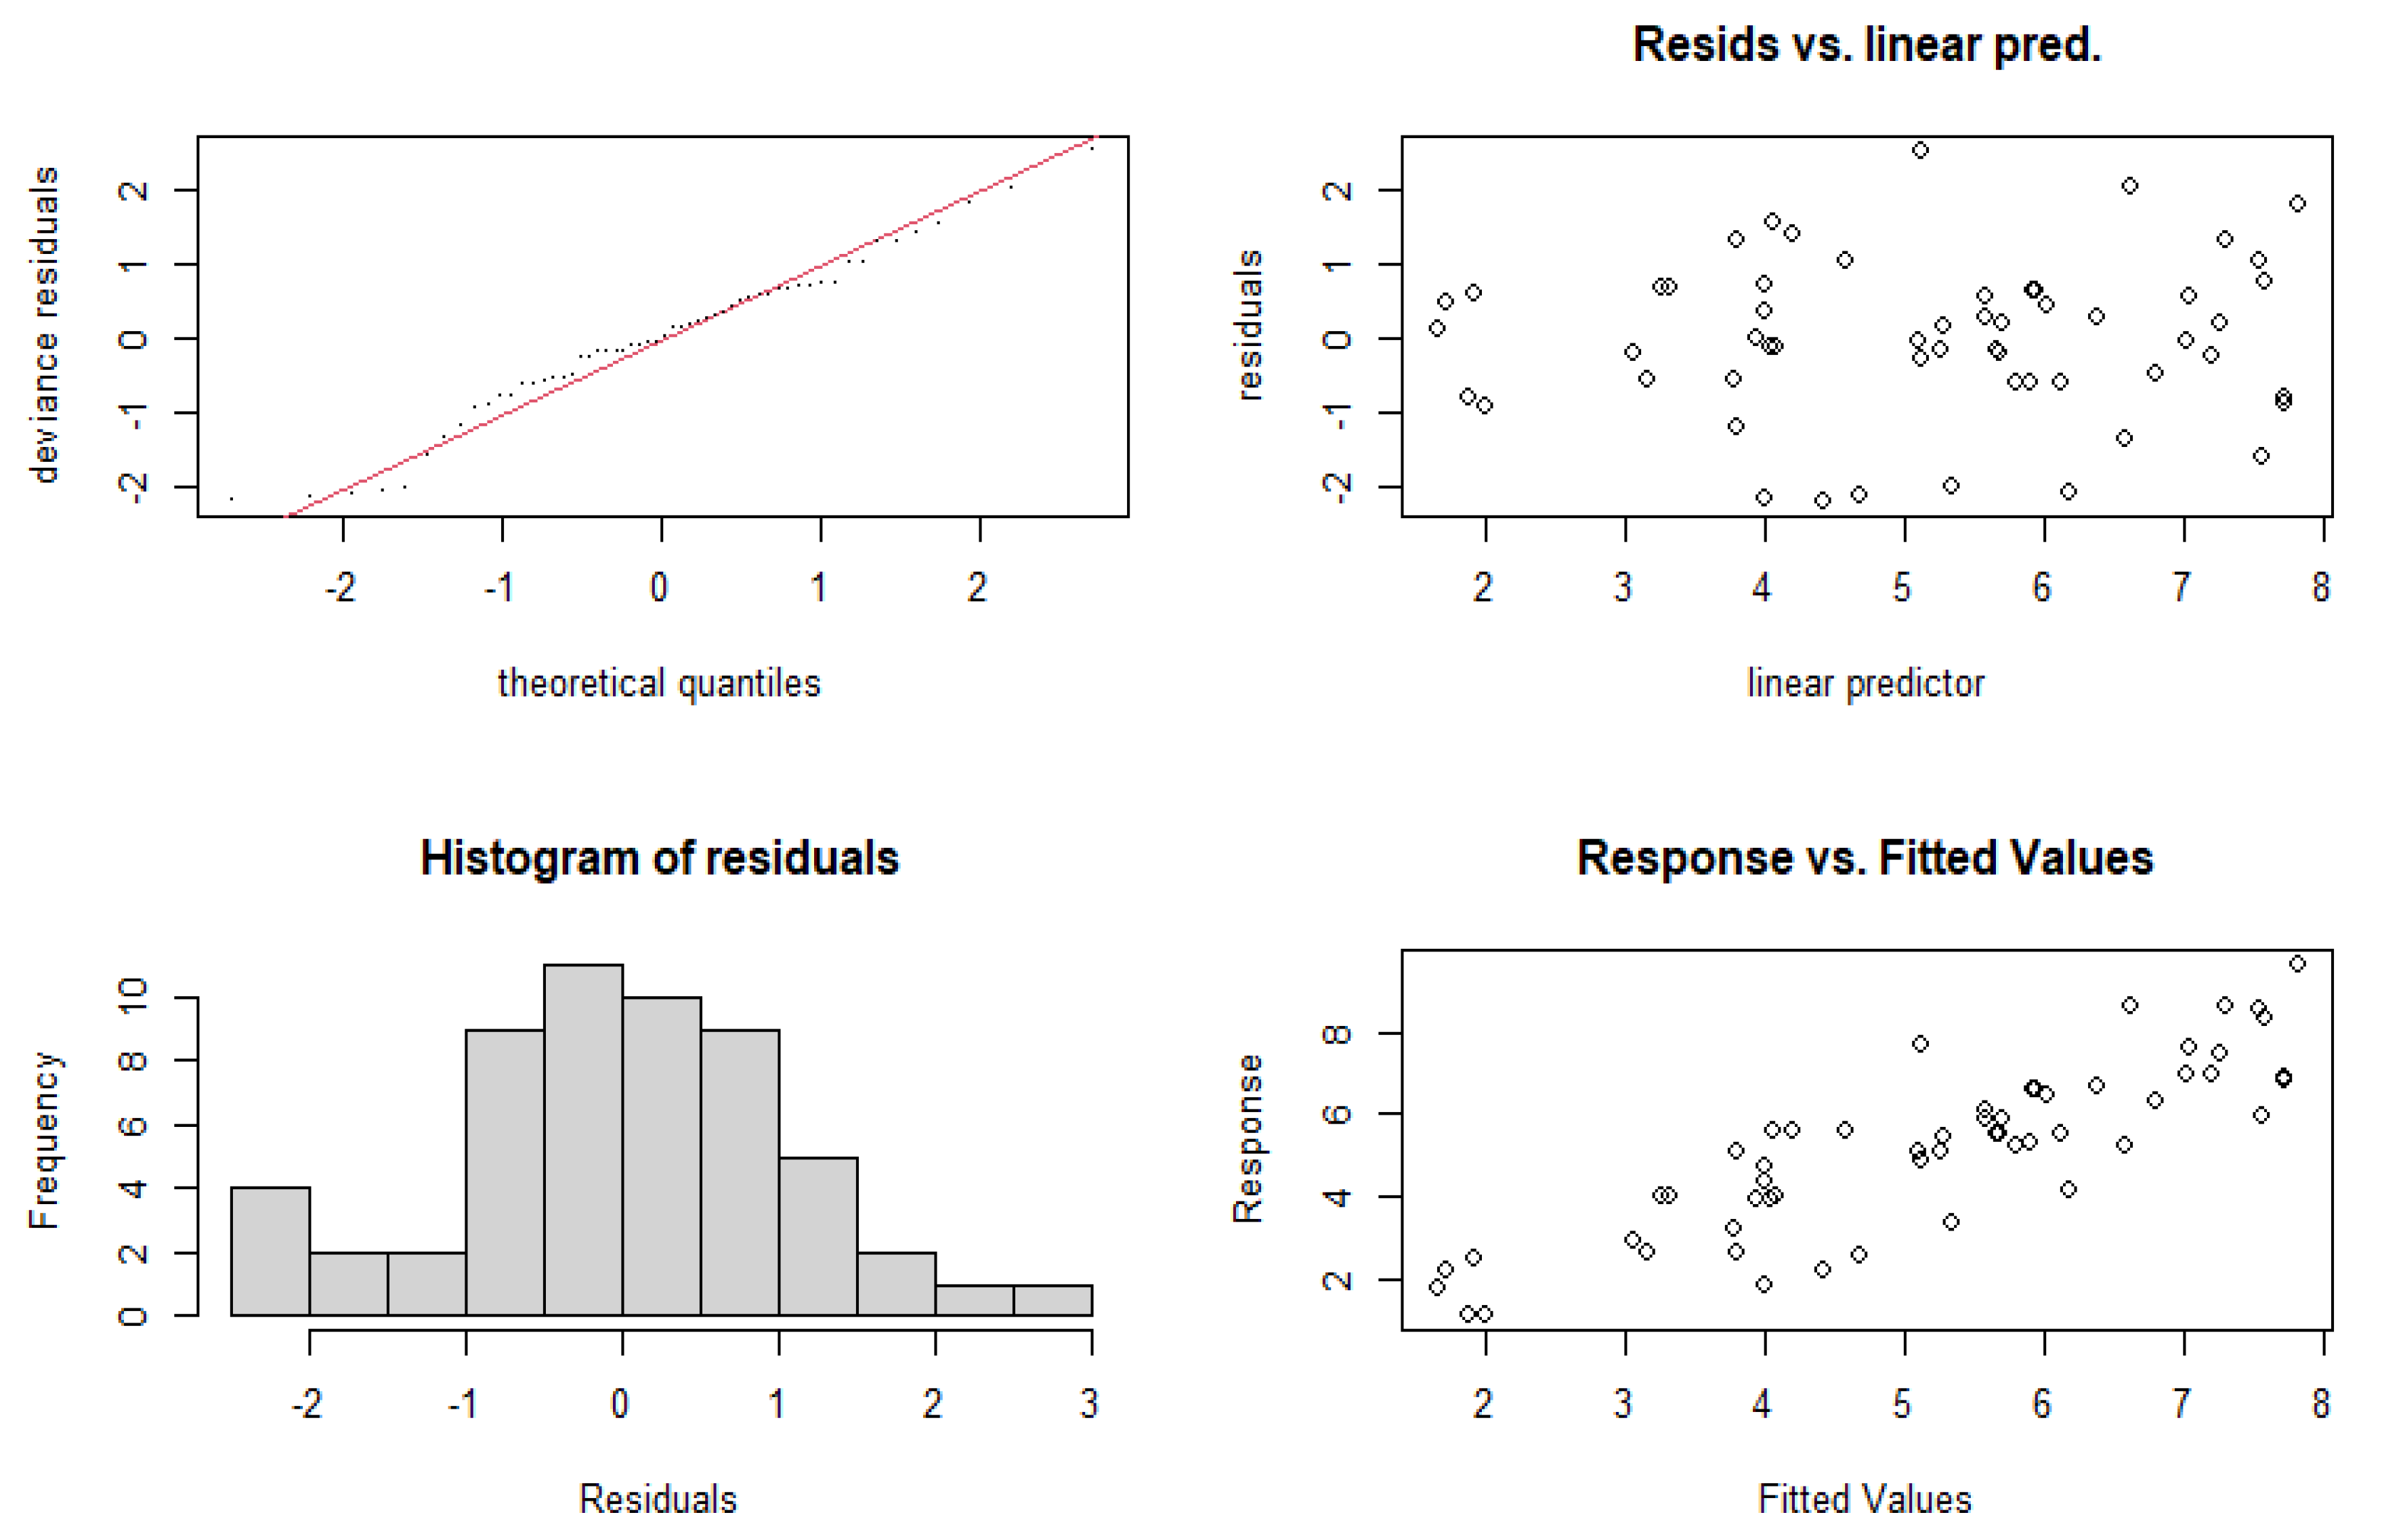
4. Results
5. Discussion and Policy Recommendations
5.1. Recession to Stagflation or Deeper Recession?
5.2. Addressing the Supply Side or Demand Side
5.3. The Current Crisis and Building New Economic Models
5.4. Time Horizon Based Recovery Path for India and the UK
6. Summary and Conclusions
Author Contributions
Funding
Data Availability Statement
Conflicts of Interest
Appendix A


References
- Abdullahi, Muhammad Mustapha, Nor Aznin Bt Abu, and Sallahuddin B. Hassan. 2016. Debt Overhang versus Crowding Out Effects: Understanding the Impact of External Debts on Capital Formation in Theory. International Journal of Economics and Financial Issues 6: 271–78. [Google Scholar]
- Abu, Nurudeen. 2019. Inflation and Unemployment Trade-off: A Re-examination of the Phillips Curve and its Stability in Nigeria. Contemporary Economies 13: 21–34. [Google Scholar] [CrossRef]
- Ashwani, and Geethanjali Nataraj. 2019. Demonetisation in India: An Impact Assessment. Journal of Business Thought 9. [Google Scholar] [CrossRef] [Green Version]
- Baqaee, David, and Emmanuel Farhi. 2020. Supply and demand in disaggregated Keynesian economies with an application to the Covid-19 crisis (No. w27152). National Bureau of Economic Research. [Google Scholar] [CrossRef]
- Bax, Dane, Temesgen Zewotir, and Delia North. 2021. Appraising Residential Property using Hierarchical Generalised Additive Models. Journal of Property Research. [Google Scholar] [CrossRef]
- Begg, Iian, and Fabian Mushove. 2016. The Economic Impact of Brexit: Jobs, Growth and Public Finances. London School of Economics. Available online: http://eprints.lse.ac.uk/67008/1/Hearing-11---The-impact-of-Brexit-on-jobs-and-economic-growth-sumary.pdf (accessed on 26 January 2021).
- Behera, Harendra, Garima Wahi, and Muneesh Kapur. 2017. Phillips Curve Relationship in India: Evidence from State-Level Analysis. RBI Working Paper Series No. 8. Available online: https://mpra.ub.uni-muenchen.de/80737/1/MPRA_paper_80737.pdf (accessed on 11 December 2020).
- Benati, Luca. 2015. The long-run Phillips curve: A structural VAR investigation. Journal of Monetary Economics 76: 15–28. [Google Scholar] [CrossRef] [Green Version]
- Bhatt, Rajiv Kumar. 2010. Recent Global Recession and Indian Economy: An Analysis. International Journal of Trade, Economics and Finance 2: 212–17. [Google Scholar] [CrossRef] [Green Version]
- Bhattarai, Keshab. 2017. Impacts of GST Reforms on Efficiency, Growth and Redistribution of Income in India: A Dynamic CGE Analysis. Available online: https://mpra.ub.uni-muenchen.de/92139/1/MPRA_paper_92139.pdf (accessed on 20 December 2020).
- Brianca, Pedro, Joao Durte, and Miguel Faria-e-Castro. 2020. Is the COVID-19 Pandemic a Supply or a Demand Shock? In Economic Synopses. St. Louis: Federal Reserve Bank of St. Louis. [Google Scholar]
- Business Line. 2019. Demonetisation, Faulty GST Implementation behind the Slowdown, Says Manmohan Singh. Business Line. Available online: https://www.thehindubusinessline.com/economy/demonetisation-faulty-gst-implementation-behind-the-slowdown-says-manmohan-singh/article29394026.ece (accessed on 11 December 2020).
- Chaudhary, Monika, P. R. Sodani, and Shankar Das. 2020. Effect of COVID-19 on Economy in India: Some Reflections for Policy and Programme. Journal of Health Management 22: 169–80. [Google Scholar] [CrossRef]
- Chidambaram, Perumal. 2020. The Worst Affected Economy. The Indian Express. Available online: https://indianexpress.com/article/opinion/columns/india-economy-slowdownactofgodpchidambaram6584615/#:~:text=The%20provisional%20estimates%20of%20GDP,in%20the%20last%2012%20months (accessed on 16 January 2021).
- Clausen, Jens R., and Bianca Clausen. 2010. Simulating Inflation Forecasting in Real-Time: How Useful is a Simple Phillips Curve in Germany, the UK, and the US? IMF Working Paper No. 10/52. Available online: https://ssrn.com/abstract=1562420 (accessed on 15 December 2020).
- Dasgupta, Dipak, and Abhijit Sen Gupta. 2010. India: Rapid Recovery and Stronger Growth. In The Great Recession and Developing Countries. Edited by Mustapha K. Nabli. Washington: The World Bank. [Google Scholar] [CrossRef]
- Dev, Mahendra, and Rajeswari Sengupta. 2020. Covid-19: Impact on the Indian Economy. Working Paper. Indira Gandhi Institute of Development Research. Available online: http://www.igidr.ac.in/pdf/publication/WP-2020-013.pdf (accessed on 14 January 2021).
- Dey, Soumik. 2019. Five factors that worsened the economic slowdown. The Week. Available online: https://www.theweek.in/news/biz-tech/2019/09/03/five-reasons-that-worsened-the-economic-slowdown.html (accessed on 21 January 2021).
- Dhingara, Swati, Stephen Machin, and Henry Overman. 2017. Local Economic Effects of Brexit. National Institute Economic Review 242: R24–36. [Google Scholar] [CrossRef] [Green Version]
- Dodd, D. 2020. Corona Virus Shrinks UK Economy by a Fifth. The Financial Times. Available online: https://www.ft.com/content/38234084-6dde-4834-a40d-29bd0d1c28cf (accessed on 24 January 2021).
- Donayre, Luigi, and Irina Panovska. 2018. U.S. Wage Growth and Non-Linearities: The Roles of Inflation and Unemployment. Economic Modelling 68: 273–92. [Google Scholar] [CrossRef]
- Friedman, Milton. 1968. The role of monetary policy. American Economic Review 58: 1–17. [Google Scholar]
- Ghosh, Amber. 2017. Impact of Demonetisation on India: A Macro-theoretic Analysis. Trade and Development Review 9: 57–73. [Google Scholar]
- Guerrieri, Veronica, Guido Lorenzoni, Ludwig Straub, and Ivan Werning. 2020. Macroeconomic Implications of COVID-19: Can Negative Supply Shocks Cause Demand Shortages? (No. w26918). Cambridge: National Bureau of Economic Research. [Google Scholar]
- Giammetti, Raffaele. 2020. Tariffs, domestic import substitution and trade diversion in input-output production networks: An exercise on Brexit. Economic Systems Research 32: 318–50. [Google Scholar] [CrossRef]
- Hantzsche, Arno, Amit Kara, and Garry Young. 2018. The economic effects of the UK government’s proposed Brexit deal. The World Economy 42: 1–24. [Google Scholar] [CrossRef]
- Hastie, Trevor, and Robert Tibshirani. 1987. Generalised additive models: Some applications. Journal of the American Statistical Association 82: 371–86. [Google Scholar] [CrossRef]
- Hemming, Richard, Selma Mahfouz, and Michael Kell. 2002. The Effectiveness of Fiscal Policy in Stimulating Economic Activity-a Review of the Literature. Working Paper No. 02/208. Washington: International Monetary Fund. [Google Scholar]
- Ho, Sin-Yu, and Bernard Njindan Iyke. 2019. Unemployment and Inflation: Evidence of a Non-Linear Phillips Curve in the Eurozone. The Journal of Developing Areas 53. [Google Scholar] [CrossRef]
- International Monetary Fund. 2020a. World Economic Outlook Update. International Monetary Fund. Available online: https://www.imf.org/en/Publications/WEO/Issues/2020/06/24/WEOUpdateJune2020 (accessed on 17 January 2021).
- International Monetary Fund. 2020b. Policy Responses to COVID-19. International Monetary Fund. Available online: https://www.imf.org/en/Topics/imf-and-covid19/Policy-Responses-to-COVID-19 (accessed on 21 January 2021).
- Jahan, Mahmud, Ahmed Saber Mahmud, and Chris Papageorgiou. 2014. What Is Keynesian Economics? Washington: International Monetary Fund, vol. 51. [Google Scholar]
- Khanna, Kavita V. 2020. India is Now in Classic Stagflation Territory. The Wire. Available online: https://thewire.in/economy/india-gdp-slowdown (accessed on 18 January 2021).
- Köhn, Sebastian. 2008. Generalised Additive Models in the Context of Shipping Economics. Master’s Thesis, University of Leicester, Leicester, UK. [Google Scholar]
- Kumar, Raj, and Pankaj Vashisht. 2009. The Global Economic Crisis: Impact on India and Policy Responses. Asian Development Bank Institute: Available online: https://www.adb.org/sites/default/files/publication/156019/adbi-wp164.pdf (accessed on 19 December 2020).
- Lenoël, Cyrille, Rory Macqueen, and Garry Young. 2020. Prospects for the UK economy. National Institute Economic Review 252: F10–43. [Google Scholar] [CrossRef]
- Loayza, Norman V., and Steven Pennings. 2020. Macroeconomic Policy in the Time of COVID-19: A Primer for Developing Countries. The World Bank: Available online: https://pdfs.semanticscholar.org/743b/8cc6b118771cc8a0621931851b6d456b49e0.pdf (accessed on 15 January 2021).
- Lokare, Shasidhar M. 2014. Re-emerging Stress in the Asset Quality of Indian Banks: Macro-Financial Linkages. Reserve Bank of India Working Paper Series No.3. Available online: https://www.rbi.org.in/scripts/PublicationsView.aspx?id=15720 (accessed on 11 December 2020).
- Mayhew, Ken, and Paul Anand. 2020. COVID-19 and the UK Labour Market. Oxford Review of Economic Policy 36: S215–24. [Google Scholar] [CrossRef]
- Mazumder, Sandeep. 2011. The Stability of the Phillips Curve in India: Does the Lucas Critique Apply? Journal of Asian Economics 22: 528–39. [Google Scholar] [CrossRef]
- Mihailov, Alexander, Fabio Rumler, and Johann Scharler. 2011. The small open-economy new Keynesian Phillips curve: Empirical evidence and implied inflation dynamics. Open Economies Review 22: 317–37. [Google Scholar] [CrossRef] [Green Version]
- Mishra, Alok Kumar, Badri Narayan Rath, and Aruna Kumar Dash. 2020. Does the Indian financial market nosedive because of the COVID-19 outbreak, in comparison to after demonetisation and the GST? Emerging Markets Finance and Trade 56: 2162–80. [Google Scholar] [CrossRef]
- Nason, James M., and Gregor W. Smith. 2008. Identifying the new Keynesian Phillips curve. Journal of Applied Econometrics 23: 525–51. [Google Scholar] [CrossRef] [Green Version]
- Osmerod, Paul, Bridget Rosewell, and Peter Phelps. 2013. Inflation/unemployment regimes and the instability of the Phillips curve. Applied Economics 45: 1519–31. [Google Scholar] [CrossRef] [Green Version]
- Papanikolaou, Dimitris, and Lawrence D. W. Schmidt. 2020. Working Remotely and the Supply-Side Impact of COVID-19. (No. w27330). National Bureau of Economic Research: Available online: https://www.nber.org/papers/w27330 (accessed on 20 January 2021).
- Paul, Biru Paksha. 2009. In Search of the Phillips Curve for India. Journal of Asian Economics 20: 479–88. [Google Scholar] [CrossRef]
- Perumal, Prashanth. 2020. Is the Indian economy staring at stagflation? The Hindu. Available online: https://www.thehindu.com/business/Economy/is-the-indian-economy-staring-at-stagflation/article30595793.ece (accessed on 20 January 2021).
- Posch, Johanna, and Fabio Rumler. 2015. Semi-structural forecasting of UK inflation based on the hybrid New Keynesian Phillips curve. Journal of Forecasting 34: 145–62. [Google Scholar] [CrossRef]
- Phillips, Alban W. 1958. The relation between unemployment and the rate of change of money wage rates in the United Kingdom, 1861–1957. Economica 25: 283–99. [Google Scholar] [CrossRef]
- Pršlja, Katarina. 2019. Analysing Country-Specific GDP Growth in Europe with Additive Models. Master’s Thesis, University of Ljubljana, Ljubljana, Slovenia. Available online: https://core.ac.uk/download/pdf/187764441.pdf (accessed on 11 January 2021).
- PTI. 2017. Negative GST Impact on GDP Growth Majorly Emphasised: SBI Report. The Economic Times. Available online: https://cfo.economictimes.indiatimes.com/news/negative-gst-impact-on-gdp-growth-majorlyemphasizedsbireport/60455056#:~:text=Negative%20GST%20impact%20on%20GDP%20growth%20majorly%20emphasized%3A%20SBI%20report,PTI&text=India’s%20GDP%20growth%20was%20expected,than%20transient%2C%20says%20a%20report (accessed on 19 December 2020).
- PTI. 2019. India Headed for Slowdown; Modi Govt Left Economy in ‘Dire Straits’: Ex-PM Manmohan Singh. The Economic Times. Available online: https://economictimes.indiatimes.com/news/elections/lok-sabha/india/modis-5-years-mosttraumaticdevastatingshouldbeshownexitdoormanmohansingh/articleshow/69186098.cms?from=mdr (accessed on 16 December 2020).
- Reserve Bank of India. 2014. Annual Report 2013-2014. Available online: https://www.rbi.org.in/Scripts/AnnualReportPublications.aspx?year=2014 (accessed on 12 January 2021).
- Reserve Bank of India. 2017. Macroeconomic Impact of Demonetisation: A Preliminary Assessment. Available online: https://rbidocs.rbi.org.in/rdocs/Publications/PDFs/MID10031760E85BDAFEFD497193995BB1B6DBE602.PDF (accessed on 20 January 2021).
- Salunke, Bhavesh, and Anuradha Patnaik. 2019. Inflation Dynamics and Monetary Policy in India: A New Keynesian Phillips Curve Perspective. South Asian Journal of Macroeconomics 8: 144–75. [Google Scholar] [CrossRef]
- Samuelson, Paul, and Robert M. Solow. 1960. Analytical aspects of anti-inflation policy. The American Economic Review 50: 177–94. [Google Scholar]
- Sharma, Shantanu Nandan. 2019. Severe Slowdown: When Will the Indian Economy Recover and How? The Economic Times. Available online: https://economictimes.indiatimes.com/news/economy/indicators/severe-slowdown-when-will-the-indian-economy-recover-and-how/articleshow/72310684.cms (accessed on 29 January 2021).
- Sigauke, Caston. 2017. Forecasting medium-term electricity demand in a South African electric power supply system. Journal of Energy in Southern Africa 28. [Google Scholar] [CrossRef]
- Singh, B. Karan, A. Kanakaraj, and T.O. Sridevi. 2010. Revisiting the Empirical Existence of the Phillips Curve for India. Journal of Asian Economics 22: 247–58. [Google Scholar] [CrossRef] [Green Version]
- Tenzin, Ugyen. 2019. The Nexus Among Economic Growth, Inflation and Unemployment in Bhutan. South Asia Economic Journal 20: 94–105. [Google Scholar] [CrossRef]
- Tetlow, Gemma, and Alex Stojanovic. 2018. Understanding the Economic Impact of Brexit. Institute for Government. Available online: https://www.instituteforgovernment.org.uk/sites/default/files/publications/2018%20IfG%20%20Brexit%20impact%20[final%20for%20web].pdf (accessed on 29 January 2021).
- The Guardian. 2020. UK Economy Nears ‘Perilous Turning Point’ on Covid-19. The Guardian. Available online: https://www.theguardian.com/business/2020/sep/29/uk-economy-nears-perilous-turning-point-on-covid-19 (accessed on 18 January 2021).
- The Indian Express. 2020. India’s GDP Contracts by 23.9% in April-June Quarter. The Indian Express. Available online: https://indianexpress.com/article/business/economy/india-gdp-data-1st-quarter-live-updates-coronavirus-lockdown-6577361/ (accessed on 9 December 2020).
- The World Bank. 2020. Global Economic Prospects - Pandemic, Recession: The Global Economy in Crisis. The World Bank. Available online: https://openknowledge.worldbank.org/handle/10986/34710 (accessed on 21 December 2020).
- UNIDO. 2020. Coronavirus: The Economic Impact. United Nations Industrial Development Organization: Available online: https://www.unido.org/stories/coronavirus-economic-impact-10-july-2020 (accessed on 3 January 2021).
- Valtiala, Juho PIetari, Sami Ovaska, and Timo Sipiläinen. 2019. Investigating the Determinants of Finnish Agricultural Land Prices using Generalised Additive Model. In EAAE Seminar on Agricultural Land Markets- Recent Developments, Efficiency and Regulation. Berlin: European Association of Agricultural Economists. [Google Scholar]
- Vasanthagopal, R. 2011. GST in India: A Big Leap in the Indirect Taxation System. International Journal of Trade, Economics and Finance 2: 144–46. [Google Scholar] [CrossRef] [Green Version]
- Verma, Toran Lal, D. K. Nema, Rahul Pandagre, and Surendra Verma. 2020. Impact of Demonetisation, Goods and Service Tax & COVID-19 on Indian Economy. International Journal of Advanced Research 8: 189–200. [Google Scholar] [CrossRef]
- Vidya, C.T., and K.P. Prabeesh. 2020. Implications of COVID-19 Pandemic on the Global Trade Networks. Emerging Markets Finance and Trade 56: 2408–21. [Google Scholar] [CrossRef]


| Polynomial Regression Results | India | UK | Spline Regression Results | India | UK |
|---|---|---|---|---|---|
| Intercept | 5.1558 *** | 1.81636 *** | Intercept | 0.8285 | 1.4791 *** |
| Poly (Unemp, degree = 2) 1 | 4.6318 * | −1.89629 *** | bs(Unemp, knots)1 | 3.1237 | 1.9024 *** |
| Poly (Unemp, degree = 2) 2 | −9.1289 ** | −3.39464 *** | bs(Unemp, knots)2 | 0.7920 | 0.4669 |
| bs(Unemp, knots)3 | 6.5250 *** | −1.1343 ** | |||
| bs(Unemp, knots)4 | 2.8339 | NA | |||
| bs(Unemp, knots)5 | −1.1375 | NA | |||
| bs(Unemp, knots)6 | 4.4670 ** | NA | |||
| Adjusted R Squared | 0.4352 | 0.5999 | Adjusted R Squared | 0.5708 | 0.6029 |
| s(Unemployment)—India | s(Unemployment)—UK | ||
|---|---|---|---|
| Estimates before Outlier Removal | Estimates after Outlier Removal | ||
| Parametric coefficients | |||
| Intercept | 5.158 *** (0.1528) | 5.1449 *** (0.1637) | 1.8164 *** (0.0515) |
| Approximate significance of smooth terms | |||
| Estimated degree of freedom (edf) | 8.049 | 7.145 | 4.546 |
| Reference df | 8.739 | 8.198 | 5.564 |
| F Stat | 14.43 | 14.29 | 20.69 |
| P Value | <2 × 10⁻¹⁶ *** | <2 × 10⁻¹⁶ *** | 1.85 × 10⁻⁵ *** |
| Adjusted R Squared | 0.687 | 0.687 | 0.677 |
| GCV | 1.5589 | 1.636 | 0.16226 |
| Deviance Explained | 73.3% | 73% | 70.7% |
| Scale estimate | 1.307 | 1.3846 | 0.1459 |
| Relief (Short Term) | Recovery (Intermediate) | Reform (Long Term) | |||
|---|---|---|---|---|---|
| Current | Proposed | Current | Proposed | Current | Proposed |
| Fiscal Stimuli (Tax concessions, employment related measures) | Aggressive Direct Spending (Consumption Expenditure) | ------- | Build Up Health infrastructure | Structural Changes | Liquidity Adjustment |
| Monetary Reliefs (Loans, moratorium, debt repayments) | Direct Benefits Transfer | -------- | Structural Changes | Foreign Trade Policy | Foreign Investment Policy |
| Monetary Infusion (Adjusting the lending rates) | New/Special Support Schemes | -------- | Enhancing the Working Capital | Foreign Investment Policy | Foreign Trade Policy |
| Usage of Successful Schemes (MGNREGA, PM KISAN) | -------- | Support for MSMEs and Start Ups | Fiscal Consolidation | ||
| Relief and Recovery (Short and Intermediate Term) | Reform (Long Term) | ||
|---|---|---|---|
| Current | Proposed | Current | Proposed |
| Fiscal Stimuli (Support to businesses, strengthening the social safety net to support vulnerable people, public services and charities) | Aggressive Direct Spending (To boost the consumption demand further) | Structural Changes | Liquidity Adjustment (Policies related to monetary stability) |
| Monetary Reliefs (The additional funding for the NHS, new Term Funding Scheme, reducing the UK countercyclical buffer rate to zero percent, support to SMEs) | Direct Benefits Transfer (The monetary benefits need to target the middle class and SMEs) | Foreign Trade Policy | Foreign Investment Policy (Structural changes based on technology transfer and innovation) |
| Monetary Infusion (Adjusting the lending rates, expanding the central bank’s holding of UK government bonds and non-financial corporate bonds) | New/Special Support Schemes and better usage of Successful Schemes (National Health Service, Job Retention Scheme) | Foreign Investment Policy | Foreign Trade Policy (Aiming at rebuilding the global supply chains, Finding new trade partners and strategies) |
| More direct support to trading units | Fiscal Consolidation (Restricting the fiscal deficit) | ||
Publisher’s Note: MDPI stays neutral with regard to jurisdictional claims in published maps and institutional affiliations. |
© 2021 by the authors. Licensee MDPI, Basel, Switzerland. This article is an open access article distributed under the terms and conditions of the Creative Commons Attribution (CC BY) license (https://creativecommons.org/licenses/by/4.0/).
Share and Cite
Victor, V.; Karakunnel, J.J.; Loganathan, S.; Meyer, D.F. From a Recession to the COVID-19 Pandemic: Inflation–Unemployment Comparison between the UK and India. Economies 2021, 9, 73. https://0-doi-org.brum.beds.ac.uk/10.3390/economies9020073
Victor V, Karakunnel JJ, Loganathan S, Meyer DF. From a Recession to the COVID-19 Pandemic: Inflation–Unemployment Comparison between the UK and India. Economies. 2021; 9(2):73. https://0-doi-org.brum.beds.ac.uk/10.3390/economies9020073
Chicago/Turabian StyleVictor, Vijay, Joshy Joseph Karakunnel, Swetha Loganathan, and Daniel Francois Meyer. 2021. "From a Recession to the COVID-19 Pandemic: Inflation–Unemployment Comparison between the UK and India" Economies 9, no. 2: 73. https://0-doi-org.brum.beds.ac.uk/10.3390/economies9020073