The Financial Integration in the European Capital Market Using a Clustering Approach on Financial Data


1
Faculty of Informatics and Statistics, Prague University of Economics and Business, 130 67 Prague, Czech Republic
2
Faculty of Economics, Technical University of Košice, 040 01 Košice, Slovakia
*
Author to whom correspondence should be addressed.
†
These authors contributed equally to this work.
Economies 2021, 9(2), 89; https://0-doi-org.brum.beds.ac.uk/10.3390/economies9020089
Submission received: 8 April 2021
/
Revised: 28 May 2021
/
Accepted: 2 June 2021
/
Published: 7 June 2021
Abstract
:In 2009, when the effects of the economic crisis were fully felt, countries around the world experienced negative impacts, starting from the USA, where the crisis began, through Europe to Asia. Economic cycles, fluctuations, and crises are a common part of the financial market, for example, the crisis in 1929 and the crisis in 2000. The recovery of the economy is a key factor in this process. Due to the increasingly powerful process of globalization and the growth of the interconnectedness of individual economies to each other, not to mention an increasing pressure on the formation of integration clusters, the creation and emergence of new financial crises with supranational and transnational character are highly likely in the future. It is possible that a one-day crisis reaches and expands with global reach, but it is important for us to be prepared through effective tools. In this article, we will be dealing with financial indicators within the European Union that define and create the capital market. Based on cluster analysis, we create groups of countries that are similar to each other. We determine which countries are the leaders and which, on the contrary, lag behind the rest of Europe.
1. Introduction
The capital market is an important element in a number of indicators for the market economy. The developed capital market provides support for economic growth, a more efficient allocation of capital, improves trade balance, enables better risk development, diversification, or provides financial stability. For the capital market to be effective, it is necessary to set its legislative framework properly, taking into account the investment base and the political and economic balance of the state (Akhtar 2021). A major role in the development of the capital market is played by financial intermediaries and, in particular, banks. The key role of the banking sector consists of transferring financial resources, transferring risks, and securing a stable financial system. Banks and other financial institutions operating in the financial market must monitor and control their financial activity. Regulatory regulation protects consumer deposits, improves the transparency of investment projects, and provides the bank with sufficient capital in the event of a more severe financial downturn (Akyol et al. 2014).
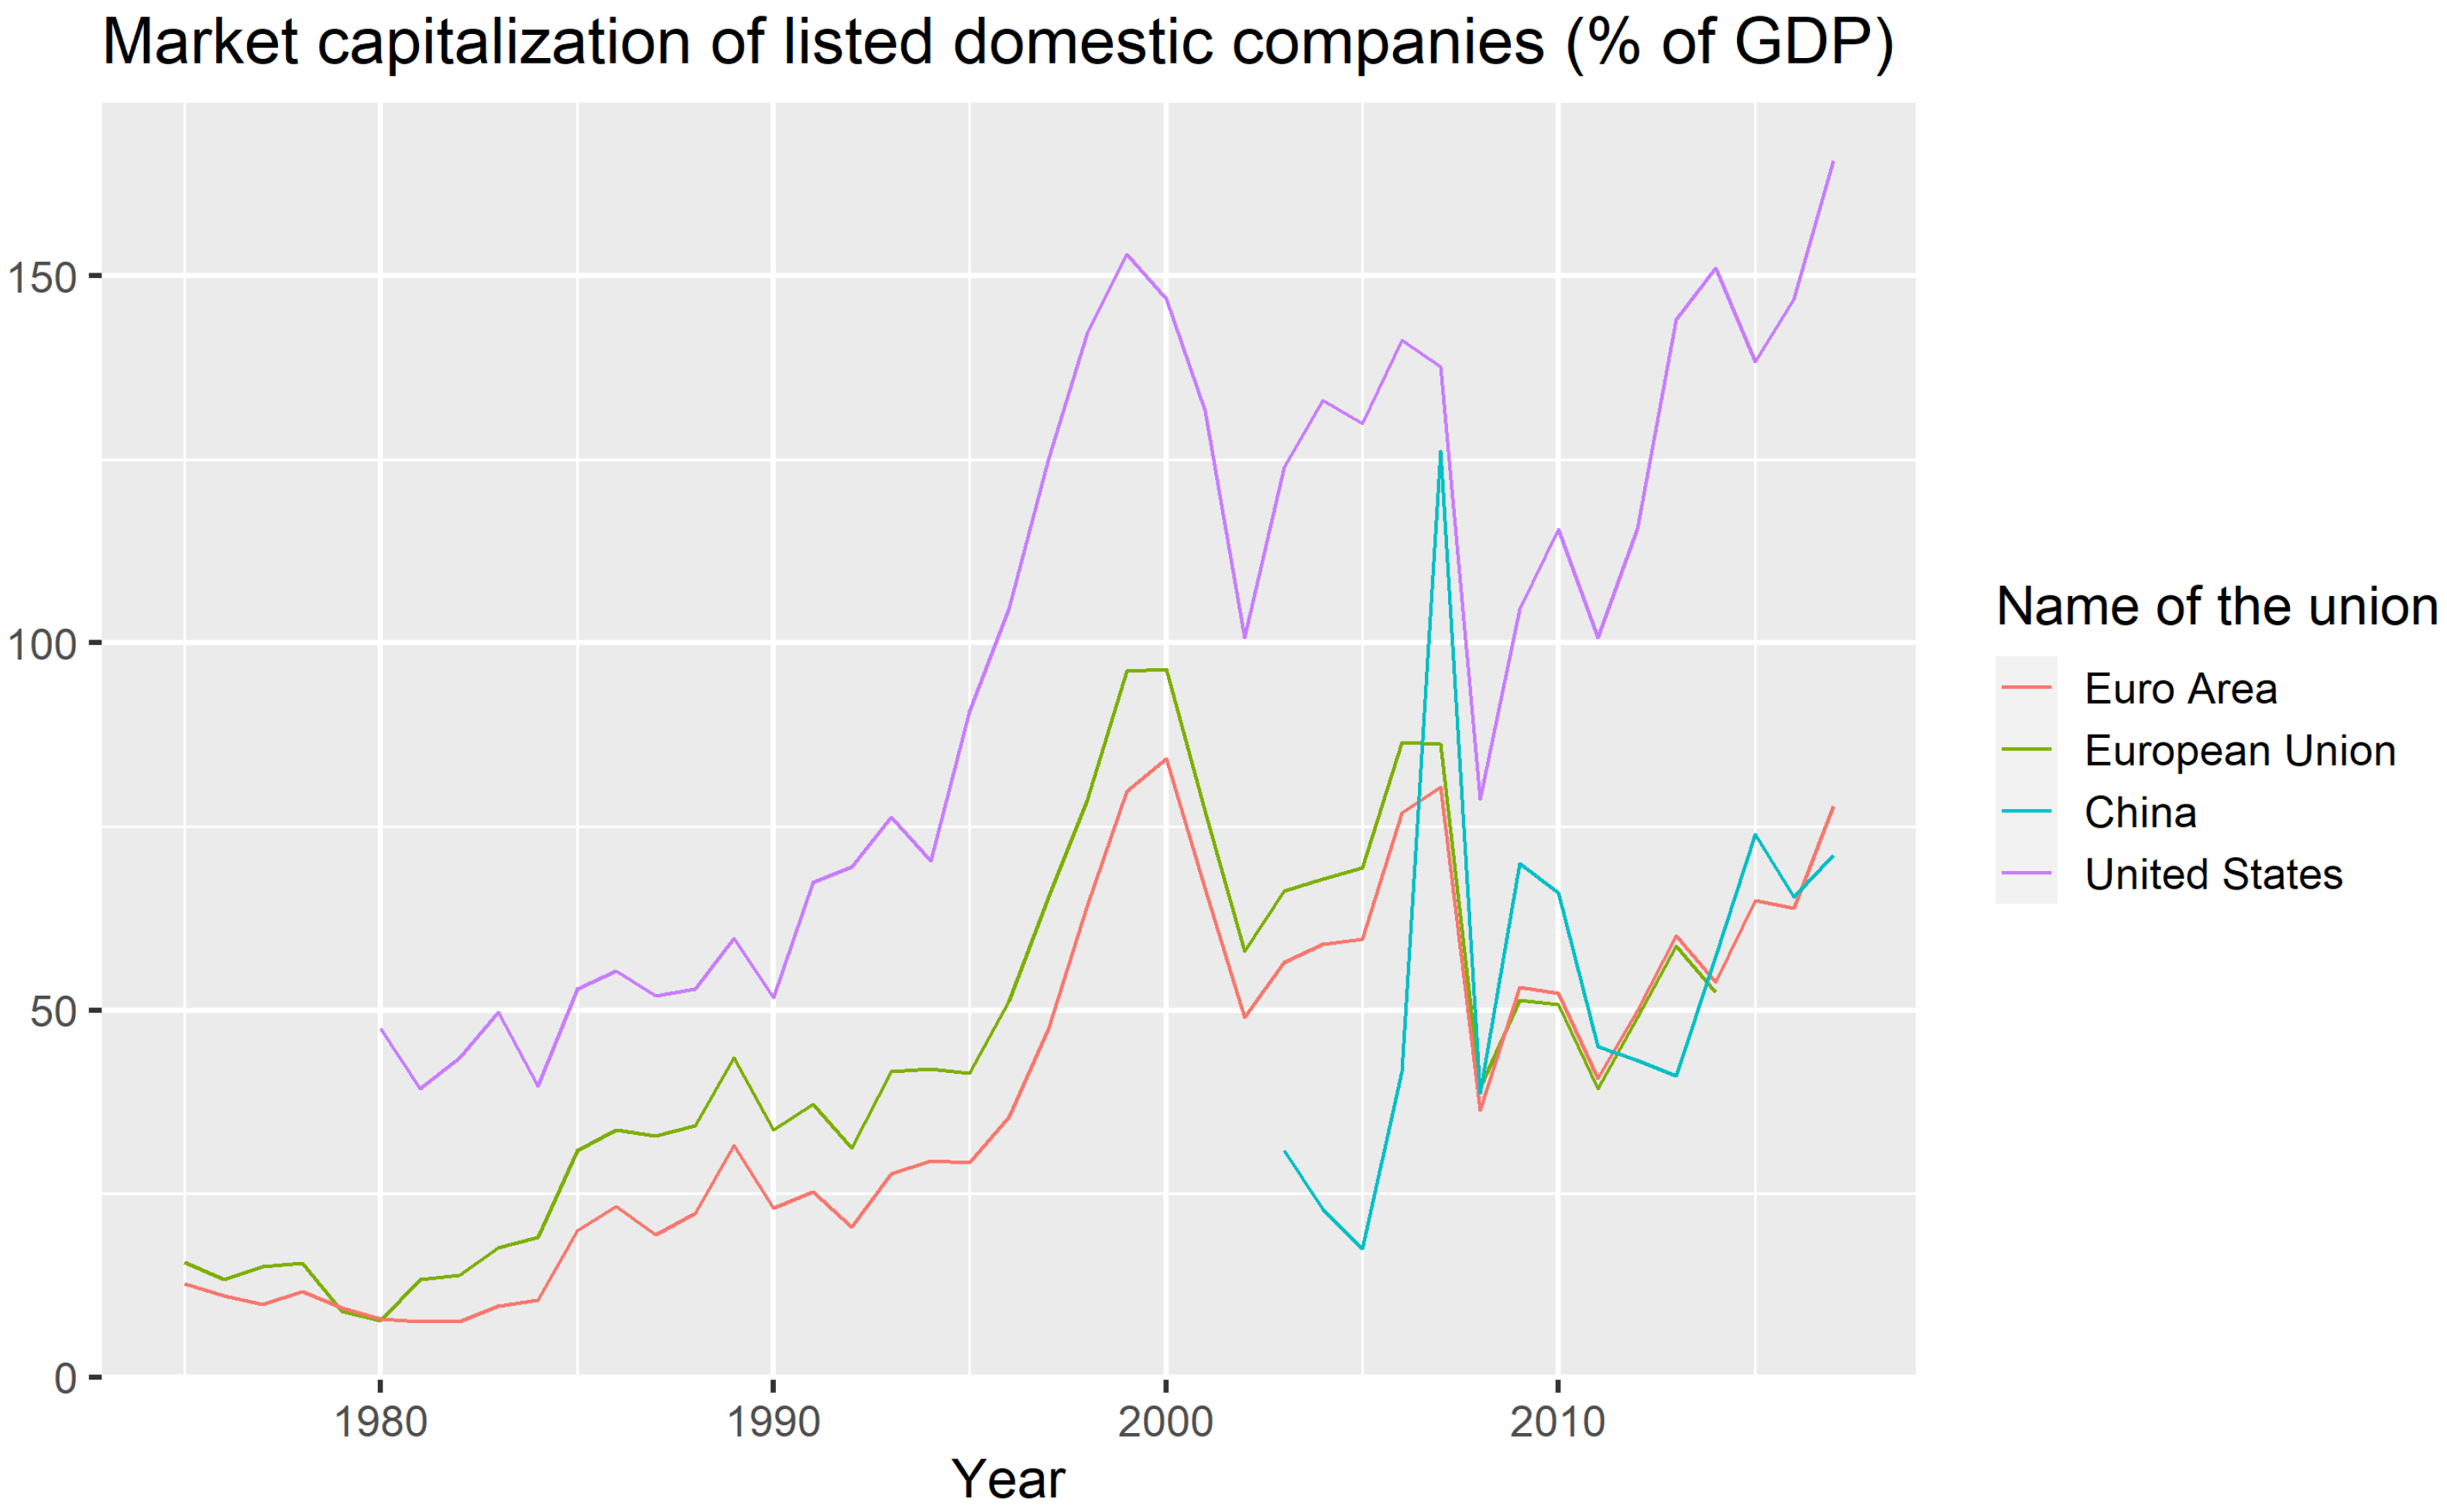
In the global economy, financial markets have different structures and performances. The US market has a higher market capitalization, is more developed than European markets, and is dominated by private equity financing. The US market performance is similar to Japan’s capital market. The Chinese capital market represents the smallest market among the leading economic powers. Capital markets in Europe are significantly segmented, dominated by the credit mechanism and trading of financial institutions. The most similar to the US market in Europe is Switzerland (Boldeanu and Tache 2015).
Taking into account market capitalization, as one of the indicators of the size of the capital market, the US capital market is the largest. The Chinese capital market is more volatile but has a growing trend. More detailed values can be seen in Figure 1.
The idea of Capital Market Union (CMU) emerged as the political–economic program of the EC in 2014 with a view to creating a stable economic environment and contributing to a higher degree of integration of the member countries of the European Union. The European Capital Market project, based on the basic parameters of the US capital market, would enhance the competitiveness of market players by strengthening the EU’s common economy, contributing to the contribution of economic growth, employment rates, improving business financing, contributing to the diversification of investment funds and facilitating more effective interconnection between business partners. An important assumption, however, is the openness of national economies, the degree of economic development, and banking regulation. The integrated capital market provides a reduction of financial risks, thus offering investors better opportunities to diversify their portfolios. It is also involved in more efficient financing of investment projects, financing of corporate capital, as well as securing sufficient market liquidity. The EU capital market represents an integration step for the creation of a fiscal and political union. As a result of the financial crisis and later the debt crisis, however, problems have emerged between the EU Member States and the Eurozone, causing significant imbalances, excessive differences in interest rates on government bonds, or deterioration in the credit rating of national states. National markets have begun to become more fragmented. This phenomenon does not contribute to a CMU and slows the process of deeper integration of countries (Marty 2014).
The creation of the European Union aims to stop the frequent and bloody war conflicts between neighboring countries, which culminated during World War II. In order to ensure lasting peace, European countries have been beginning to unite economically and politically in the European Coal and Steel Community since 1950. The six founding countries are Belgium, France, Germany, Italy, Luxembourg and the Netherlands. The 1950s are marked by the Cold War between the West and the East. In 1956, Soviet tanks suppressed protests against the communist regime in Hungary. The Treaty of Rome was signed in 1957, creating the European Economic Community (EEC) or the “common market”. The 1960s were an economically favorable period, helped by the fact that EU countries no longer collect customs duties in their mutual trade. They also conclude an agreement on joint control of food production so that everyone has enough of it—and there is very soon a surplus in agricultural production. May 1968 became famous for the student riots in Paris. Many changes in society and behavior are attributed to the so-called “Generation 68”. Denmark, Ireland and the United Kingdom acceded to the European Union on 1 January 1973, bringing the number of member states to nine. As a result of the short but cruel Arab–Israeli conflict in October 1973, there is an energy crisis and economic problems in Europe. The overthrow of the Salazar regime in Portugal in 1974 and the death of General Franco in Spain in 1975 put an end to the last right-wing dictatorships in Europe. Under EU regional policy, large amounts of funding are beginning to be shifted to create jobs and infrastructure in poorer areas. The European Parliament’s influence on EU affairs is growing. In 1979, for the first time, all citizens could directly elect their representatives. In the 1970s, the fight against environmental pollution intensified. The EU is adopting environmental legislation which, for the first time, refers to the “polluter pays” principle. The Polish trade union Solidarność, led by Lech Wales, became a household name throughout Europe and the world after strikes in Gdańsk Shipyards in the summer of 1980. In 1981, Greece became the tenth member of the EU. In five years, Spain and Portugal will join. In 1986, the Single European Act was signed. It is a treaty that forms the basis of a comprehensive six-year program to tackle free cross-border trade within the EU, creating a “single market”. A major political turning point was the fall of the Berlin Wall on 9 November 1989. Twenty-eight years later, the borders between East and West Germany are open. The unification of East and West Germany in October 1990 thus led to the reunification of Germany. After the fall of communism in Central and Eastern Europe, Europeans in the neighborhood came closer again. In 1993, the creation of a “four freedoms” single market was completed. It is about the free movement of goods, services, people and capital. The 1990s were the period of two treaties: the Maastricht Treaty on European Union of 1993 and the Treaty of Amsterdam of 1999. Citizens were interested in environmental protection issues, as well as European cooperation in the field of security and defense. In 1995, three more countries joined the EU: Austria, Finland and Sweden. The small Luxembourg village lent its name, “Schengen”, to agreements that gradually allowed people to travel without passport controls at the border. Thanks to EU funding, millions of young people were studying in other countries. Communication was becoming easier as the number of people using mobile phones and the Internet grows. During this period, the euro was becoming a new currency for many Europeans. During this decade, more and more countries were introducing this currency. Following the collapse of buildings in New York and Washington as a result of the crash of hijacked civilian aircraft, 11 September 2001, became synonymous with the “war on terror.” EU countries were starting to work much more closely in the fight against crime. The political division of Eastern and Western Europe finally ceases to exist when 10 new countries join the EU in 2004, followed by Bulgaria and Romania in 2007. In September 2008, the world economy was hit by the financial crisis. All EU countries ratified the Lisbon Treaty, which would later enter into force in 2009. This treaty gave the Union more modern institutions and more efficient working methods. The global economic crisis struck hard in Europe. The EU helped several countries to confront their difficulties and established the ’Banking Union’ to ensure safer and more reliable banks. In 2012, the European Union was awarded the Nobel Peace Prize. Croatia became the 28th member of the EU in 2013. Climate change was still high on the agenda and leaders agreed to reduce harmful emissions. European elections were held in 2014 and more Eurosceptics are elected into the European Parliament. A new security policy was established in the wake of the annexation of Crimea by Russia. Unrest and wars in various countries led many people to flee their homes and seek refuge in Europe. The EU was faced with the challenge of how to take care of them, while safeguarding their welfare and respecting their human rights (European Union 2021; Knudsen 2015).
It should also be mentioned that financial integration also carries many risks. Agenor (2001) discusses mainly these potential risks and costs of international financial integration:
- Concentration of capital flows and lack of access;
- Domestic misallocation of capital flows;
- Loss of macroeconomic stability;
- Pro-cyclicality of short-term capital flows;
- Herding, contagion, and volatility of capital flows;
- Risks of entry by foreign banks.
Schmukler also analyzes gain and pain of financial globalization and he focuses on developing countries. According to their paper, countries can benefit from financial integration but there is importance of sound fundamentals and strong institutions. Otherwise, especially for developing countries, there are many risks from this financial integration (Schmukler 2004).
The contribution addresses the formation of the capital union within the European countries by cluster analysis. Based on financial data, we analyze developments in individual member countries. The main purpose of the article is to find out to what extent the member states are synchronized/harmonized in the capital market area and which country/a group of countries gives decisive guidance in forming a CMU. The article is divided into three parts. The first part of the paper focuses on the theoretical definition of capital markets, focusing on capital market research in the EU. In the second part is formulated the methodology of our research and we characterize the used data. The third part brings the results of the analysis we use.
2. Capital Market Analysis in the Recent Literature
The current literature provides evidence of the formation of a union of capital markets, primarily from a theoretical and legislative point of view. The authors deal with the detailed analysis of the effects of forming the institutional structure of the capital market (Micheler 2016; Moloney 2016; Schammo 2017). Some authors focus on the creation and effects of regulatory requirements for banks (Cúrdia and Woodford 2004; Martinez and Philippon 2019). Credit policy in business cycle is discussed by Gertler (Gertler and Kiyotaki 2010) and Benigno with Romei dealt with debt deleveraging and the exchange rate (Benigno and Romei 2014). In the study of the correlation between macroeconomic developments and financial indicators, authors focus on studying financial markets in terms of their impact on financial stability, the promotion of economic growth and the elimination of risk factors (Acharya and Steffen 2016; Anderson et al. 2015; Véron and Wolff 2016). There is a lack of expert studies on fiscal scrutiny of the capital market in the area of taxation of financial instruments (Lierse and Seelkopf 2016), and analysis of the impact of the correlation between bank regulation and the fiscal mechanisms (Eggertsson and Krugman 2012).
Micheler describes the legislative framework of the capital union, addresses the structure of the financial market, and addresses the issue of how to protect the market from falling by properly regulated regulation (Micheler 2016). Moloney assesses the overall impact of the institutional set-up for euro area countries (Moloney 2016). Other authors have taken the political viewpoint and identified the winning states of the capitalist union (developed countries) and the defeated states (countries oriented to their internal domestic market) (Quaglia et al. 2016). Schammo describes how the process of creating a capital market union is needed and what action has already been taken in the EU. At the same time, he identified the risks that need to be monitored and regulated in order to increase the efficiency of the information transfer in the banking sector (Schammo 2017). Criticism of the European capital market project from the point of view that it is too dictated by the US market can be found in Ertürk’s (2015) work. For the capital union and investment promotion in the EU, it proposes to create a platform that better suits the needs of the euro area/EU. Dorn addresses the identification of the origin of financial markets in Europe and explains the need for bank regulation (how bank capital requirements have changed) before, during, and after the financial crisis (Dorn 2016). Macroprudential supervision and financial risks in banking are solved by Alexander, who justifies bank regulation as a prerequisite for maintaining financial stability and preventing the spread of shadow banking (Alexander 2015). From studies addressing the current state of the regulatory regime in the euro area, Burn, who describes in detail the benefits (transparency, international accounting standards, regulation) and weaknesses (the state’s fragmented state legislation, the fragmentation of states) of the capital union, can be mentioned. He points out that the disadvantages need to be addressed in good time before the establishment of the capital union itself (Burn 2016). Boldeanu clearly describes the structure of the financial market in the EU and notes that for the future development of the capital market in the EU, it is necessary to have more nationalized capital markets as they are today. Financial markets in Europe are divided into Western financial markets (more developed, more likely the headquarters of financial centers or large banks) and Eastern financial markets (less organized compared to the west) (Boldeanu and Tache 2015).
The study of politically and legally focused work suggests that the creation of a capital market union would damage more countries that have their economic policies set to strengthen the domestic economy and, on the contrary, would benefit the developed economies with an open economy. Therefore, in our research, it is our intention to verify this hypothesis and to identify the groups of countries within the EU that will benefit or rather lose in the capital union.
Acharya and Steffen see an efficient capital market in the euro area by linking the banking and fiscal union. The conditions and prerequisites for the functioning of the banking union are achieved through the introduction of a unified supervisory mechanism and deposit protection, but there is a lack of political will in the continuation of European integration in the fiscal union. The authors detect the main problem of slowing integration processes in the fragmentation of national economies and the excessive differences in government bonds that have ceased to function in a number of countries as a risk-free financial asset. Therefore, these imbalances will need to be eliminated and convergence of sovereign debt will be achieved. They see solutions in the use of financial derivatives, strengthening bank rules and harmonizing accounting frameworks for financial reporting of banks. Financial derivatives, with sufficient regulation, can effectively manage risk and promote market liquidity, trading volume and competitiveness (Acharya and Steffen 2016).
From the perspective of transparent disclosure of financial assets and financial liabilities in banks’ balance sheet, it is important to pay attention also to the accounting standards for financial reporting and auditing. International Accounting Standards (IAS/IFR) provide a true and fair view of the financial position of the institution. In the Common Equity Market, uniform accounting policies have contributed to a more transparent measurement of fair value of financial assets and liabilities. Financial statements for investors mean valuable access to the financial information and data needed to make their investment decisions. An audit of the financial statements ensures that the financial information that the investor needs for the decision is reported in a transparent manner and in accordance with applicable accounting rules, helping to reduce risks and increase the credibility of the audited institution. In addition, the audit of the bank or the insurance company increases the likelihood of having healthy financial flows, and in the case of the economic recession, they will have sufficient funds to provide and cover the financial resources and thus prevent potential bankruptcy. Véron and Wolff investigated the field of taxation and taxation of financial instruments as it is important for capital market development to adopt an investment decision, as tax legislation may provide for the possibility of adjusting the income tax base for deductible items from invested assets (for example, an entity may apply the deductible item to the interest paid on the debt, or apply the deductible item to hybrid derivatives, but this is speculative trading at the edge of the law) (Véron and Wolff 2016). Burn, Lierse and Seekopf consider government tax policy and its effect on the international financial market, and emphasize the relevance of the relationship between fiscal policy and markets, especially in times of economic crisis. Financial uncertainty and the economic crisis disrupt the performance of financial markets, weaken the ability of governments to meet their obligations and raise investors’ concerns. The analysis has shown a positive, albeit insignificant relationship, that fiscal policy through taxation (through indirect taxes, in particular through direct taxation, in particular through VAT on financial instruments) can increase capital mobility, stabilize high interest rates on bonds and restore financial market stability (Burn 2016; Lierse and Seelkopf 2016).
Another area of capital market research is an analysis of the impact on financial stability. Anderson provides an analysis of the impact of the integrated capital market on economic growth and financial stability. The authors focus on quantifying the risk, eliminating the negative effects of the financial crisis, highlighting the role of banks in the financial system, the role of banks as a subject for maintaining a stable economic environment and analyzing the impact of risk on the bank’s balance sheet. Prevention of economic crises is possible through risk sharing, bond market protection, and improved credit rating in stressful times (Anderson et al. 2015). Martinez and Philippon emphasize the issue of the capital union in a comprehensive way, an important step for improving monetary union and further integration. The analysis identified the existence of a link between financial indicators and macroeconomic data in the euro area. According to the study’s conclusions, the macroeconomic variables in the capital union improve the transfer of financial resources through better risk sharing (through fiscal mechanism) and improve the fixed capital flow. The development of financial indicators, in particular the development of interest rates on bonds, implies the need for fiscal reforms (Martinez and Philippon 2019). Brűhl et al. pay attention to the capital union as a source for strengthening the banking union and economic growth, and a tool for creating macroeconomic stability that would protect against crises. The importance of the capital union attaches to protecting the interests of depositors and investors and eliminating interest rate differentials (Brűhl et al. 2015). Barbu and Strachinaru analyze macroeconomic and financial data in an econometric model to estimate that the capital union will strengthen capital flows in the EU, remove investment barriers and reduce the risk of market volatility (Barbu and Strachinaru 2016).
Alternative indicators and monitoring methodologies to measure the evolution of capital market integration in the European Union can be found in Adam et al. (2002). Time-invariant and time-varying market integration across European stock markets is discussed by Nardo et al. (2021).
3. Data and Methodology
Research methodology is based on a cluster analysis based on financial data for the European Union. The contribution uses the financial data for the countries of the European Union obtained from Eurostat. The data can be found in Supplementary Materials. Financial indicators determine the types of financial assets and liabilities, determine the risk of financial assets or provide information on bank regulation. The justification of financial data in capital market analyses confirms, for example, Lierse and Seelkopf (2016) and Martinez and Philippon (2019). The econometric model used by Barbu and Strachinaru examines the capital union and its potential effect on the overall European financial market. Based on the combination of macroeconomic and financial data from the Eurozone and the EU, they have found that the capital union removes investment barriers, increases competitiveness, and reduces the cost of capital to enterprises (Barbu and Strachinaru 2016).
Based on time series of major financial indicators, we have divided indicators into four basic groups:
- Households;
- Financial institutions;
- Non-financial institutions;
- Total economy.
For all groups, we analyzed the following indicators:
- Short-term debt securities;
- Equity listed shares;
- Unlisted shares;
- Investment fund shares;
- Insurance, Pensions, and Standardized guarantees.
From the database, we have omitted variables such as Currency, Deposits, Long-term and Short-term loans, and others, as these indicators are not directly related to the capital market. From the original data, we excluded the countries Luxembourg, Ireland, Malta, the Netherlands, and Cyprus. These countries, in all cases (households, financial institutions, etc.), formed separate clusters or were in one cluster. Luxembourg is the richest country in Europe and achieves extreme values within the set, and, therefore, cannot enter the cluster analysis as it distorts the final result. The rest of the countries are tax havens, respectively; countries that attract institutions from all over the world through tax policy. Companies in these countries are in a legal form to minimize tax liability and this fact causes further distortion of the results, and we have, therefore, decided not to include the countries in the research.
During the analysis, we also came across 2 specific countries, namely Norway and the United Kingdom. Through the Agreement on the European Economic Area, Norway is part of the European single market and also participates in some EU programs, but without voting rights. These are, in particular, the areas of business, environment, research and education. The Capital Markets Union project can be another step towards successful bilateral cooperation. Data from the United Kingdom were used, as the available data are from the period when the United Kingdom was part of the European Union.
To apply the analysis, we have selected cross-sectional data for the countries of the European Union in selected years. We created 4 data matrices, one for each year. In the selected years, we took 2007, which we considered being pre-crisis, 2009, when the financial crisis culminated, 2012 as a post-crisis year, and 2017, which from the point of view of availability represents the most up-to-date data. Since all the variables for each group are listed as a percentage of GDP, it is not necessary to standardize the data before applying the analysis. The individual groups in each year are described by a data matrix of the dimension , where n is the number of countries and m is the number of indicators.
For better illustration, we present average values for each indicator in each year (see Table 1, Table 2, Table 3 and Table 4), the following abbreviations are used:
- STDS: Short term debt securities;
- LTDS: Long term debt securities;
- EQ: Equity;
- LS: Listed shares;
- US: Unlisted shares;
- IFSU: Investment fund shares units;
- IPSG: Insurance, pensions and standardised guarantees.
From these data matrices, we calculate for each pair of countries the Euclidean distance of the corresponding ratios given by:
where represents the distance between the country a and the country b, m represents the number of indicators and represents the value of the indicator i of country a. By computing the Euclidean distance, we get from a data matrix of the dimension a data matrix of , where the value in the i-th row and the j-th column represents the distance between the country i and j. This distance matrix is symmetric with zeros on the main diagonal. In this way, we calculate the distance matrices for each group in selected years. From the distance matrices, by applying Ward’s clustering method, we associate individual countries with specific clusters. We consider 3 clusters in sequence; the classification results are given in the Appendix A.
Ward’s clustering method, in combination with the Euclidean distance in practice, is the most commonly used combination in terms of cluster analysis application. Ward’s method does not calculate the distance between clusters, but clusters are formed by maximizing homogeneity within cluster (sum of squares of deviations from the cluster average inside the cluster). It is a method of minimal variance and represents an agglomerative hierarchical clustering method. In this method, the similarity of objects or clusters is measured as the sum of squares between two clusters, summed over all the attributes of the given objects. In this method, we try to minimize the sum of variances through all the newly created clusters. The algorithm ensures that this method leads to the formation of clusters of relatively the same size and shape, which is considered to be its greatest advantage over others.
In this way, it is possible to compare the classification of countries into different clusters in different groups and years. In this case, it is interesting to see which countries are clustered together, depending on the group. We receive a different cluster for households and for example for non-financial corporations.
4. Results
We analyze the results by groups. As mentioned, countries with a tax incentive were not part of the research, because they affected the results mainly for the “financial institutions” and “non-financial institutions” groups and, therefore, the overall economy. The result of the analysis is to create three clusters. Our goal was to find the smallest number of clusters, as we are looking for countries that have as many of the characteristics of a similar capital market as they can create a cluster (one group). The long-term goal is for all countries to be integrated and create a united union, and so it is necessary to find as many common elements as possible for the union.
4.1. Households
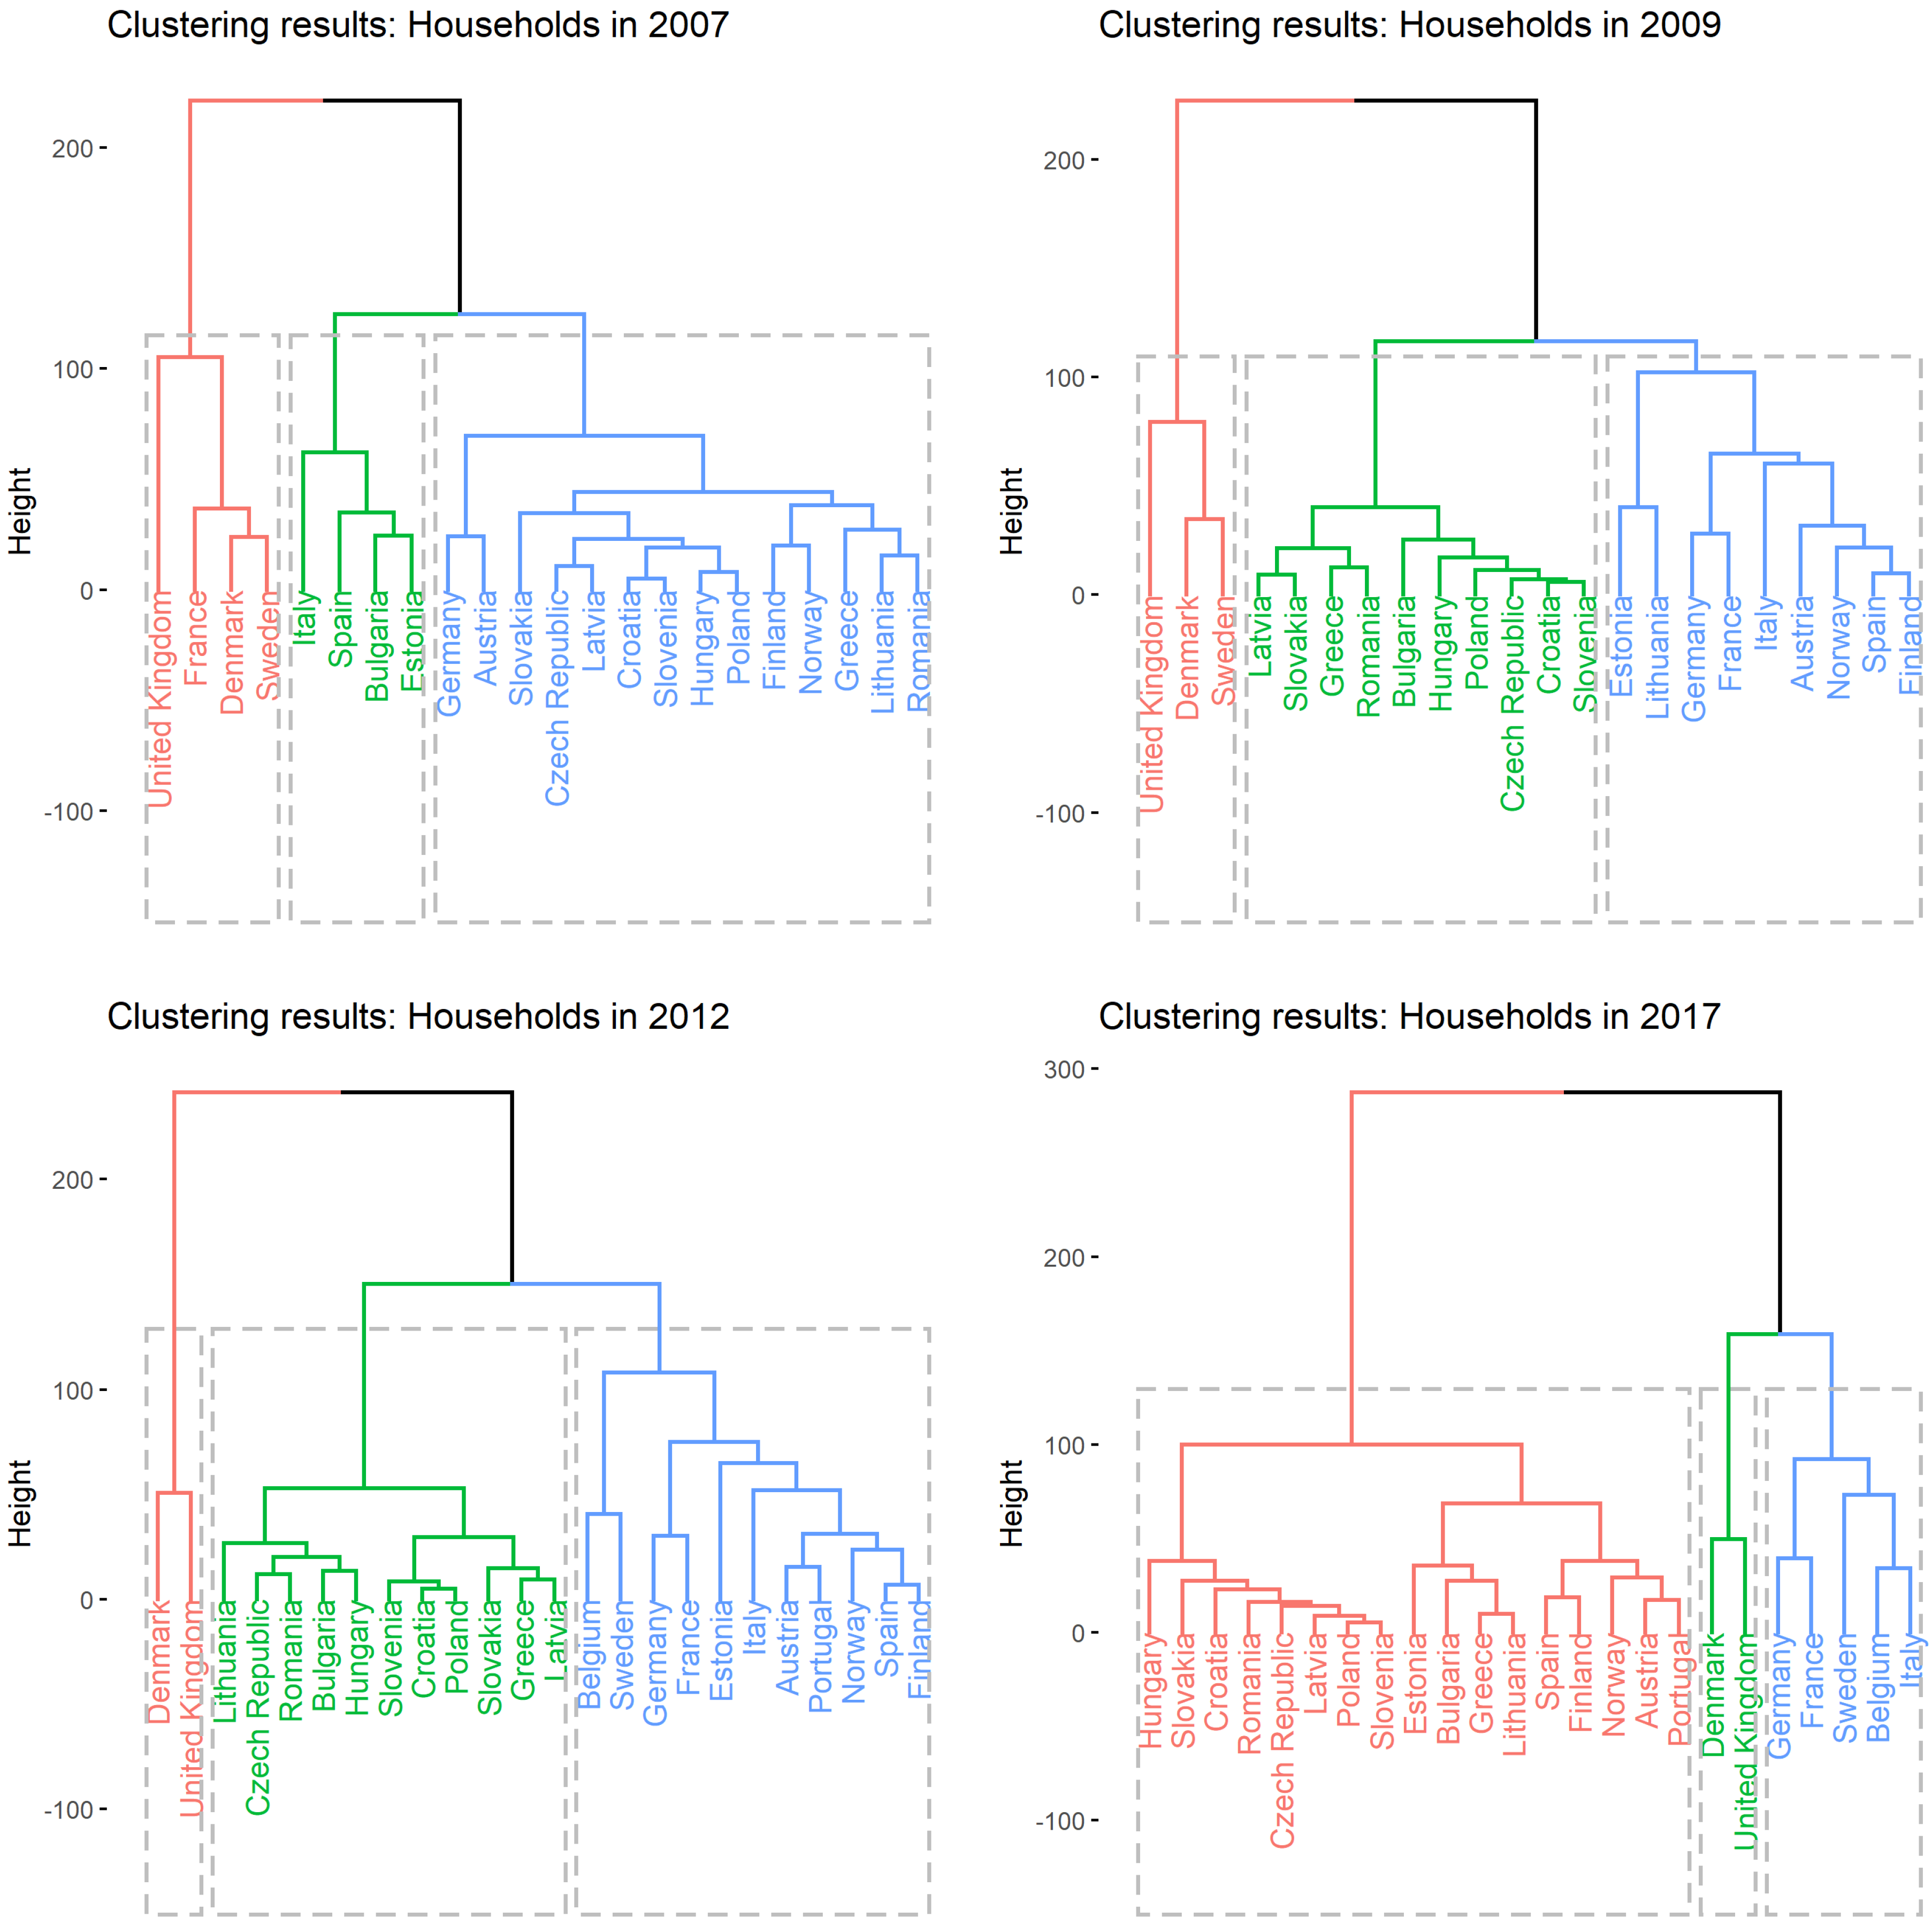
We are following two relatively homogeneous groups of countries—before the financial crisis, the first group was formed of the United Kingdom together with France, Denmark, and Sweden, and the second group of the remaining country with the decisive position of Italy. After the crisis (and especially after 2012), the position of the United Kingdom has been significantly weakened. The pace of the capital market is determined by a group of countries comprising Germany–France–Belgium–Sweden–Italy. The second group of countries did not change significantly. Post-Communist countries are located at the end of the list of European countries and also are Southern European countries (except Italy). Post-Communist countries are worse from a household perspective than from the perspective of the overall economy, and we are confronted with the paradox that there is growth in the economies (higher GDP, lower unemployment, etc.) in post-communist countries, but households do not feel it. Results can be seen in Figure 2.
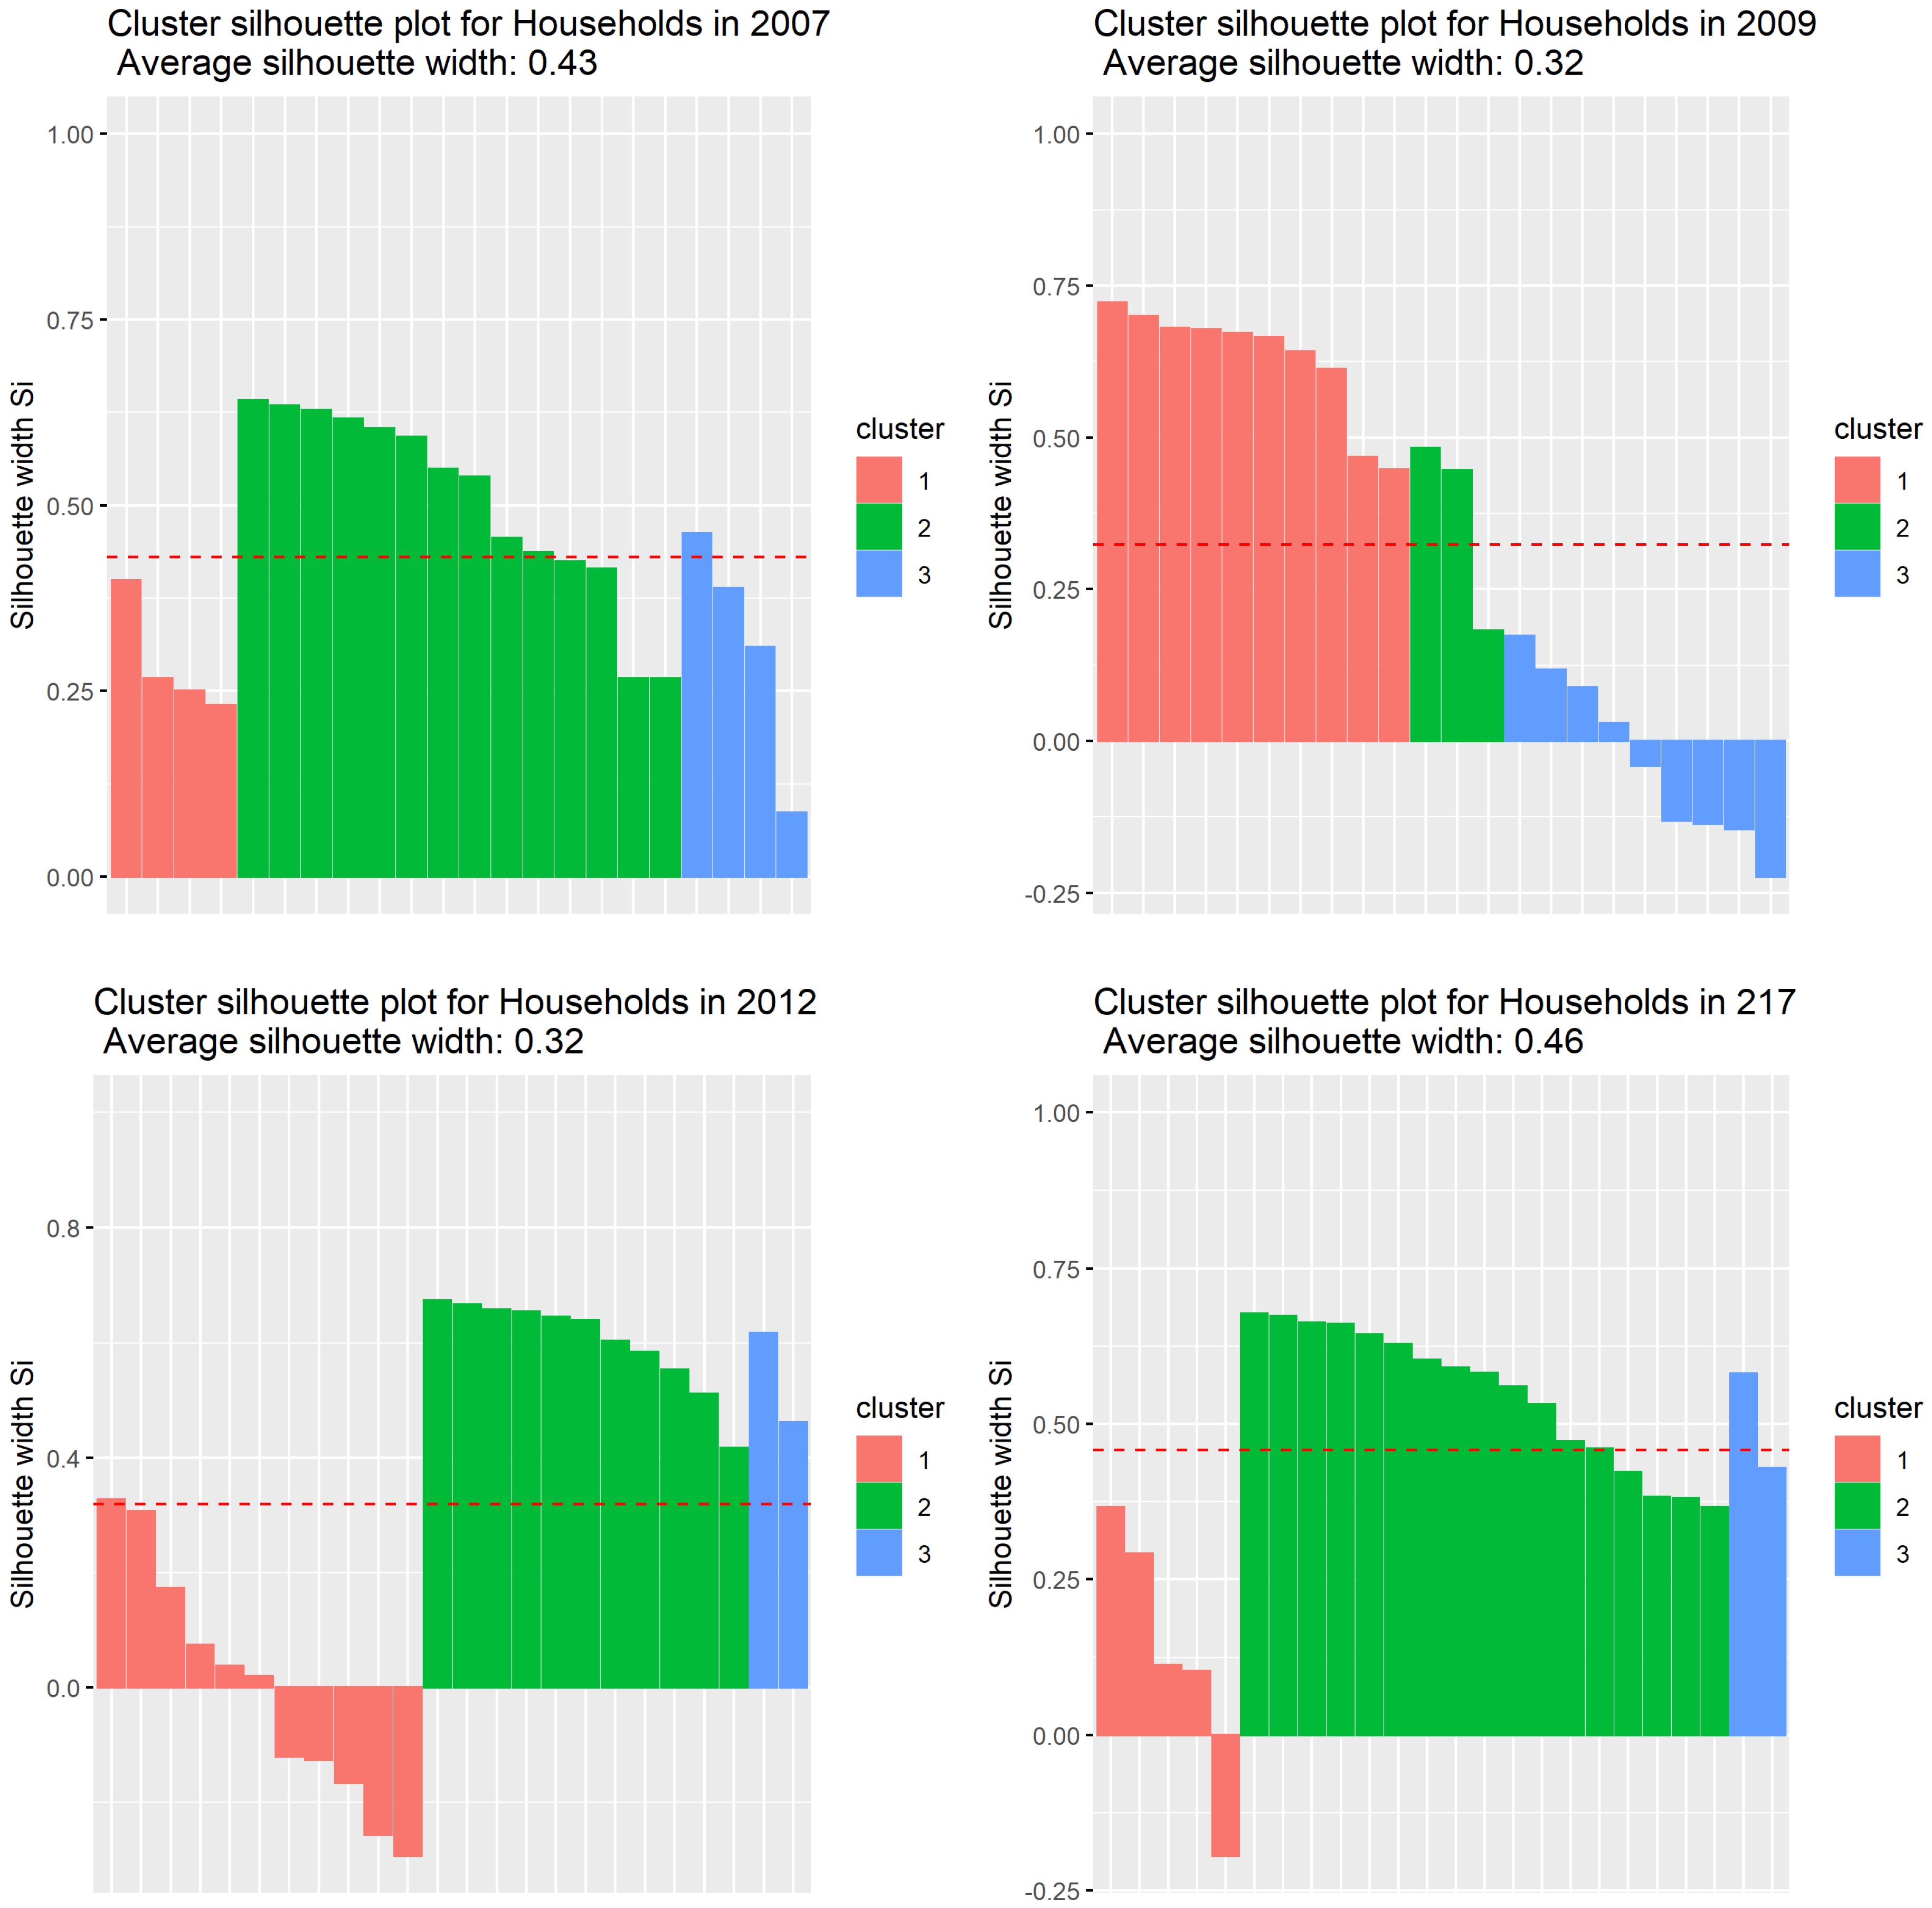
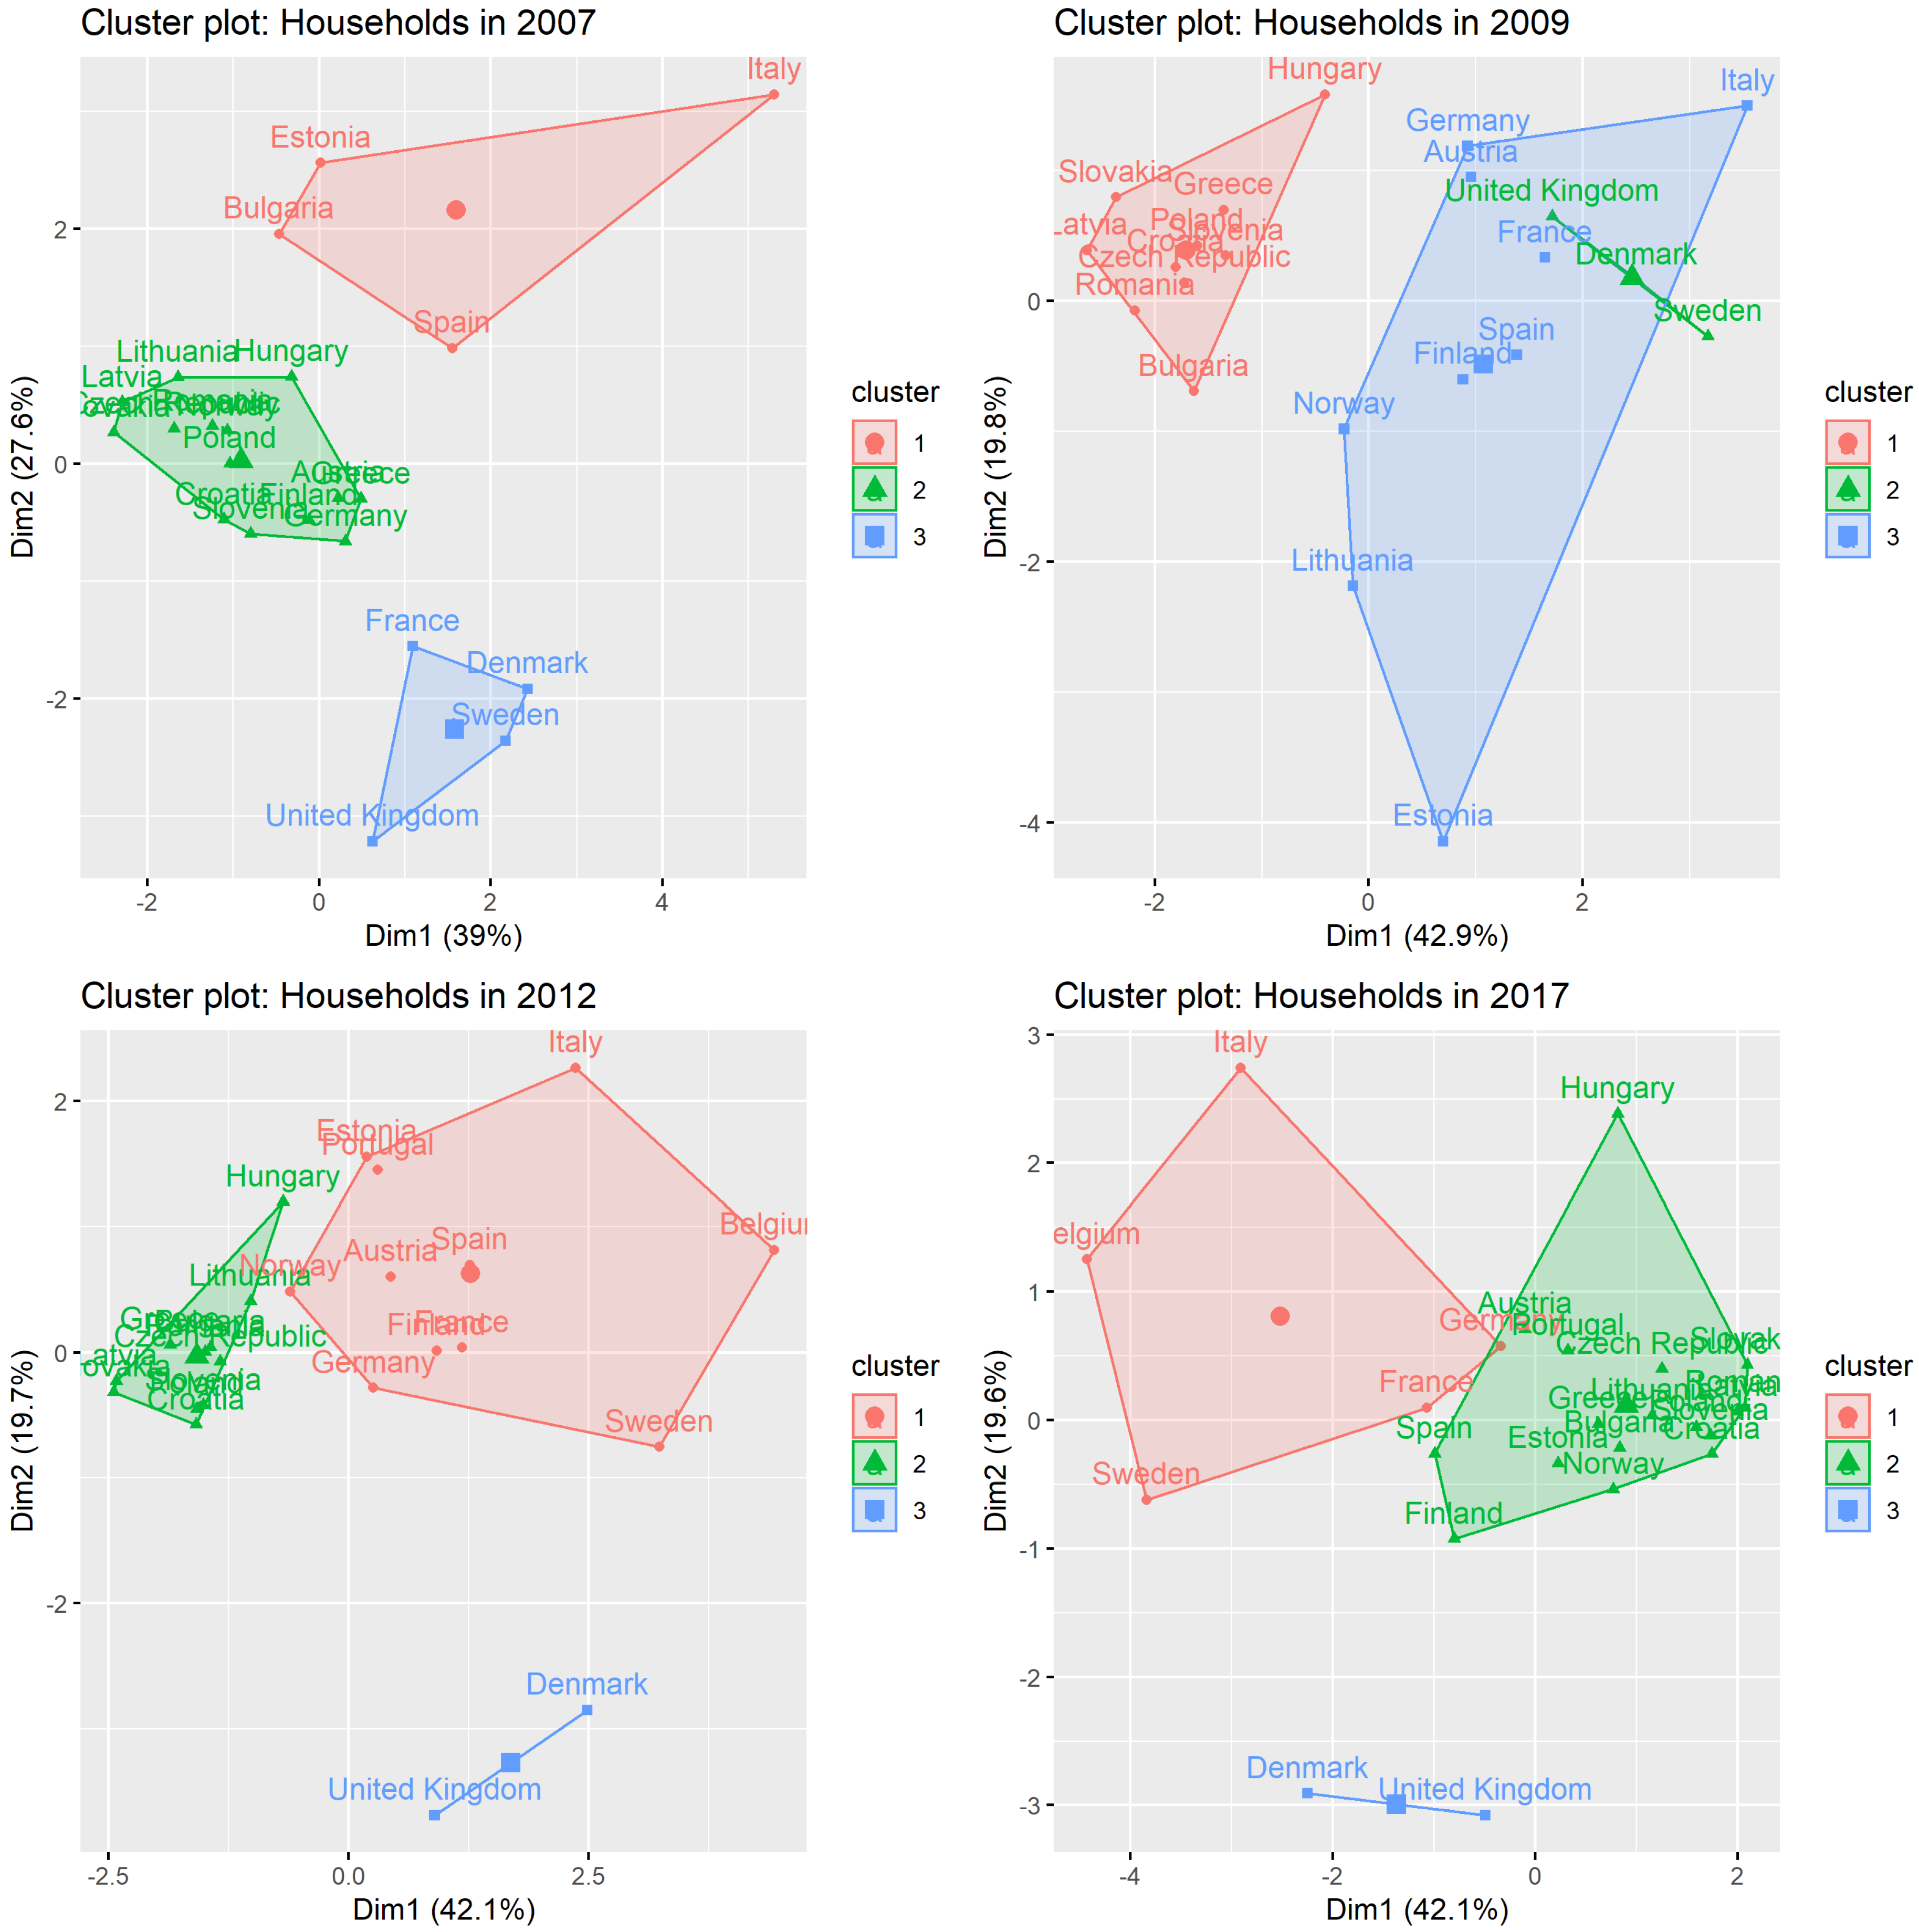
In the case of the household sector, we also present a silhouette plot and a cluster plot, on which it is possible to see the overlap of individual clusters.
Silhouette refers to a method of interpretation and validation of consistency within clusters of data. The technique provides a succinct graphical representation of how well each object has been classified.
The silhouette value is a measure of how similar an object is to its own cluster (cohesion) compared to other clusters (separation). The silhouette ranges from −1 to +1, where a high value indicates that the object is well matched to its own cluster and poorly matched to neighbouring clusters. If most objects have a high value, then the clustering configuration is appropriate. If many points have a low or negative value, then the clustering configuration may have too many or too few clusters (Rousseeuw 1987). Graphs mentioned are shown in Figure 3.
Cluster plots showing the assignment of individual objects to clusters are shown in Figure 4.
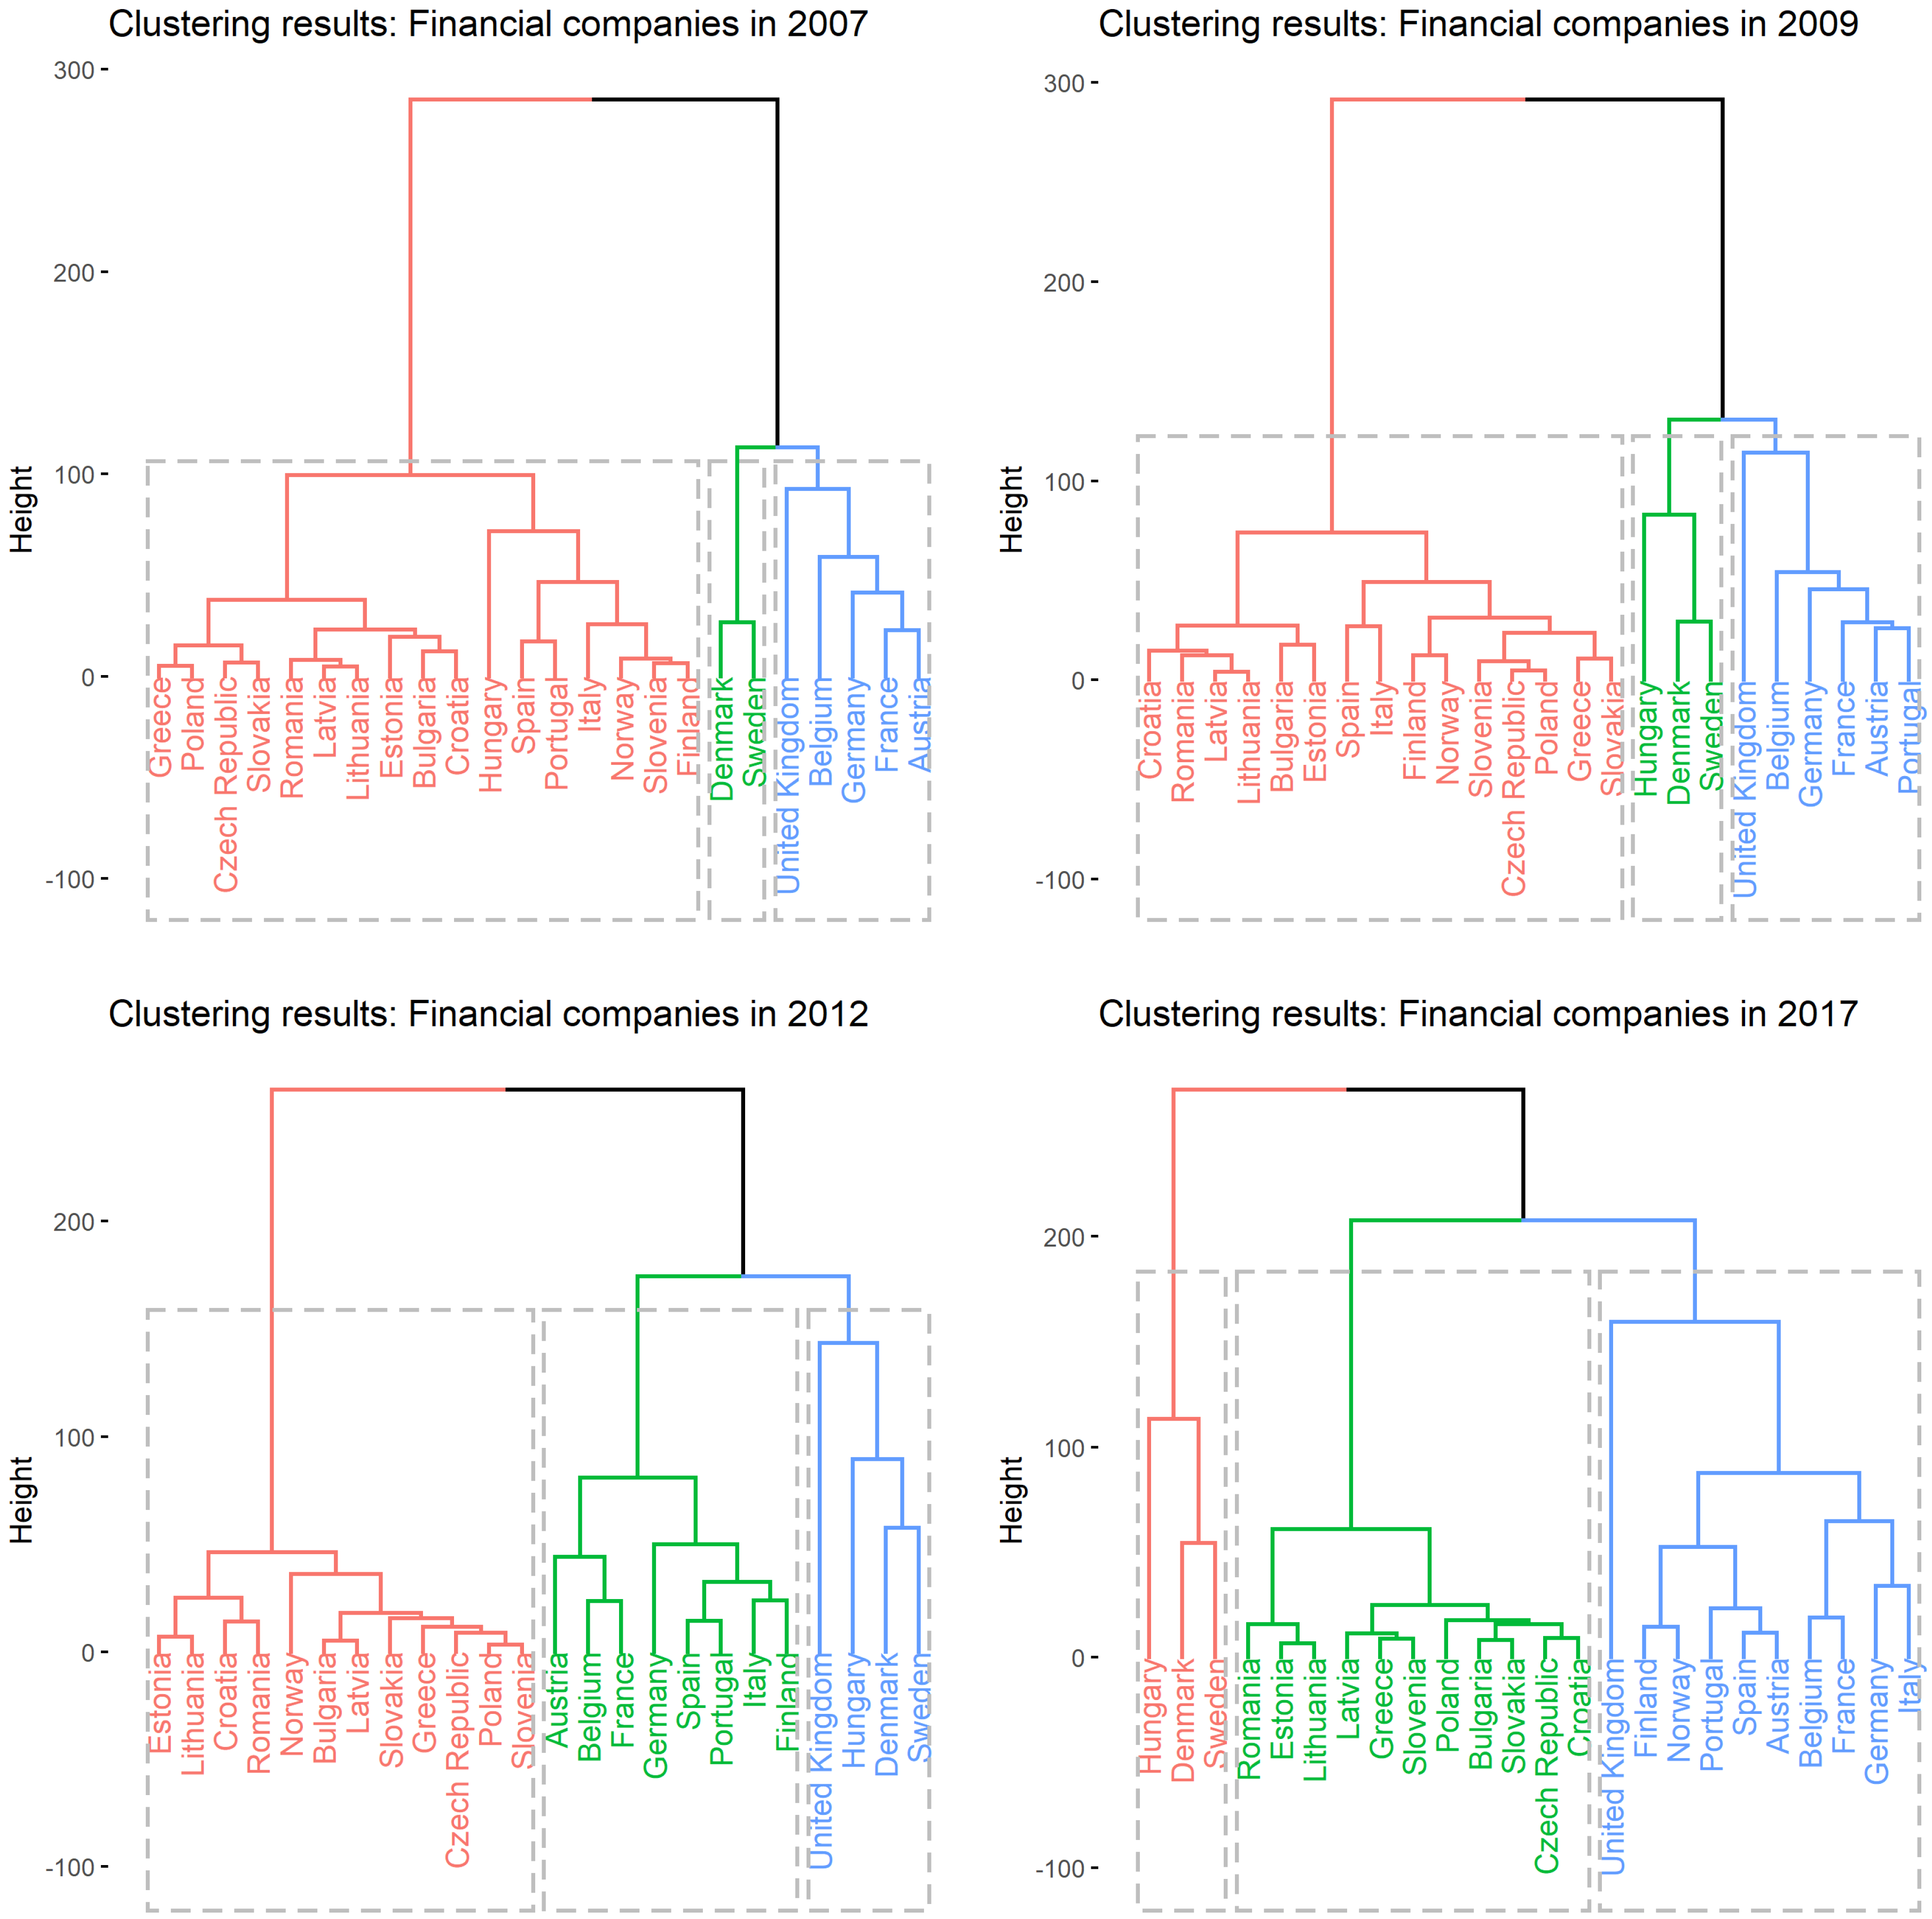
4.2. Financial Institutions
During the financial crisis (from 2007 to 2009), the performance of the financial sector in the member countries can be divided into two groups:
- The Western European countries—the decisive position of the United Kingdom and the Nordic countries that do not have a common European currency;
- A group of countries in southern and eastern Europe whose economic performance increases year-on-year at the same pace.
After the financial crisis, the efficiency of the financial sector has changed, although the United Kingdom still has a dominant position among all member states. After 2012, three groups of countries are characterized by:
- Central European countries and the Baltic States (more homogeneous);
- Western and Southern European countries (similar development to the United Kingdom) (there are minor differences between Group A and Group B countries);
- Other countries—Hungary, Denmark, and Sweden—that before the crisis belonged to the more powerful group now formed a separate group, which is far removed from the group of Western countries and the United Kingdom. Hungary was forced to use the IMF assistance (EUR 25 billion) after the crisis to help them get out of the crisis and reflect on the common monetary policy in the future. The common feature of these countries is that they do not use the euro currency. The euro was strengthened against the Danish krone and the Hungarian forint, which would make us believe that the Eurozone countries would gain more from the common currency than the non-Eurozone countries’ economic growth was stagnating. Results can be seen in Figure 5.
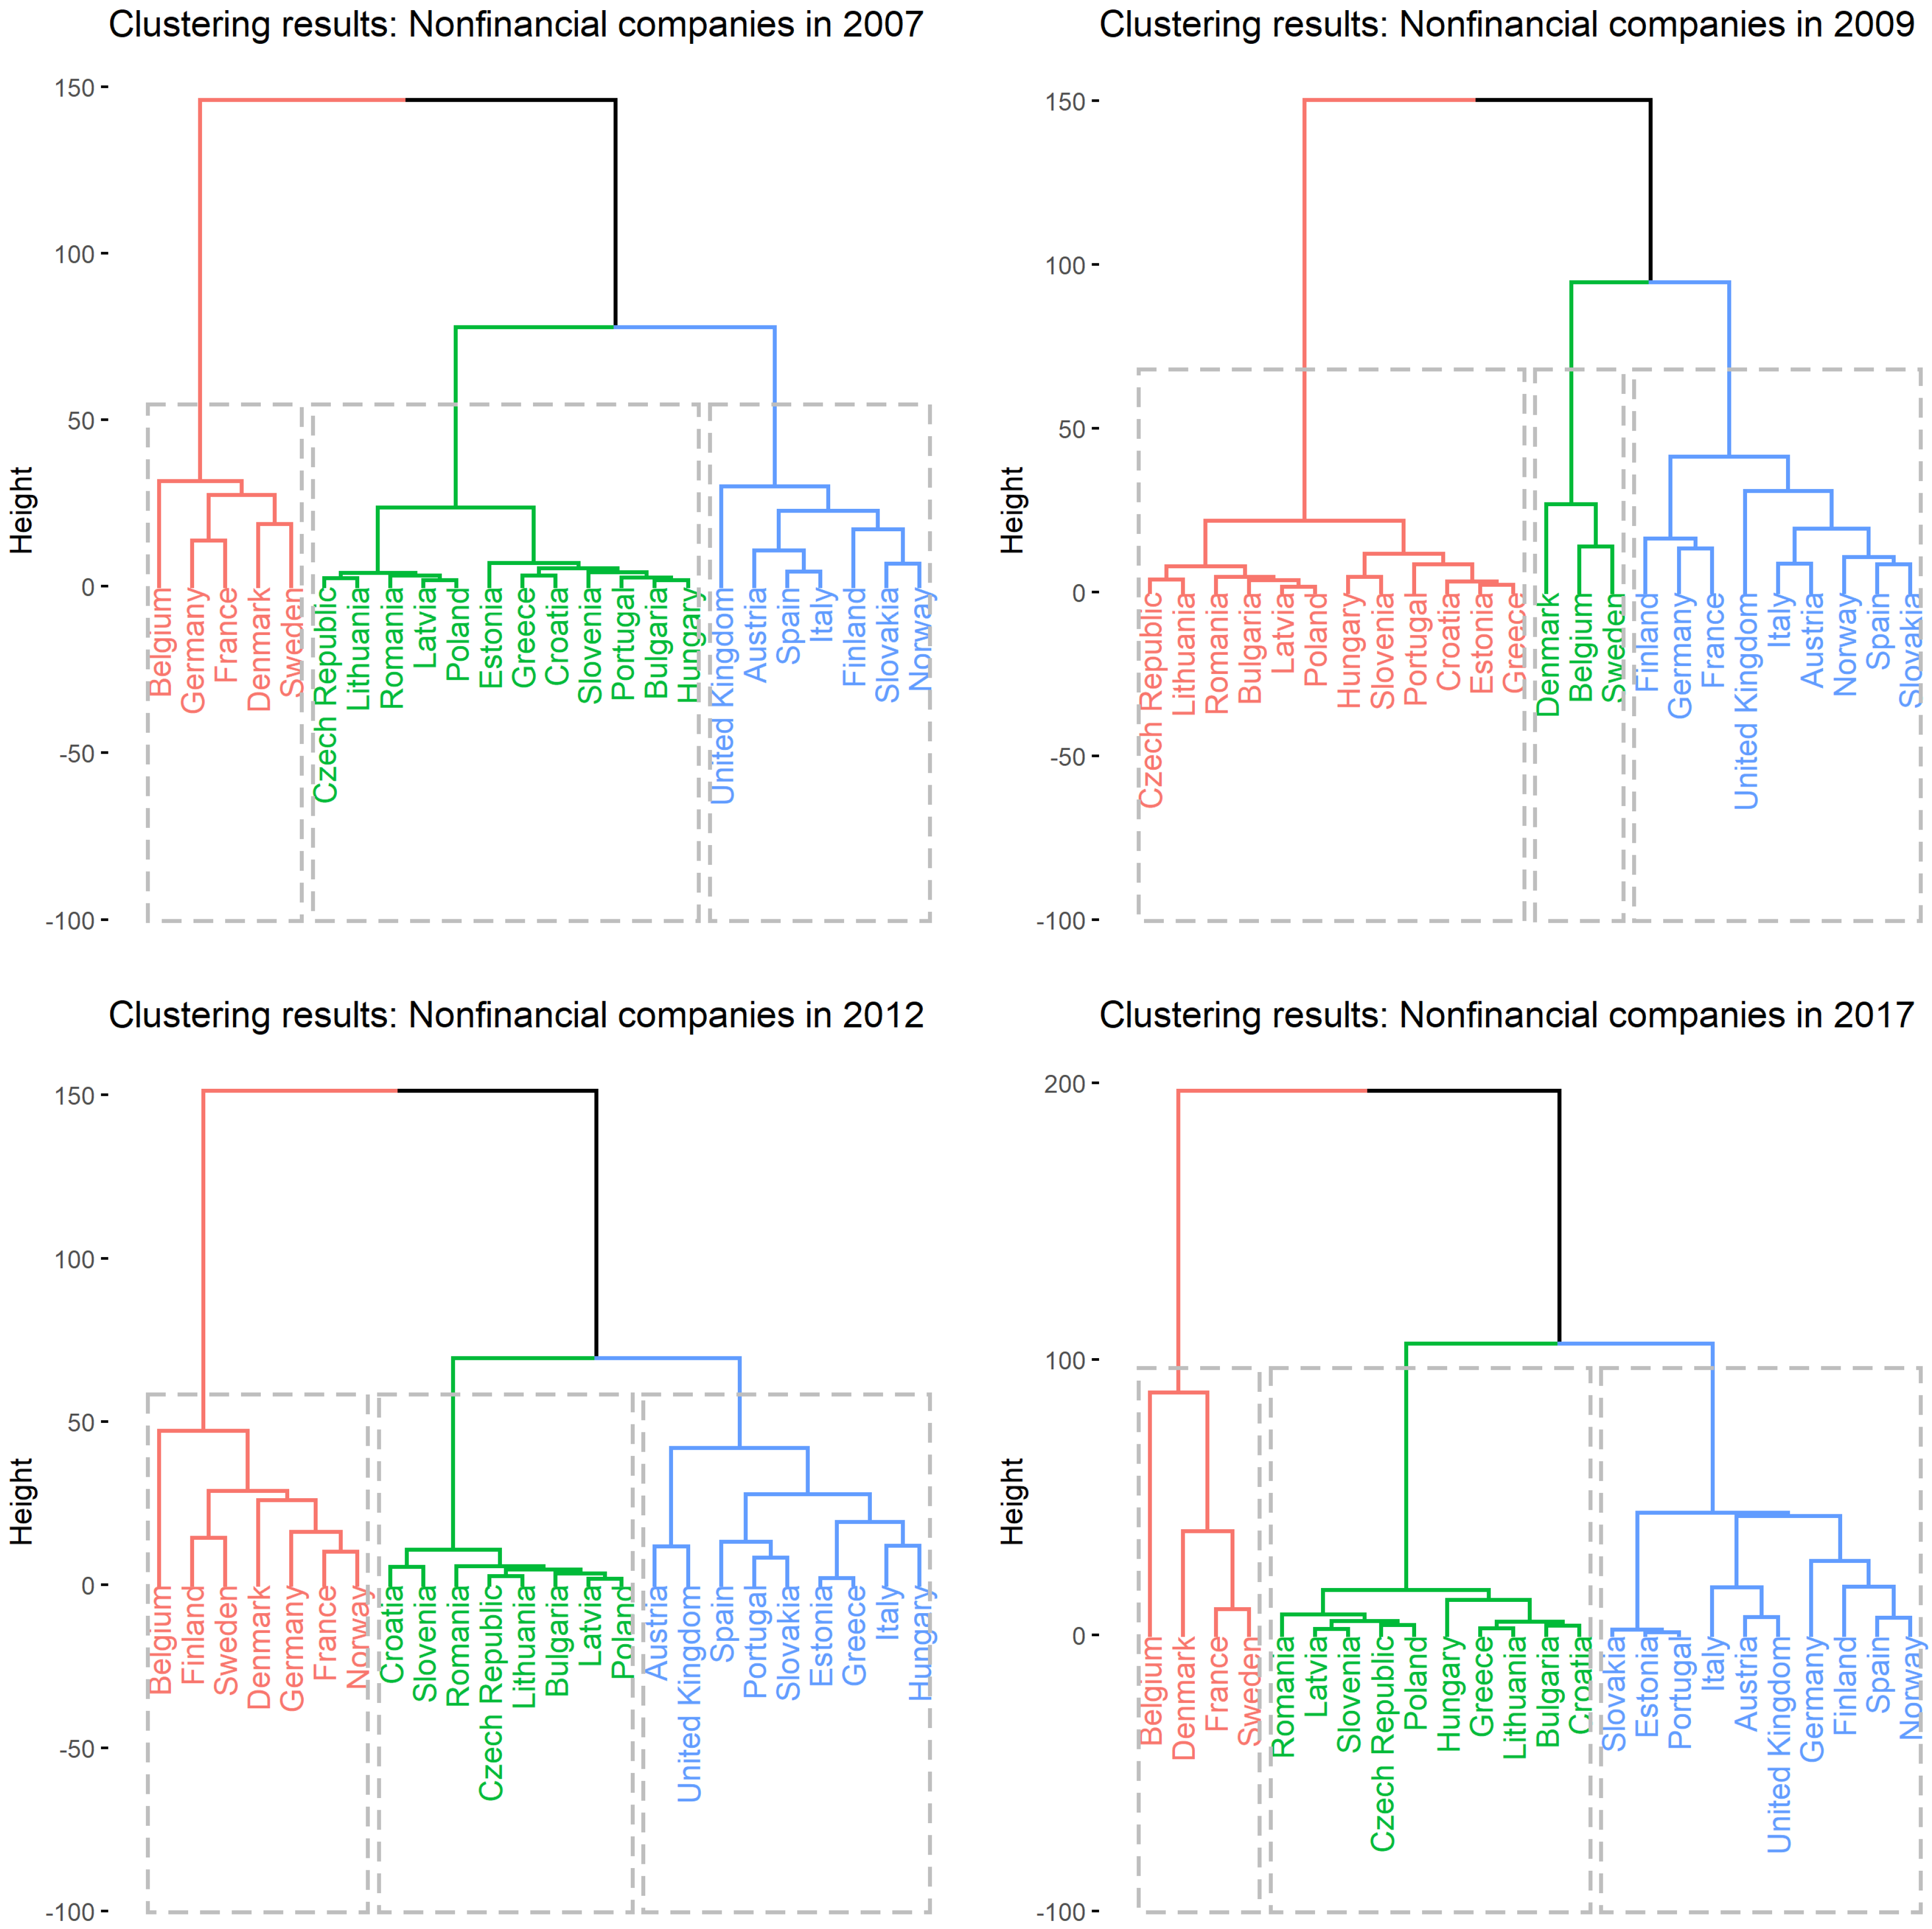
4.3. Non-Financial Institutions
With regard to the development of the non-financial sector, the financial crisis has not significantly changed the distribution of individual member countries. Countries are more homogeneous in this sector than in the financial sector.
Special attention may be attributed to Belgium, which has weakened the trend of Western countries (as a result of the growing public debt of the country) as a result of the crisis. Belgium after the crisis is again one of the countries that determine the decisive direction in the non-financial sector (from 2012 to 2017 the value of the Belgian index BEL20 has doubled from 2000 points to 4000 points). Results can be seen in Figure 6.
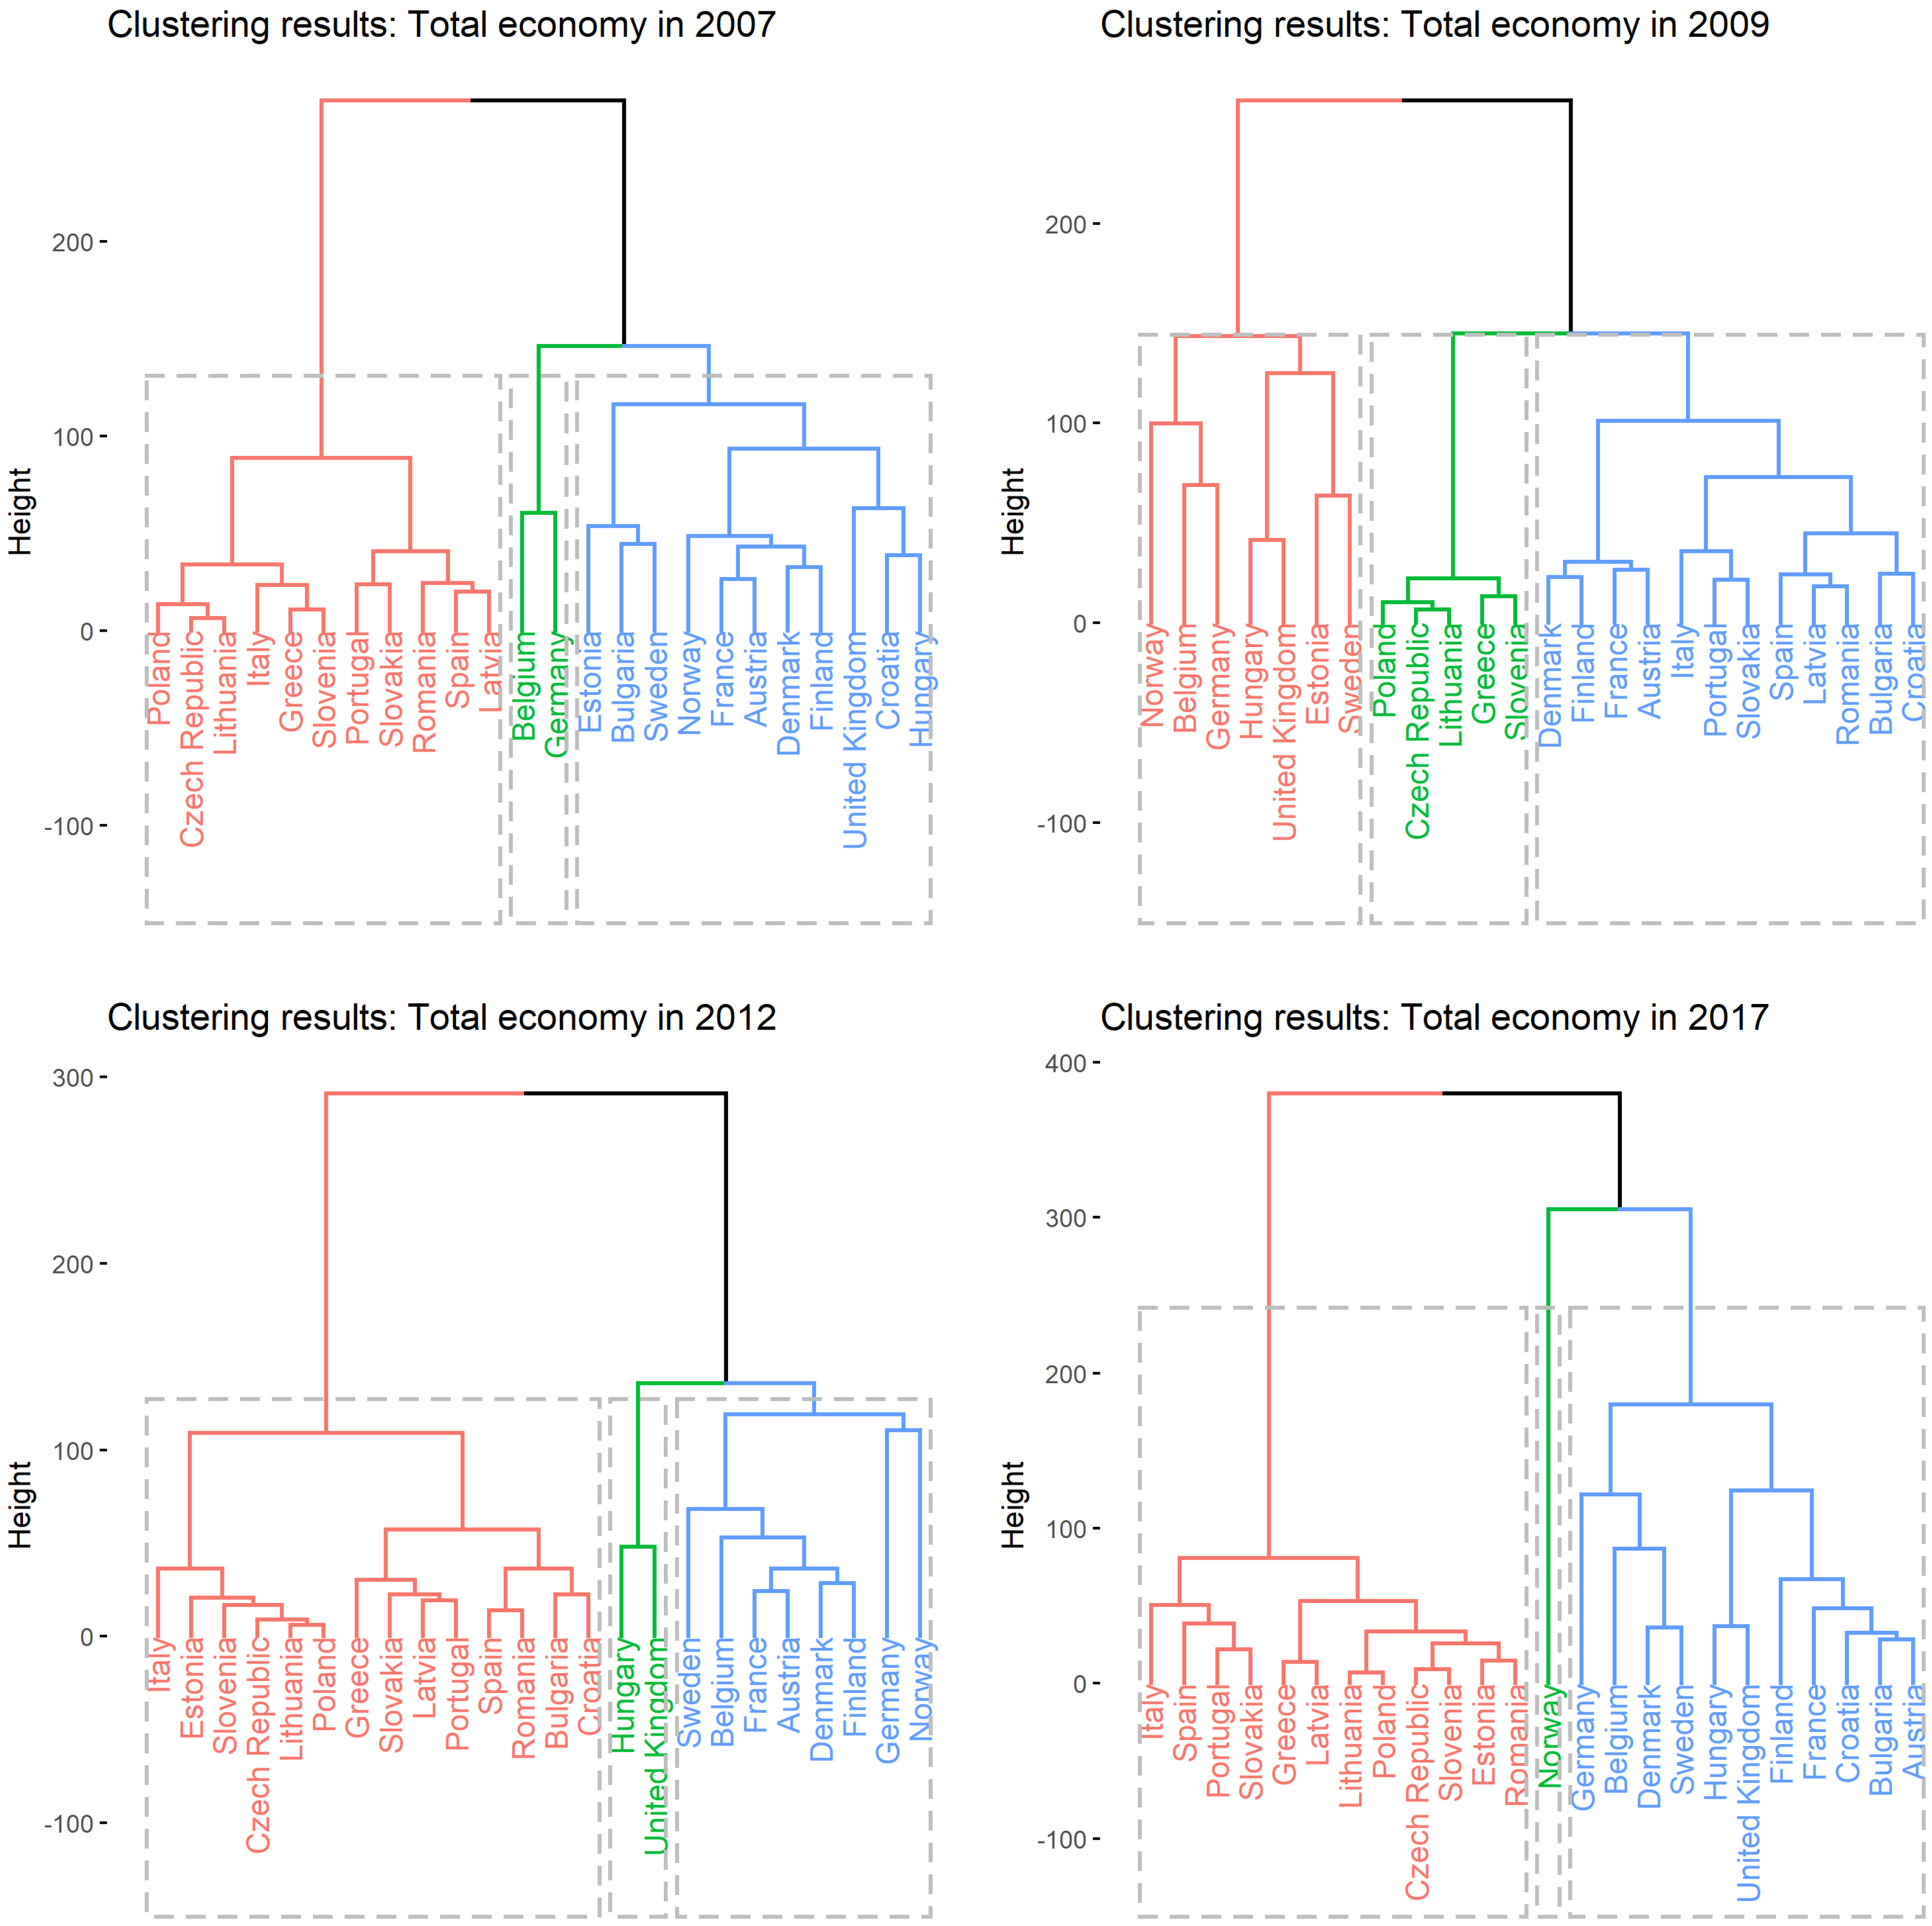
4.4. Total Economy
The development of overall macroeconomic stability (and the development of selected financial indicators) in the reference period from 2007 to 2017 shows that Germany has contributed most to the capital market union, along with a group of countries, namely France, Finland, and Belgium. In the period under review, we recorded a higher segregation rate after 2009. Norway currently has a special status, as it is not a member of the European Union or, therefore, of the Eurozone. Results can be seen in Figure 7.
5. Conclusions
We can say that in a capital market union, the decisive influence of Western European countries (especially Germany) has been confirmed (mainly on the basis of financial sector developments). In addition to the countries of Western Europe, Nordic countries will also contribute to their overall stability. UK leadership weakens primarily due to Brexit (first signed in 2013 by Prime Minister David Cameron). The United Kingdom’s appearance in the European Union will have a negative impact on the integration of capital markets. The countries of Central, Southern, and Eastern Europe are grouped together in the second common group, are relatively similar/homogeneous, thanks to a common history (post-communist countries). For the success of the Capital Markets Union project, the fact that countries with a dominant position in the euro area (the common currency, euro, and its development in relation to other currencies can have a significant impact) will also be essential. The tax burden on both financial and non-financial companies plays a very important role. In particular, due to the tax burden, we have omitted some research countries, which is evidence that this element has a substantial impact on the capital market. Therefore, the harmonization of the tax burden within the European Union (or at least the Eurozone) has its justification even though the countries are strongly opposed to it; implementation of this measure is a question for the future.
The political implications of the introduction of a Capital Markets Union are unclear. On the one hand, countries can protest against further supervision, control, regulations and guidance beyond their borders. On the other hand, if the Capital Markets Union has a positive impact in terms of faster economic recovery, increased employment, living standards, capital availability and investment opportunities, it may have a positive impact. This would mean another successful project of the European Union that would promote the trust and cohesion of countries.
In further analyses, we plan to eliminate the shortcomings of this static clustering method and, instead of analyzing the values in a specific year, use the approach using dynamic time warping distance and then performing detailed and more dynamic cluster analysis.
Supplementary Materials
The following are available online at https://0-www-mdpi-com.brum.beds.ac.uk/article/10.3390/economies9020089/s1, Table S1: Financial data for the countries of the European Union.
Author Contributions
Conceptualization, J.D. and E.S.; methodology, J.D.; software, J.D.; validation, J.D. and E.S.; formal analysis, E.S.; investigation, E.S.; resources, E.S.; data curation, J.D. and E.S.; writing—original draft preparation, E.S.; writing—review and editing, J.D.; visualization, J.D.; supervision, J.D.; project administration, E.S. All authors have read and agreed to the published version of the manuscript.
Funding
This research received no external funding.
Data Availability Statement
Data supporting reported results can be found at https://appsso.eurostat.ec.europa.eu/nui/show.do?dataset=nasa_10_f_bs&lang=en.
Conflicts of Interest
The authors declare no conflict of interest.
Appendix A
In Appendix A, you can see the average values of individual indicators based on the three considered clusters. For better clarity, the following abbreviations are used:
- STDS: Short-term debt securities;
- LTDS: Long-term debt securities;
- EQ: Equity;
- LS: Listed shares;
- US: Unlisted shares;
- IFSU: Investment fund shares units;
- IPSG: Insurance, pensions and standardised guarantees.

Table A1.
Classification results for Financial Institutions in 2007.
| Cluster | STDS | LTDS | EQ | LS | US | IFSU | IPSG |
|---|---|---|---|---|---|---|---|
| 1 | 6.04 | 94.94 | 73.9 | 28.34 | 23.8 | 17.12 | 7.36 |
| 2 | 6.59 | 30.79 | 18.91 | 8.05 | NA | 2.66 | 0.25 |
| 3 | 4.9 | 48.7 | 103.3 | 55.3 | 46.55 | 3.2 | 0.35 |
Table A2.
Classification results for Financial Institutions in 2009.
| Cluster | STDS | LTDS | EQ | LS | US | IFSU | IPSG |
|---|---|---|---|---|---|---|---|
| 1 | 7.78 | 101.35 | 58.7 | 17.55 | 24.3 | 14.73 | 6.78 |
| 2 | 7.61 | 33.63 | 12.09 | 4.69 | NA | 2.42 | 0.23 |
| 3 | 8.23 | 57.97 | 104.03 | 29.33 | 33.17 | 6.2 | 0.4 |
Table A3.
Classification results for Financial Institutions in 2012.
| Cluster | STDS | LTDS | EQ | LS | US | IFSU | IPSG |
|---|---|---|---|---|---|---|---|
| 1 | 6.14 | 78.74 | 37.39 | 11.91 | 19.8 | 11.09 | 0.44 |
| 2 | 5.21 | 33.78 | 8.48 | 4.06 | NA | 2.37 | 0.3 |
| 3 | 6.65 | 82.45 | 108.93 | 27.85 | 33.75 | 17.3 | 10.75 |
Table A4.
Classification results for Financial Institutions in 2017.
| Cluster | STDS | LTDS | EQ | LS | US | IFSU | IPSG |
|---|---|---|---|---|---|---|---|
| 1 | 5.37 | 91.79 | 46.33 | 18 | 16.47 | 22.21 | 5.39 |
| 2 | 2.33 | 47.43 | 8.84 | 3.06 | 3.86 | 4.3 | 0.33 |
| 3 | 4.73 | 52.63 | 131.3 | 50 | 42.6 | 12.8 | 0.17 |
Table A5.
Classification results for Nonfinancial Institutions in 2007.
| Cluster | STDS | LTDS | EQ | LS | US | IFSU | IPSG |
|---|---|---|---|---|---|---|---|
| 1 | 1.1 | 2.82 | 57.12 | 10.58 | 38.92 | 6.28 | 1.8 |
| 2 | 0.44 | 0.68 | 7.7 | 1.39 | 4.45 | 0.92 | 0.73 |
| 3 | 0.57 | 1.81 | 31.37 | 2.24 | 15.34 | 2.23 | 1.81 |
Table A6.
Classification results for Nonfinancial Institutions in 2009.
| Cluster | STDS | LTDS | EQ | LS | US | IFSU | IPSG |
|---|---|---|---|---|---|---|---|
| 1 | 1 | 5.13 | 67.8 | 4.93 | 51.83 | 2.83 | 1.73 |
| 2 | 0.43 | 0.76 | 7.96 | 0.9 | 4.95 | 0.53 | 0.77 |
| 3 | 0.59 | 1.88 | 36.37 | 2.8 | 20.49 | 3.33 | 1.74 |
Table A7.
Classification results for Nonfinancial Institutions in 2012.
| Cluster | STDS | LTDS | EQ | LS | US | IFSU | IPSG |
|---|---|---|---|---|---|---|---|
| 1 | 0.63 | 4 | 51.6 | 3.97 | 40.01 | 3.96 | 2 |
| 2 | 0.14 | 0.46 | 5.25 | 0.35 | 2.49 | 0.69 | 0.79 |
| 3 | 0.44 | 2.3 | 27.18 | 1.92 | 11.57 | 0.98 | 1 |
Table A8.
Classification results for Nonfinancial Institutions in 2017.
| Cluster | STDS | LTDS | EQ | LS | US | IFSU | IPSG |
|---|---|---|---|---|---|---|---|
| 1 | 0.6 | 5.98 | 79.11 | 6.1 | 62.49 | 5.2 | 1.34 |
| 2 | 0.09 | 0.4 | 7.6 | 1.07 | 4.22 | 0.69 | 0.75 |
| 3 | 0.42 | 1.72 | 36.84 | 3.16 | 20.06 | 2.37 | 1.42 |
Table A9.
Classification results for Households in 2007.
| Cluster | STDS | LTDS | EQ | LS | US | IFSU | IPSG |
|---|---|---|---|---|---|---|---|
| 1 | 1.38 | 11.2 | 60.93 | 6.23 | 43.35 | 10.78 | 18.53 |
| 2 | 0.26 | 3.14 | 26.11 | 7.16 | 8.64 | 7.34 | 16.9 |
| 3 | 0.4 | 4.18 | 55.85 | 14 | 22.23 | 15.05 | 100.03 |
Table A10.
Classification results for Households in 2009.
| Cluster | STDS | LTDS | EQ | LS | US | IFSU | IPSG |
|---|---|---|---|---|---|---|---|
| 1 | 0.26 | 1.24 | 18.57 | 2.89 | 4.61 | 3.21 | 10.96 |
| 2 | 0.27 | 4.53 | 57.57 | 12.1 | 20.1 | 14.07 | 116.53 |
| 3 | 0.43 | 9.29 | 38.68 | 5.81 | 23.23 | 9.49 | 34.7 |
Table A11.
Classification results for Households in 2012.
| Cluster | STDS | LTDS | EQ | LS | US | IFSU | IPSG |
|---|---|---|---|---|---|---|---|
| 1 | 0.49 | 10.67 | 44.1 | 6.93 | 20.05 | 12.15 | 46.75 |
| 2 | 0.34 | 1.85 | 21.25 | 1.94 | 8.38 | 2.88 | 12.05 |
| 3 | 0.25 | 2.95 | 41.85 | 10.7 | 16.6 | 15.45 | 154.65 |
Table A12.
Classification results for Households in 2017.
| Cluster | STDS | LTDS | EQ | LS | US | IFSU | IPSG |
|---|---|---|---|---|---|---|---|
| 1 | 0.2 | 7.23 | 63.87 | 11.81 | 24.54 | 26.61 | 79.03 |
| 2 | 0.51 | 2.17 | 33.79 | 3.83 | 16.23 | 6.99 | 20.57 |
| 3 | 0.25 | 1.4 | 50.2 | 14.9 | 18.95 | 19 | 171.2 |
Table A13.
Classification results for Total Economy in 2007.
| Cluster | STDS | LTDS | EQ | LS | US | IFSU | IPSG |
|---|---|---|---|---|---|---|---|
| 1 | 3.95 | 97.25 | 115.8 | 45.55 | 49.95 | 40.5 | 32.7 |
| 2 | 6.17 | 42.83 | 86.58 | 24.82 | 34.24 | 8.17 | NA |
| 3 | 4.44 | 26.15 | 24.93 | 5.96 | NA | 4.6 | 1.86 |
Table A14.
Classification results for Total Economy in 2009.
| Cluster | STDS | LTDS | EQ | LS | US | IFSU | IPSG |
|---|---|---|---|---|---|---|---|
| 1 | 4.94 | 77.09 | 82.84 | 29.29 | 40.87 | 17.01 | NA |
| 2 | 5.75 | 29.07 | 30.92 | 4.26 | NA | 3.86 | 3.73 |
| 3 | 8.48 | 34.2 | 120.28 | 13.13 | 43.53 | 9.43 | 3.28 |
Table A15.
Classification results for Total Economy in 2012.
| Cluster | STDS | LTDS | EQ | LS | US | IFSU | IPSG |
|---|---|---|---|---|---|---|---|
| 1 | 3.24 | 70.39 | 93.48 | 33.7 | 47.3 | 21.45 | NA |
| 2 | 3.78 | 29.89 | 31.87 | 4.56 | NA | 5.17 | 4.76 |
| 3 | 4.35 | 40.8 | 131.85 | 3 | 2.15 | 7.8 | 0.25 |
Table A16.
Classification results for Total Economy in 2017.
| Cluster | STDS | LTDS | EQ | LS | US | IFSU | IPSG |
|---|---|---|---|---|---|---|---|
| 1 | 3.85 | 55.96 | 108.2 | 26.52 | 42.06 | 26.79 | 11.46 |
| 2 | 1.49 | 36.83 | 23.4 | 4.56 | 12.47 | 11.48 | 2.52 |
| 3 | 2.9 | 117.2 | 231.2 | 203 | 25.8 | 7.9 | 0.4 |
References
- Acharya, Viral V., and Sascha Steffen. 2016. Capital markets union in Europe: Why other unions must lead the way. Swiss Journal of Economics and Statistics 4: 319–29. [Google Scholar] [CrossRef] [Green Version]
- Adam, Klaus, Tullio Jappelli, Annamaria Menichini, Mario Padula, and Marco Pagano. 2002. Analyse, Compare, and Apply Alternative Indicators and Monitoring Methodologies to Measure the Evolution of Capital Market Integration in the European Union. Report to the European Commission 2020: 1–95. [Google Scholar]
- Agenor, Pierre-Richard. 2001. Benefits and Costs of International Financial Integration: Theory and Facts; Policy Research Working Paper Series; The World Bank. Available online: https://documents1.worldbank.org/curated/en/240401468766831345/pdf/multi0page.pdf (accessed on 22 February 2021).
- Akhtar, Tahir. 2021. Market multiples and stock returns among emerging and developed financial markets. Borsa Istanbul Review 1: 44–56. [Google Scholar] [CrossRef]
- Akyol, Ali C., Tommy Cooper, Michele Meoli, and Silvio Vismara. 2014. Do regulatory changes affect the underpricing of European IPOs? Journal of Banking & Finance 45: 43–58. [Google Scholar]
- Alexander, Kern. 2015. Capital Markets Union from the perspective of the banking industry and prudential supervision. Law and Financial Markets Review 34: 191–95. [Google Scholar] [CrossRef]
- Anderson, Niki, Lewis Webber, Joseph Noss, Daniel Beale, and Liam Crowley-Reidy. 2015. The resilience of financial market liquidity. Bank of England Financial Stability Paper 34: 1–32. [Google Scholar]
- Barbu, Teodora Cristina, and Adina Ionela Străchinaru. 2016. Capital Markets Union: Opportunities and Impact on the European Financial Market. Studies in Business and Economics 2: 140–57. [Google Scholar] [CrossRef] [Green Version]
- Benigno, Pierpaolo, and Federica Romei. 2014. Debt deleveraging and the exchange rate. Journal of International Economics 93: 1–16. [Google Scholar] [CrossRef] [Green Version]
- Boldeanu, Florin Teodor, and Ileana Tache. 2015. The Financial System of the EU and the Capital Markets Union. International Journal of Economics and Business Administration 3: 41–51. [Google Scholar]
- Brűhl, Volker, Helmut Gründl, Andreas Hackethal, Hans-Helmut Kotz, Jan Pieter Krahnen, and Tobias Tröger. 2015. Comments on the EU Commission’s Capital Markets Union Project. Available online: https://www.econstor.eu/bitstream/10419/110386/1/826101933.pdf (accessed on 12 March 2021).
- Burn, Lachlan. 2016. Capital Markets Union and regulation of the EU’s capital markets. Capital Markets Law Journal 3: 352–86. [Google Scholar] [CrossRef]
- Cúrdia, Vasco, and Michael Woodford. 2009. Conventional and Unconventional Monetary Policy. Staff Reports 404. New York: Federal Reserve Bank of New York. [Google Scholar]
- Dorn, Nicholas. 2016. Capital cohabitation: EU Capital Markets Union as public and private co-regulation. Capital Markets Law Journal 1: 84–102. [Google Scholar] [CrossRef]
- Eggertsson, Gauti B., and Paul Krugman. 2012. Debt, deleveraging, and the liquidity trap: A Fisher-Minsky-Koo approach. The Quarterly Journal of Economics 3: 1469–513. [Google Scholar] [CrossRef] [Green Version]
- Ertürk, Ismail. 2015. Challenges of financialised firm behaviour for Capital Markets Union. Law and Financial Markets Review 3: 196–201. [Google Scholar] [CrossRef]
- European Union. 2021. The History of the European Union. An Official Website of the European Union. Available online: https://europa.eu/european-union/about-eu/history_en (accessed on 2 April 2021).
- Gertler, Mark, and Nobuhiro Kiyotaki. 2010. Financial intermediation and credit policy in business cycle analysis. In Handbook of Monetary Economics. Elsevier: Amsterdam, The Netherlands, pp. 547–99. [Google Scholar]
- Knudsen, Ann-Christina L. 2015. European Union History in Research Methods in European Union Studies. Palgrave Studies in European Union Politics. Basingstoke: Palgrave Macmillan, pp. 37–52. [Google Scholar]
- Lierse, Hanna, and Laura Seelkopf. 2016. Capital markets and tax policy making: A comparative analysis of European tax reforms since the crisis. Comparative European Politics 5: 686–716. [Google Scholar] [CrossRef]
- Martinez, Joseba, Thomas Philippon, and Markus Sihvonen. 2019. Does a Currency Union Need a Capital Market Union? Risk Sharing via Banks and Markets. Working Paper 26026. National Bureau of Economic Research. Available online: https://www.nber.org/system/files/working_papers/w26026/w26026.pdf (accessed on 2 April 2021).
- Marty, Olivier. 2014. Capital-Markets Union: Tentative shape and priorities. Fondation Robert Schuman European Issues 335: 1–53. [Google Scholar]
- Micheler, Eva. 2016. Building a Capital Markets Union: Improving the Market Infrastructure. European Business Organization Law Review 4: 481–95. [Google Scholar] [CrossRef] [Green Version]
- Moloney, Niamh. 2016. Capital markets union: “Ever closer union” for the EU financial system. European Law Review 3: 307–37. [Google Scholar]
- Nardo, Michela, Elisa Ossola, and Evangalia Papanagiotou. 2021. Financial integration in the EU28 equity markets: Measures and drivers. Journal of Financial Markets, 100633. [Google Scholar] [CrossRef]
- Quaglia, Lucia, David Howarth, and Moritz Liebe. 2016. The political economy of European capital markets union. Journal of Common Market Studies 1: 185–203. [Google Scholar] [CrossRef] [Green Version]
- Rousseeuw, Peter J. 1987. Silhouettes: A Graphical Aid to the Interpretation and Validation of Cluster Analysis. Computational and Applied Mathematics 20: 53–65. [Google Scholar] [CrossRef] [Green Version]
- Schammo, Pierre. 2017. Market Building and the Capital Markets Union: Addressing Information Barriers in the SME Funding Market. European Company and Financial Law Review 2: 271–313. [Google Scholar]
- Schmukler, Sergio L. 2004. Financial Globalization: Gain and Pain for Developing Countries. Federal Reserve Bank of Atlanta Economic Review 2: 39–66. [Google Scholar]
- Véron, Nicolas, and Guntram B. Wolff. 2016. Capital Markets Union: A vision for the long term. Journal of Financial Regulation 1: 130–53. [Google Scholar] [CrossRef] [Green Version]
Figure 1.
Market capitalization of listed domestic companies (% of GDP). Own processing in R based on data from World Bank.
Figure 1.
Market capitalization of listed domestic companies (% of GDP). Own processing in R based on data from World Bank.

Figure 2.
Cluster Analysis for Households: dendrogram. Own processing in R based on data from Eurostat.
Figure 2.
Cluster Analysis for Households: dendrogram. Own processing in R based on data from Eurostat.

Figure 3.
Cluster Analysis for Households: silhouette plot. Own processing in R based on data from Eurostat.
Figure 3.
Cluster Analysis for Households: silhouette plot. Own processing in R based on data from Eurostat.

Figure 4.
Cluster Analysis for Households: cluster plot. Own processing in R based on data from Eurostat.
Figure 4.
Cluster Analysis for Households: cluster plot. Own processing in R based on data from Eurostat.

Figure 5.
Cluster Analysis for Financial Sector: dendrogram. Own processing in R based on data from Eurostat.
Figure 5.
Cluster Analysis for Financial Sector: dendrogram. Own processing in R based on data from Eurostat.

Figure 6.
Cluster Analysis for Nonfinancial Sector: dendrogram. Own processing in R based on data from Eurostat.
Figure 6.
Cluster Analysis for Nonfinancial Sector: dendrogram. Own processing in R based on data from Eurostat.

Figure 7.
Cluster Analysis for Total Economy: dendrogram. Own processing in R based on data from Eurostat.
Figure 7.
Cluster Analysis for Total Economy: dendrogram. Own processing in R based on data from Eurostat.

Table 1.
Average values of selected indicators, Households.
| Year | STDS | LTDS | EQ | LS | US | IFSU | IPSG |
|---|---|---|---|---|---|---|---|
| 2007 | 0.49 | 4.79 | 37.85 | 8.24 | 17.42 | 9.37 | 32.31 |
| 2009 | 0.33 | 4.98 | 32.11 | 5.34 | 14.34 | 7.26 | 35.07 |
| 2012 | 0.40 | 5.98 | 33.44 | 4.95 | 14.41 | 8.18 | 39.84 |
| 2017 | 0.42 | 3.16 | 41.42 | 6.42 | 18.18 | 12.08 | 45.30 |
Table 2.
Average values of selected indicators, Financial institutions.
| Year | STDS | LTDS | EQ | LS | US | IFSU | IPSG |
|---|---|---|---|---|---|---|---|
| 2007 | 6.33 | 45.65 | 37.40 | 16.22 | - | 5.72 | 1.74 |
| 2009 | 7.73 | 53.60 | 35.23 | 10.98 | - | 5.97 | 1.89 |
| 2012 | 5.76 | 56.88 | 34.86 | 10.64 | - | 7.76 | 2.09 |
| 2017 | 3.89 | 66.56 | 39.77 | 15.15 | 13.95 | 12.83 | 2.42 |
Table 3.
Average values of selected indicators, Non-financial institutions.
| Year | STDS | LTDS | EQ | LS | US | IFSU | IPSG |
|---|---|---|---|---|---|---|---|
| 2007 | 0.62 | 1.45 | 24.90 | 3.55 | 14.81 | 2.42 | 1.27 |
| 2009 | 0.56 | 1.72 | 26.09 | 2.12 | 16.64 | 1.87 | 1.25 |
| 2012 | 0.40 | 2.18 | 26.99 | 2.00 | 16.84 | 1.75 | 1.22 |
| 2017 | 0.31 | 1.88 | 31.70 | 2.78 | 20.53 | 2.14 | 1.13 |
Table 4.
Average values of selected indicators, Total economy.
| Year | STDS | LTDS | EQ | LS | US | IFSU | IPSG |
|---|---|---|---|---|---|---|---|
| 2007 | 5.19 | 39.72 | 60.76 | 17.90 | - | 9.23 | - |
| 2009 | 5.97 | 43.93 | 60.95 | 13.04 | - | 8.62 | - |
| 2012 | 3.65 | 44.30 | 60.74 | 14.14 | - | 10.82 | - |
| 2017 | 2.63 | 48.94 | 70.92 | 22.89 | 26.58 | 18.35 | 6.53 |
Publisher’s Note: MDPI stays neutral with regard to jurisdictional claims in published maps and institutional affiliations. |
© 2021 by the authors. Licensee MDPI, Basel, Switzerland. This article is an open access article distributed under the terms and conditions of the Creative Commons Attribution (CC BY) license (https://creativecommons.org/licenses/by/4.0/).
Share and Cite
MDPI and ACS Style
Danko, J.; Suchý, E. The Financial Integration in the European Capital Market Using a Clustering Approach on Financial Data. Economies 2021, 9, 89. https://0-doi-org.brum.beds.ac.uk/10.3390/economies9020089
AMA Style
Danko J, Suchý E. The Financial Integration in the European Capital Market Using a Clustering Approach on Financial Data. Economies. 2021; 9(2):89. https://0-doi-org.brum.beds.ac.uk/10.3390/economies9020089
Chicago/Turabian StyleDanko, Jakub, and Erik Suchý. 2021. "The Financial Integration in the European Capital Market Using a Clustering Approach on Financial Data" Economies 9, no. 2: 89. https://0-doi-org.brum.beds.ac.uk/10.3390/economies9020089
Note that from the first issue of 2016, this journal uses article numbers instead of page numbers. See further details here.