
Has the Stereotype of the Scientist Changed in Early Primary School–Aged Students Due to COVID-19?


Abstract
:1. Introduction
- (1)
- Lab coat (usually but not necessarily white).
- (2)
- Eyeglasses.
- (3)
- Facial growth of hair (including beards, moustaches, or abnormally long sideburns).
- (4)
- Symbols of research: scientific instruments and laboratory equipment of any kind.
- (5)
- Symbols of knowledge: principally books and filing cabinets.
- (6)
- Technology: the “products” of science.
- (7)
- Relevant captions: formulae, taxonomic classification, the “eureka!” syndrome, etc.
- (8)
- Male gender.
- (9)
- Caucasian.
- (10)
- Indications of danger.
- (11)
- Presence of light bulbs.
- (12)
- Mythical stereotypes (Frankenstein, Jekyll/Hyde, etc.).
- (13)
- Indications of secrecy (“Private”, “Keep Out”), “Do not Enter”, “Go Away”, “Top Secret”, etc.).
- (14)
- Scientist doing work indoors.
- (15)
- Middle aged or elderly scientist.
2. Materials and Methods
2.1. Participants
2.2. Instruments
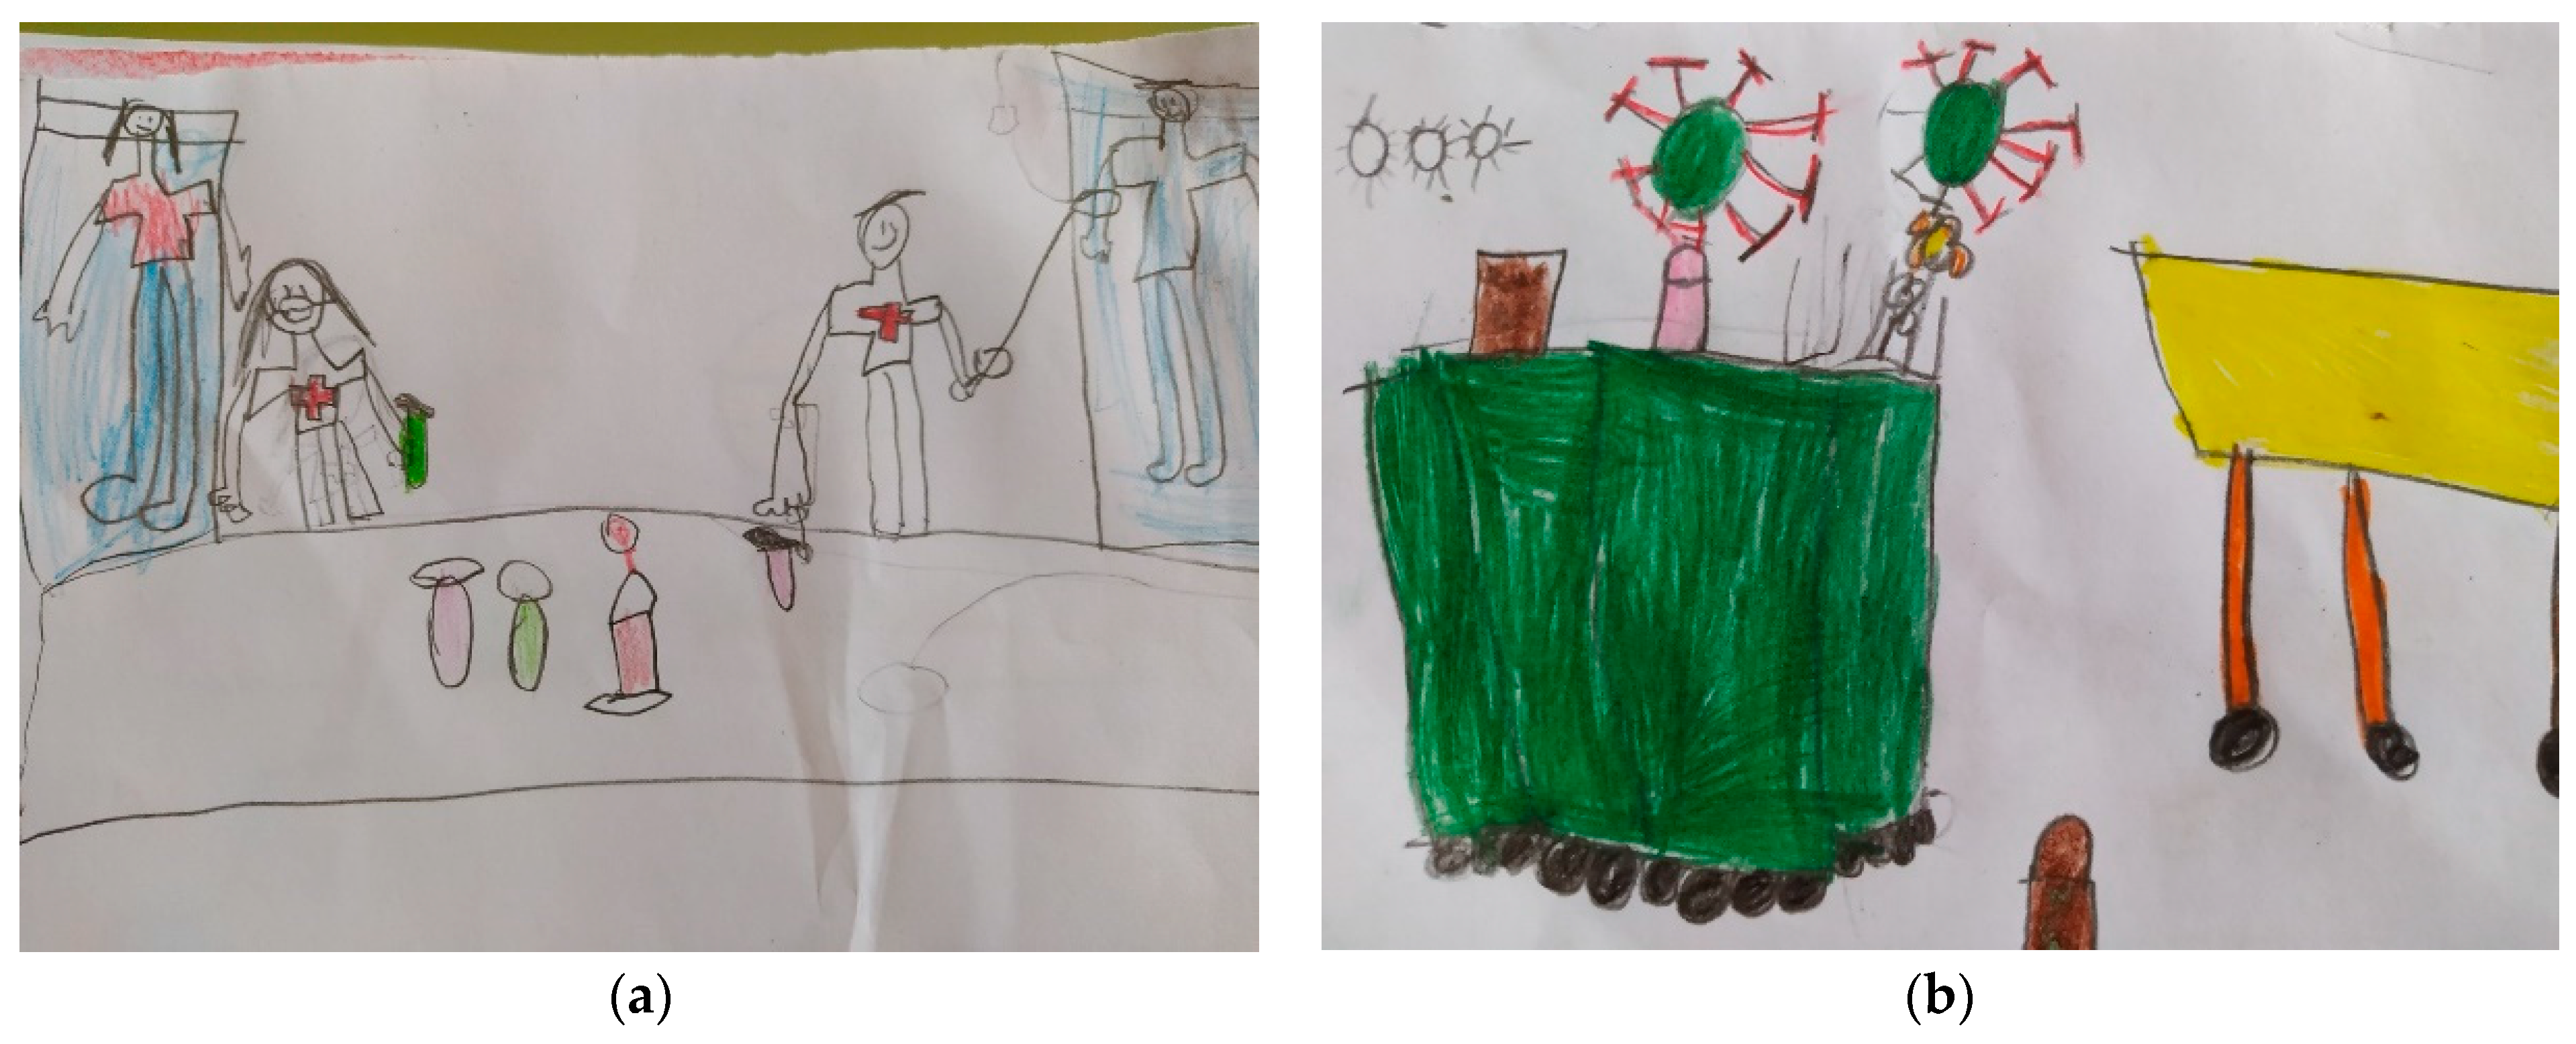
- An illustration made by the students with their drawing about the person who is dedicated to science, her or his workplace and activity.
- Individual interviews with students to obtain explanatory information about what they had represented in their illustrations.
- For the analysis of the illustrations made by the students, we used:
- Analysis rubric defined in the modified Draw A Scientific Test-prompt [38].
- Classification Table of drawings based on: (a) the gender represented by the students: female, male, both or not distinguished); (b) the age of the person represented (young person, older person or indistinguishable); (c) the representation of clinical research professionals: if you represent people researching COVID-19, researching in the manufacture of drugs or vaccines, or conducting clinical trials, which has been called “Investigating COVID”; (d) search for an explicit representation of COVID-19 in some part of the drawing, even if it has no obvious connection to the rest of what the drawing represents.
2.3. Development of the Activity
2.4. Data Analysis
3. Results
3.1. Results of the Analysis of the Students’ Illustrations by Grade and Gender
3.2. Results of the Comparison between Academic Years According to Category
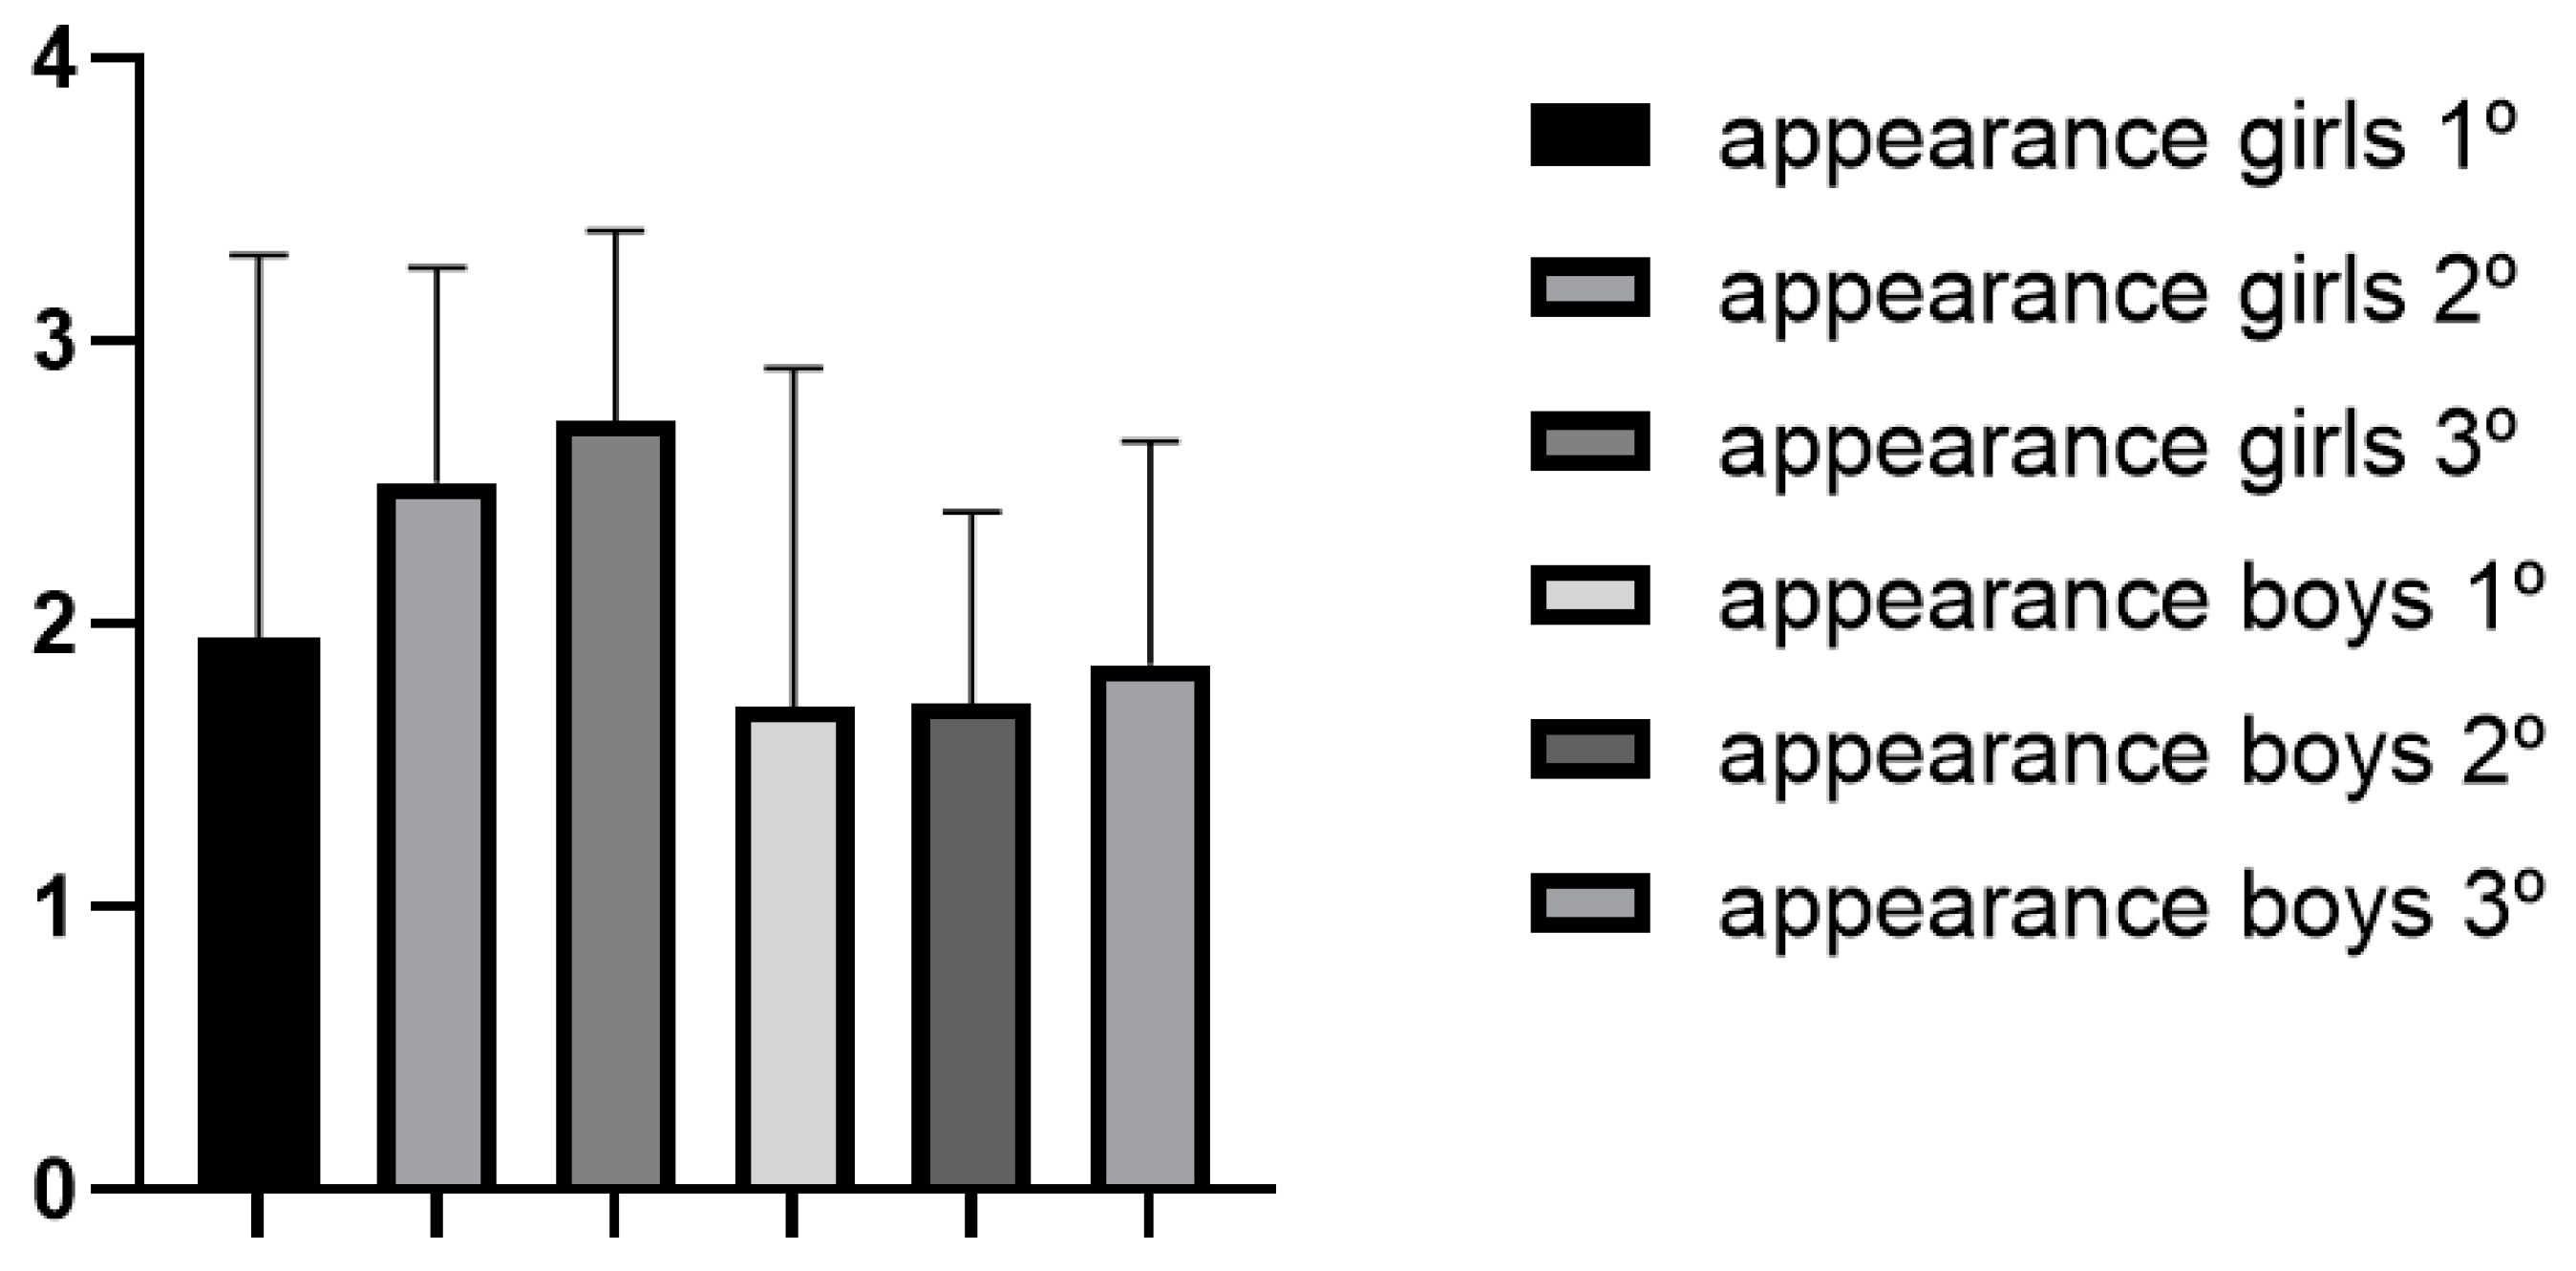
3.2.1. Appearance
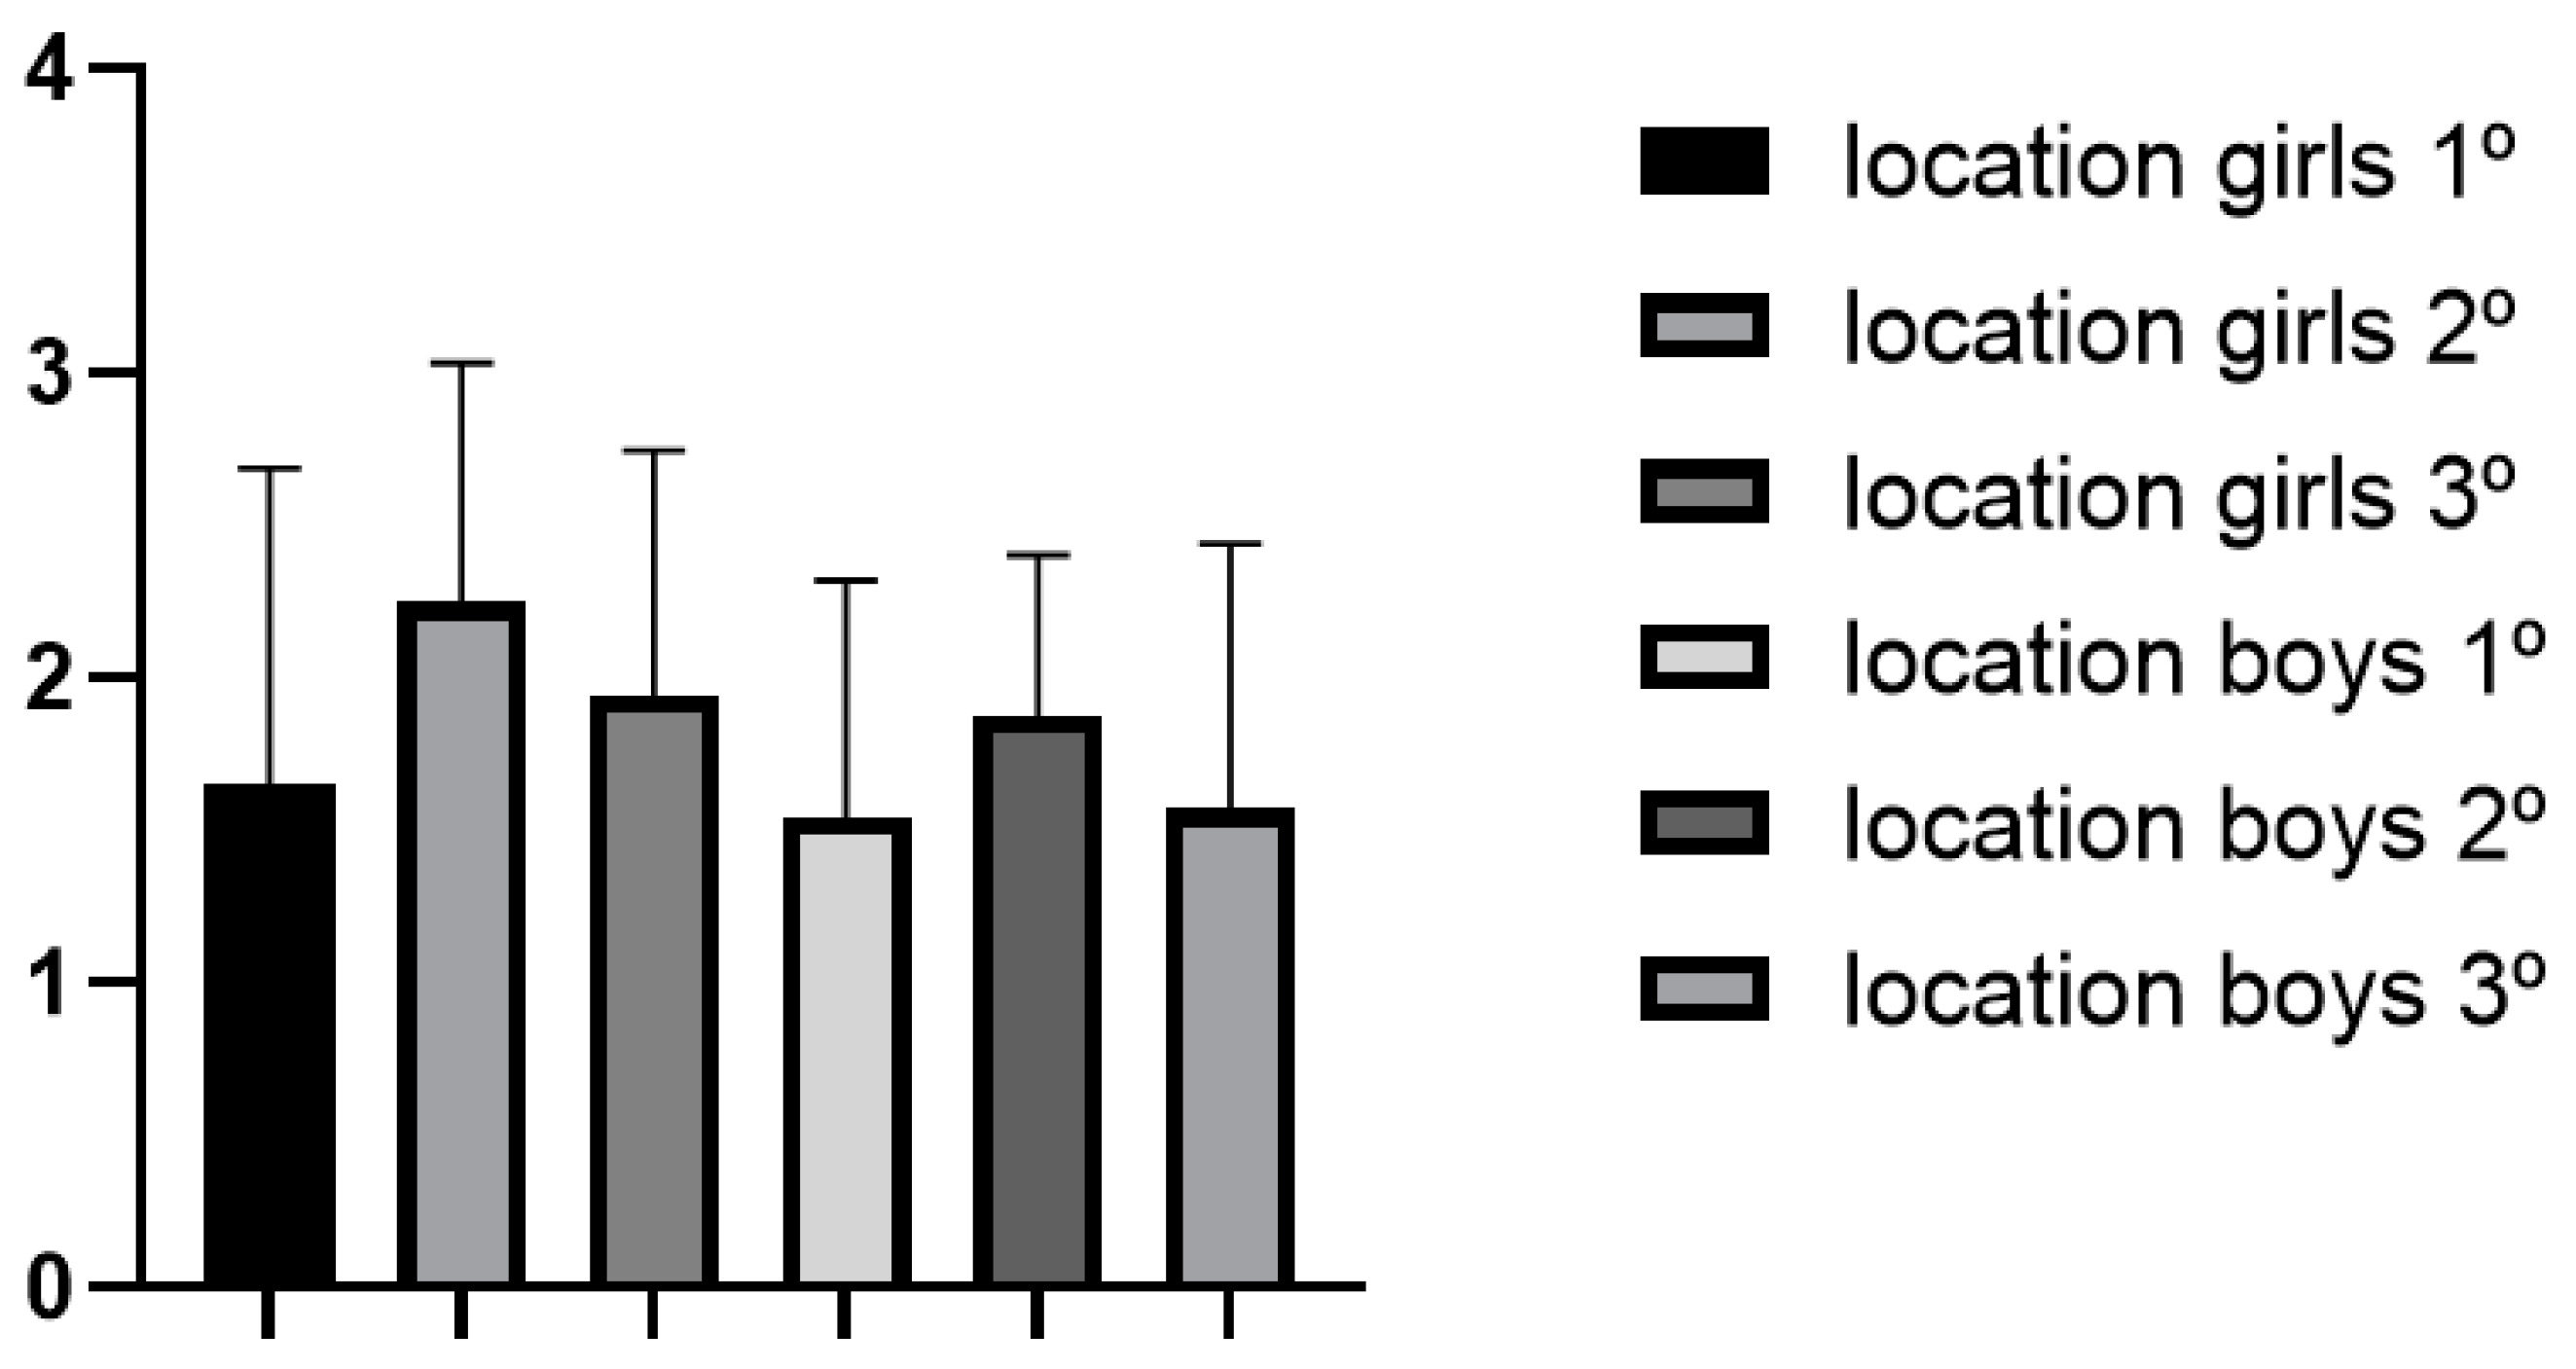
3.2.2. Location
3.2.3. Activity
4. Discussion
5. Conclusions
Author Contributions
Funding
Institutional Review Board Statement
Informed Consent Statement
Data Availability Statement
Conflicts of Interest
Appendix A


Appendix B


References
- Jones, R.; Bangert, A. The CSI Effect: Changing the Face of Science. Sci. Scope 2006, 30, 38. Available online: https://0-www-proquest-com.brum.beds.ac.uk/docview/225939585 (accessed on 23 June 2021).
- McCarthy, D. Teacher candidates’ perceptions of scientists: Images and attributes. Educ. Rev. 2014, 67, 389–413. [Google Scholar] [CrossRef]
- Vázquez, Á.; Manassero, M.A. Draw a scientist: Picture of scientists in high school students. Infanc. Aprendiz. 1998, 21, 3–26. [Google Scholar] [CrossRef]
- Ho, H.-Y.; Chen, Y.-L.; Yen, C.-F. Different impacts of COVID-19-related information sources on public worry: An online survey through social media. Internet Interv. 2020, 22, 100350. [Google Scholar] [CrossRef]
- She, H. Gender and Grade Level Differences in Taiwan Students’ Stereotypes of Science and Scientists. Res. Sci. Technol. Educ. 1998, 16, 125–135. [Google Scholar] [CrossRef]
- Christidou, V.; Bonoti, F.; Kontopoulou, A. American and Greek Children’s Visual Images of Scientists. Sci. Educ. 2016, 25, 497–522. [Google Scholar] [CrossRef]
- Farland-Smith, D.; Finson, K.D.; Boone, W.J.; Yale, M.S. An Investigation of Media Influences on Elementary Students Representations of Scientists. J. Sci. Teach. Educ. 2014, 25, 355–366. [Google Scholar] [CrossRef]
- Finson, K.D. Drawing a Scientist: What We Do and Do Not Know after Fifty Years of Drawings. Sch. Sci. Math. 2002, 102, 335–345. [Google Scholar] [CrossRef]
- Mason, C.L.; Kahle, J.B.; Gardner, A.L. Draw-A-Scientist Test: Future Implications. Sch. Sci. Math. 1991, 91, 193–198. [Google Scholar] [CrossRef]
- Türkmen, H. Turkish Primary Students’ Perceptions about Scientist and What Factors Affecting the Image of the Scientists. Eur. J. Math. Sci. Technol. Educ. 2008, 4, 55–61. [Google Scholar] [CrossRef]
- Farland-Smith, D. The Evolution of the Analysis of the Draw-a-Scientist Test; Sense Publishers: Rotterdam, The Netherlands, 2017; Volume 76, pp. 171–178. [Google Scholar] [CrossRef]
- Vincent-Ruz, P.; Schunn, C.D. The nature of science identity and its role as the driver of student choices. Int. J. STEM Educ. 2018, 5, 1–12. [Google Scholar] [CrossRef] [Green Version]
- Pérez-Manzano, A.; Almela-Baeza, J. Gamification and transmedia for scientific promotion and for encouraging scientific careers in adolescents. Comunicar. Media Educ. Res. J. 2018, 26, 93–103. [Google Scholar] [CrossRef] [Green Version]
- Newton, L.D.; Newton, D.P. Primary children’s conceptions of science and the scientist: Is the impact of a National Curriculum breaking down the stereotype? Int. J. Sci. Educ. 1998, 20, 1137–1149. [Google Scholar] [CrossRef]
- Emvalotis, A.; Koutsianou, A. Greek primary school students’ images of scientists and their work: Has anything changed? Res. Sci. Technol. Educ. 2017, 36, 69–85. [Google Scholar] [CrossRef]
- Miller, D.I.; Nolla, K.M.; Eagly, A.H.; Uttal, D.H. The Development of Children’s Gender-Science Stereotypes: A Meta-analysis of 5 Decades of U.S. Draw-A-Scientist Studies. Child Dev. 2018, 89, 1943–1955. [Google Scholar] [CrossRef] [Green Version]
- Schibeci, R.A.; Riley, J.P. Influence of students’ background and perceptions on science attitudes and achievement. J. Res. Sci. Teach. 1986, 23, 177–187. [Google Scholar] [CrossRef]
- Álvarez-Lires, F.J.; Arias-Correa, A.; Serrallé-Marzoa, J.; Varela-Losada, M. Choice of engineering studies: Influence of science education and gender stereotypes on the self-esteem of female students. Rev. Investig. Educ. 2014, 12, 54–72. [Google Scholar]
- Finson, K.D. Applicability of the DAST-C to the images of scientists drawn by students of different racial groups. J. Elem. Sci. Educ. 2003, 15, 15–26. [Google Scholar] [CrossRef]
- Rossi-Cordero, A.E.; Barajas-Frutos, M. Choice of STEM Studies and Gender Imbalances. Enseñanza Ciencias Revista Investigación Experiencias Didácticas 2015, 33, 59–76. Available online: https://www.raco.cat/index.php/Ensenanza/article/view/301962 (accessed on 17 February 2021). [CrossRef] [Green Version]
- Finson, K.D.; Beaver, J.B.; Cramond, B.L. Development and Field Test of a Checklist for the Draw-A-Scientist Test. Sch. Sci. Math. 1995, 95, 195–205. [Google Scholar] [CrossRef]
- Monhardt, R.M. The image of the scientist through the eyes of Navajo children. J. Am. Indian Educ. 2003, 42, 25–39. Available online: https://0-www-jstor-org.brum.beds.ac.uk/stable/24398436 (accessed on 23 June 2021).
- Mead, M.; Metraux, R. Image of the Scientist among High-School Students: A Pilot Study. Science 1957, 126, 384–390. [Google Scholar] [CrossRef]
- Fort, D.C.; Varney, H.L. How students see scientists: Mostly male, mostly white, and mostly benevolent. Sci. Child. 1989, 26, 8–13. Available online: https://0-www-jstor-org.brum.beds.ac.uk/stable/43167098 (accessed on 23 June 2021).
- Krajkovich, J.G.; Smith, J.K. The development of the image of science and scientists scale. J. Res. Sci. Teach. 1982, 19, 39–44. [Google Scholar] [CrossRef]
- Schibeci, R.A.; Sorensen, I. Elementary School Children’s Perceptions of Scientists. Sch. Sci. Math. 1983, 83, 14–20. [Google Scholar] [CrossRef]
- Ward, A. Magician in a White Coat. Sci. Act. 1977, 14, 6–9. [Google Scholar] [CrossRef]
- Chang, H.-Y.; Lin, T.-J.; Lee, M.-H.; Lee, S.W.-Y.; Lin, T.-C.; Tan, A.-L.; Tsai, C.-C. A systematic review of trends and findings in research employing drawing assessment in science education. Stud. Sci. Educ. 2020, 56, 77–110. [Google Scholar] [CrossRef]
- Selwyn, N.; Boraschi, D.; Özkula, S.M. Drawing digital pictures: An investigation of primary pupils’ representations of ICT and schools. Br. Educ. Res. J. 2009, 35, 909–928. [Google Scholar] [CrossRef]
- Van Der Veen, J. Draw Your Physics Homework? Art as a Path to Understanding in Physics Teaching. Am. Educ. Res. J. 2012, 49, 356–407. [Google Scholar] [CrossRef]
- Chambers, D.W. Stereotypic images of the scientist: The draw-a-scientist test. Sci. Educ. 1983, 67, 255–265. [Google Scholar] [CrossRef]
- Fung, Y.Y.H. A comparative study of primary and secondary school students’ images of scientists. Res. Sci. Tecnol. Educ. 2002, 20, 199–213. [Google Scholar] [CrossRef]
- Losh, S.C.; Wilke, R.; Pop, M. Some Methodological Issues with “Draw a Scientist Tests” among Young Children. Int. J. Sci. Educ. 2008, 30, 773–792. [Google Scholar] [CrossRef]
- Maoldomhnaigh, M.O.; Hunt, A. Some Factors Affecting the Image of the Scientist Drawn by Older Primary School Pupils. Res. Sci. Technol. Educ. 1988, 6, 159–166. [Google Scholar] [CrossRef]
- Newton, D.P.; Newton, L.D. Young children’s perceptions of science and the scientist. Int. J. Sci. Educ. 1992, 14, 331–348. [Google Scholar] [CrossRef]
- Reinisch, B.; Krell, M.; Hergert, S.; Gogolin, S.; Krüger, D. Methodical challenges concerning the Draw-A-Scientist Test: A critical view about the assessment and evaluation of learners’ conceptions of scientists. Int. J. Sci. Educ. 2017, 39, 1952–1975. [Google Scholar] [CrossRef]
- Ferguson, S.L.; Lezotte, S.M. Exploring the state of science stereotypes: Systematic review and meta-analysis of the Draw-A-Scientist Checklist. Sch. Sci. Math. 2020, 120, 55–65. [Google Scholar] [CrossRef]
- Farland-Smith, D. Development and Field Test of the Modified Draw-a-Scientist Test and the Draw-a-Scientist Rubric. Sch. Sci. Math. 2012, 112, 109–116. [Google Scholar] [CrossRef]
- Viennot, L.; Kaminski, W. Can we evaluate the Impact of a Critical Detail? The Role of a Type of Diagram in Understanding Optical Imaging. Int. J. Sci. Educ. 2006, 28, 1867–1885. [Google Scholar] [CrossRef]
- Samaras, G.; Bonoti, F.; Christidou, V. Exploring Children’s Perceptions of Scientists through Drawings and Interviews. Procedia Soc. Behav. Sci. 2012, 46, 1541–1546. [Google Scholar] [CrossRef] [Green Version]
- Solomon, J.; Duveen, J.; Scott, L. Pupils’ images of scientific epistemology. Int. J. Sci. Educ. 1994, 16, 361–373. [Google Scholar] [CrossRef]
- Christidou, V.; Hatzinikita, V.; Samaras, G. The image of scientific researchers and their activity in Greek adolescents’ drawings. Public Underst. Sci. 2010, 21, 626–647. [Google Scholar] [CrossRef] [PubMed] [Green Version]
- López-Sánchez, F.; Ortíz, M.J. The development of attachment during childhood. In Affective and Social Development; López-Sánchez, F., Etxebarria, I., Fuentes-Rebollo, M.J., Ortíz, M.J., Eds.; Ediciones Pirámide: Madrid, Spain, 2014. [Google Scholar]
- Berasategi-Sancho, N.; Idoiaga-Mondragón, N.; Dosil-Santamaría, M.; Eiguren-Munitis, A.; Pikatza-Gorrotxategi, N.; Ozamiz-Echevarria, N. The Voices of Children in Confinement Due to COVID-19; Universidad del País Vasco: Bilbao, Spain, 2020. [Google Scholar]
- Toniolo, B.P.; Baptista, J.P.; Ramos, C.; Piñeiro-Naval, V.; Gradim, A. General Knowledge and Perception of Portuguese Children about COVID-19. In International Conference on Information Technology & Systems; Springer: Cham, Switzerland, 2021; pp. 179–197. [Google Scholar] [CrossRef]
- Fundación Española para la Ciencia y la Tecnología (FECYT). 10th Survey on Social Perception of Science an Technology—2020; FECYT: Madrid, Spain, 2021; Available online: https://bit.ly/3h6aw7A (accessed on 23 June 2021).


| Category | Score | Description |
|---|---|---|
| Appearance | 0 | Cannot be categorized: stick figure, a historical figure, no scientist, or a teacher or student. |
| 1 | Sensationalized: contain a man or a woman who may resemble a monster or who has a clearly odd or comic book appearance | |
| 2 | Traditional: contain an ordinary-looking white male. | |
| 3 | Broader than traditional: drawings include a woman or a minority scientist. | |
| Location | 0 | Cannot be categorized: may be difficult to determine or that of a classroom. |
| 1 | Sensationalized: contain a location that resembles a basement, cave, or setting of secrecy, scariness, or horror, or with elaborate equipment not normally found in a laboratory | |
| 2 | Traditional: a traditional laboratory with a table and equipment (and possibly a computer) in a normal-looking room. | |
| 3 | Broader than traditional: include a scene that is not a basement laboratory and different from a traditional laboratory setting. | |
| Activity | 0 | Difficult/unable to determine. |
| 1 | Sensationalized: may include scariness or horror, often with elaborate equipment not normally found in a typical laboratory; or include fire, explosives, or dangerous work. | |
| 2 | Naive or traditional: an activity that the student believes may happen, but in truth, the activity is highly unlikely to occur. Drawings where the student writes, “This scientist is studying … or trying to …” but does not show how this is being done. | |
| 3 | Broader than traditional: realistic activities that reflect the work a scientist might actually do with the appropriate tools needed to perform these activities. A student may write, “This scientist is studying … or trying to …” and shows how this is being done. |
| Category | Assessment | Total | Girls | Boys | Statistical Significance |
|---|---|---|---|---|---|
| Appearance | Cannot be categorized | 22.7% | 25% | 20.83% | 26.020% |
| Sensationalized | 20.5% | 15% | 24.98% | 59.313% | |
| Traditional | 9.1% | 0% | 16.68% | 97.317% | |
| Broader than traditional | 47.7% | 60% | 37.51% | 87.694% | |
| Location | Cannot be categorized | 15.9% | 20% | 12.5% | 48.931% |
| Sensationalized | 20.5% | 15% | 25% | 59.404% | |
| Traditional | 52.3% | 45% | 58.33% | 62.203% | |
| Broader than traditional | 11.3% | 20% | 4.17% | 89.694% | |
| Activity | Cannot be categorized | 13.6% | 20% | 8.33% | 73.089% |
| Sensationalized | 20.5% | 15% | 25% | 59.404% | |
| Traditional | 45.5% | 30% | 58.33% | 95.416% | |
| Broader than traditional | 20.5% | 35% | 8.33% | 97.440% |
| Variable | Value | Total | Girls | Boys | Statistical Significance |
|---|---|---|---|---|---|
| Gender represented | Female | 22.7% | 25% | 20.83% | 26.020% |
| Male | 40.9% | 35% | 45.83% | 53.091% | |
| Both | 13.6% | 20% | 8.33% | 73.089% | |
| Cannot be categorized | 22.7% | 20% | 25% | 30.753% | |
| Age | Young | 75% | 90% | 62.5% | 97.976% |
| Older | 6.8% | 0% | 100% | 100.000% | |
| Cannot be categorized | 18.18% | 10% | 25% | 38.014% | |
| Investigating COVID | 15.9% | 25% | 8.33% | 86.747% | |
| Allusion to COVID | 29.5% | 40% | 20.83% | 84.113% |
| Category | Assessment | Total | Girls | Boys | Statistical Significance |
|---|---|---|---|---|---|
| Appearance | Cannot be categorized | 2.22% | 0% | 4% | 69.163% |
| Sensationalized | 22.22% | 15% | 28% | 72.095% | |
| Traditional | 42.23% | 20% | 60% | 99.726% | |
| Broader than traditional | 33.33% | 65% | 8% | 99.999% | |
| Location | Cannot be categorized | 4.44% | 5% | 4% | 15.269% |
| Sensationalized | 6.66% | 5% | 8% | 31.682% | |
| Traditional | 68.88% | 50% | 84% | 98.934% | |
| Broader than traditional | 20% | 40% | 4% | 99.785% | |
| Activity | Cannot be categorized | 2.22% | 5% | 0% | 69.427% |
| Sensationalized | 6.66% | 5% | 8% | 31.682% | |
| Traditional | 71.11% | 70% | 72% | 14.466% | |
| Broader than traditional | 20% | 20% | 20% | 4.948% |
| Variable | Value | Total | Girls | Boys | Statistical Significance |
|---|---|---|---|---|---|
| Gender represented | Female | 22.22% | 40% | 8% | 99.685% |
| Male | 62.22% | 35% | 84% | 99.977% | |
| Both | 11.11% | 25% | 0% | 99.042% | |
| Cannot be categorized | 4.44% | 0% | 8% | 86.392% | |
| Age | Young | 86.66% | 90% | 84% | 44.648% |
| Older | 4.44% | 5% | 4% | 15.269% | |
| Both | 2.22% | 5% | 0% | 69.427% | |
| Cannot be categorized | 6.66% | 0% | 12% | 93.855% | |
| Investigating COVID | 28% | 35% | 24% | 57.371% | |
| Allusion to COVID | 35.55% | 30% | 40% | 51.236% |
| Category | Assessment | Total | Girls | Boys | Statistical Significance |
|---|---|---|---|---|---|
| Appearance | Cannot be categorized | 2.56% | 0% | 4.76% | 69.353% |
| Sensationalized | 17.95% | 11.11% | 23.81% | 71.475% | |
| Traditional | 30.77% | 5.55% | 52.38% | 99.982% | |
| Broader than traditional | 48.72% | 83.33% | 19.05% | 100.000% | |
| Location | Cannot be categorized | 12.82% | 11.11% | 14.28% | 24.088% |
| Sensationalized | 12.82% | 0% | 23.81% | 98.988% | |
| Traditional | 61.54% | 72.22% | 52.38% | 81.236% | |
| Broader than traditional | 12.82% | 16.66% | 9.52% | 48.127% | |
| Activity | Cannot be categorized | 5.13% | 0% | 9.52% | 86.715% |
| Sensationalized | 10.26% | 0% | 19.05% | 97.520% | |
| Traditional | 76.92% | 88.88% | 66.66% | 92.417% | |
| Broader than traditional | 7.69% | 11.11% | 4.76% | 52.552% |
| Variable | Value | Total | Girls | Boys | Statistical Significance |
|---|---|---|---|---|---|
| Gender represented | Female | 33.33% | 66.66% | 4.76% | 100.000% |
| Male | 48.72% | 11.11% | 80.95% | 100.000% | |
| Both | 12.82% | 22.22% | 4.76% | 89.691% | |
| Cannot be categorized | 5.13% | 0% | 9.52% | 86.715% | |
| Age | Young | 89.74% | 100% | 80.95% | 97.520% |
| Older | 5.13% | 0% | 9.52% | 86.715% | |
| Cannot be categorized | 5.13% | 0% | 9.52% | 86.715% | |
| Investigating COVID | 28.2% | 33.33% | 23.8% | 48.197% | |
| Allusion to COVID | 41.03% | 38.88% | 33.33% | 28.209% |
| Grade | Total | Girls | Boys | |||
|---|---|---|---|---|---|---|
| Mean | SD | Mean | SD | Mean | SD | |
| 1st Grade | 1.82 | 1.26 | 1.95 | 1.36 | 1.71 | 1.20 |
| 2nd Grade | 2.07 | 0.81 | 2.5 | 0.76 | 1.72 | 0.68 |
| 3rd Grade | 2.26 | 0.85 | 2.72 | 0.67 | 1.86 | 0.79 |
| Grade | Total | Girls | Boys | |||
|---|---|---|---|---|---|---|
| Mean | SD | Mean | SD | Mean | SD | |
| 1st Grade | 1.58 | 0.91 | 1.65 | 1.04 | 1.54 | 0.78 |
| 2nd Grade | 2.04 | 0.67 | 2.25 | 0.79 | 1.88 | 0.53 |
| 3rd Grade | 1.74 | 0.85 | 1.94 | 0.80 | 1.57 | 0.87 |
| Grade | Total | Girls | Boys | |||
|---|---|---|---|---|---|---|
| Mean | SD | Mean | SD | Mean | SD | |
| 1st Grade | 1.71 | 0.97 | 1.8 | 1.15 | 1.67 | 0.76 |
| 2nd Grade | 2.07 | 0.60 | 2.05 | 0.69 | 2.12 | 0.53 |
| 3rd Grade | 1.87 | 0.62 | 2.11 | 0.32 | 1.67 | 0.73 |
Publisher’s Note: MDPI stays neutral with regard to jurisdictional claims in published maps and institutional affiliations. |
© 2021 by the authors. Licensee MDPI, Basel, Switzerland. This article is an open access article distributed under the terms and conditions of the Creative Commons Attribution (CC BY) license (https://creativecommons.org/licenses/by/4.0/).
Share and Cite
Quílez-Cervero, C.; Diez-Ojeda, M.; López Gallego, A.A.; Queiruga-Dios, M.Á. Has the Stereotype of the Scientist Changed in Early Primary School–Aged Students Due to COVID-19? Educ. Sci. 2021, 11, 365. https://0-doi-org.brum.beds.ac.uk/10.3390/educsci11070365
Quílez-Cervero C, Diez-Ojeda M, López Gallego AA, Queiruga-Dios MÁ. Has the Stereotype of the Scientist Changed in Early Primary School–Aged Students Due to COVID-19? Education Sciences. 2021; 11(7):365. https://0-doi-org.brum.beds.ac.uk/10.3390/educsci11070365
Chicago/Turabian StyleQuílez-Cervero, César, María Diez-Ojeda, Altamira Alicia López Gallego, and Miguel Ángel Queiruga-Dios. 2021. "Has the Stereotype of the Scientist Changed in Early Primary School–Aged Students Due to COVID-19?" Education Sciences 11, no. 7: 365. https://0-doi-org.brum.beds.ac.uk/10.3390/educsci11070365