Article

Validation of the Academic Self-Concept Scale in the Spanish University Context

by
Antonio Granero-Gallegos
1,2,
Antonio Baena-Extremera
3,
Juan Carlos Escaravajal
1 and
Raúl Baños
4,5,*
1
Department of Education, University of Almeria, 04120 Almeria, Spain
2
Health Research Centre, University of Almeria, 04120 Almeria, Spain
3
Department of Education, University of Granada, 18071 Granada, Spain
4
Department of Music, Plastic and Body Expression, University of Zaragoza, 44002 Teruel, Spain
5
Department of Science Sports, Autonomous University of Baja California, Tijuana 22424, Mexico
*
Author to whom correspondence should be addressed.
Submission received: 13 September 2021 / Revised: 12 October 2021 / Accepted: 14 October 2021 / Published: 18 October 2021
(This article belongs to the Special Issue Student Preferences and Satisfaction: Measurement and Optimization)

Abstract

:
The aims of this study were: (i) to provide evidence of reliability and validity regarding the dimensionality of the Spanish version of two correlated subscales measuring Academic Self-Concept (ASC); (ii) to analyze factorial invariance according to sex and the educational level; (iii) to analyze a higher-order model from the two ASC subscales; and (iv) to study the predictive relationship of the ASC to academic engagement. An observational, descriptive, and cross-sectional study was designed in which 681 undergraduate university students (Mage = 24.55; SDage = 5.35) (58% girls) and students of the Master’s in Teacher Education participated. The scale’s psychometric properties were analyzed using different exploratory and confirmatory analyses demonstrating that this instrument with two correlated factors (academic confidence and academic effort) is valid, reliable, and invariant in terms of gender and academic level. Higher-order factors from the two correlated factors showed an excellent goodness-of-fit. A regression model with latent variables was conducted showing a higher and positive prediction of academic self-concept for the two factors of academic engagement (willingness to study and satisfaction with studies). The ASC has shown itself to be a valid and reliable instrument for use with Spanish university students and may be of special interest, both to teachers and to the students themselves, as it allows us to reflect on the importance of developing confidence and effort during the students’ academic lives.

1. Introduction

University education is considered a key tool for forming and developing intellectual capital which, in turn, is the most important factor of production in the modern economy [1,2]. This formative stage can be considered the last step in which young students are preparing to face an uncertain future where they will be expected to act as agents of change and innovation, or creators of the future, and thus adapt to the work environment [3,4]. However, during university training, some students may not have the necessary strategies and skills to meet the demands of academic life and thus develop negative attitudes as well as experience a decrease in self-confidence, which can lead to poor academic performance and even dropping out of studies [2,5,6].
For this reason, university training must go beyond imparting content, the evaluation of knowledge and the specialized skills acquired by the students; the confidence and adaptive motivation necessary for lifelong learning must also be developed in students [7]. Accordingly, the improvement in psychological variables, such as academic self-concept (ASC), while supporting student performance, is an essential and intertwined component of formal education, being an important predictor of future achievements [8]. The ASC is a theoretical construct that is defined as the perceptions that a person has regarding their own capacities in activities related to school [9]. This construct is the mental representation of the academic skills that a student makes for him/herself [10], which involve aspects of both self-description and self-evaluation [11], hence the importance of developing self-confidence and academic effort in students, as these are essential characteristics of ASC [12].
Various studies have found that ASC forms gradually in the first years of school [13], tending to decrease among students in early adolescence [14], and reaching its lowest point in mid-adolescence [15]. However, there is some controversy, since other authors state that ASC is formed at primary school age and reaches its maximum value in secondary school [16], and that it also tends to rise according to the increase in the students’ academic performance [10,17], which may be the cause and effect of that performance [18]. Furthermore, several studies have demonstrated that ASC may also be influenced by variables of context, well-being, and the gender of the student [13,14,19].
Most English versions of the measuring instruments studying the validity and reliability of ASC have done so by analyzing it as a subscale of general self-concept; that is to say, they measured the general self-concept, which is made up of various dimensions, one of which was academic self-concept [20,21,22]. In Spain, we find two instruments that measure this general self-concept. On the one hand, the most well-known and commonly used instrument has been the Autoconcepto Forma 5 (Self-concept Form 5), which includes the dimension of academic self-concept as one of the five dimensions that make it up, although it has only been validated in children and adults who do not attend school [23]. On the other, the 12-scale Dimensional Self-Concept questionnaire [24], which measures academic self-concept in two dimensions—verbal academic self-concept and mathematical academic self-concept—and does not focus on the academic self-confidence and effort so highlighted by the scientific literature [12,25]. There are few scales that only assess ASC, most of them being designed and validated on secondary school students. For example, we found the Academic Self-Concept Scale (ASCS), validated by Liu et al. [12] with Singaporean secondary school adolescents. This scale consists of two dimensions (academic confidence and academic effort) as well as a higher-order model to measure ASC. The instrument was later adapted and validated with Malaysian university students [25], responding to the need to validate a scale that measures ASC in university students.
The scientific literature has analyzed the relationship and prediction of academic self-concept with other academic and psychological variables. A negative relationship between academic self-concept and demotivation and a positive relationship with intrinsic and extrinsic motivation can be found, both in secondary school students [26] and in university students [27]. Furthermore, it positively predicts academic interest and negatively predicts academic anxiety [28]. The scientific literature is more abundant on the positive relationship between academic performance and future achievements [8,13,18]. The importance of affective aspects in modern education comes with pointing out individual’s self-concept. Authors as Li and Wang [14] closely relate academic self-concept to students’ perceived academic competence and their commitment, participation, and interest in school work. Recent studies, such as those by Bakadorova Lazarides, and Raufelder [29] or Tas [30] have linked the ASC with academic engagement. Engagement is defined as a positive mental state oriented to a particular task, a motivating and satisfying mental state [31]. More specifically, academic engagement is understood as the active involvement of students in learning activities and the tasks to be carried out [32]. Academic engagement can be studied from two dimensions, the predisposition that a student has towards studying and the satisfaction with their studies [33]. The present study arises from the strong relationship between engagement and ASC, the scarcity of studies that reinforce this relationship, and the need to adapt and validate an instrument that specifically measures ASC in Spanish university students.
For all of the above, the following objectives are proposed: (i) to provide evidence on the reliability and validity of the dimensionality of the Spanish version of two correlated subscales to measure ASC; (ii) to analyze the factorial invariance of the scale based on sex and the educational level; (iii) to analyze a higher-order model based on the two subscales of academic confidence and academic effort; and (iv) to study the predictive relationship of ASC with the academic engagement subscales.
The following hypotheses are established: first, it is hypothesized that the ASCS will obtain adequate validity and reliability values in a sample of Spanish university students (H1). Second, it is hypothesized that the factorial invariance will obtain adequate values based on sex and educational level (H2). Third, it is hypothesized that the higher-order model based on two subscales will obtain adequate validity and reliability values (H3), and lastly, that the ASC will positively predict the academic engagement subscales (H4).

2. Materials and Methods

2.1. Design

The design of this research was observational, descriptive, cross-sectional, and non-randomized. Spanish university students from different Spanish universities took part in the study. Data collection was carried out at the end of the second semester of the 2020/2021 academic year. The inclusion criteria to participate in this research were: (i) to be a student of the Master’s degree in Secondary Education Teaching or an in-person degree student of a university course related to the training of future teachers. The exclusion criteria were: (i) not having consented to the use of data in the research and/or (ii) not having filled out the data collection form completely.

2.2. Instruments

The Academic Self-Concept Scale (ASCS). The Matovu [25] scale of two correlated factors to measure ASC in university students was adapted to the Spanish university context: academic confidence (four items) and academic effort (six items). This scale is based on the original by Liu et al. [12], initially validated with secondary school students and based on the Academic Self-esteem subscale of Battle [34], the School Subjects Self-concept Scale of Marsh, Smith, and Barnes [35], and the General and Academic Status scale of Piers and Harris [36]. Additionally, academic confidence and academic effort served as endogenous variables to the general ASC. The version of Matovu [25] contains a total of 10 items and a Likert-type scale is used for the answers, ranging from 1 (strongly disagree) to 7 (strongly agree).
The Utrecht Work Engagement Scale (UWES-S). The Spanish version of the individual academic engagement scale adapted to the university context by Cachón-Zagalaz et al. [33] from the original by Schaufeli et al. [31]. This instrument is made up of two subscales that measure satisfaction with studies (seven items) and willingness to study (eight items). For the answers, a Likert-type scale is used ranging from 1 (completely disagree) to 5 (completely agree). The reliability and convergent validity values were acceptable: willingness to study, McDonald’s ω = 0.81, Cronbach’s alpha (α) = 0.81, AVE (Average Variance Extracted) = 0.52; satisfaction with studies, ω = 0.86, α = 0.86, and AVE = 0.51.

2.3. Procedure

The items of the ASCS by Matovu [25] were translated into Spanish using back-translation [37]. Two translators translated the 10 items into Spanish, and then two different translators translated the items back into their original language (back-translation). To assess the goodness of fit of the translation, the degree of agreement with the original version was taken into account. Following Lynn [38], four experts in university education analysed the final version to guarantee the adequate design of the items for measuring the construct they were intended to measure and for maintaining the original meaning. The experts evaluated the relevance and understanding of each item on a scale from 1 (Strongly disagree) to 4 (Strongly agree). If the mean scores of the items were <2.5, the items were reviewed. If an item was not classified by at least three of the four experts as within the theoretical dimensions of the scale, it was reviewed again. The global agreement of the four experts on relevance and comprehension was measured using the Intraclass Correlation Coefficient (ICC); the values obtained were ICC = 0.85 for relevance and ICC = 0.87 for comprehension. The Spanish version was administered to 45 university students between the ages of 18 and 27, each of whom expressed their full understanding of the items. Thus, the final Spanish version of the ASCS was obtained.
Subsequently, the heads and professors of the Faculties of Education Sciences and the Master’s in Teaching from different universities were contacted to request their collaboration and to inform them regarding the object of the research. Students were informed by email to participate in the study. The students were contacted by researchers who did not teach them. The final instrument was administered by means of an online form in which the importance of the research was briefly explained, as were the anonymity of the answers, the way to fill in the scale, the assertion that no qualification would be affected in any way, and that participation in the study could be abandoned at any time. All subjects gave their informed consent for inclusion before they participated in the study. The research was carried out in accordance with the Declaration of Helsinki and the protocol was approved by the Bioethics Committee of the University of Almería [Ref.: UALBIO2021/009].

2.4. Risk of Bias

Regarding the control of bias, it should be noted that there was no sample randomization because this was a convenience sample. There was blinding between the participants and the researchers in charge of the data treatment and analysis. Regarding selection bias, participation in the study was voluntary and communication with students was by email.

2.5. Sample Size

Regarding the sample size, the requirement stipulated by Carretero-Dios and Pérez [39] were met; namely, that there were 10 participants for each item to carry out a Confirmatory Factor Analysis (CFA). In addition, the Free Statistics Calculator v.4.0 [40] software was used, which calculated that a minimum of 549 subjects would be sufficient to detect effect sizes (f2) = 0.15 with a statistical power of 0.95 and a significance level of α = 0.05 in a structural equation model (SEM) with two latent variables and 10 observed variables. A total of 681 students participated in the study.

2.6. Statistical Analysis

The descriptive statistics were calculated for each item and the instrument’s factorial structure was evaluated using ESEM (Exploratory Structural Equation Modeling) and CFA (Confirmatory Factor Analysis). After analysing the items and verifying the factorial structure, a final model was obtained, and a CFA was performed to verify the factorial structure of the ESEM. The factors were correlated and, since the data were collected from different classes or groups of students, the cluster option, and the COMPLEX function of Mplus, were utilised to avoid non-dependence of the observations. The ESEM model was estimated taking into account the recommendations of Marsh, Morin, Parker, and Kaur [41]; all the rotated loads were freely estimated and the Geomin oblique rotation was chosen with an epsilon value of 0.5 to facilitate the subsequent comparison of the factorial structure obtained [42]. In the absence of a secondary factor load > 0.32, primary factor loadings > 0.50 were considered adequate [43] to maintain an item in a factor. The standardized factor loadings (λ) were reported.
The models (ESEM and CFA) were tested using the MLR estimation method (maximum likelihood robust) for continuous variables [44] while the models’ evaluation was based on the following goodness-of-fit indices: χ2/gl ratio values, CFI (Comparative Fit Index), TLI (Tucker–Lewis Index), RMSEA (Root Mean Square Error of Approximation) with its 90% Confidence Interval (CI), and the SRMR (Standardized Root Mean Square Residual). For the χ2/gl ratio, values < 2.0 or <5.0 are considered excellent [45] or acceptable [46], respectively; values < 0.95 or between 0.90 and 0.95 (CFI and TLI), below 0.06 or 0.10 (RMSEA), respectively, indicate an excellent or marginally acceptable fit [47], and SRMR values < 0.08 [46].
The reliability of the scale was evaluated with different parameters: composite reliability using the ω of McDonald [48], AVE (Average Variance Extracted) to measure convergent validity, and Cronbach’s alpha (α). Reliability values > 0.70 are considered acceptable. In addition, a temporal stability analysis was performed using the intraclass correlation coefficient (ICC) and its 95% CI, considering values ≥ 0.70 to be adequate [49].
The ASCS invariance was tested across sex and across educational level employing the MLR estimation. Four progressively more restrictive models were run for each of the two factors: (1) configural invariance; (2) weak invariance (i.e., invariance of the factor loadings/cross-loadings); (3) strong invariance (i.e., invariance of the factor loadings/cross-loadings, and intercepts); and (4) strict invariance (i.e., invariance of the factor loadings/cross-loadings, intercepts, and uniquenesses). In regard to the measurement invariance, the nested models were compared taking into account changes (Δ) in the goodness-of-fit indices (i.e., increases in RMSEA of at least 0.015 or decreases in the CFI and TLI of at least 0.010 indicating a lack of invariance) [50].
Given that the original two-factor dimensionalization proposed by Matovu [25] presented a high correlation between the latent variables of the CFA, a reflective higher-order factor [51] was also calculated, as proposed by Liu et al. [12]. Finally, to check the nomological validity of the scale, a regression model with latent variables was performed to check the predictive relationship of ASC to the dimensions of academic engagement. In this case, the effect size (f2) was calculated from R2 [40].

3. Results

3.1. Participants

In total, 681 university students aged between 18 and 57 participated (M = 24.55; DT = 5.35); 58% were women and 42% men. Regarding the educational level, 61.38% were undergraduate students and 38.2% were Master’s students. Two students did not consent to participate in the data collection and were not included in the study. The data were collected in May 2021. There were no missing values in the sample data included.

3.2. Descriptive and Exploratory Analysis of the Factorial Structure

In Table 1, the descriptive statistics of the items and the ESEM results can be checked. ESEM-1 was performed with all the items—items 1, 2, 4, 5, 6, and 7 showed primary factor loadings > 0.50 and secondary factor loadings > 0.32. Even item 9 showed a secondary factor loading > 0.32, indicating that it could be identified in the two factors. Items 3, 8, 9, and 10 were excluded from the following analyses. When performing ESEM-2 without these four items, all the remaining items showed primary factor loadings > 0.50 and no secondary factor loading exceeded the value 0.16. In the original theoretical model evaluated in ESEM-1, factor 1 (F1) consisted of four items and factor 2 (F2) consisted of six items, whereas in ESEM-2, both F1 and F2 are formed by three items. Of the two models evaluated, ESEM-2 presented excellent goodness-of-fit indices: ESEM-1: χ2/gl = 6.56, p = 0.000; CFI = 0.890; TLI = 0.810; RMSEA = 0.090 (90%CI = 0.078; 0.104); SRMR = 0.044; ESEM-2: χ2/gl = 3.08, p = 0.345; CFI = 0.989; TLI = 0.959; RMSEA = 0.055 (90%CI = 0.022; 0.092); SRMR = 0.016.

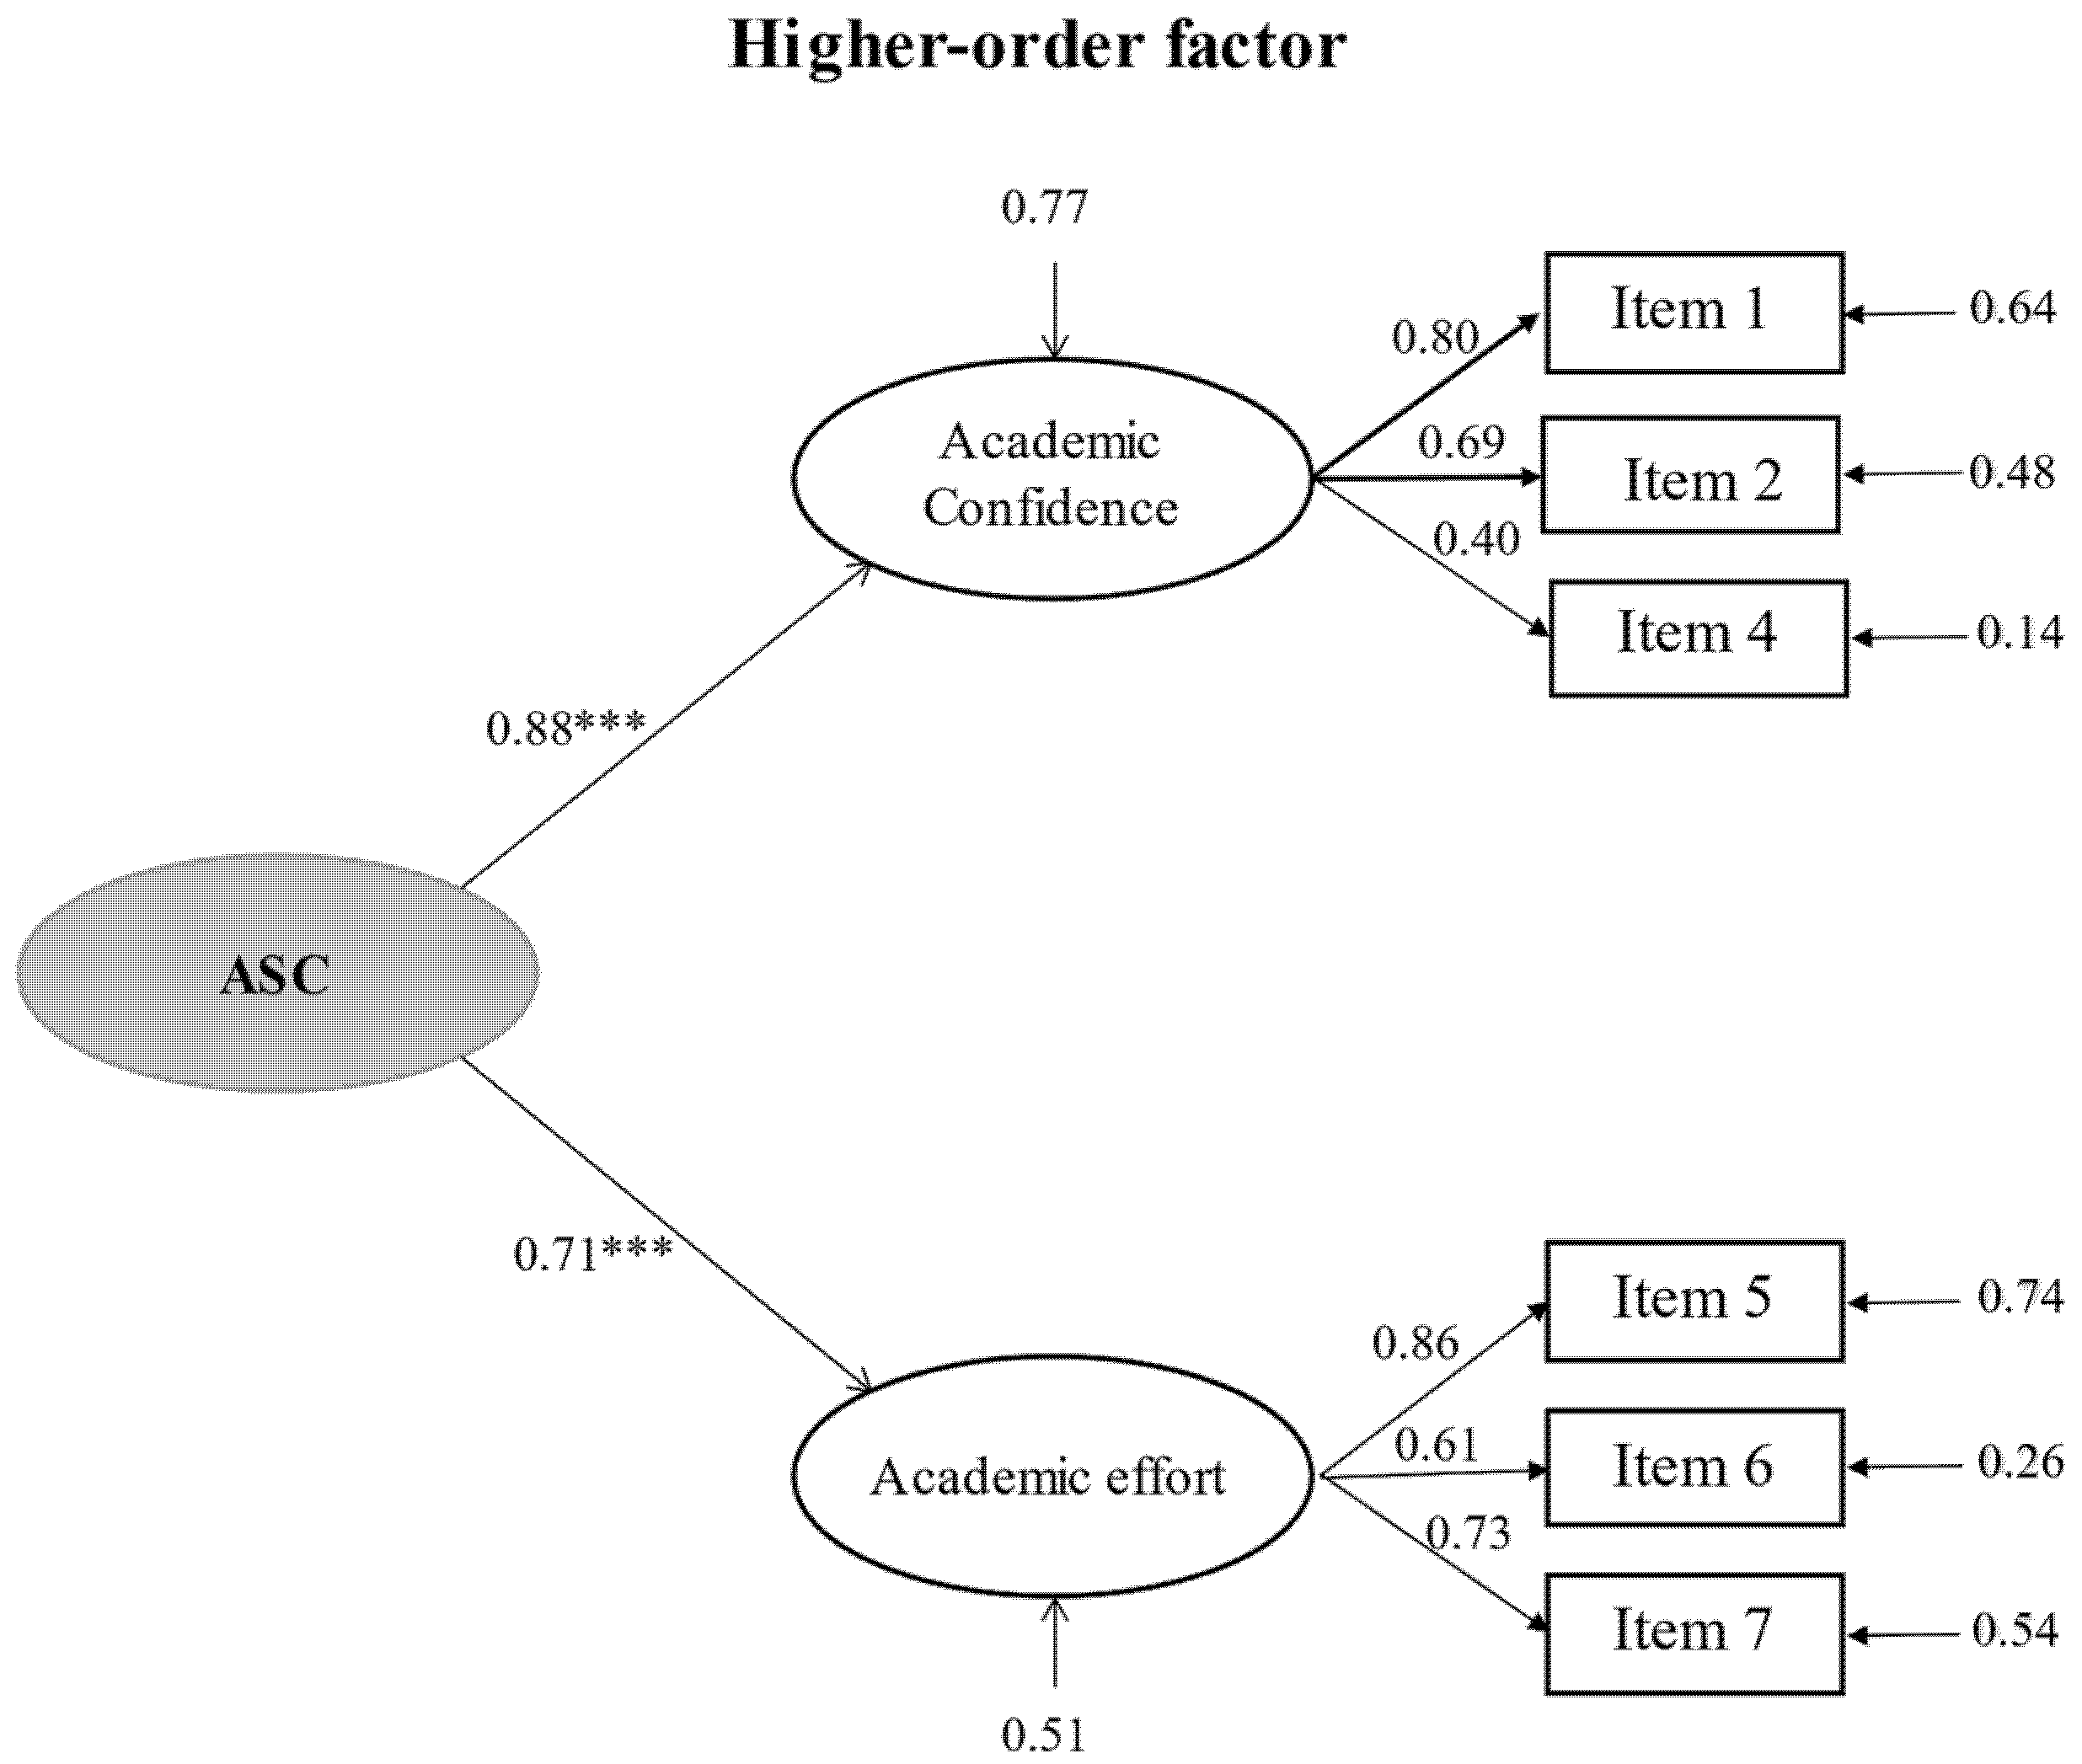
3.3. Factorial Structure and Reliability

Using the ESEM-2 model, a CFA was performed with the six items and two correlated factors that presented excellent goodness-of-fit indices: χ2/gl = 2.45, p = 0.007; CFI = 0.975; TLI = 0.952; RMSEA = 0.059 (90%CI = 0.036; 0.084); SRMR = 0.027. The standardized CFA factor loadings can be verified in Table 2. The reliability values were as follows: Academic confidence (F1), ω = 0.76, α = 0.71 and AVE = 0.52; Academic effort (F2), ω = 0.78, α = 0.77 and AVE = 0.54. The temporal stability analysis was evaluated using ICC for the two factors, with values > 0.83 obtained, for which the instrument was administered to an independent sample on two occasions with an interval of four weeks between the two data collections. Thus, H1 is met.

3.4. Measurement Invariance

The invariance of the ASCS was evaluated according to sex (i.e., male = 286, female = 395) and educational level (i.e., undergraduates = 418, Master’s = 263) based on the CFA model, the results of which are shown in Table 3 and Table 4. Starting with a configural invariance model (M0), invariance constraints were progressively added to the loading factors (i.e., weak invariance, M1), intercepts (i.e., strong invariance, M2), and residual variances (i.e., strict invariance). The values of these restrictive models were acceptable, except for strict invariance, since in the CFI and TLI, the results were outside the cut-off values. The weak and strong configural invariance models did not exceed the recommendations for RMSEA (Δ > 0.015), CFI (Δ > 0.01), and TLI (Δ > 0.01) but, as can be seen in Table 3 and Table 4, the strict invariance showed a decrease that slightly exceeded the limits of the recommended values, both according to the sex variable (ΔCFI = 0.019; ΔTLI = 0.013), and according to the educational level (ΔCFI = 0.018; ΔTLI = 0.024). H2 is met.
Although the correlation values between the two factors ensure discriminant validity [52], due to the high correlation between the two, it was decided to also calculate a higher-order model of the reflective type [51], as Liu et al. [12] did for the original scale. The goodness-of-fit indices of this higher-order model were excellent (χ2/gl = 1.72, p = 0.111; CFI = 0.996; TLI = 0.990; RMSEA = 0.033 (90%CI = 0.000; 0.065); SRMR = 0.034). The high correlation between the two latent variables indicates that the same subject may have high academic self-confidence and high academic effort. H3 is met, insomuch as the higher-order model demonstrates that a single higher-order latent variable can also be used: academic self-concept (ASC) (Figure 1).

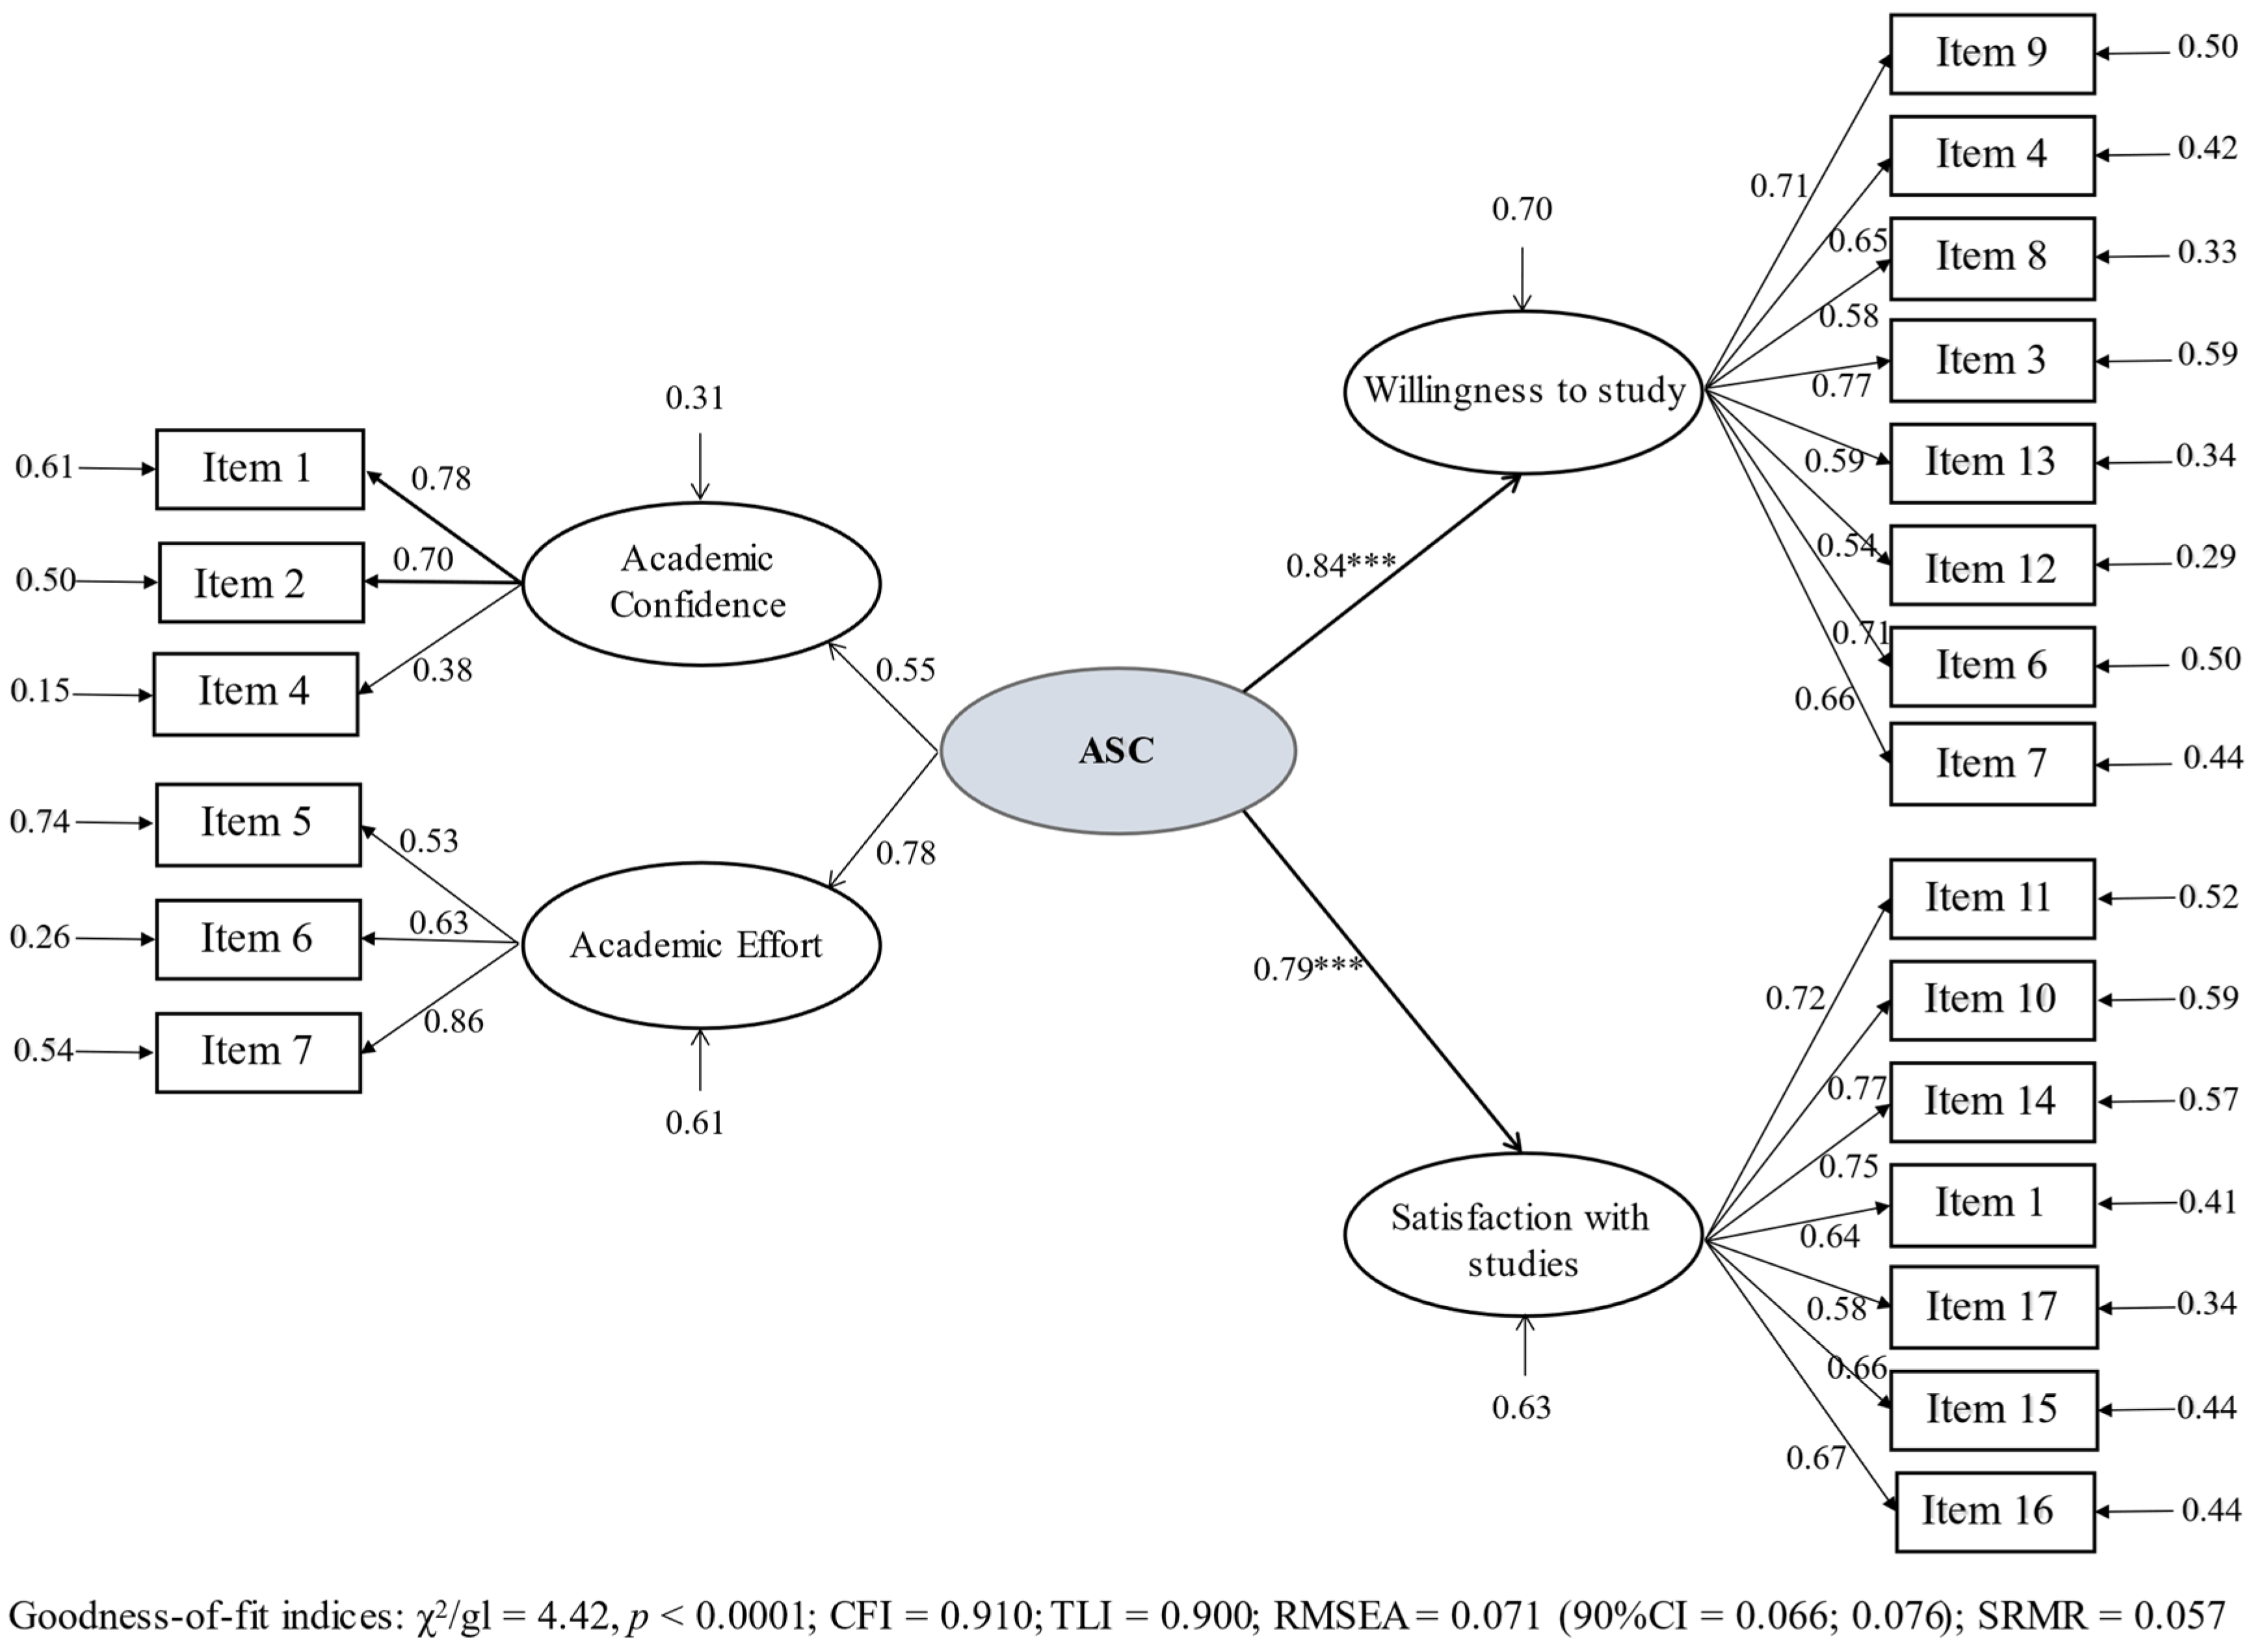
3.5. Nomological Validity

To provide evidence of nomological validity, we conducted a regression model with latent variables from the higher-order model (Figure 2). In this model, the ASC prediction is tested on the two factors of academic engagement (χ2/gl = 4.42, p < 0.0001; CFI = 0.910; TLI = 0.900; RMSEA = 0.071 (90%CI = 0.066; 0.076, SRMR = 0.057). The direct predictive relationships of ASC to the willingness to study is high and significant (β = 0.84; p < 0.0001; effect size f2 = 2.33), with 70% of the explained variance. Likewise, the ASC prediction of satisfaction with studies (β = 0.79; p < 0.0001; effect size f2 = 1.56) is also high and significant, with 63% of the explained variance. Therefore, H4 is met.

4. Discussion

The objectives of this study were: (i) to provide reliability and validity evidence on the dimensionality of the Spanish version of two correlated subscales to measure ASC; (ii) to analyze the factorial invariance of the scale according to sex and educational level; (iii) to analyze a higher-order model of the academic confidence and academic effort subscales; and (iv) to study the predictive relationship of ASC to academic engagement. The four proposed hypotheses were met: the ASCS obtained adequate validity and reliability values in a sample of Spanish university students (H1); factorial invariance obtained adequate values based on sex and educational level (H2); the higher-order model from the two subscales obtained adequate validity and reliability values (H3); and the ASC positively predicted the academic engagement subscales (H4). The results from the present research have shown the scale’s reliability and validity for two correlated factors to measure ASC in the Spanish university context; this did not exist before. Goodness-of-fit evidence for the factorial structure has been provided by exploratory and confirmatory methods as well as by other reliability and validity indices, such as ω, α, and AVE, in addition to demonstrating the temporal stability of the instrument.
Regarding Cronbach’s alpha, similar results were found to those obtained by Liu et al. [12] and Liu and Wang [14] with samples of secondary school students. These authors did not report composite reliability data or AVE, indicators that were analyzed in the present study and which have proven adequate, following the line taken in the version by Matovu [25] with university students. However, it should be noted that none of the previous research studied the instrument’s temporal stability, an aspect that has been demonstrated in the present study, and which represents a relevant contribution to the scientific literature.
Regarding the results obtained from the CFA, the present study obtained an adequate model fit for the two correlated factors. From an exploratory study (ESEM) in which (following Costello and Osborne, 2005) primary factor loadings > 0.50 and an absence of secondary factor loadings > 0.32 were considered adequate to maintain an item in a factor. These results even improved on the fits obtained by Liu et al. [12] and Matovu [25], since the data obtained in their studies for the GFI and CFI were >0.90 but <0.95 (48). Nevertheless, it should be noted that, in the present study, four items from the scale were excluded from the Spanish university adaptation, compared to the 10 items in the original version (see Liu et al. [12], and the version by Matovu [25]). Accordingly, we can highlight that the ASCS is a valid and reliable instrument since it has been used in different countries and at different educational levels, and when adapted to the Spanish university context, good results were obtained for reliability, validity, temporal stability, and the goodness-of-fit indices of the two-factor model.
With regards to the factorial invariance, the present work found that the Spanish version of the instrument is invariant based on sex and educational level. Similar results were obtained [25] with university students, in which it was also found that the ASCS is invariant according to sex and educational level. However, Liu et al. [12] did not analyze factorial invariance in their study on secondary school students. Thus, this study contributes to the consistency of the ASCS’s psychometric properties, meaning it can be used in future research regardless of the sex and educational level of the students.
Furthermore, the present work presented a reflective higher-order factor [51] from the two subscales—academic confidence and academic effort—obtaining adequate goodness-of-fit values. This means that the same student can have high academic self-confidence and show high academic effort; furthermore, ASC can be used as a single latent variable. This is in line with the findings of Liu et al. [12] and Matovu [25].
The predictive model proposed in this work found that ASC predicted the dimensions of academic commitment (predisposition to study and satisfaction with studies) in a statistically significant way. These findings follow the same line as those of Engels, Aelterman, Van Petegem, and Schepens [53], since the development of the students’ self-concept, through self-confidence and effort, increases their satisfaction with the school and with their studies, making them feel more engaged when carrying out school activities. In addition, these authors consider it an important indicator of the quality of education. Our results coincide with those obtained by Bakadorova et al. [29], in which ASC, in addition to predicting school engagement, also predicted emotional school engagement. Likewise, Tas [30] found that when students feel they have the skills to carry out school tasks, academic engagement increases, although not significantly, highlighting the need for more research that relates both constructs. Therefore, the search for a high academic self-concept is not only a desirable objective, but also a way to facilitate later academic achievement and stimulate academic persistence and educational choice behaviors [10]. However, Supervía, Salavera, and Murillo [54] proposed a predictive model in reverse; that is, the engagement predicted ASC, without finding a direct significant relationship, although it did report achievement goals as having a mediating effect between the engagement and ASC. This could be due to the fact that if self-confidence and academic effort are not developed in the students, the willingness to study and satisfaction with studies will likewise not develop, as our results show.

5. Conclusions

In summary, the findings of this study have shown that ASC is a reliable and valid instrument when applied to Spanish university students and that it can be applied regardless of gender and educational level, thus demonstrating the instrument’s temporal stability. Moreover, they have shown that the ASCS can be used as a higher-order model, showing that this same scale can measure ASC in a unidimensional way and, in turn, the academic confidence and academic effort. This represents a significant contribution to the existing literature, since no higher education scale had previously been validated that measured ASC using the dimensions of academic confidence and academic effort. Finally, it should be noted that ASC predicts the dimensions of academic engagement, that is to say, the students’ predisposition to study and satisfaction with studies.
Nevertheless, certain limitations in the research should be highlighted. Amongst these were the sample selected, which was one of convenience rather than randomized; the greater participation of women than men; the educational levels selected, consisting only of undergraduate and Master’s students; and the type of studies that the participants were pursuing, which were not described. As future lines of research, it would be interesting to implement experimental designs that measure emotional intelligence, resilience, and academic performance, including longitudinal studies that analyze the type of work the graduates obtain and the economic level attained, in order to analyze whether higher ASC is related to better job prospects.
We consider that this research may be of special interest to the university sector, both to teachers and to the students themselves since it will allow both to reflect on the importance of developing academic confidence and academic effort. It is important to continue research of this kind given the repercussions it can have on the university environment and its direct impact on the students’ employment opportunities.

Author Contributions

Conceptualization, A.G.-G.; Data curation, A.G.-G.; Formal analysis, A.G.-G.; Investigation, A.B.-E., J.C.E. and R.B.; Methodology, A.G.-G. and A.B.-E.; Project administration, A.G.-G., A.B.-E., J.C.E. and R.B.; Writing—original draft, A.G.-G., J.C.E. and R.B.; Writing—review & editing, A.G.-G. and A.B.-E. All authors have read and agreed to the published version of the manuscript.

Funding

This work has been carried out thanks to the help received in the research project entitled “Is the empowering-disempowering motivational climate perceived by undergraduate students related to the intention of being a teacher?” (Ref. PPUENTE2021/002), financed by Research Plan and Transfer of the University of Almeria.

Institutional Review Board Statement

The study was conducted according to the guidelines of the Declaration of Helsinki, and approved by the Ethics Committee of UNIVERSITY OF ALMERIA (UALBIO2021/009; 4 June 2021).

Informed Consent Statement

Informed consent was obtained from all subjects involved in the study.

Conflicts of Interest

The authors declare no conflict of interest.

References

  1. Albekov, A.; Romanova, T.; Vovchenko, N.; Epifanova, T. Study of factors which facilitate increase of effectiveness of university education. Int. J. Educ. Manag. 2017, 31, 12–20. [Google Scholar] [CrossRef]
  2. Demanet, J.; Van Houtte, M. School effects on deviance: An international perspective. In Resisting Education: A Cross-National Study on Systems and School Effects; Demanet, J., Van Houtte, M., Eds.; Springer Nature: Berlin/Heidelberg, Germany, 2019; pp. 3–26. [Google Scholar]
  3. Ehtiyar, R.; Baser, G. University Education and Creativity: An Assessment from Students’ Perspective. Eurasian J. Educ. Res. 2019, 19, 1–20. [Google Scholar] [CrossRef] [Green Version]
  4. Granero-Gallegos, A.; Carrasco-Poyatos, M. La enseñanza competencial en la Educación Superior. In Las Metodologías Didácticas Innovadoras Como Estrategia para Afrontar los Desafíos Educativos del Siglo XXI; Gómez-López, N., Fernández-Campoy, J.M., Eds.; Dykinson: Madrid, Spain, 2020; pp. 41–52. [Google Scholar]
  5. Baños, R.; Barretos-Ruvalcaba, M.; Baena-Extremera, A. Protocolo de estudio de las variables académicas, psicológicas y de actividad física que influyen en el rendimiento académico de adolescentes mexicanos y españoles | Protocol for the study of the academic, psychological and physical activity variables that influence the academic performance of Mexican and Spanish adolescents. ESPIRAL. Cuad. Profr. 2019, 12, 89–99. [Google Scholar] [CrossRef] [Green Version]
  6. Molina-Arriola, J.E.; Rodríguez-Cervantes, V.O.; Lozano-Flores, J.C.; Quintana-Rivera, L.; Moncada-Jiménez, J.; Gómez-Figueroa, J.A. La aptitud motriz como predictor del rendimiento académico Motor skills as a predictor of academic performance. Espiral 2021, 14, 57–64. [Google Scholar] [CrossRef]
  7. Lüftenegger, M.; Schober, B.; van de Schoot, R.; Wagner, P.; Finsterwald, M.; Spiel, C. Lifelong learning as a goal—Do autonomy and self-regulation in school result in well prepared pupils? Learn. Instr. 2012, 22, 27–36. [Google Scholar] [CrossRef]
  8. Fryer, L.K. Predicting self-concept, interest and achievement for first-year students: The seeds of lifelong learning. Learn. Individ. Differ. 2015, 38, 107–114. [Google Scholar] [CrossRef]
  9. Bakadorova, O.; Raufelder, D. The Interplay of Students’ School Engagement, School Self-Concept and Motivational Relations during Adolescence. Front. Psychol. 2017, 8, 2171. [Google Scholar] [CrossRef] [Green Version]
  10. Marsh, H.W.; Pekrun, R.; Lichtenfeld, S.; Guo, J.; Arens, A.K.; Murayama, K. Breaking the double-edged sword of effort/trying hard: Developmental equilibrium and longitudinal relations among effort, achievement, and academic self-concept. Dev. Psychol. 2016, 52, 1273–1290. [Google Scholar] [CrossRef] [PubMed]
  11. Brunner, M.; Keller, U.; Hornung, C.; Reichert, M.; Martin, R. The cross-cultural generalizability of a new structural model of academic self-concepts. Learn. Individ. Differ. 2009, 19, 387–403. [Google Scholar] [CrossRef]
  12. Liu, W.C.; Wang, C.K.J.; Parkins, E.J. A longitudinal study of students’ academic self-concept in a streamed setting: The Singapore context. Br. J. Educ. Psychol. 2005, 75, 567–586. [Google Scholar] [CrossRef] [PubMed]
  13. Ehm, J.-H.; Hasselhorn, M.; Schmiedek, F. Analyzing the developmental relation of academic self-concept and achievement in elementary school children: Alternative models point to different results. Dev. Psychol. 2019, 55, 2336–2351. [Google Scholar] [CrossRef] [PubMed]
  14. Liu, W.C.; Wang, C.K.J. Academic self-concept: A cross-sectional study of grade and gender differences in a Singapore secondary school. Asia Pac. Educ. Rev. 2005, 6, 20–27. [Google Scholar] [CrossRef]
  15. Marsh, H.W. Age andsex effects in multiple dimensions of self-concept: Preadolescence to early adulthood the multidimensionality of self-concept. J. Educ. Psychol. 1989, 81, 417–430. [Google Scholar] [CrossRef]
  16. Fang, J.; Huang, X.; Zhang, M.; Huang, F.; Li, Z.; Yuan, Q. The Big-Fish-Little-Pond Effect on Academic Self-Concept: A Meta-Analysis. Front. Psychol. 2018, 9, 1569. [Google Scholar] [CrossRef] [PubMed] [Green Version]
  17. Van Canegem, T.; Van Houtte, M.; Demanet, J. Grade retention and academic self-concept: A multilevel analysis of the effects of schools’ retention composition. Br. Educ. Res. J. 2021. [Google Scholar] [CrossRef]
  18. Marsh, H.W.; Craven, R.G. Reciprocal Effects of Self-Concept and Performance from a Multidimensional Perspective: Beyond Seductive Pleasure and Unidimensional Perspectives. Perspect. Psychol. Sci. 2006, 1, 133–163. [Google Scholar] [CrossRef] [PubMed]
  19. Belfi, B.; Goos, M.; De Fraine, B.; Van Damme, J. The effect of class composition by gender and ability on secondary school students’ school well-being and academic self-concept: A literature review. Educ. Res. Rev. 2012, 7, 62–74. [Google Scholar] [CrossRef]
  20. Bracken, B.A. Multidimensional Self Concept Scale. APA PsycTests 1992. [Google Scholar] [CrossRef]
  21. Mars, H.W. The Self Description Questionnaire (SDQ): A Theoretical and Empirical Basis for the Measurement of Multiple Dimensions of Preadolescent Self-Concept. A Test Manual and a Research Monograph; The Psychological Corporation: San Antonio, TX, USA, 1988. [Google Scholar]
  22. Offer, D.; Ostrov, E.; Howard, K.I.; Dolan, S. Offer Self-Image Questionnaire, Revised; Western Psychological Services: Los Angeles, CA, USA, 1992. [Google Scholar]
  23. García, F.; Musitu, G. AF5. Autoconcepto Forma 5; TEA: Madrid, Spain, 2001. [Google Scholar]
  24. Fernández-Zabala, A.; Goñi, E.; Rodríguez-Fernández, A.; Goñi, A.; México, A.C. Un nuevo cuestionario en castellano con escalas de las dimensiones del autoconcepto. Rev. Mex. Psicol. 2015, 32, 149–159. Available online: https://bit.ly/3rQINLV (accessed on 17 October 2021).
  25. Matovu, M. A Structural Equation Modelling of the Academic Self-Concept Scale. Int. Electron. J. Elem. Educ. 2014, 6, 185–198. Available online: https://bit.ly/3xjznJU (accessed on 17 October 2021).
  26. Méndez-Giménez, A.; Cecchini-Estrada, J.-A.; Fernández-Río, J.; Saborit, J.A.P.; Méndez-Alonso, D. 3 × 2 Classroom Goal Structures, Motivational Regulations, Self-Concept, and Affectivity in Secondary School. Span. J. Psychol. 2017, 20, E40. [Google Scholar] [CrossRef]
  27. Isiksal, M. A Comparative Study on Undergraduate Students’ Academic Motivation and Academic Self-Concept. Span. J. Psychol. 2010, 13, 572–585. [Google Scholar] [CrossRef] [PubMed]
  28. Gogol, K.; Brunner, M.; Preckel, F.; Goetz, T.; Martin, R. Developmental Dynamics of General and School-Subject-Specific Components of Academic Self-Concept, Academic Interest, and Academic Anxiety. Front. Psychol. 2016, 7, 356. [Google Scholar] [CrossRef] [PubMed] [Green Version]
  29. Bakadorova, O.; Lazarides, R.; Raufelder, D. Effects of social and individual school self-concepts on school engagement during adolescence. Eur. J. Psychol. Educ. 2019, 35, 73–91. [Google Scholar] [CrossRef]
  30. Tas, Y. The contribution of perceived classroom learning environment and motivation to student engagement in science. Eur. J. Psychol. Educ. 2016, 31, 557–577. [Google Scholar] [CrossRef]
  31. Schaufeli, W.B.; Martinez, I.M.M.; Pinto, A.M.; Salanova, M.; Bakker, A.B. Burnout and Engagement in University Students. J. Cross-Cult. Psychol. 2002, 33, 464–481. [Google Scholar] [CrossRef] [Green Version]
  32. Christenson, S.L.; Reschly, A.L.; Wylie, C. Handbook of Research on Student Engagement; Springer Science: Berlin/Heidelberg, Germany, 2012. [Google Scholar]
  33. Cachón-Zagalaz, J.; Lara-Sánchez, A.; Zagalaz-Sánchez, M.L.; López-Manrique, I.; De Mesa, C.G.G. Propiedades psicométricas de la escala Utrecht Work Engagement Scale en estudiantes de educación. Suma Psicol. 2018, 25, 113–121. [Google Scholar] [CrossRef] [Green Version]
  34. Battle, J. Culture-Free SEI. Self-Esteem Inventories for Children and Adults; Special Child Publications: Seattle, WA, USA, 1981. [Google Scholar]
  35. Marsh, H.W.; Smith, I.D.; Barnes, J. Multitrait-multimethod analyses of the self-description questionnaire: Student-teacher agreement on multidimensional ratings of student self-concept. Am. Educ. Res. J. 1983, 20, 333–357. [Google Scholar] [CrossRef]
  36. Piers, E.V.; Harris, D.B. Age and other correlates of self-concept in children. J. Educ. Psychol. 1964, 55, 91–95. [Google Scholar] [CrossRef]
  37. Muñiz, J.; Elosua, P.; Hambleton, R.K. Directrices para la traducción y adaptación de los tests: Segunda edición. Psicothema 2013, 25, 151–157. [Google Scholar] [CrossRef] [Green Version]
  38. Lynn, M.R. Determination and quantification of content validity. Nurs. Res. 1986, 35, 382–385. [Google Scholar] [CrossRef]
  39. Carretero-Dios, H.; Pérez, C. Normas para el desarrollo y revisión de estudios instrumentales. Int. J. Clin. Health Psychol. 2005, 5, 521–551. Available online: https://bit.ly/3m4QzB0 (accessed on 17 October 2021).
  40. Soper, D.S. Effect Size Calculator for Multiple Regression [Software]. 2021. Available online: https://bit.ly/3C68OLW (accessed on 13 September 2021).
  41. Marsh, H.W.; Morin, A.J.; Parker, P.D.; Kaur, G. Exploratory Structural Equation Modeling: An Integration of the Best Features of Exploratory and Confirmatory Factor Analysis. Annu. Rev. Clin. Psychol. 2014, 10, 85–110. [Google Scholar] [CrossRef] [PubMed] [Green Version]
  42. Schmitt, T.A. Current Methodological Considerations in Exploratory and Confirmatory Factor Analysis. J. Psychoeduc. Assess. 2011, 29, 304–321. [Google Scholar] [CrossRef] [Green Version]
  43. Costello, A.; Osborne, J.W. Best practices in exloratory factor analysis. Pract. Assess. Res. Eval. 2005, 10, 1–9. [Google Scholar] [CrossRef]
  44. Li, C.-H. Confirmatory factor analysis with ordinal data: Comparing robust maximum likelihood and diagonally weighted least squares. Behav. Res. Methods 2015, 48, 936–949. [Google Scholar] [CrossRef] [Green Version]
  45. Tabachnick, B.G.; Fidell, L.S. Using Multivariate Statistics, 7th ed.; Pearson: London, UK, 2019. [Google Scholar]
  46. Hu, L.; Bentler, P.M. Cutoff criteria for fit indexes in covariance structure analysis: Conventional criteria versus new alternatives. Struct. Equ. Model. A Multidiscip. J. 1999, 6, 1–55. [Google Scholar] [CrossRef]
  47. West, S.G.; Taylor, A.B.; Wu, W. Model Fit and Model Selection in Structural Equation Modeling. In Handbook of Structural Equation Modeling; Hoyle, R.H., Ed.; The Guilford Press: New York, NY, USA, 2012; pp. 209–231. [Google Scholar]
  48. McDonald, R.P. The theoretical foundations of principal factor analysis, canonical factor analysis, and alpha factor analysis. Br. J. Math. Stat. Psychol. 1970, 23, 1–21. [Google Scholar] [CrossRef]
  49. Dunn, T.J.; Baguley, T.; Brunsden, V. From alpha to omega: A practical solution to the pervasive problem of internal consistency estimation. Br. J. Psychol. 2013, 105, 399–412. [Google Scholar] [CrossRef] [PubMed] [Green Version]
  50. Chen, F.F. Sensitivity of Goodness of Fit Indexes to Lack of Measurement Invariance. Struct. Equ. Model. A Multidiscip. J. 2007, 14, 464–504. [Google Scholar] [CrossRef]
  51. Lévy-Mangin, J.P.; Varela, J. Modelización con Estructuras de Covarianzas en Ciencias Sociales; Netbiblo: La Coruña, Spain, 2006. [Google Scholar]
  52. Henseler, J.; Ringle, C.M.; Sarstedt, M. A new criterion for assessing discriminant validity in variance-based structural equation modeling. J. Acad. Mark. Sci. 2014, 43, 115–135. [Google Scholar] [CrossRef] [Green Version]
  53. Engels, N.; Aelterman, A.; Van Petegem, K.; Schepens, A. Factors which influence the well-being of pupils in flemish secondary schools. Educ. Stud. 2004, 30, 127–143. [Google Scholar] [CrossRef] [Green Version]
  54. Supervía, P.; Salavera, C.; Murillo, V. The mediating role of goal orientation (Task) in the relationship between engagement and academic self-concept in students. Int. J. Environ. Res. Public Health 2020, 17, 8323. [Google Scholar] [CrossRef] [PubMed]
Figure 1. Higher-order factor of the reflective type, with standardized weights and errors of measurement for academic self-concept. *** p < 0.001.
Education 11 00653 g001
Figure 2. Regression model of academic self-concept for academic engagement. *** p < 0.0001.
Education 11 00653 g002
Table 1. Descriptive statistics of the items and exploratory factor analysis of the Academic Self-Concept Scale.
ESEM-1ESEM-2
ItemsMDTQ1Q2F1 (λ)F2 (λ)F1 (λ)F2 (λ)
(1) Puedo seguir el desarrollo de las clases con facilidad (I can follow the lectures easily).5.221.43−0.67−0.190.670.130.780.15
(2) Puedo ayudar a mis compañeros de clase en su trabajo escolar (I am able to help my course mates with their schoolwork).5.541.24−0.720.160.730.000.82−0.01
(3) A menudo hago mi trabajo de clase sin pesar (I often do my course work without thinking). *3.981.68−0.00−0.850.21−0.15
(4) Si trabajo duro, creo que puedo sacar mejores notas (If I work hard, I think I can get better grades).5.881.36−1.200.800.58−0.080.570.01
(5) Presto atención al profesorado durante las clases (I pay attention to the lecturers during lectures).5.071.49−0.54−0.230.170.650.160.66
(6) Estudio mucho para mis exámenes (I study hard for my tests).5.121.48−0.54−0.340.050.57−0.010.60
(7) Normalmente estoy interesado en el trabajo de clase (I am usually interested in my course work).5.111.54−0.64−0.24−0.010.870.000.86
(8) Haré todo lo posible para aprobar todas asignaturas este curso/semestre (I will do my best to pass all the courses this semester).6.271.20−1.742.420.420.03
(9) No me rindo fácilmente cuando me enfrento a una pregunta o tarea difícil en mi trabajo de clase (I do not give up easily when I am faced with a difficult question in my course work).5.761.34−0.960.190.330.41
(10) Puedo hacerlo mejor que mis amigos/as compañeros/as en la mayoría de las asignaturas (I am able to do better than my friends in most courses).4.691.53−0.40−0.190.36−0.08
Note. ESEM = Exploratory analysis of the factorial structure; M = Mean; DT = Standard deviation; Q1 = Asymmetry; Q2 = Kurtosis; F1 = Academic confidence; F2 = Academic effort; λ = Standardized factor loadings; Factor loadings >0.50 (primaries) are highlighted in bold; (*) Negatively worded items.
Table 2. Confirmatory factor analysis; standardized factor loadings for each factor of the Academic Self-Concept Scale.
ItemsConfirmatory Factor Analysis
F1F2
Item 10.74 ***
Item 20.85 ***
Item 40.55 ***
Item 5 0.78 ***
Item 6 0.59 ***
Item 7 0.81 ***
F1 with F20.67
Note. *** p < 0.001; F1 = Academic confidence; F2 = Academic effort.
Table 3. Invariance test across gender for the Academic Self-Concept Scale.
Modelχ2dfRMSEA [90% IC]CFITLIΔRMSEAΔCFIΔTLI
Measurement across gender
1.Configural invariance60.428 *160.092 [0.068–0.117]0.9110.914
2.Weak invariance60.296 *200.082 [0.060–0.105]0.9110.913−0.0100.000−0.001
3.Strong invariance79.839 *230.087 [0.066–0.108]0.9860.9100.005−0.005−0.003
4.Strict invariance95.473 *290.083 [0.065–0.102]0.9670.897−0.004−0.019−0.013
Note. χ2 = Chi square; df = degrees of freedom; RMSEA = root mean square error of approximation; 90% CI = 90% confidence interval of the RMSEA; CFI = comparative fit index; TLI = Tucker–Lewis index; * p < 0.01.
Table 4. Invariance test across educational level for the Academic Self-Concept Scale.
Modelχ2dfRMSEA [90% IC]CFITLIΔRMSEAΔCFIΔTLI
Measurement across educational level
1.Configural invariance64.688 *160.096 [0.072–0.121]0.9080.911
2.Weak invariance74.119 *200.091 [0.069–0.113]0.8980.905−0.005−0.010−0.006
3.Strong invariance77.246 *230.085 [0.064–0.106]0.8980.899−0.0060.000−0.006
4.Strict invariance108.669 *290.091 [0.073–0.110]0.8800.8750.006−0.018−0.024
Note. χ2 = Chi square; df = degrees of freedom; RMSEA = root mean square error of approximation; 90% CI = 90% confidence interval of the RMSEA; CFI = comparative fit index; TLI = Tucker–Lewis index; * p < 0.01.
Publisher’s Note: MDPI stays neutral with regard to jurisdictional claims in published maps and institutional affiliations.

