
Ensuring Scalability of a Cognitive Multiple-Choice Test through the Mokken Package in R Programming Language


Department of Science and Technology Education, Faculty of Education, University of Johannesburg, Auckland Park, Johannesburg 2006, South Africa
*
Author to whom correspondence should be addressed.
Educ. Sci. 2021, 11(12), 794; https://0-doi-org.brum.beds.ac.uk/10.3390/educsci11120794
Submission received: 27 September 2021
/
Revised: 25 November 2021
/
Accepted: 26 November 2021
/
Published: 7 December 2021
Abstract
:This study investigated the scalability of a cognitive multiple-choice test through the Mokken package in the R programming language for statistical computing. A 2019 mathematics West African Examinations Council (WAEC) instrument was used to gather data from randomly drawn K-12 participants (N = 2866; Male = 1232; Female = 1634; Mean age = 16.5 years) in Education District I, Lagos State, Nigeria. The results showed that the monotone homogeneity model (MHM) was consistent with the empirical dataset. However, it was observed that the test could not be scaled unidimensionally due to the low scalability of some items. In addition, the test discriminated well and had low accuracy for item-invariant ordering (IIO). Thus, items seriously violated the IIO property and scalability criteria when the HT coefficient was estimated. Consequently, the test requires modification in order to provide monotonic characteristics. This has implications for public examining bodies when endeavouring to assess the IIO assumption of their items in order to boost the validity of testing.
1. Introduction
Learner ability at the basic and post-basic level of education in a particular subject is based on quantum of knowledge, usually measured by a cognitive test. These tests can be categorised as one of two varieties, multiple-choice and constructed-response tests. In Nigeria, public examining bodies have adopted both tests to determine the degree of achievement attained by test takers. The multiple-choice type of test has received more attention because of its ability to test learners across more subjects than the constructed-response format, as well as its objectivity and ease of scoring, among other advantages. However, it has been criticised in the literature has for the possibility of not being fair to all test takers and for its vulnerability to guessing. The West African Examinations Council (WAEC) is a regional examination body recognised internationally and charged with the obligation of conducting examinations for candidates transitioning from high school into various higher education institutions (HEIs) of learning. Their awarded certificate is generally accepted worldwide because the test items undergo standardisation. However, studies have established the validity of this instrument using classical test theory in terms of reliability and factor analysis [1,2,3,4]. Test development from a Classical Test Theory (CTT) perspective [1] aims to develop a valid and reliable test by excluding items that are biased or poorly constructed. Unfortunately, this aim is not always achieved [1]. Algina and Swaminathan argued that test development is an iterative process involving the observed outcomes from the test, the context and design of the test, and how individual items compare to the other test items, resulting in information on how each item discriminates and functions within that test.
According to Sijtsma and colleagues [5], before an instrument can be regarded as a good measure, it must have an exact number of dimensions (either uni- or multi-dimensional), and the psychometric properties of the test must be estimated accurately. To the best of our knowledge, there is no evidence in the literature to show that the WAEC items went through a scaling process in order to ascertain the validity of the scores emanating from this test using modern psychometric theory and Mokken scale analysis (MSA).
2. Literature Review
2.1. Mokken Scale Analysis
To achieve scaling of the test items, a method [6,7] called Mokken Scale Analysis (MSA) was used. MSA is a non-parametric tool that provides various ways of establishing the relationship between items and the latent traits being measured. Mokken scale analysis relates to exploring the fit of the NIRT models. In case an analyst wants to utilise a measurement property suggested by a specific non-parametric IRT model, the researcher must illustrate that the model fits the data adequately [8]. The basis of non-parametric IRT is to explore whether observable properties suggested by the non-parametric IRT model hold within the data. For instance, a non-negative inter-item correlation is an observable property suggested by the monotone homogeneity model. If the observable properties do not hold, the researcher must conclude that the non-parametric IRT model does not describe the data adequately and desist from utilising the ordinal measurement properties inferred by the model [7,8]. For illustration, negative inter-item relationships in the data demonstrate that the monotone homogeneity model does not hold, which means the test score cannot be utilised for ordinal individual measurement.
The scaling procedure consists of an item selection algorithm to partition a set of items into Mokken scales and methods in order to assess the assumptions of Non-parametric Item Response Theory (NIRT) models. This method was recently used to ascertain the scalability of cognitive (dichotomous or polytomous) and non-cognitive (questionnaire, rating scale) tests [9]. Meanwhile, the most-used NIRT models for cognitive tests, as suggested by [8], are the monotone homogeneity model (MHM) and the double monotonicity model (DMM). When cognitive item responses adequately fit the monotone homogeneity model, there is a valuable property that warrants the results, which accounts for test takers’ responses in relation to their ability (θ). Based on the observed score of their correct responses, the expected order of the test takers on the latent measurement continuum is equal for each selection of items if those test items are from a monotonously homogeneous item bank. The establishment of MHM and DMM is founded on the conditional independence, unidimensionality, and monotonicity assumptions of IRT, though DMM includes non-intersection of item response functions [9,10].
Conditional independence is the response to items that are independent of any other items on the scale when θ is conditioned. For unidimensionality, Mokken scale analysis recommends an automated item selection procedure (AISP) to select many items that measure the same latent trait [6]. Monotonicity is when item response functions are non-decreasing functions of a latent trait, θ [11,12], which implies that the probability of a test taker’s correct response on an item correlates positively with the latent trait level; that is, the greater the item score, the higher the latent trait level is expected to be. In addition, commonly used unidimensional parametric IRT models such as the Rasch model [13], the two-, three- and four-parameter logistic model [14,15], and the graded response model [16], assume unidimensionality, conditional independence, and latent monotonicity, respectively. Consequently, for the Mokken scale to be established, all of the basic assumptions need to be met; methods for ensuring this are currently available by using the open-source R software package “Mokken” [17].
2.2. Scalability Coefficients
Homogeneity coefficients play a significant role in the process of Mokken scale analysis. Three scalability coefficients are considered estimates, namely item scalability coefficient (Hi), item–pair scalability coefficient (Hij), and total scale scalability coefficient (H), respectively. Ligtvoet et al. [18] were the first to introduce the importance of scalability coefficients to evaluate the homogeneity of a set of items. The scalability of each item–pair coefficient (Hij) was described by [19] as the ratio of the covariance of items Xi and Xj and the maximum possible covariance given the marginals of the two scores on items Xi and Xj. This is expressed as:
Stochl and colleagues [10,20] described item scalability coefficient Hi as the proportion of the sum of all pairwise covariances to any item i and the sum of all possible pairwise maximum covariances of this item i, summarising the precision of item discrimination and the power of the relationship between the item and the entire set of items. Thus, the higher the value of Hi, the better the power of discrimination. The item scalability, Hi, is described as:
Finally, the total scalability coefficient H is the ratio of the sum of all pairwise covariances and the sum of all pairwise maximum covariances [19], exploring the relationship between the sum score and trait scale. Higher values of H show that the means of total scores can be used for individual ordering with high precision. Thus, the scalability coefficient (H) for n items is defined as:
where i, j = test item number, X = item scores, and n = total number of items.
Van der and colleagues [21,22] recommended that items be regarded as a Mokken scale when all values of the item–pair scalability coefficient are positive, and all item scalability coefficients are greater than 0.30. Succinctly, it is recommended by [23] that for the monotone homogeneity model, all item scalability coefficients (Hi), item–pair scalability coefficients (Hij), and total scale scalability coefficients (H) must have values ranging from 0 to 1. In addition, if H = 1, it shows no disordering of the item responses, and if H = 0, it implies no linear correlation among the test items. Consequently, H can be regarded as the degree of accuracy by which items within a scale are able to order the test takers [24]. In practice, [25] recommends the following rule of thumb for the interpretation of the scale: scale values of H < 0.30 are not considered to be unidimensional, values of 0.30 ≤ H < 0.40 are a weak scale that is unidimensional but not strong, values of 0.40 ≤ H < 0.50 are of medium strength, and only when H > 0.50 is the scale regarded as strong. Greater H values indicate that the slope of the item characteristic curves (ICCs) tend to be steeper, which implies that the items discriminate better among different latent traits θ [26].
2.3. Invariant Item Ordering (IIO)
In the realm of accurate assessment, test items are expected to be ordered based on their difficulty/threshold for easier interpretation of test scores. In [7,27,28], different studies ordered the items administered on intelligence testing according to their level of difficulty and the examinees’ age group. This test was ordered with simple items as starting point and terminated with more difficult items. More importantly, the advantage of this item ordering makes it possible for examinees with lower ability to not necessarily be required to complete the most difficult test items, which is one of the features of adaptive testing. IIO is important if the test items favour a particular sub-group; this is called differential item function (DIF). This happens when examinees with the same ability have a different probability of responding correctly to an item [29]. These differing likelihoods of responding correctly to items might be based on various negligible characteristics of the examinees and the assessed ability of the test.
Consequently, when a sub-population varies in responding correctly to items, it brings favour or disfavour to a sub-group, and comparability of test scores will be adversely affected. It is noteworthy to state that test items that meet the assumptions of IIO should be free of DIF discrepancies. Based on the aforementioned, it is clear that if test items are not ordered in the same manner for all the examinees across the latent trait continuum, then the generated scores can have different implications. This property is essential when dealing with large-scale assessment where examinees are compared with one another (norm-referenced), and important decisions are made based on the scores [30]. In Nigeria, large-scale assessments administered by WAEC are used for admission and placement in HEIs. For this reason, the psychometric properties (including IIO) of these assessments should be examined in order to interpret test scores in a valid and reliable way.
In the context of IIO, the HT coefficient can be used as a measure, showing the accuracy of the ordering of both dichotomous and polytomous items [18,31]. More so for cognitive items, [8] argues that if H is calculated on the transposed data matrix denoted as (HT), then a measure is obtained summarising the precision of item ordering within the scale. When the item response functions (IRFs) for the items are near each other, the HT value is low, and when the IRFs are far apart it is high. IIO is tenable for a dataset when the estimated HT value is between 0 and 1. The strength, H, of the IIO in educational assessment is essential in order to judge whether test scores are valid and reliable for high-stakes exams used in decision making. Thus, these researchers recommend similar rules of thumb for the interpretation of HT coefficients: values of HT ≤ 0.3 show that the item ordered is not accurate enough to be practically useful, 0.3 ≤ HT < 0.4 indicates low precision, and 0.4 ≤ HT < 0.5 depicts moderate precision, while values greater than 0.5 show high and adequate precision of item ordering within a scale [18]. However, the item coefficient Hi is used to ascertain the good items that would make up the scale. To have a unidimensional scale, all Hi must be greater than 0.3. This ensures the monotone homogeneity of items as a property of the final scale.
In this study, the multiple-choice item is emphasised. If the multiple-choice items used by WAEC to evaluate learners are to be judged truly fair to all the test takers, then the items must pass the scalability tests in order to accurately identify items to be used in assessing the learners effectively, and to determine which must be adjusted to meet the requirements of MHM. Since the advent of MSA, researchers, e.g., [27,32], have used this method in order to determine the psychometric characteristics of many instruments in various studies. To our knowledge, no study in the literature has explored the advantages underlying NIRT models (MHM) for the calibration of WAEC mathematics test items. This study advances and showcases the importance of Mokken analysis in ordering the test-takers on a latent continuum in relation to the sum scores of the items belonging to the same scale. Consequently, the purpose of this study is two-fold, and encapsulated in the following research questions:
- To what extent do the empirical datasets for WAEC mathematics assessments support the fit of the monotone homogeneity model?
- What is the extent of item-invariant ordering (IIO) of the test items?
3. Materials and Methods
3.1. Participants
Two thousand, eight hundred sixty-six qualified K-12 students preparing for WAEC exams agreed to participate willingly in this study. For ethical purposes, student consent was sought, and the school administrators also gave permission before their participation. Participants were randomly chosen across Education district 1 of Lagos State, Nigeria. Student ages ranged between 14 and 20 years, with an average age of 16.5 years (SD = 1.5 years); 43% of them were male while 57% were female.
3.2. Measures
The WAEC is a large-scale exam comprised of many subjects. In this study, mathematics test items were used, which is one of the cross-cutting subjects all K-12 students must sit for. Students use outcomes from this test to seek admission into HEIs. Hence, it is regarded as high-stakes, and the items that form the test must adequately measure traits in a valid and reliable way. This multiple-choice test comprises fifty items from various content domains, with one correct option and three decoys. The test is standardised, having gone through different stages of test development and validation. The participants scored 1 for a correct and 0 for an incorrect response through shading of an optical marks reader (OMR).
3.3. Data Analysis
The obtained data were analysed using the Mokken package version 3.0.2 [25] in R software version 4.0.1 [17]. The analysis assessed scalability coefficients for all the items making a scale (H), the individual items in the scale (Hj), and the item pairs (Hij), based on the benchmark recommended by [6] that a scale is weak when H has a value of less than 0.30, moderate when H has a value between 0.40 and 0.50, and strong when it has a value greater than 0.50. In addition, individual items (Hj) are suitable for consideration in the Mokken scale if their value is above 0.30; otherwise (Hj < 0.30), such items should be removed or revised. Item pair (Hij) values are positive and above zero. Moreover, an automated item selection procedure (aisp) function in the Mokken package was used to examine the dimensionality of the test using the suggested benchmark by [9,10] that the initial lower bound c should start from 0.30 and subsequent analyses should be increased with 0.05 steps up to a value of 0.55. The scale is regarded as unidimensional if all items are chosen in one scale for a lower bound of c ≤ 0.3; if the values of c increase, these items would not be selected to be part of the scale. Lastly, item ordering of the scale was checked using manifest invariant item ordering (MIIO) to ascertain its extent of precision and accuracy.
This method (MIIO) organized items into rest-score groups and analysed the item response function gaps (IRFs) using the dataset. Ligtvoet et al. [18] suggested this method for investigating the distance between IRFs, which compares the ordering of item means for all item pairs separately from rest-score groups. Items are compared in groups of two and compose the total score. These two items’ scores are not taken into consideration; subsequently, the rest of the items are utilised. In a bid to establish these comparisons, the rest score, Rij, and total k-2 score are each estimated, and the k-2 score is evaluated without the scores for items i and j. More importantly, the significance of effect size violation was assessed using the Critical (Crit) values suggested by [7,8,9], namely that violation is minor if Crit < 40; that violation is nonserious but must be revised by the researcher if 40 ≤ Crit < 80; and that violation is serious if Crit ≥ 80.
4. Results
A Mokken scale analysis was performed on the dataset (N = 2866), representing a 97% response rate from the administered mathematics instrument. The scalability coefficients were established to determine their compliance or violation of the monotone homogeneity model. Table 1 presents the coefficients.
Table 1 shows the result for the scalability of 50 multiple-choice mathematics items of the WAEC. It can be seen that all the item scalability (Hj) coefficients were positive (accepted), except for items 4, 10, 14, 16, 19, 23, 25, 28, 35, 37, 39, 42, 45, 47, and 49, respectively, which fell below the benchmark of 0.30 (although their standard errors are within the cut-off if it is considered). An indication of these items may be that they are unique in terms of their underlying constructs (multidimensional) and not coherent with the rest of the items. Furthermore, each item pair (Hij) was positive, with values ranging from 0.21 to 0.68 (0.02 < SE < 0.05), while the test scale coefficient (H) was 0.46 with a standard error of 0.04 after expunging items that did not meet the criteria of Hj ≥ 0.30 (suggesting a moderate scale as recommended by [33]). The observed low scalability of these items might be due to their being poorly worded or too complex, or too confusing to understand; or, in a multiple-choice response examination, more than one of the choices may be correct, or none of the choices provided actually correct. The item may be so easy so that all students have it correct, or so hard that only the very advanced or even brilliant students can do it. In addition, items may be taken out of the examination or reworked to correct it. Sometimes easy terms are even kept as a way of relaxing the student when starting an examination, with harder items kept in for the few students who have an advanced understanding. Furthermore, as indicated by Straat and colleagues [10,34], the pattern of the Mokken scale and dimensionality for its set of items was assessed via the automated item selection procedure (aisp) function in the Mokken package using a genetic algorithm (“ga”). This was conducted using an initial lower bound c set at 0.30, showing the bottom value of discrimination for items (Hj) and progressing at an interval of 0.05 steps until reaching 0.55. This returned a matrix with as many rows as items, indicating which scale an item belongs for each lower bound. Table 2 presents the pattern of aisp for the mathematics items.
Table 2 presents the Mokken scale/dimensionality of the test (1 shows that an item fulfilled unidimensionality, 0 shows it did not, while above 2 indicates multidimensionality), which was performed six times using lower bound times c (0.30, 0.35, 0.40…,0.55). For instance, when 0.30 was taken as the cut-off, 32 items were scaled as unidimensional; at 0.35, 31 items were scaled as unidimensional; at 0.40, 21 items were scaled as unidimensional; at 0.45, nine items were scaled unidimensional; at 0.50, eight items were scaled unidimensional; and with a cut-off of 0.55, eight items were scaled unidimensional. A higher cut-off is correlated with fewer items scaled as unidimensional due to lower item scalability. Moreover, it is advisable to run the lower bound cut-off many times in order to ascertain the actual dimension underlying the scale. Careful examination of the table suggests a six-factor structure based on the lower bound values.
Consequently, a multidimensional scale is evident, with dimensions such as number and numeration, algebraic process, mensuration, statistics and probability, and geometry and trigonometry. According to [9,23], a scale is unidimensional when most or all of the items are in one scale, and multidimensional as lower bound c increases if most or all the items are in two or more scales, or two or more smaller scales and many unscalable items. However, if the matrix patterns from the aisp function are not clear, researchers are expected to conclude on the number of structure factor(s) on their own [9,35].
Having established the Mokken scale for the test, the IIO was checked using manifest invariant item ordering (MIIO) and the HT method. Moreover, test items violating IIO were deleted via the backward selection technique. As proposed by [18], the least scalability item is deleted when there is evidence of violations for two or more equal items. This exploratory technique has as an alternative; the bad items observed to be violating the IIO characteristic are deleted, and the remaining items are subjected to IIO again in iterative steps. Furthermore, for the item response function it is suggested that one item should be deleted at a time, as IIO violation of other items might be affected by adding or removing any particular item. Table 3 and Table 4 present the IIO assessment and backward selection method for the test.
Table 3 shows the summary of all the items, with an item-scalability coefficient (ItemH), the number of possible violations in which the item can be involved (#ac), the number of actual violations in which the item is involved (#vi), the number of times the item appears in a significant violation of manifest item invariant ordering (MIIO) (#zsig), and the crit value [7], which is mostly used by researchers as a diagnostic statistic. As recommended by [36], high crit values (Crit ≥ 80) depict serious violations of IIO and, by implication, represent a bad item. Crit < 40 implies a minor violation while 40 ≤ Crit < 80 indicates serious violation where the item needs revision. Columns 4 and 5 in Table 3 present the number of significant violations and Crit for all the items. Twelve items (10, 14, 16, 19, 23, 25, 28, 37, 39, 42, 45 and 47) significantly violated IIO; 24% of the items had serious violations, 46% had non-serious violations, and 30% had minor violations. Many of these items with significant violations are consistent with the earlier NIRT homogeneity investigation. Table 4 presents the backward selection procedure for the removal of violated items. The number of conflicting items for each item is shown in the first step. Items i and j conflict with each other when their estimated monotonicity functions intersect, resulting in a violation.
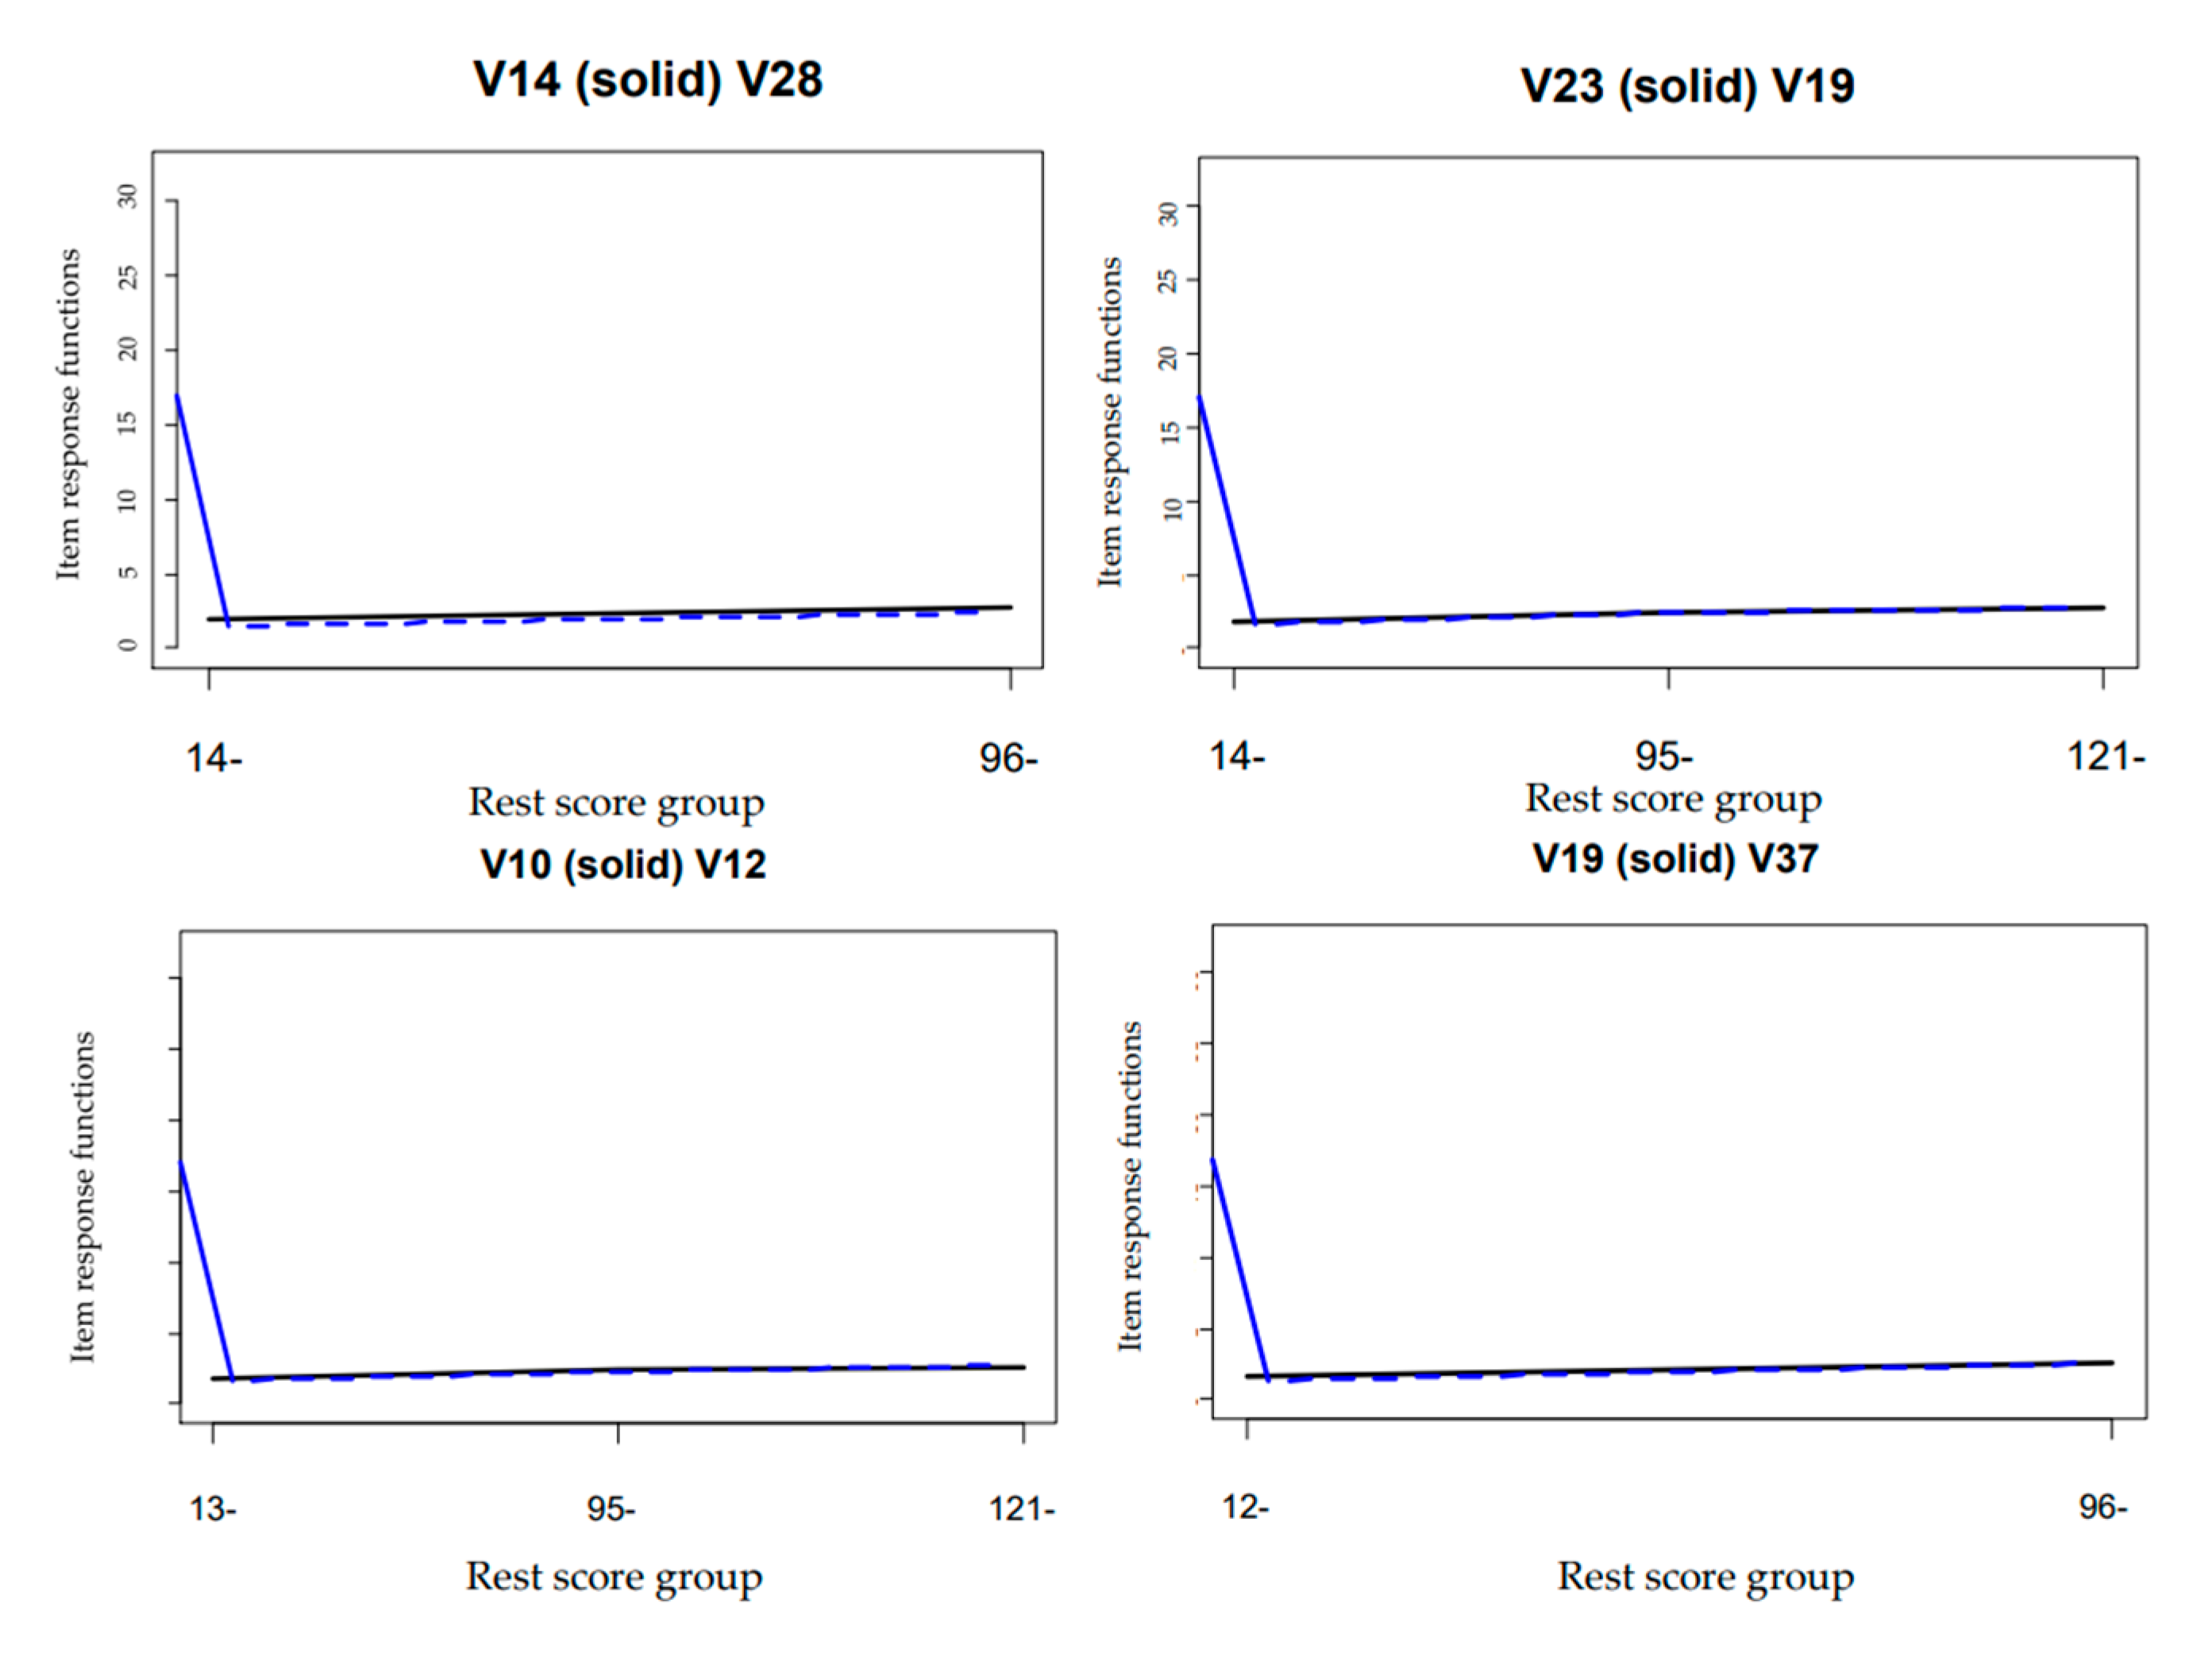
The values in Table 4 represent the number of violations; NAs imply that the item has been removed. Consequently, items 10, 14, 16, 19, 23, 25, 28, 37, 39, 42, 45 and 47 were removed due to significant violations. However, after expunging this set of items, there were no more significant violations of IIO. Moreover, an HT coefficient of 0.35 was estimated for the surviving items, which is above the minimum IIO cut-off of 0.30 suggested by [18]. Based on this analysis, the MSA has established that the thirty-eight surviving items constitute a scale with IIO characteristics, although the scale can also be regarded as one with no accurate precision in terms of IIO. This was further shown using an abridged IRF plot (Figure 1) for some of the violated items, as there was intersection between two IRFs, implying a mutual interplay between pairs of items and indicating one of the two items as misfitting.
Figure 1 shows the graphs for the rest score group and the IRFs for item pairs, which indicate a very close item response function to one another. This same trend was observed for the rest of the item pair plots. This implies that the test items under investigation provide minimal information about item order, and many of the items violated invariant item ordering (IIO).
5. Discussion
This study focused on using one of the non-item response theory models, MHM, to examine the underlying psychometric properties of the 2019 West African Examinations Council mathematics instrument. To the best of our knowledge and after an in-depth review of the literature, the application of Mokken Scale Analysis to the WAEC mathematics test appears not to have been previously explored. Our results established that the empirical data were consistent with a monotone homogeneity model, and many of the items discriminated well, though about twelve items (Hj < 0.30) were identified as misfits when measured by scalability coefficient; all of the item pairs (Hij) were positive. This lends credence to the work of [7,26] that the sum of the test score is a better indicator of the latent trait. This can be used to order the students on the latent continuum trait. However, items with a scalability below the cut-off of 0.30 should be given more attention by modifying or revising them. Consequently, the total test scalability (H) of 0.46 shows that the scale is moderate [21], and fits the monotone homogeneity model assumption.
In addition, the automated item selection procedure (AISP) for Mokken scale analysis was used to establish another NIRT assumption (unidimensionality) for all the test items. The benchmark used for lower bound c was 0.30 to 0.55. It was remarked that the test is multidimensional, with six scale structures, namely number and numeration, algebraic process, mensuration, statistics and probability, calculus, and trigonometry. Thus, the test could not be scaled as unidimensional due to lower values of some items’ scalability. This finding is in agreement with the work of Sijtsma and colleagues [9,12], who used lower bound values to determine the structure of their different scales. Moreover, as observed in Table, IIO assessment showed a number of items violating the assumption. The Crit values of these items were calculated to be above 80, and Crit values greater than 80 indicate a severe IIO violation. The mathematics multiple-choice test was developed by practitioners using the syllabus to cover all sections of the content areas (see Appendix B for test items details). This is a high-stakes examination for the participants, so it is important that it is valid and reliable. However, subjecting it to Mokken scale analysis revealed that some items are valid, while some are invalid to be scaled. Interaction with mathematics teachers and chief examiners on the overall test items (cohort) shows that the standard of the items was quite good and competes favourably with those of previous years, and was free from ambiguity within the ambit of the syllabus. The differences observed on some of the items (such as 10, 14, 16, 19, 23, 25, 28, 37, 39, 42, 45 and 47) alluded to the fact that distracters are very plausible, with the possibility of pseudo-guessing on the items, inability to express ratio as fractions, inadequate understanding of geometry and trigonometry items, shallow knowledge of the various types of variation and inability to interpret application of financial arithmetic and word problems. Furthermore, items detected as misfitting are assumed to violate the monotonicity or the IIO assumption and had a Crit > 80. This assumption implies that the ordering of the items according to item difficulty is the same across all values of personal characteristics. In essence, the IIO assumption implies that the item–response functions (IRFs) do not intersect if items are ordered and numbered from the less difficult to the most difficult. Consequently, these items violated IIO assumption and had rest-scores intersected between pairs of items. These items need serious revision in order to provide monotonicity characteristics. Thus, it is clear that the test has some items that violate IIO. This is against the suggestion of Meijer and colleagues [30,35] that the intensity of items is automatically reflected in the ordering of items when the quality of a scale is examined.
Consequently, public examining bodies in sub-Saharan Africa should become aware that items on the test can be expected to be ordered based on their difficulty level, making the interpretation of test scores much easier. In [7], items on intelligence tests were ordered based on their level of difficulty and the examinee’s age group. This test was ordered with easy items as a starting point, with the termination rule depending on the difficulty level of the items. This pattern of item ordering leads to examinees with low ability not necessarily being required to complete the most difficult test items, which is one of the features of an adaptive test. Furthermore, analysis of backward selection showed that 12 items were removed, which are denoted as (NAs). Following the removal of these items, there were no more significant violations of IIO. An HT coefficient of 0.35 indicated that the 2019 WAEC mathematics test items had low accuracy in terms of the item ordering, and that the scale was weak [18]. This lends credence to the claims in [10,30] that many factors, such as item location/threshold and slope/discrimination level, can grossly affect the estimated HT coefficient. For instance, in their simulation study, the HT coefficient value increased as the item slope increased or as the mean distance between the item thresholds increased. This causes the item response functions to be far apart. In this study, the IRF plots were very close to each other, which violates the IIO assumption. Therefore, this mathematics test may not have been scaled based on all NIRT criteria, since there were issues associated with unidimensionality, monotonicity, and invariant item ordering. This research study recognises that there are limitations and future directions associated with this study. In particular, further study could be carried out on the entire country to increase the sample size of K-12 participants in order to obtain more generalisable results. This study did not assess previous years of WAEC mathematics instruments to establish their scalability, monotonicity, and invariant item ordering, except for the year 2020 only. Another limitation is that the WAEC uses multiple-choice and polytomous mathematics items to assess examinees, which complement each other; further study could replicate the adoption of the Mokken package to establish the scalability, monotonicity, and invariant item ordering of polytomous test items. Finally, any inter-relations between the initial and refined items were not assessed in this study.
6. Conclusions
The psychometric qualities of 2019 WAEC mathematics test items were examined in the framework of Mokken scale analysis. The strength and weakness of any test items can be established using various IRT models. In this study, the NIRT model used provides multiple approaches by which the test items of the WAEC can be improved drastically. It was found that some items failed to adequately fit the NIRT model, and need to be revised. Moreover, more attention should be devoted to the reordering of test items according to difficulty level in order to obtain precise score estimates using Mokken scale analysis. Thus, public examining bodies should always endeavour to assess the IIO assumptions of their test in order to boost its validity.
Author Contributions
Conceptualization, M.A.A.; methodology, M.A.A.; software, M.A.A.; validation, M.A.A.; formal analysis, M.A.A.; investigation, M.A.A.; resources, M.A.A.; data curation, M.A.A.; writing—original draft preparation, M.A.A.; writing—review and editing, M.A.A. and M.N.; visualization, M.A.A.; supervision, M.N.; project administration, M.A.A.; funding acquisition, Self-funding. All authors have read and agreed to the published version of the manuscript.
Funding
This research received no external funding.
Institutional Review Board Statement
The study was conducted according to the guidelines of the Declaration of Helsinki and approved by the Ethics Committee of University of Johannesburg (protocol code Sem 2-2021-071 and date of approval: 19 August 2021).
Informed Consent Statement
Informed consent was obtained from all participants involved in the study.
Data Availability Statement
The dataset presented in this study are available on request. The data are not publicly available due to privacy reasons.
Conflicts of Interest
The authors declare no conflict of interest.
Appendix A. Code Lines Used in R Software
- ✔
- Download R software at http://www.r-project.org/ (25 November 2021), then install on the system.
- ✔
- Install R packages and their dependencies from the menu. Here, mokken package was used.
- ✔
- WAEC < -read.csv(“C:/Users/xx xx/Desktop/WAEC.csv”, header = FALSE)
- #
- Import dataset to R environment
- ✔
- library(mokken)
- #
- Call package for the analysis
- ✔
- coefH(dataframe=WAEC)
- #
- Compute scalability coefficients (Hij, Hi & H) and standard errors
- ✔
- SCALE < -aisp(dataframe = WAEC, lowerbound = 0.3, search = “ga”, alpha = 0.05, popsize = 20, verbose = TRUE)
- #
- automated item selection for unidimensional scale
- ✔
- print (SCALE)
- #
- Print output
- ✔
- SCALES <- aisp(dataframe, lowerbound = seq(0.30, 0.55, 0.05))
- #
- Perform automated item selection for unidimensional scale for increasing lower bounds
- ✔
- print (SCALE)
- ✔
- Print output
- ✔
- INVARIANT < -(check.iio(dataframe, method = “MIIO”, alpha = 0.05, item.selection = TRUE, verbose = TRUE))
- #
- assessment of invariant item ordering
- ✔
- Summary (INVARIANT)
- #
- summary for assessment of invariant item ordering
- ✔
- plot(check.iio(dataframe))
- #
- Plot item response function for test items
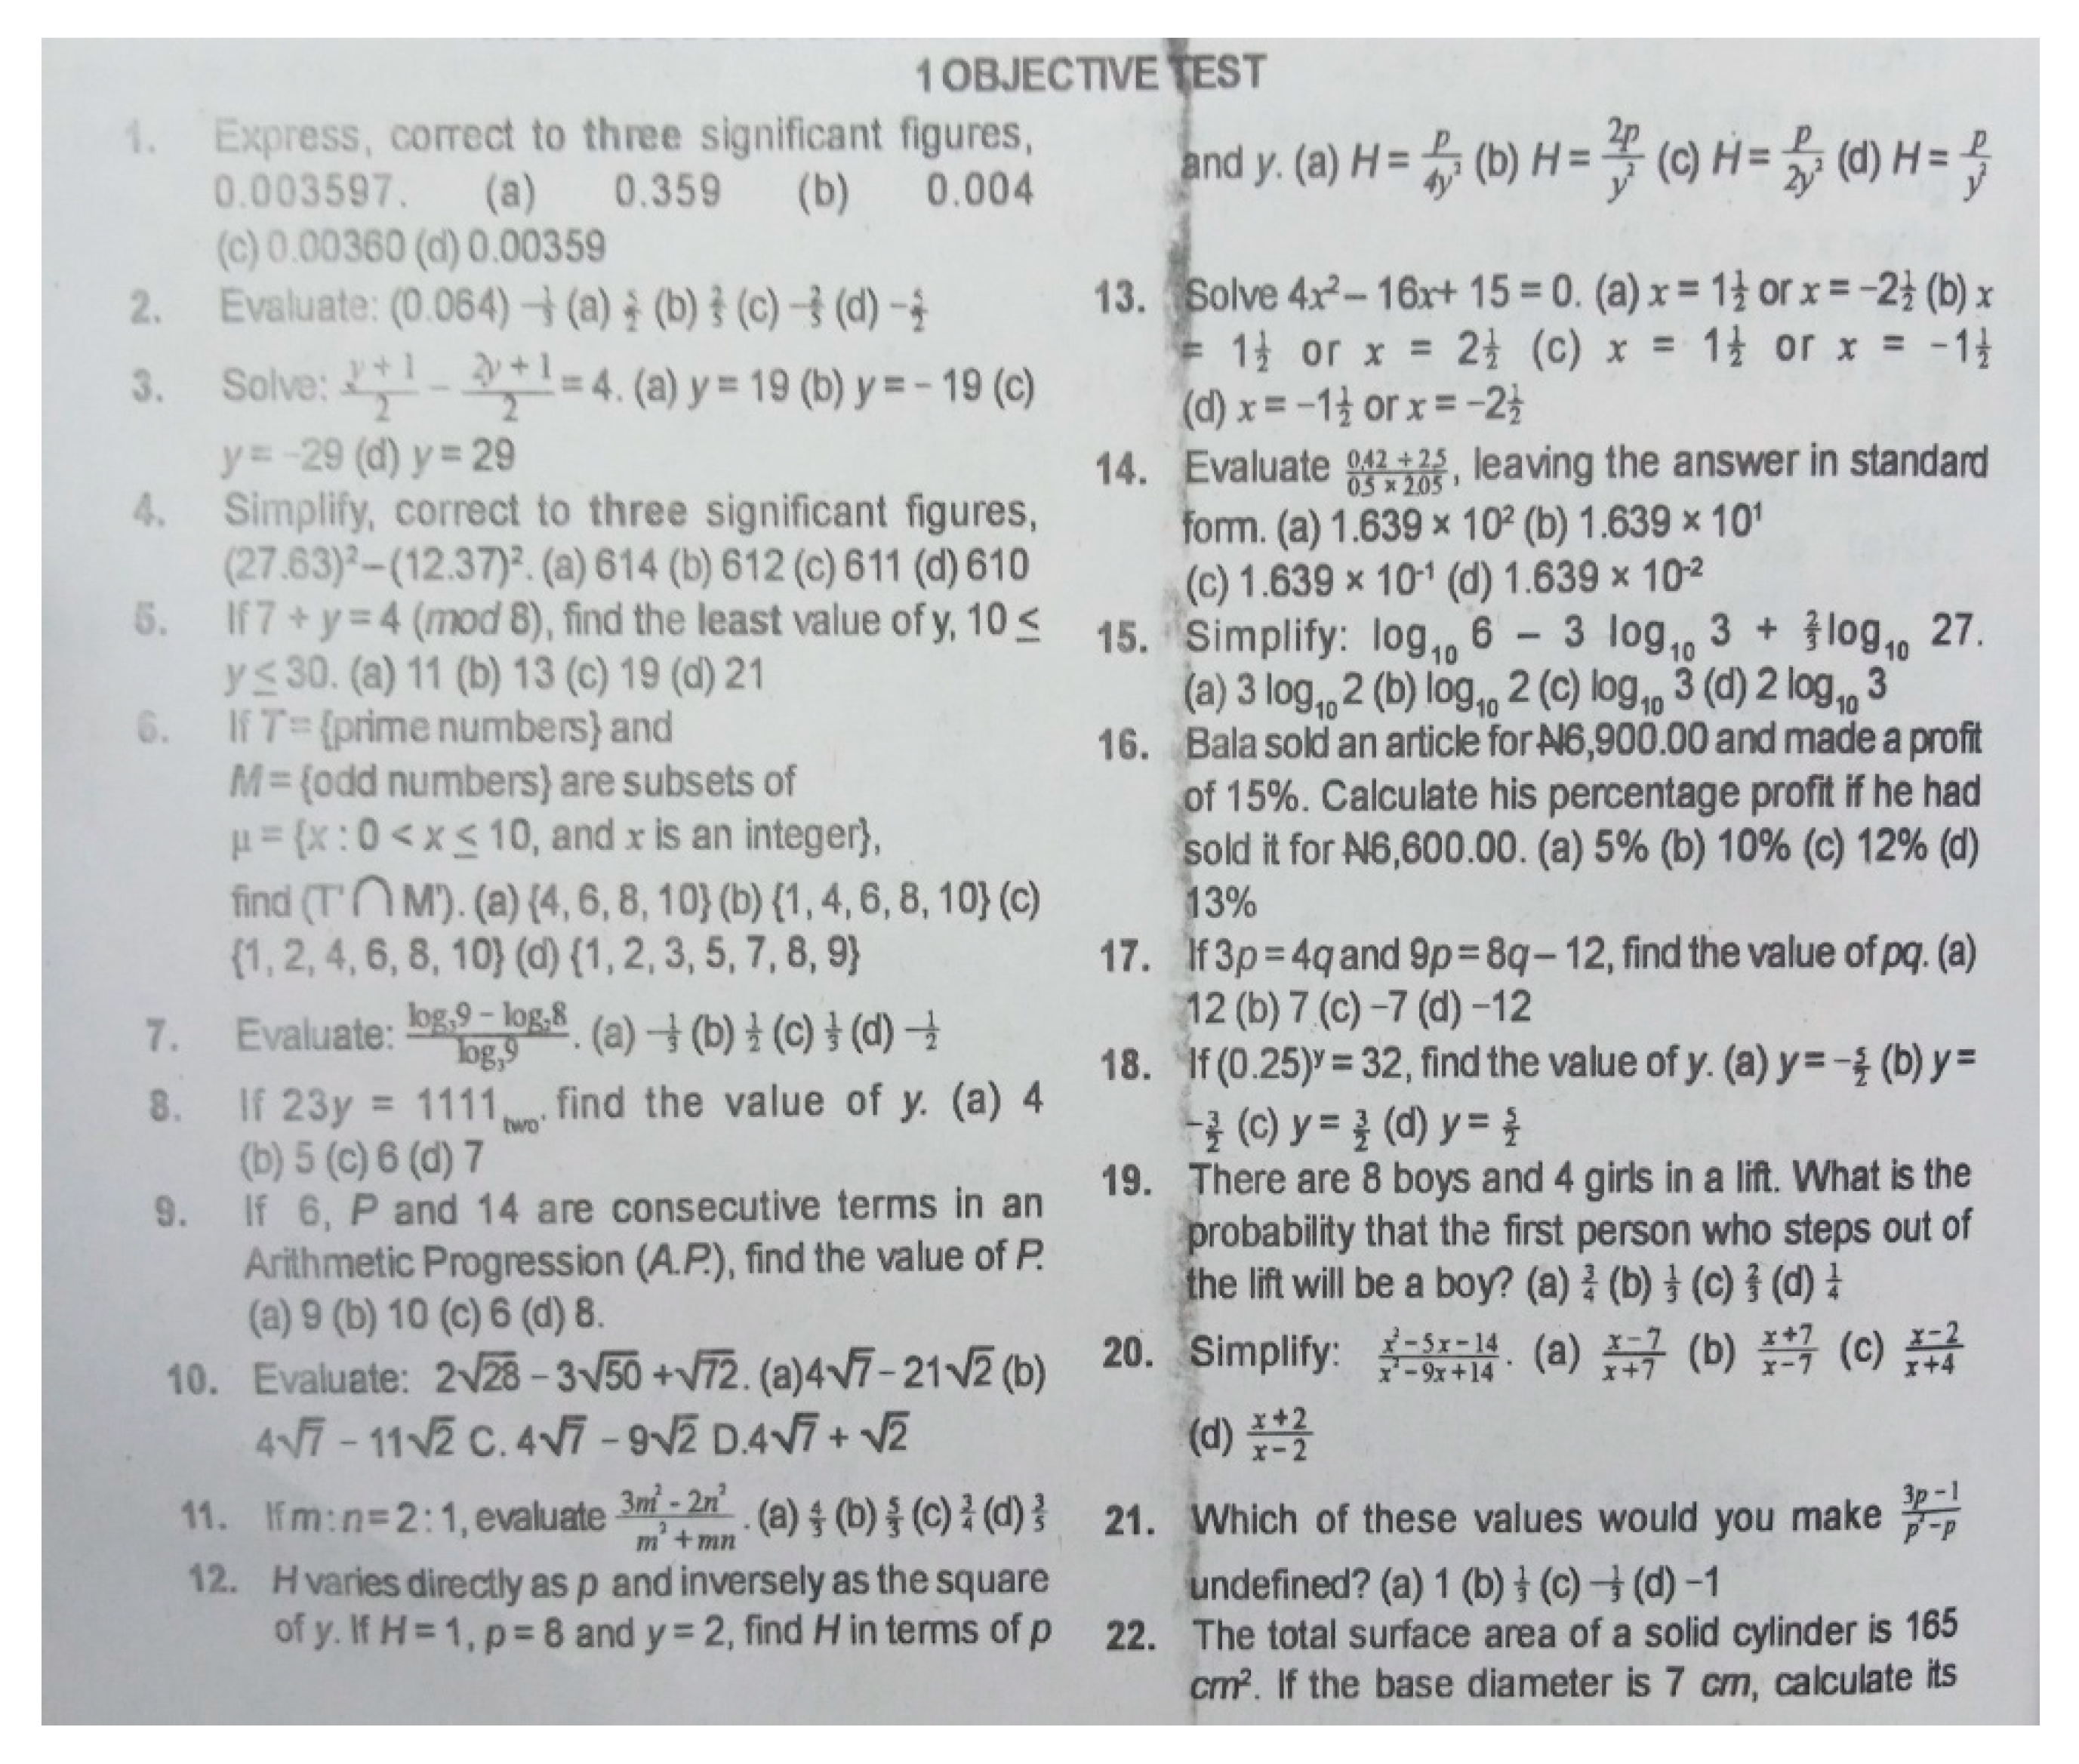
Appendix B. 2019 West African Examinations Council Mathematics Multiple-Choice Test Items
Figure A1.
2019 West African Examinations Council Mathematics Multiple-Choice Test Items. The figure is continuous (Items 1–22).
Figure A1.
2019 West African Examinations Council Mathematics Multiple-Choice Test Items. The figure is continuous (Items 1–22).

Figure A2.
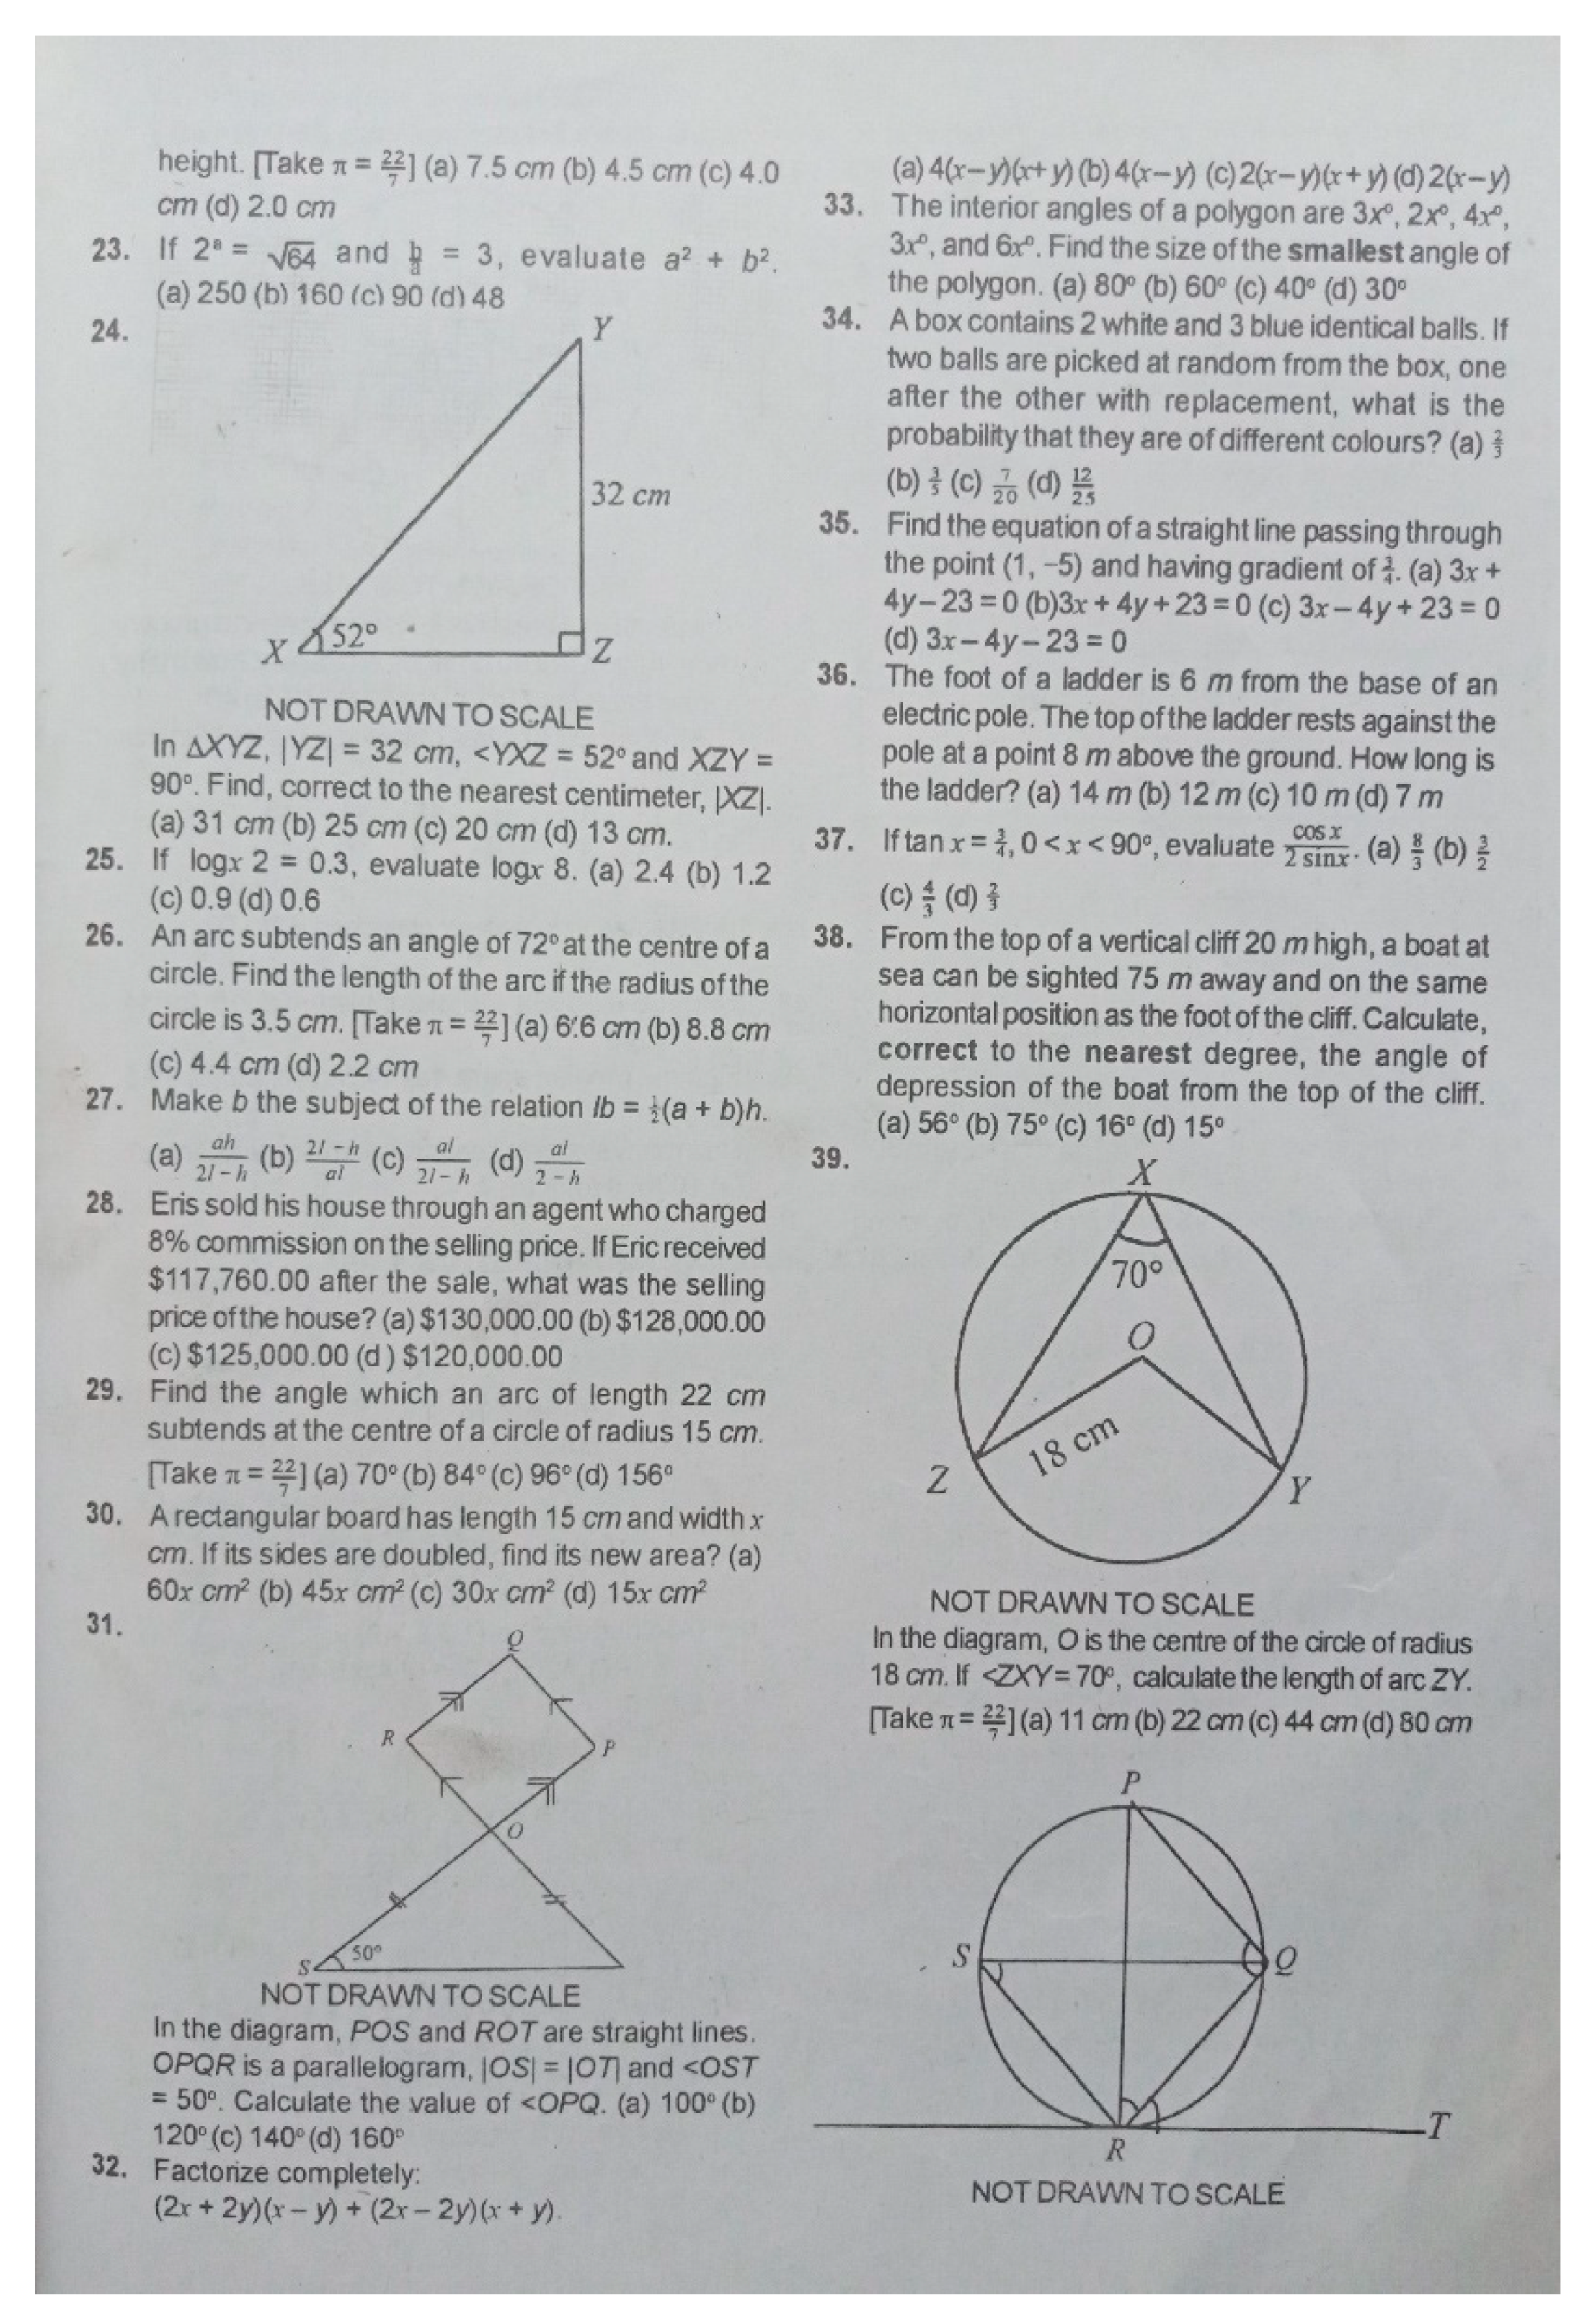
2019 West African Examinations Council Mathematics Multiple-Choice Test Items. The figure is continuous (Items 23–39).
Figure A2.
2019 West African Examinations Council Mathematics Multiple-Choice Test Items. The figure is continuous (Items 23–39).

Figure A3.
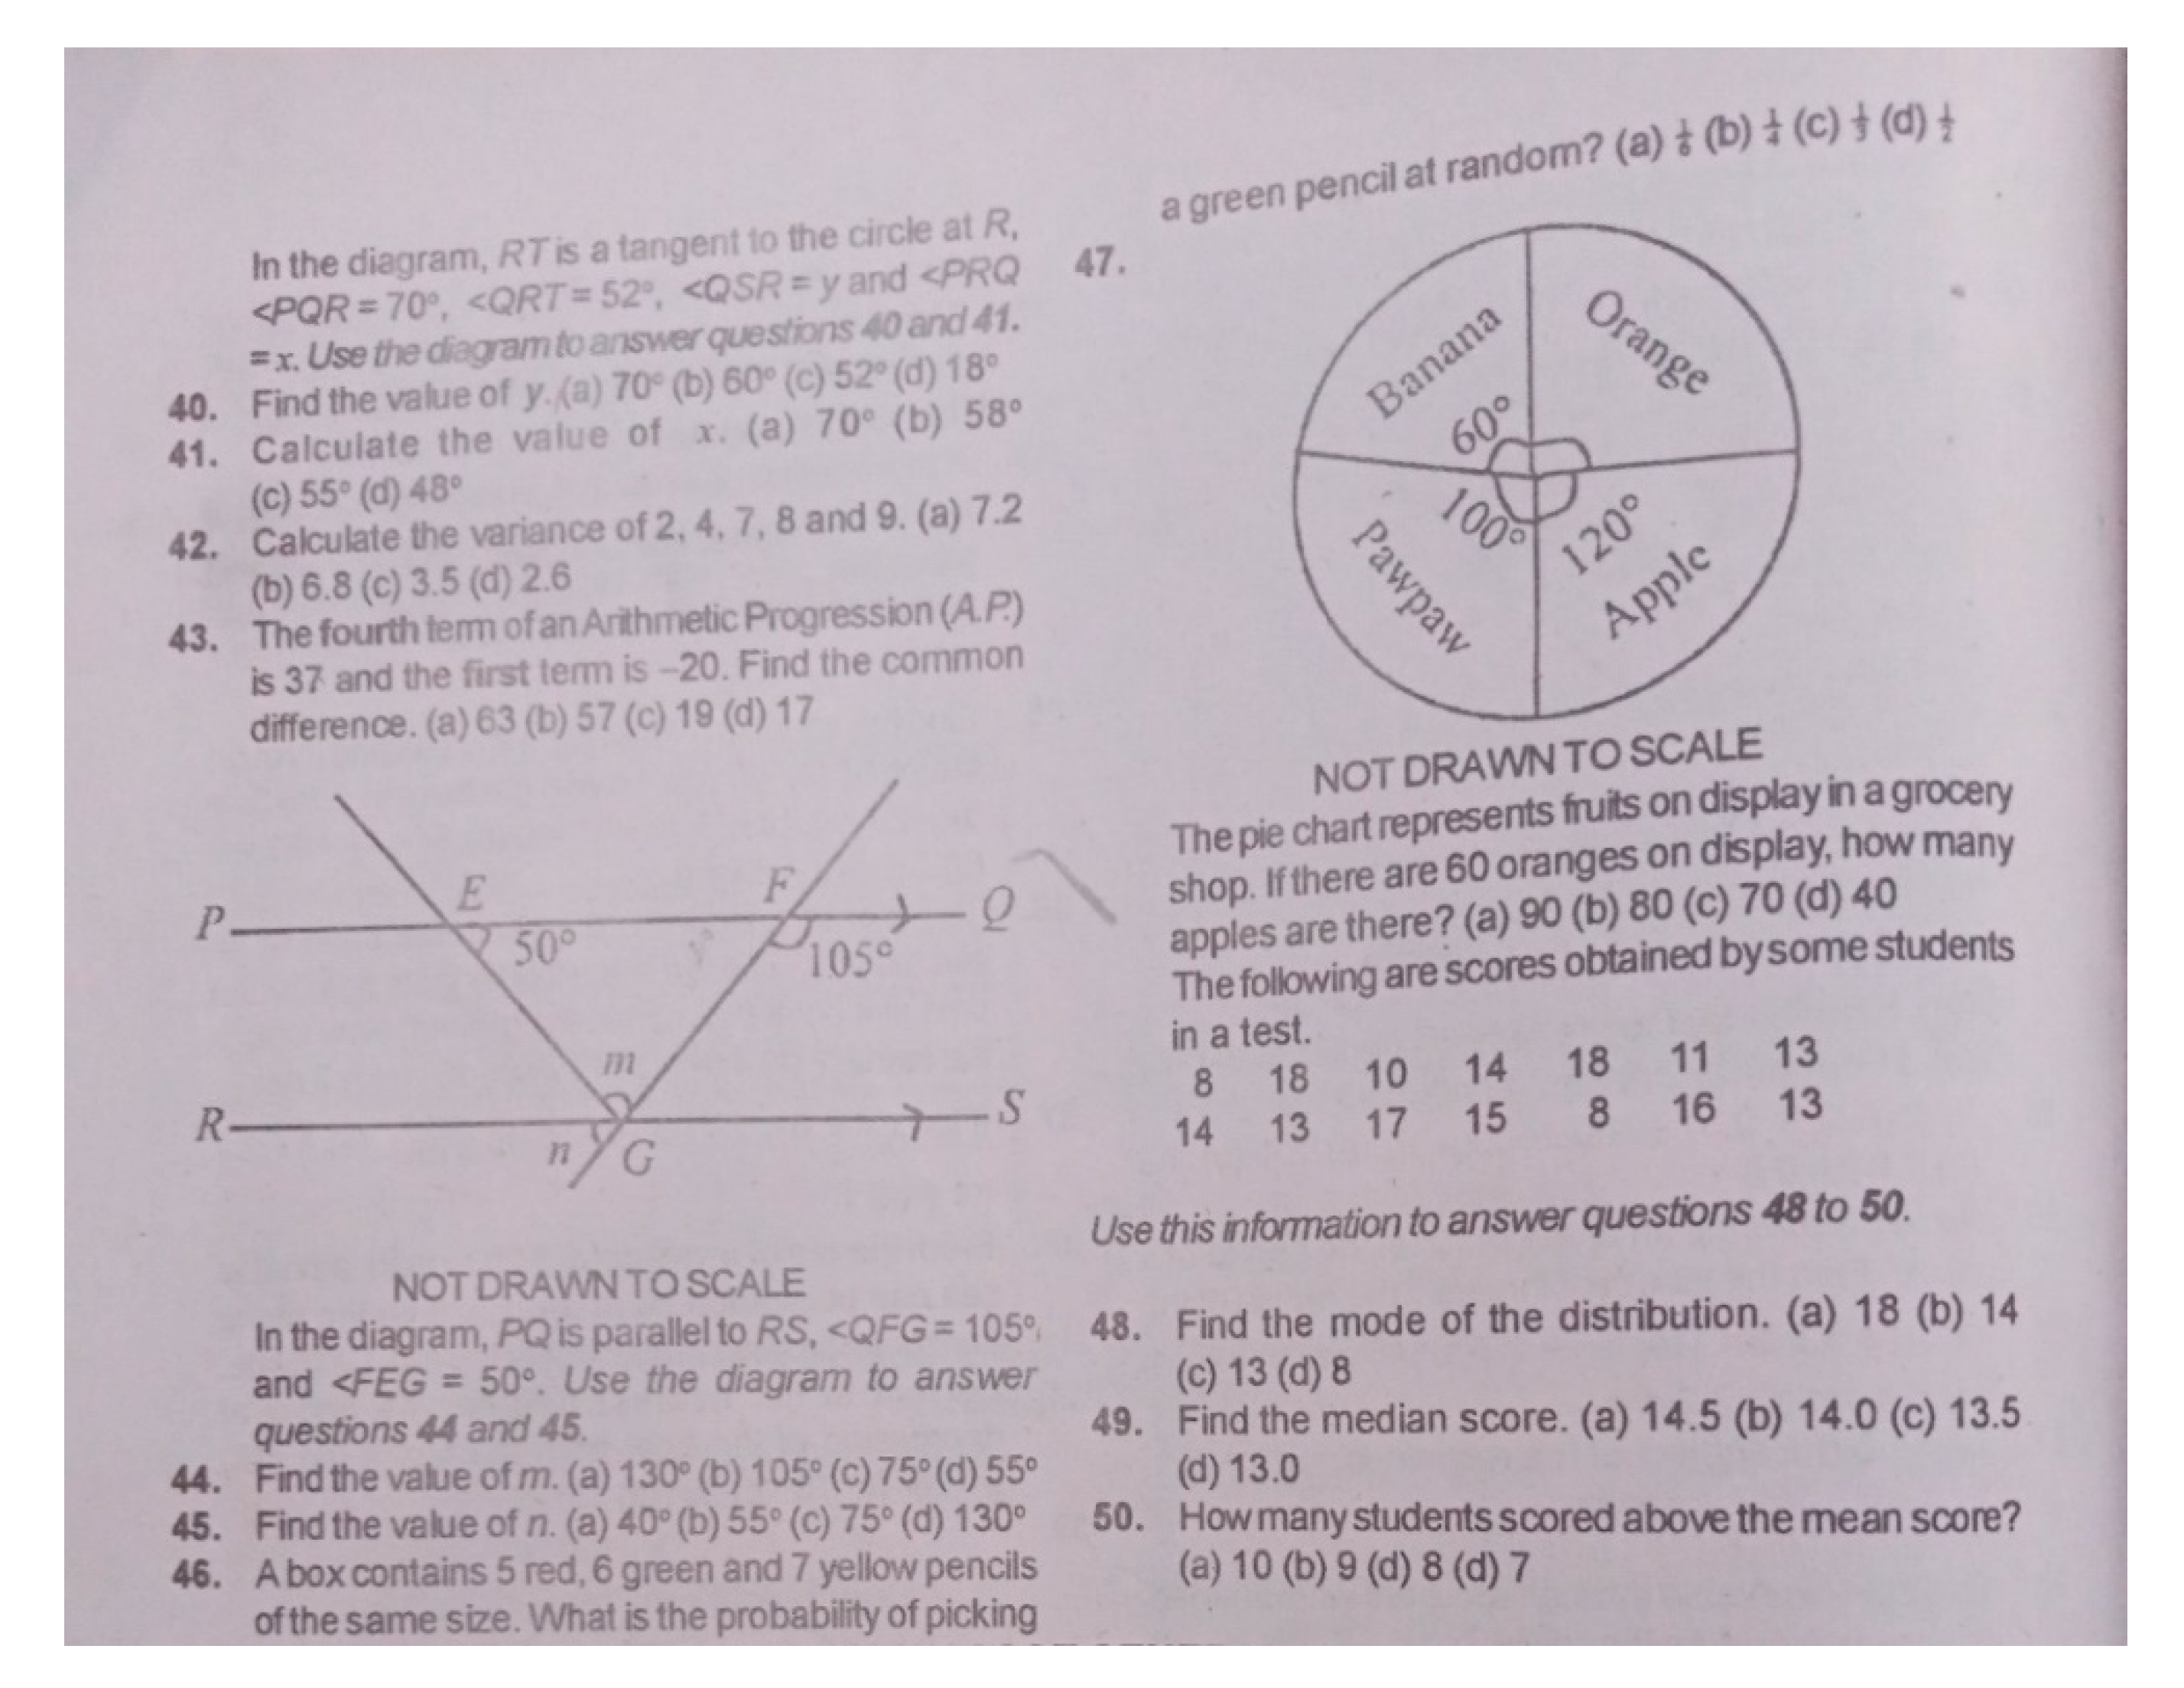
2019 West African Examinations Council Mathematics Multiple-Choice Test Items. The figure is continuous (Items 40–50).
Figure A3.
2019 West African Examinations Council Mathematics Multiple-Choice Test Items. The figure is continuous (Items 40–50).

From the analysis, six dimensions are evident for the WAEC multiple-choice mathematics test. These are number and numeration with (items 1, 5, 6, 7, 8, 9, 10, 12, 14, 15, 25, 27, and 43), algebraic process with (items 2, 3, 4, 11, 13, 16, 17, 18, 20, 21, 23, 28 and 32), mensuration with (items 22, 26, 29 and 35), statistics and probability with (items 19, 34, 42, 46, 47, 48, 49 and 50), geometry with (items 39, 40 and 41) and trigonometry with (items 24, 30, 31, 33, 36, 37, 38, 44 and 45), respectively.
References
- Algina, J.; Swaminathan, H. Psychometrics: Classical Test Theory. In International Encyclopedia of the Social & Behavioral Sciences, 2nd ed.; Elsevier: Gainesville, FL, USA, 2015; pp. 423–430. [Google Scholar] [CrossRef]
- Coulacoglou, C.; Saklofske, D.H. Classical Test Theory, Generalizability Theory, and Item Response Perspectives on Reliability. In Psychometrics and Psychological Assessment; Elsevier: North York, ON, Canada, 2017; pp. 27–44. [Google Scholar]
- Kane, M.; Bridgeman, B. Research on Validity Theory and Practice at ETS. Adv. Hum. Assess. 2017, 18, 489–552. [Google Scholar]
- Prieto, L.; Alonso, J.; Lamarca, R. Classical test theory versus Rasch analysis for quality of life questionnaire reduction. Health Quality Life Outcomes 2003, 1, 27. [Google Scholar] [CrossRef] [PubMed] [Green Version]
- Sijtsma, K.; Emons, W.H.M.; Bouwmeester, S.; Nyklíček, I.; Roorda, L.D. Non-parametric IRT analysis of Quality-of-Life Scales and its application to the World Health Organization Quality-of-Life Scale (WHOQOL-Bref). Qual. Life Res. 2008, 17, 275–290. [Google Scholar] [CrossRef] [PubMed] [Green Version]
- Mokken, R.J. A Theory and Procedure of Scale Analysis; De Gruyter Mouton: Berlin, Germany, 1971. [Google Scholar]
- Sijtsma, K.; Molenaar, I. Introduction to Nonparametric Item Response Theory; SAGE Publications: Thousand Oaks, CA, USA, 2011. [Google Scholar]
- Van der Ark, L.A. New developments in Mokken scale analysis in R. J. Stat. Softw. 2012, 48, 1–27. Available online: http://www.jstatsoft.org/ (accessed on 8 March 2021).
- Sijtsma, K.; van der Ark, L.A. A tutorial on how to do a Mokken scale analysis on your test and questionnaire data. Br. J. Math. Stat. Psychol. 2017, 70, 137–158. [Google Scholar] [CrossRef] [PubMed]
- Stochl, J.; Jones, P.B.; Croudace, T.J. Mokken scale analysis of mental health and well-being questionnaire item responses: A non-parametric IRT method in empirical research for applied health researchers. BMC Med. Res. Methodol. 2012, 12, 74. [Google Scholar] [CrossRef] [Green Version]
- Sijtsma, K.; Molenaar, I.W. Reliability of test scores in non-parametric item response theory. Psychometrika 1987, 52, 79–97. [Google Scholar] [CrossRef]
- Vaughan, B.; Grace, S. A Mokken scale analysis of the peer physical examination questionnaire. Chiropr. Man. Ther. 2018, 26, 6. [Google Scholar] [CrossRef]
- Rasch, G. Studies in Mathematical Psychology: I. Probabilistic Models for Some Intelligence and Attainment Tests; Nielsen & Lydiche: Washington, DC, USA, 1960; Volume 44. [Google Scholar]
- Barton, M.A.; Lord, F.M. An upper asymptote for the three-parameter logistic item-response model. ETS Res. Rep. Ser. 1981, 19, 388–402. [Google Scholar] [CrossRef]
- Birnbaum, A. Some latent trait models and their use in inferring an examinee’s ability. In Statistical Theories of Mental Test Scores; Lord, F.M., Novick, M.R., Eds.; Information Age Publishing: Charlotte, NC, USA, 1968; pp. 397–472. [Google Scholar]
- Sijtsma, K.; Hemker, B.T. Non-parametric polytomous IRT models for invariant item ordering, with results for parametric models. Psychometrika 1998, 63, 183–200. [Google Scholar] [CrossRef] [Green Version]
- R Development Core Team. R: A Language and Environment for Statistical Computing; R Core Team: Vienna, Austria, 2011. [Google Scholar]
- Ligtvoet, R.; van der Ark, L.A.; te Marvelde, J.M.; Sijtsma, K. Investigating an invariant item ordering for polytomous scored items. Educ. Psychol. Meas. 2010, 70, 578–595. [Google Scholar] [CrossRef] [Green Version]
- Mooij, T. A Mokken Scale to Assess Secondary Pupils’ Experience of Violence in Terms of Severity. J. Psychoeduc. Assess. 2012, 30, 496–508. [Google Scholar] [CrossRef] [Green Version]
- Emons, W.H.M.; Sijtsma, K.; Pedersen, S.S. Dimensionality of the Hospital Anxiety and Depression Scale (HADS) in Cardiac Patients: Comparison of Mokken Scale Analysis and Factor Analysis. Assessment 2012, 19, 337–353. [Google Scholar] [CrossRef]
- Van der Ark, L.A.; Sijtsma, K.; Meijer, R.R. Mokken scale analysis as time goes by: An update for scaling practitioners. Pers. Individ. Differ. 2011, 50, 31–37. [Google Scholar]
- Watson, R.; Deary, I.; Austin, E. Are personality trait items reliably more or less ‘difficult’? Mokken scaling of the NEO-FFI. Pers. Individ. Differ. 2007, 43, 1460–1469. [Google Scholar] [CrossRef]
- Hemker, B.T.; Sijtsma, K.; Molenaar, I.W. Selection of unidimensional scales from a multidimensional item bank in the polytomous Mokken’s IRT model. Appl. Psychol. Meas. 1995, 19, 337–352. [Google Scholar] [CrossRef] [Green Version]
- Mokken, R.J.; Lewis, C.; Sijtsma, K. Rejoinder to ‘The Mokken Scale: A Critical Discussion’. Appl. Psychol. Meas. 1986, 10, 279–285. [Google Scholar] [CrossRef]
- Van der Ark, L.A. R Package Mokken. 2017. Available online: https://cran.r-project.org/web/packages/mokken/assessed:11-08-2021 (accessed on 25 November 2021).
- Abdelhamid, G.S.M.; Gómez-Benito, J.; Abdeltawwab, A.T.M.; Bakr, M.H.S.A.; Kazem, A.M. A Demonstration of Mokken Scale Analysis Methods Applied to Cognitive Test Validation Using the Egyptian WAIS-IV. J. Psychoeduc. Assess. 2020, 38, 493–506. [Google Scholar] [CrossRef]
- Dirlik, E.M. Investigating Invariant Item Ordering Using Mokken Scale Analysis for Dichotomously Scored Items. Int. J. Progress. Educ. 2020, 16, 84–96. [Google Scholar] [CrossRef]
- Boomsma, A. Book review of Introduction to nonparametric item response modeling (authors K. Sijtsma & I.W. Molenaar). Psychometrika 2003, 68, 323–326. [Google Scholar]
- Ayanwale, M.A. Performance of Exploratory Structural Equation Modeling (ESEM) in Detecting Differential Item Functioning. J. Meas. Eval. Educ. Psychol. 2021. In press. [Google Scholar]
- Meijer, R.R.; Egberink, I.J.L. Investigating Invariant Item Ordering in Personality and Clinical Scales: Some Empirical Findings and a Discussion. Educ. Psychol. Meas. 2012, 72, 589–607. [Google Scholar] [CrossRef]
- Sijtsma, K.; Meijer, R.R. A Method for Investigating the Intersection of Item Response Functions in Mokken’s Nonparametric IRT Model. Appl. Psychol. Meas. 1992, 16, 149–157. [Google Scholar] [CrossRef] [Green Version]
- Wind, S.A. An Instructional Module on Mokken Scale Analysis. Educ. Meas. Issues Pract. 2017, 36, 50–66. [Google Scholar] [CrossRef]
- Van Der Ark, L.A.; Croon, M.A.; Sijtsma, K. Mokken scale analysis for dichotomous items using marginal models. Psychometrika 2008, 73, 183–208. [Google Scholar] [CrossRef] [Green Version]
- Straat, J.H.; van der Ark, L.A.; Sijtsma, K. Comparing optimization algorithms for item selection in Mokken scale analysis. J. Classif. 2013, 30, 75–99. [Google Scholar] [CrossRef]
- Meijer, R.R.; Egberink, I.J.L.; Emons, W.H.M.; Sijtsma, K. Detection and validation of unscalable item score patterns using item response theory: An illustration with harter’s self-perception profile for children. J. Pers. Assess. 2008, 90, 227–238. [Google Scholar] [CrossRef]
- Van Schuur, W.H. Ordinal Item Response Theory: Mokken Scale Analysis; SAGE Publications: Thousand Oaks, CA, USA, 2011. [Google Scholar]
Figure 1.
IRFs plots of Violated items.


Table 1.
Scalability and Standard Error for WAEC Mathematics Test Items.
| Items | Hj ≥ 0.30 | Standard Error | Items | Hj ≥ 0.30 | Standard Error |
|---|---|---|---|---|---|
| V1 | 0.37 | 0.02 | V26 | 0.34 | 0.02 |
| V2 | 0.45 | 0.02 | V27 | 0.45 | 0.02 |
| V3 | 0.48 | 0.02 | V28 | 0.18 | 0.05 |
| V4 | 0.24 | 0.03 | V29 | 0.61 | 0.04 |
| V5 | 0.76 | 0.02 | V30 | 0.55 | 0.04 |
| V6 | 0.33 | 0.02 | V31 | 0.34 | 0.04 |
| V7 | 0.30 | 0.02 | V32 | 0.46 | 0.04 |
| V8 | 0.67 | 0.02 | V33 | 0.42 | 0.04 |
| V9 | 0.36 | 0.02 | V34 | 0.38 | 0.04 |
| V10 | 0.21 | 0.03 | V35 | 0.15 | 0.03 |
| V11 | 0.46 | 0.04 | V36 | 0.44 | 0.04 |
| V12 | 0.39 | 0.04 | V37 | 0.13 | 0.03 |
| V13 | 0.62 | 0.04 | V38 | 0.45 | 0.02 |
| V14 | 0.24 | 0.05 | V39 | 0.18 | 0.03 |
| V15 | 0.38 | 0.04 | V40 | 0.33 | 0.04 |
| V16 | 0.17 | 0.05 | V41 | 0.42 | 0.04 |
| V17 | 0.35 | 0.02 | V42 | 0.17 | 0.03 |
| V18 | 0.57 | 0.02 | V43 | 0.30 | 0.04 |
| V19 | 0.14 | 0.05 | V44 | 0.31 | 0.04 |
| V20 | 0.41 | 0.02 | V45 | 0.25 | 0.02 |
| V21 | 0.34 | 0.02 | V46 | 0.34 | 0.04 |
| V22 | 0.49 | 0.02 | V47 | 0.29 | 0.05 |
| V23 | 0.24 | 0.05 | V48 | 0.37 | 0.04 |
| V24 | 0.56 | 0.02 | V49 | 0.23 | 0.03 |
| V25 | 0.26 | 0.02 | V50 | 0.58 | 0.04 |
Note: H = 0.46 (0.04).
Table 2.
Pattern of Mokken Scale using aisp function.
| Minvi Size | Minvi Size | ||||||||||||
|---|---|---|---|---|---|---|---|---|---|---|---|---|---|
| Items | 0.3 | 0.35 | 0.4 | 0.45 | 0.5 | 0.55 | Items | 0.3 | 0.35 | 0.4 | 0.45 | 0.5 | 0.55 |
| V1 | 1 | 1 | 1 | 1 | 1 | 1 | V26 | 1 | 1 | 1 | 2 | 2 | 2 |
| V2 | 1 | 1 | 1 | 2 | 0 | 1 | V27 | 1 | 1 | 1 | 2 | 3 | 2 |
| V3 | 1 | 1 | 2 | 1 | 1 | 1 | V28 | 2 | 2 | 2 | 2 | 2 | 2 |
| V4 | 3 | 3 | 3 | 4 | 3 | 3 | V29 | 1 | 1 | 1 | 2 | 2 | 5 |
| V5 | 1 | 1 | 1 | 2 | 3 | 3 | V30 | 1 | 1 | 1 | 2 | 0 | 5 |
| V6 | 1 | 1 | 0 | 0 | 2 | 2 | V31 | 1 | 1 | 0 | 3 | 2 | 4 |
| V7 | 1 | 2 | 1 | 1 | 2 | 2 | V32 | 1 | 1 | 1 | 3 | 3 | 3 |
| V8 | 1 | 1 | 3 | 1 | 4 | 1 | V33 | 1 | 1 | 1 | 3 | 3 | 3 |
| V9 | 2 | 1 | 1 | 2 | 1 | 1 | V34 | 1 | 1 | 1 | 3 | 3 | 3 |
| V10 | 5 | 5 | 5 | 5 | 5 | 5 | V35 | 2 | 6 | 4 | 6 | 6 | 6 |
| V11 | 1 | 1 | 1 | 2 | 2 | 2 | V36 | 1 | 1 | 4 | 1 | 2 | 6 |
| V12 | 1 | 1 | 1 | 2 | 2 | 2 | V37 | 5 | 3 | 5 | 4 | 5 | 6 |
| V13 | 1 | 1 | 1 | 1 | 2 | 2 | V38 | 1 | 1 | 1 | 1 | 1 | 1 |
| V14 | 3 | 3 | 3 | 3 | 3 | 3 | V39 | 3 | 6 | 5 | 6 | 4 | 4 |
| V15 | 1 | 1 | 0 | 2 | 1 | 5 | V40 | 1 | 1 | 5 | 6 | 6 | 6 |
| V16 | 3 | 3 | 4 | 6 | 6 | 6 | V41 | 1 | 1 | 6 | 6 | 6 | 6 |
| V17 | 1 | 1 | 1 | 3 | 3 | 3 | V42 | 6 | 6 | 6 | 6 | 6 | 6 |
| V18 | 1 | 1 | 1 | 3 | 3 | 3 | V43 | 1 | 1 | 6 | 6 | 6 | 6 |
| V19 | 3 | 4 | 4 | 4 | 3 | 3 | V44 | 1 | 3 | 3 | 6 | 6 | 6 |
| V20 | 1 | 1 | 0 | 3 | 2 | 2 | V45 | 4 | 6 | 6 | 6 | 6 | 6 |
| V21 | 1 | 1 | 1 | 1 | 1 | 1 | V46 | 1 | 1 | 5 | 6 | 6 | 6 |
| V22 | 1 | 1 | 1 | 1 | 1 | 1 | V47 | 5 | 6 | 6 | 6 | 6 | 6 |
| V23 | 5 | 5 | 5 | 5 | 5 | 5 | V48 | 4 | 3 | 6 | 6 | 6 | 6 |
| V24 | 1 | 1 | 1 | 1 | 1 | 4 | V49 | 3 | 4 | 6 | 6 | 6 | 6 |
| V25 | 4 | 4 | 4 | 4 | 4 | 4 | V50 | 2 | 3 | 6 | 6 | 6 | 6 |
Table 3.
Assessment of Invariant Item Ordering (IIO).
| Items | ItemH | #Ac | #Vi | #Zsig | Crit | Items | ItemH | #Ac | #Vi | #zsig | Crit |
|---|---|---|---|---|---|---|---|---|---|---|---|
| (Mean) | (#Active Comparison) | (#Violation) | (#Significant Violation) | (Mean) | (#Active Comparison) | (#Violation) | (#Significant Violation) | ||||
| V4 | 2.28 | 147 | 0 | 0 | 0 | V20 | 2.08 | 147 | 4 | 4 | 40 |
| V18 | 2.20 | 147 | 0 | 0 | 0 | V15 | 2.20 | 145 | 3 | 1 | 70 |
| V9 | 2.34 | 145 | 2 | 1 | 36 | V27 | 2.36 | 147 | 10 | 10 | 52 |
| V35 | 2.16 | 147 | 11 | 6 | 40 | V6 | 2.24 | 145 | 2 | 0 | 27 |
| V21 | 2.28 | 146 | 9 | 4 | 30 | V31 | 2.36 | 147 | 8 | 3 | 80 |
| V10 | 2.36 | 147 | 11 | 11 | 88 * | V32 | 2.35 | 147 | 11 | 5 | 50 |
| V45 | 2.31 | 145 | 5 | 5 | 82 * | V26 | 2.31 | 146 | 10 | 4 | 71 |
| V48 | 2.38 | 147 | 5 | 2 | 78 | V30 | 2.22 | 146 | 8 | 5 | 47 |
| V17 | 2.23 | 147 | 10 | 5 | 43 | V36 | 2.32 | 147 | 5 | 3 | 67 |
| V11 | 2.36 | 145 | 12 | 5 | 44 | V25 | 2.30 | 145 | 12 | 12 | 85 * |
| V47 | 2.33 | 147 | 7 | 7 | 93 * | V34 | 2.26 | 146 | 4 | 1 | 42 |
| V19 | 2.24 | 147 | 8 | 8 | 96 * | V5 | 2.11 | 147 | 7 | 2 | 45 |
| V7 | 2.26 | 145 | 12 | 3 | 41 | V8 | 2.10 | 146 | 2 | 2 | 39 |
| V14 | 2.13 | 147 | 3 | 3 | 96 * | V40 | 2.28 | 146 | 2 | 0 | 35 |
| V44 | 2.27 | 147 | 5 | 3 | 36 | V28 | 2.35 | 145 | 7 | 7 | 89 * |
| V2 | 2.15 | 146 | 8 | 4 | 61 | V37 | 2.30 | 146 | 10 | 10 | 96 * |
| V49 | 2.20 | 147 | 1 | 9 | 35 | V39 | 2.21 | 147 | 6 | 6 | 86 * |
| V22 | 2.30 | 146 | 0 | 0 | 0 | V43 | 2.14 | 145 | 9 | 2 | 53 |
| V46 | 2.30 | 147 | 4 | 1 | 74 | V13 | 2.10 | 147 | 3 | 1 | 25 |
| V16 | 2.20 | 147 | 5 | 5 | 82 * | V50 | 2.20 | 147 | 4 | 1 | 35 |
| V23 | 2.16 | 147 | 3 | 3 | 86 * | V29 | 2.08 | 147 | 2 | 1 | 29 |
| V3 | 2.17 | 145 | 8 | 3 | 53 | V33 | 2.31 | 146 | 7 | 3 | 79 |
| V38 | 2.35 | 147 | 3 | 1 | 41 | V12 | 2.29 | 147 | 4 | 1 | 56 |
| V42 | 2.26 | 145 | 12 | 12 | 88 * | V24 | 2.24 | 145 | 7 | 2 | 61 |
| V41 | 2.36 | 147 | 2 | 1 | 31 | V1 | 2.03 | 147 | 6 | 2 | 32 |
Note: the “*” indicate items with severe violation.
Table 4.
Backward Selection Removal of Items Violating IIO.
| Items | Step 1 | Step 2 | Step 3 | Step 4 | Step 5 | Step 6 | Step 7 | Step 8 |
|---|---|---|---|---|---|---|---|---|
| V4 | 0 | 0 | 0 | 0 | 0 | 0 | 0 | 0 |
| V18 | 0 | 0 | 0 | 0 | 0 | 0 | 0 | 0 |
| V9 | 1 | 0 | 0 | 0 | 0 | 0 | 0 | 0 |
| V35 | 6 | 5 | 4 | 3 | 2 | 1 | 0 | 0 |
| V21 | 4 | 3 | 2 | 1 | 0 | 0 | 0 | 0 |
| V10 | 10 | NA | NA | NA | NA | NA | NA | NA |
| V45 | 5 | 4 | 3 | NA | NA | NA | NA | NA |
| V48 | 2 | 1 | 0 | 0 | 0 | 0 | 0 | 0 |
| V17 | 5 | 4 | 3 | 2 | 1 | 0 | 0 | 0 |
| V11 | 4 | 3 | 2 | 1 | 0 | 0 | 0 | 0 |
| V47 | 6 | 5 | NA | NA | NA | NA | NA | NA |
| V19 | 8 | NA | NA | NA | NA | NA | NA | NA |
| V7 | 3 | 2 | 1 | 0 | 0 | 0 | 0 | 0 |
| V14 | 3 | NA | NA | NA | NA | NA | NA | NA |
| V44 | 3 | 2 | 1 | 0 | 0 | 0 | 0 | 0 |
| V2 | 4 | 3 | 3 | 0 | 0 | 0 | 0 | 0 |
| V49 | 7 | 6 | 5 | 4 | 3 | 2 | 1 | 0 |
| V22 | 0 | 0 | 0 | 0 | 0 | 0 | 0 | 0 |
| V46 | 1 | 0 | 0 | 0 | 0 | 0 | 0 | 0 |
| V16 | 5 | 4 | 3 | NA | NA | NA | NA | NA |
| V23 | 3 | NA | NA | NA | NA | NA | NA | NA |
| V3 | 3 | 2 | 1 | 0 | 0 | 0 | 0 | 0 |
| V38 | 1 | 0 | 0 | 0 | 0 | 0 | 0 | 0 |
| V42 | 7 | 6 | 5 | 4 | NA | NA | NA | NA |
| V41 | 1 | 0 | 0 | 0 | 0 | 0 | 0 | 0 |
| V20 | 4 | 3 | 2 | 1 | 0 | 0 | 0 | 0 |
| V15 | 1 | 0 | 0 | 0 | 0 | 0 | 0 | 0 |
| V27 | 7 | 6 | 5 | 4 | 3 | 2 | 1 | 0 |
| V6 | 0 | 0 | 0 | 0 | 0 | 0 | 0 | 0 |
| V31 | 3 | 2 | 1 | 0 | 0 | 0 | 0 | 0 |
| V32 | 5 | 4 | 3 | 2 | 1 | 0 | 0 | 0 |
| V26 | 4 | 3 | 2 | 1 | 0 | 0 | 0 | 0 |
| V30 | 5 | 4 | 3 | 2 | 1 | 0 | 0 | 0 |
| V36 | 2 | 1 | 0 | 0 | 0 | 0 | 0 | 0 |
| V25 | 10 | 9 | 8 | 7 | NA | NA | NA | NA |
| V34 | 1 | 0 | 0 | 0 | 0 | 0 | 0 | 0 |
| V5 | 2 | 1 | 0 | 0 | 0 | 0 | 0 | 0 |
| V8 | 2 | 1 | 0 | 0 | 0 | 0 | 0 | 0 |
| V40 | 0 | 0 | 0 | 0 | 0 | 0 | 0 | 0 |
| V28 | 7 | NA | NA | NA | NA | NA | NA | NA |
| V37 | 9 | 8 | 7 | 6 | 5 | NA | NA | NA |
| V39 | 6 | 5 | 4 | 3 | NA | NA | NA | NA |
| V43 | 2 | 1 | 0 | 0 | 0 | 0 | 0 | 0 |
| V13 | 1 | 0 | 0 | 0 | 0 | 0 | 0 | 0 |
| V50 | 1 | 0 | 0 | 0 | 0 | 0 | 0 | 0 |
| V29 | 1 | 0 | 0 | 0 | 0 | 0 | 0 | 0 |
| V33 | 3 | 2 | 1 | 0 | 0 | 0 | 0 | 0 |
| V12 | 1 | 0 | 0 | 0 | 0 | 0 | 0 | 0 |
| V24 | 2 | 1 | 0 | 0 | 0 | 0 | 0 | 0 |
| V1 | 2 | 1 | 0 | 0 | 0 | 0 | 0 | 0 |
Note: HT = 0.35.
Publisher’s Note: MDPI stays neutral with regard to jurisdictional claims in published maps and institutional affiliations. |
© 2021 by the authors. Licensee MDPI, Basel, Switzerland. This article is an open access article distributed under the terms and conditions of the Creative Commons Attribution (CC BY) license (https://creativecommons.org/licenses/by/4.0/).
Share and Cite
MDPI and ACS Style
Ayanwale, M.A.; Ndlovu, M. Ensuring Scalability of a Cognitive Multiple-Choice Test through the Mokken Package in R Programming Language. Educ. Sci. 2021, 11, 794. https://0-doi-org.brum.beds.ac.uk/10.3390/educsci11120794
AMA Style
Ayanwale MA, Ndlovu M. Ensuring Scalability of a Cognitive Multiple-Choice Test through the Mokken Package in R Programming Language. Education Sciences. 2021; 11(12):794. https://0-doi-org.brum.beds.ac.uk/10.3390/educsci11120794
Chicago/Turabian StyleAyanwale, Musa Adekunle, and Mdutshekelwa Ndlovu. 2021. "Ensuring Scalability of a Cognitive Multiple-Choice Test through the Mokken Package in R Programming Language" Education Sciences 11, no. 12: 794. https://0-doi-org.brum.beds.ac.uk/10.3390/educsci11120794
Note that from the first issue of 2016, this journal uses article numbers instead of page numbers. See further details here.