Visualizing the Greenhouse Effect: Restructuring Mental Models of Climate Change Through a Guided Online Simulation

Rossier School of Education, University of Southern California, Los Angeles, CA 90089-4036, USA
*
Author to whom correspondence should be addressed.
Educ. Sci. 2019, 9(1), 14; https://0-doi-org.brum.beds.ac.uk/10.3390/educsci9010014
Submission received: 10 December 2018
/
Revised: 2 January 2019
/
Accepted: 2 January 2019
/
Published: 13 January 2019
(This article belongs to the Special Issue Interactive Simulations and Innovative Pedagogy for Conceptual Understanding in Science Education)
Abstract
:The purpose of this design based research study was to better understand and build from students’ perceptual experiences of visual representations of the greenhouse effect. Twenty undergraduate students were interviewed as they engaged with an online visualization for the learning of the greenhouse effect. We found that, even though all students agreed that climate change is happening, a majority initially held a misconception about how it works. Upon engaging with the visualization, students made perceptual inferences and formulated causal rules that culminated in an improved description of how climate change works. This trajectory was supported with prompts from the interviewer to make predictions, observe specific interactions in the visualization and revise their causal inferences based on these observations. A case study is presented to illustrate a typical learning trajectory.
1. Introduction
1.1. Challenges of Learning Climate Change
Understanding controversial scientific issues like climate change poses unique challenges for students. Climate change is conceptually challenging for students in part because it involves chemical/physical mechanisms that cannot be seen with the naked eye, occurs over extended periods of time, [1] and requires “systems thinking,” the ability to consider the complicated nature of interacting systems. Reasoning abstractly about systems that emerge from complex interactions of individual elements is challenging for students [2] in part because students have relatively few experiences or mental representations that they can clearly associate with those complex interactions.
People generally have a limited understanding of the chemical and physical mechanisms responsible for climate change (mechanisms that are often called “the greenhouse effect”) [3] as evidenced by a number of commonly held misconceptions. First, people often conflate weather and climate—they call upon their day-to-day experiences of weather, perhaps remembering a day that was cold as counter evidence to the more long-term effects of climate change [4]. Second, people often incorrectly assume that visible phenomena, such as smog or pollution, are responsible for the climate change, when in fact, many of the central mechanisms involved in the greenhouse effect are not visible to the human eye (e.g., [5]). Third, people tend to conflate the greenhouse effect with stratospheric ozone depletion, believing that holes in the ozone layer are linked to climate change [5,6,7], a misconception that can persist even after direct instruction [8]. Fourth, people believe that climate change is a disputed topic, involving an ongoing debate between groups in the scientific community [9], when in fact, there is largely consensus on the matter [10]. In addition to these conceptual challenges and misconceptions, students’ prior knowledge and attitudes can potentially interfere with their learning of science topics [4,11]. Students are often committed to their perspectives on the issue of climate change and their attitudes and beliefs may motivate them to actively resist new ideas [12].
Considering these challenges, it is not surprising that many people in the United States have a hard time understanding and accepting climate change knowledge. Only 70% of Americans agree with the statement “global warming is happening,” and only 49% agree that “scientists believe global warming is happening” [9], when in fact, more than 97% of climate scientists agree that rising temperatures are caused by humans [10,13]. In response, policy makers have increased efforts to improve the situation by adopting standards to improve knowledge of global climate change (NGSS, 2013). High school students in 26 states are now required to gather evidence and make predictions about “the current rate of global or regional climate change and associated future impacts to Earth systems” [14]. There is also an effort to integrate climate change science in undergraduate curriculums [15]. Many popular undergraduate physics textbooks already include chapters on climate change (see, for example, [16,17]), while other textbooks use climate change science and action as a recurring theme throughout the text [18,19]. These efforts to include climate change in the curriculum will require practitioners and curriculum designers to be thoughtful about how they guide students through the difficult terrain.
The purpose of this study was to explore ways of supporting students’ understanding of climate change by attending specifically to the difficulty of visualizing the greenhouse effect. Therefore, we designed a novel approach to the instruction of climate change intended to provide students with imagery of how climate change occurs that might support mental representations to ground an understanding. To situate this approach, we first review current pedagogical approaches to the teaching of climate science and then introduce visualizations as a means of building mental models and instigating conceptual change.
1.2. Current Pedagogical Approaches to the Greenhouse Effect
There are currently several approaches to the instruction of the greenhouse effect. The canonical approach is to initially present students with a definition of the greenhouse effect. Many textbooks descriptions are similar to a dictionary definition of the greenhouse effect: “The atmosphere traps the sun’s energy because of greenhouse gasses, such as water vapor, carbon dioxide and methane, which trap energy especially well. Some scientists are concerned that high levels of greenhouse gases in the atmosphere may trap too much energy and make Earth too warm.” [20]. Upon giving a definition, textbooks will often provide examples that apply the definition, followed by exercises that involve further application [20,21]. An apparent limitation to this approach is that, by initially introducing the greenhouse effect using somewhat technical vocabulary, students may not have an opportunity to understand what the vocabulary refers to—they may never ground the meaning of the greenhouse effect in visual or mental representations.
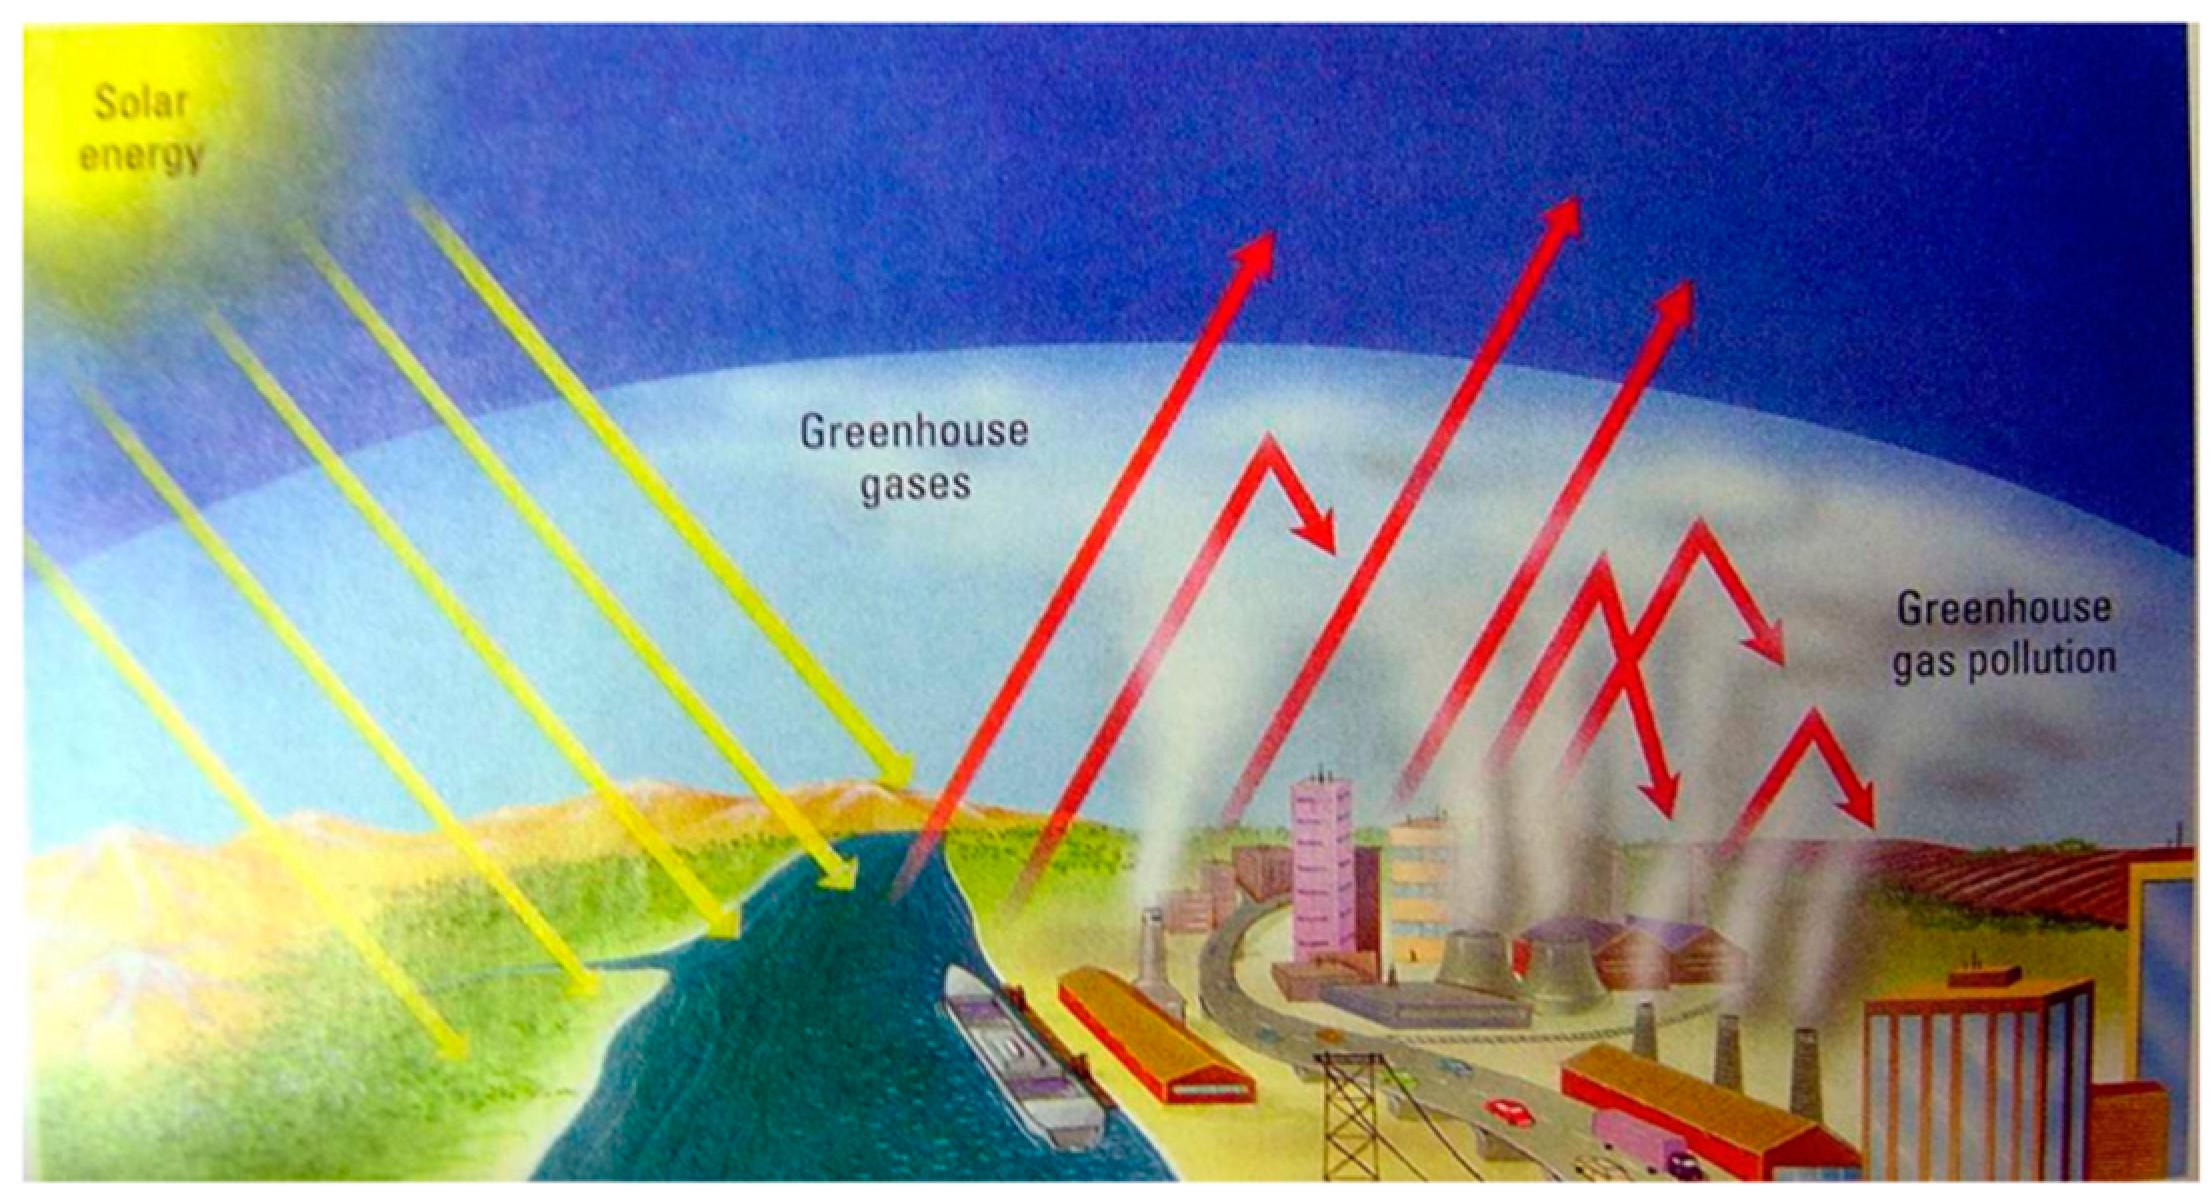
The use of “refutation texts”—texts that describe common misconceptions and then refute those misconceptions with evidence—has met with some success in supporting students to overcome misconceptions about various scientific topics that are noncontroversial [22] and controversial [23,24,25]. Refutation texts support undergraduate students in overcoming misconceptions about climate change [25] and are even more successful when paired with graphics and analogies that bridge prior knowledge with information presented in text [25,26]. However, text descriptions do not solve the challenge of visualizing the greenhouse effect. For example, static graphical representations, such as the image shown in Figure 1 from a textbook, do not confront (and may even perpetuate) a common misconception about the greenhouse effect, that a uniform layer of visible pollution causes infrared light to be trapped in the atmosphere.
Other approaches advocate “project-based” learning, offering students opportunities to make connections between the science of climate change and students’ environment and surroundings [28]. Some approaches involve “inquiry-based” laboratory assignments where students simulate the effects of greenhouse gasses using plastic wrap on food containers [29]. While these approaches have shown promise, many students learning within the traditional framework continue to struggle to understand the main mechanisms of climate change, which hinders their ability to deeply understand this important science topic [5,6,7].
Some research has implemented online visualizations to support learning of climate change science, Ranney and Clark (2016) [3] report seven studies that engage participants in a variety of learning experiences to build an understanding of climate change. Adults, undergraduates and high school students engaged with texts, videos and an interactive visualization (PhET) [30] that emphasized the physical and chemical mechanisms responsible for climate change. Exposure to information about these mechanistic aspects of climate change were shown to significantly improve participants’ knowledge and acceptance over time. Although these seven studies revealed significant gains in participant knowledge and acceptance, six out of seven of these interventions engaged participants in passively reading text or watching videos rather than interacting with a simulation or with an instructor. Our instructional approach is similar to this work in that we attempt to improve participants’ mechanistic knowledge of climate change but we are more interested in studying how people engage in interactive experiences. These interactions centralize the role of visualizations and focus on how individuals construct an understanding of climate change. Further, they afford insights into how to support learning.
Another innovative approach to climate change instruction uses a visualization called C-ROADS paired with role-play to engage students in applying climate change knowledge to make policy decisions [31]. Participants of all ages (11–75 years) took on roles of delegates in the UN climate negotiations and were posed with the challenge of coming to an agreement to meet international climate goals. Policy decisions were entered into C-ROADS, a simulation that provides time series predictions of emissions and temperature to highlight the long-term impact of such policy decisions. The authors found significant improvement in participants’ knowledge of the causes and impacts of climate change as well as affective engagement. However, while the simulation presented in this study was useful for modelling long term climate impacts of human decisions, the visualization does not support the learning of how climate change works on a chemical or physical level.
1.3. Our Approach: Visualizations to Support Mental Models
The challenges of conveying the greenhouse effect led us to draw upon research on mental models and visualizations (e.g., [32,33]). Mental model research is potentially fruitful in this circumstance because it emphasizes that visualizations can be used to cultivate systems of mental representations that can be internalized by the learner to improve their understanding of complex, microscopic, chemical and physical phenomenon in a variety of contexts [33]. In this sense we intend to support “mechanistic” models of climate change—mental models that involve chemical or physical interactions and causes. We also draw on the conceptual change theoretical framework that promotes the restructuring of individuals’ knowledge to overcome misconceptions, based on exposure to novel information that leads people to become dissatisfied with their prior conceptions and shift them to align understanding with normative-scientific ideas [34,35]. Further, we intended to formulate instructional strategies to best support learning from visualizations and so we used a design-based research methodology. With the intention of designing a set of instructional procedures to effectively present students with imagery for supporting mental models of climate change, we utilized a heuristic design framework outlined by Abrahamson (2009) [36]. The intention was to guide students to engage with an online visualization through a three-step hypothetical learning trajectory: (a) elicit students’ perceptual judgments of the visualization; (b) guide students to attend to structural, perceptual and quantitative aspects of the visualization that they had not noticed before (i.e., that representations of CO2 particles trap representations of infrared light); and (c) support students as they experience conceptual change, moving towards normative-scientific perspectives from their initial intuitive judgments.
Although this particular study focuses on the scientific concept of the greenhouse effect, the study may bear broader implications for research on science instruction, pedagogy and instructional design surrounding online visualizations. Particularly, this research has relevant implications for science practitioners concerned with improving their instruction of difficult-to-visualize topics and also has implications for conceptual change researchers that are interested in the teaching and learning about controversial topics in science. We next briefly review the two theoretical frameworks that guided the instructional design and the research design: mental models and conceptual change.
1.4. Theoretical Framework
To address the conceptual difficulty of understanding the greenhouse effect, this study leverages students’ perceptual resources to build and revise mental models though the use of a visualization. Students interacted with a virtual simulation that made visible the invisible mechanisms of the greenhouse effect and provided students an opportunity to observe a scientific model from which to build understanding of the greenhouse effect. Anchoring students’ understanding of the greenhouse effect in a visual experience provided them with imagery to draw from while making causal inferences and an opportunity to construct and revise their personal understandings and representations. For this reason, we summarize literature on mental models, visualizations and their role in fostering and inhibiting conceptual change.
1.4.1. Mental Models and Visualizations
Students are able to ground abstract scientific ideas in visualizations and models [32,37]. For instance, when considering a chemical reaction, one may generate a mental image of spherical atoms “coming together” to form a new shape, a shape that may then be subject to mental analysis. Mental imagery can then be manipulated in the mind, leading to scientific inferences and associations that may not have initially occurred to the learner [38]. For this reason, scientists rely on diagrams, graphs, videos, images and other visual representations to guide their thinking, test ideas and to communicate findings [37]. In this way, interactive animated graphics can provide students with imagery that bridges their informal knowledge with formal, normative-scientific representations of the greenhouse effect by making invisible aspects of the greenhouse effect visible and by supporting the development of students’ own internal representations.
Internalized representations of concepts and ideas are called mental models. Mental models can be elaborated as “abstract representations that store the spatial, physical and conceptual features of experiences, useful for retrieval in the service of problem solving, inference generation and decision making” [32] (p. 45). For example, people hold internal physical representations of different environments that they draw upon to make predictions or explain phenomena [39]. These internal representations are built from perceptual experiences and inferences and are expressed in terms of the predictions and explanations that they give for these external physical phenomena [33]. Explanations that students give based on their sensory experiences are important to consider when examining their learning from visualizations. We refer to these kinds of explanations as perceptual judgments or perceptual inferences.
Mental models are not exact reproductions of external information but are instead incomplete, simplified models of phenomena that are applied to problems in context. Mental models should thus be distinguished from normative scientific models or conceptual models, which are external representations that are agreed upon by the scientific community and represent scientifically accepted knowledge [33]. Learning might then be thought of as shifts in people’s mental models as to be more aligned with the scientific model.
1.4.2. Limitations of Mental Models
However, pre-existing mental models are not always productive for learning normative-scientific representations [33,40,41,42]. Relying on internal understandings and representations can be a double-edged sword. On the one hand, prior internal representations can align with formal science, a compatibility that can immediately support student learning. On the other hand, student perspectives may be incompatible with formal views and students’ reliance on sensory information can prevent learning [43]. In this sense, Fischbein (1971) [42] argues that students must learn to regulate their primary intuitions in order to develop a disciplined, secondary intuition that is necessary for scientific learning. Confronting mental models that support misconceptions, however, is not always easy for learners to accomplish. Research on conceptual change may help to explain why individuals find it difficult to change their minds about controversial issues like climate change.
1.5. Misconceptions and Conceptual Change
Conceptual change researchers explore factors involved in resolving misconceptions through cognitive conflicts between prior knowledge and new information [34,35]. Conceptual change research has shown that students’ prior knowledge and experiences are often in conflict with normative-scientific perspectives [34,35]. Traditional conceptual change frameworks presume that many students initially hold scientifically inaccurate or insufficient knowledge and that by revising or fitting new information into their existing mental models, learners will come to integrate the accepted scientific view [35,44].
Dole and Sinatra (1998) [34] identified a number of preconditions necessary for conceptual change to occur. These include learners’ dissatisfaction with their existing conception (which depend on the strength, coherence and commitment of the students’ existing conception) as well as the comprehensibility, coherence and plausibility of the “message” that the students are learning. Students are constantly revising their mental models in order to account for new information and experiences. Thus, engaging students in an interactive visualization that presents coherent and comprehensible scientific models may influence them to reconsider the plausibility of their previous conceptions and representations and shift their model accordingly.
Yet, there is no guarantee that students will explicitly attend to aspects of a visualization that are important for overcoming their misconceptions and revising their mental model. People must modify the way that they perceive a situation by constructing and articulating mental models that can be assessed as either correct or incorrect. For this reason, it is important for an instructor to periodically elicit students’ predictions and explanations for what they observe in a visualization and these perceptual inferences can be used to identify students’ mental models so they might be corrected by an instructor [33].
1.6. Summary
Research on mental models has found that students make sense of abstract ideas by constructing mental representations from sensory experiences. By mitigating some perceptual inferences and enabling others, students can be guided to attend to aspects of visualizations that lead them to restructure their knowledge and adjust their mental models to align with normative-scientific views. However, despite research suggesting the potential for visualizations to support development of mental models and deep comprehension of science topics such as the greenhouse effect, there is little if any research that looks closely at how these mental models are developed or how instructors might help to facilitate conceptual change.
1.7. Research Questions
The purpose of this study is to understand whether students’ visual, grounded experiences of a visualization can be used to leverage conceptual change, build mental models of the greenhouse effect and to explore ways in which instructors can support this process. To accomplish this, we (a) designed and revised a pedagogical approach using a visualization to promote scientific understanding of the greenhouse effect; and (b) explored carefully how students restructured knowledge and developed mental models based on their interactions with a visualization. Thus, our research questions were:
- Would participants’ models of the greenhouse effect change as a result of engaging with an interactive visualization?
- If so, how does this conceptual change process occur? What role did participants’ perceptual inferences of a visualization play in their conceptual change process?
2. Materials and Methods
2.1. Design Based Research
We used a design based research (DBR) approach to the development of the instruction and research. The ultimate goal of DBR is to produce relevant theory and instructional designs that can be shared and developed with practitioners [45]. The design process happens through iterative implementation and revision cycles of an instructional design, resulting in an intervention that is shaped by and builds upon theoretical claims about teaching and learning [45]. Just as the handle of a teacup takes its shape based on the mechanics of our hand, instructional interventions are designed to fit the way that students learn. In this sense, the intervention for introducing the concept of the greenhouse effect embodied theoretical claims about the instruction and learning of the greenhouse effect.
As is characteristic of DBR, we iteratively implemented and revised a set of instructional materials that resulted in an intervention that can be used to introduce the concept of the greenhouse effect in science classrooms. As explained in the introduction and operationalized below, the design and protocol aims to elicit students’ perceptual predictions and explanations of a visualization and support students in forging meaningful connections between these inferences and the scientific content embedded in the design. Accordingly, we describe learning in terms of revisions that students made to their initial mental model of how climate change works, as evidenced by shifts in their explanations and predictions of an interactive visualization.
2.2. Participants
The project was conducted at a selective research university in California. Undergraduates (N = 20) that participated in the study were recruited from the university’s psychology department as part of a required research participation pool (60% reported as Female, 40% Male, 45% White, 20% Asian, 20% Latino/a, 5% Middle Eastern or Arab American, 10% mixed ethnicity, 35% Moderately Liberal, 10% Slightly Liberal, 15% Slightly Conservative, 20% Don’t Know/Not Political, 5% Moderate/Middle of the Road, 5% Very Liberal, Mean age = 20.1 yrs). All participants reported that they believed that climate change is happening. To participate, participants had to be enrolled in a course in the psychology department, registered to receive credit through the online registration system and complete a demographics survey. This study was certified by a Research Ethics Committee (UP-17-00218).
2.3. The Intervention
2.3.1. The Simulation
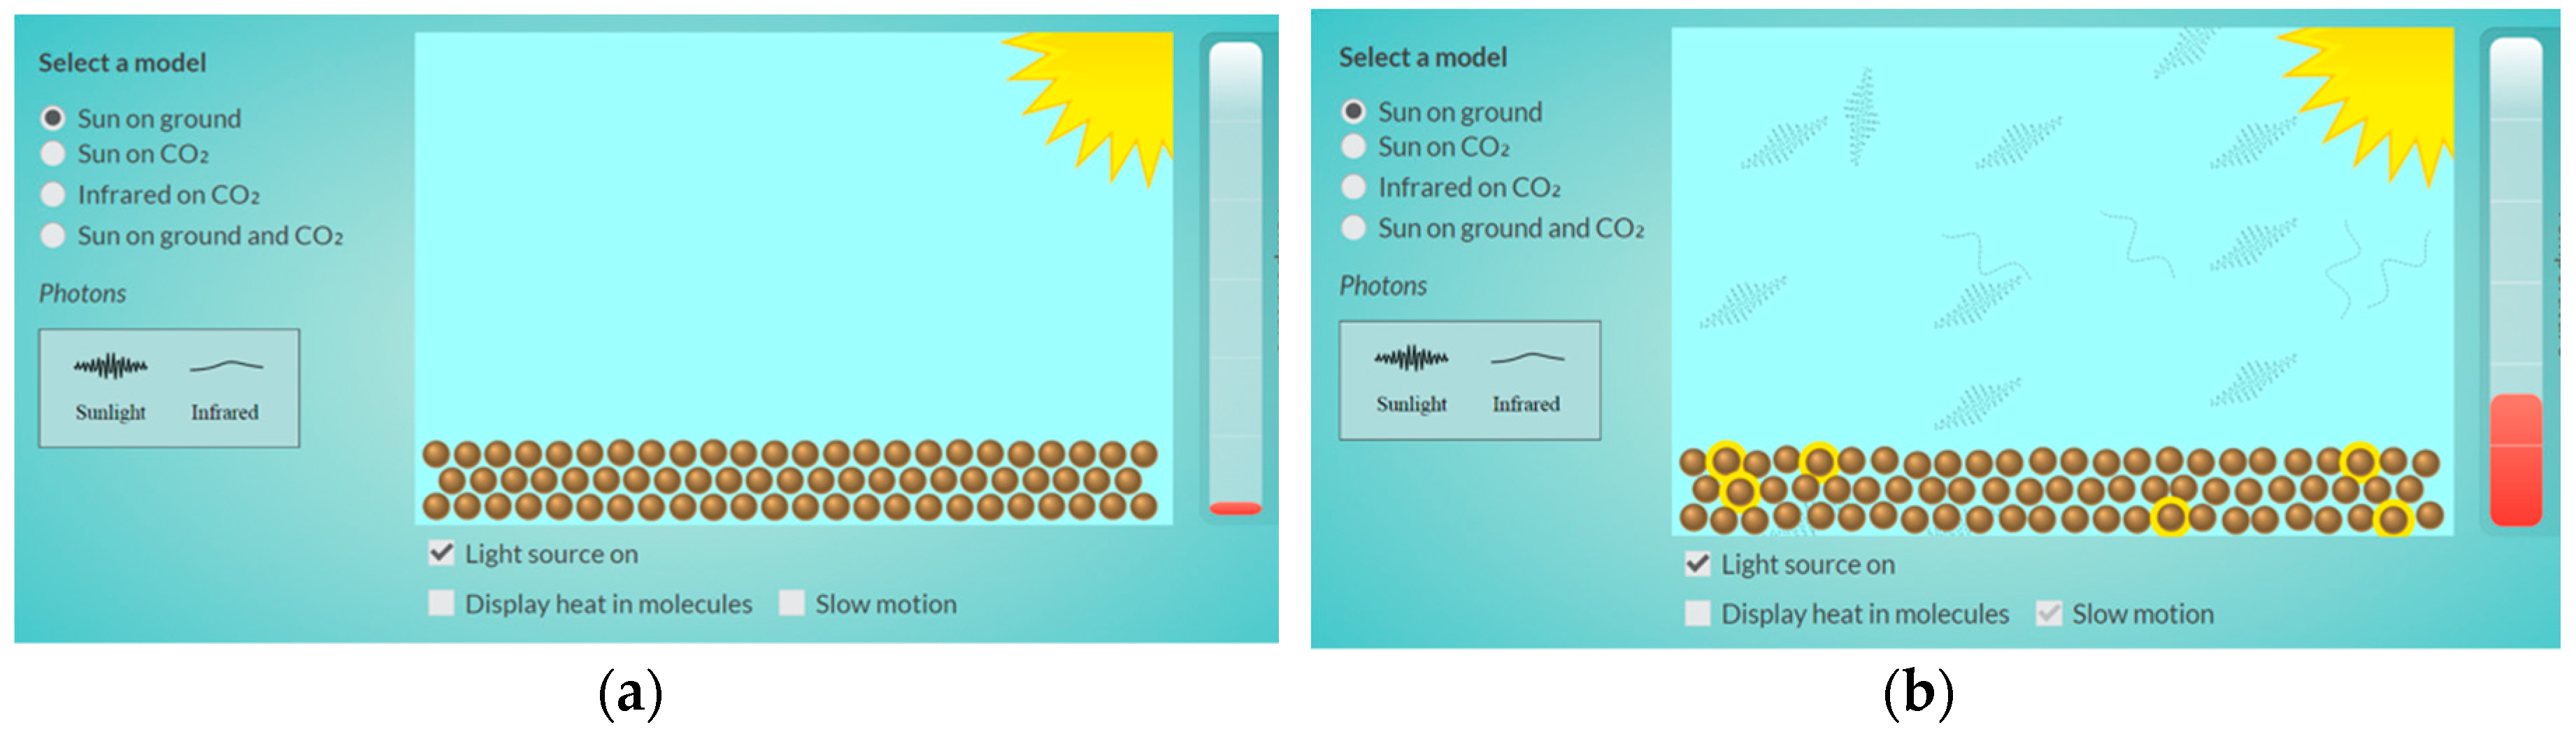
Central to this study was an interactive computer simulation that allowed people to visualize the greenhouse effect. The simulation was created by Concord Consortium (http://lab.concord.org/embeddable.html#interactives/sam/light-matter/sun-on-ground.json) [46] and showcases interactions between sunlight, the ground, atmospheric CO2 and the effect of infrared light reabsorption on global temperature. The simulation features four selectable screens that progress in complexity: “Sun on ground,” “Sun on CO2,” “Infrared on CO2,” and the combined effect, “Sun on ground and CO2.” Each of the four screens prominently features a temperature meter on the right side of the screen, along with a key to associate vocabulary with images and a play button that begins an interactive animation (see Figure 2 for an example).
2.3.2. Instructional Video
Upon completing the simulation, participants were shown a three-minute instructional video called How Global Warming Works (http://www.howglobalwarmingworks.org/in-under-3-minutes-ba.html) [47]. The video summarizes the physical and chemical mechanisms of climate change and provides participants with a clear explanation of how humans contribute to climate change. The video was intended to complement the online simulation by reiterating the causes and impacts of climate change in terms of human impacts. The video afforded participants an opportunity to revisit topics explored in the simulation.
2.3.3. Interview Protocol and Rationale
The interview protocol (see Supplementary Materials S1) was intended to guide learners through the simulation and video using a three step hypothetical learning trajectory mentioned in the introduction: (a) elicit participants’ perceptual inferences about the simulation, (b) guide participants to attend to the essential aspects of the simulation that they did not see before and (c) support participants as they experience conceptual change and reformulate the causal mechanisms of the greenhouse effect in terms of their perceptual inferences.
The interview protocol was intended to align with this rationale. After implementing and revising the materials through four pilot interviews, we arrived at an interview protocol that was implemented across all participants. Participants were first asked whether they believe that climate change is real and if so, asked to explain “how climate change works.” Learners were then introduced to the simulation and guided through each of the four screens in sequence. The first author served as the interviewer and initially asked to provide explanations with questions such as “What do you see?” “What do you think this is?” and make predictions with questions such as “What do you think will happen when we click play?” As participants progressed through the four screens, common vocabulary was established for the representations that they saw in the simulation (e.g., the ground, sunlight, infrared light, etc.). Participants were then guided to attend to particular aspects of the simulation and asked questions like, “What happens when sunlight hits the ground?” “Did you notice the infrared light?” and “How does sunlight interact with CO2?” In this way, the interview protocol aimed to guide learners to attend to CO2 and its absorption and emission of the infrared light and the overall impact on temperature. Finally, at the end of the interview, participants were prompted to explain why temperature is greater when CO2 is present. During this portion of the interview the interviewer asked probing questions like “how do you know?” to observe whether participants incorporated their initial perceptual inferences in their final descriptions of the greenhouse effect. Additionally, sections were built into the protocol to mitigate the validity threat of reactivity—the influence of the researcher on that being studied [45]. To prevent reactivity, an introductory portion of the interview protocol was intended to build rapport with participants, ensure participant anonymity and remind participants that the credit that they earn is not affected by their responses [48].
2.3.4. Data Collection
To investigate how participants visualize the greenhouse effect, the first author conducted semi-structured interviews. Concepts such as “perceptual inferences” are difficult to measure directly and the potential range of outcomes of participants’ perceptions are numerous. Interviews were thus chosen for this part of the study because they are suitable for understanding participants’ described experiences, understandings and meanings in their lived world in rich detail [49]. Thus, interviews are the primary form of data that we collected for this study.
Participants engaged in semi-structured interviews that lasted an average of 30 min and 46 s in duration. As is characteristic of semi-structured interviews, we created a structured interview protocol (see Supplementary Materials S1) but allowed for deviation and flexibility within that protocol [46]. The first author conducted and audiotaped each interview in order to record exactly what was said by the participants and the interviewer. Audio was then transcribed by a private vendor for further analysis. Additionally, the interviewer wrote memos after each day of interviews to reflect on the instructional design and ponder potential revisions that might be made to improve the design and protocol [50,51].
All 20 interviews were carried out over a one-week period between April 14 and 21, 2017. To give more context, the month before interviews began, many policies concerning climate change were being reformed in the United States. For example, President Trump had signed an executive order aimed towards boosting the coal industry and had nominated Scott Pruitt as the head of the Environmental Protection Agency (EPA) and Rex W. Tillerson (EXXON CEO) as Secretary of State. Two months after interviews concluded, the United States withdrew from the Paris Agreement to curb global carbon emissions.
2.3.5. Analysis
Audio recordings were transcribed and uploaded to NVivo, coded for varying dimensions of participant thinking [52,53] and used to measure the extent of participant learning. The first author began by reading through the transcripts, conducted open coding, established a number of preliminary categories and codes, then conducted axial coding by consolidating and elaborating on codes (e.g., [54]). The first author also wrote analytical memos to document and reflect on the coding process and facilitate axial coding [53].
Through iterative coding and reflection [55], a number of themes emerged highlighting dimensions of participant conceptions about climate change and how these conceptions changed as a result of the intervention. After initial codes were established, a second rater independently scored all 20 interviews, yielding an inter-rater reliability of kappa = 0.66. The first author also constructed an embedded case study [56,57] to provide insight into participant learning on two levels: first, to find overarching changes in participants’ articulated models of the greenhouse effect as a result of the intervention and second to illuminate more fine-grained mechanisms responsible for participant learning.
3. Results
Participants were given the initial opportunity to develop perceptual inferences related to the greenhouse effect by describing simulated situations. Each participant began by noting various elements of the simulation (e.g., the sun, ground, labels, interactive elements) and realized quickly that the simulation was intended to model the Earth’s atmosphere. After the “play” button was clicked, participants made perceptual inferences, were guided to attend to various aspects of the simulation, formulated causal rules and rearticulated their understanding of the greenhouse effect in terms of those rules and perceptions. In what follows, we compare participants’ articulated models of the greenhouse effect before and after the intervention and then present a case study that illustrates reasoning processes that facilitated these changes. While the pedagogical effectiveness of this approach cannot be determined through this study, we find reason for cautious optimism.
3.1. Pre-Post Comparisons
To answer the first research question—Would participants’ models of the greenhouse effect change as a result of engaging with an interactive visualization?—we compared frequencies of codes related to participants’ explanations and predictions for how climate change works (i.e., the greenhouse effect) before and after the intervention (see Table 1), we also present qualitative evidence to show that conceptual change occurred.
More than half (11 of 20) of the participants initially exhibited a misconception about the greenhouse effect. Of them, nine conflated ozone depletion with the greenhouse effect and six mentioned visible “pollution” or “smog” as the main contributor to climate change (four of these participants incorporated both ozone and pollution into a description of their model). These are well documented climate change misconceptions [58]. There was no evidence that participants in our sample believed the “solar radiation hypothesis,” or the “natural variation hypothesis,” also common misconceptions documented in the literature [7]. After the interview, only 2 participants exhibited a misconception of the 11 that initially held a misconception (both confused ozone depletion with the greenhouse effect) suggesting the intervention was successful in reducing misconceptions. A test for equality in proportions revealed significant differences in mention of ozone depletion (χ2 (1, N = 20) = 6, p = 0.014) and visible smog or pollution (χ2 (1, N = 20) = 6.9, p = 0.009) between statements made before and after the intervention.
We also found general improvement in the mention of normative mechanisms involved in the greenhouse effect and a reduction in misconceptions. Participants initially referenced normative mechanisms in their description of how climate change works. They mentioned CO2 (10 of 20), other greenhouse gasses (8 of 20), increases in temperature (14 of 20), human involvement (10 of 20) and suggested that heat is somehow “trapped” our atmosphere (10 of 20). No participants mentioned processes of sunlight absorption/emission or infrared radiation in their initial model.
After engaging with the simulation, participants tended to use more normative language when re-describing how climate change works. At the end of the interview, they mentioned CO2 (15 of 20), other greenhouse gasses (14 of 20), increases in temperature (16 of 20), human contributions to climate change (5 of 20), “trapping” of heat (16 of 20), infrared radiation (20 of 20) and processes of sunlight transforming to infrared (17 of 20). A test for equality in proportions found significant differences in mention of greenhouse gasses other than CO2 (χ2 (1, N = 20) = 4.8, p = 0.027), the trapping of heat in the atmosphere (χ2 (1, N = 20) = 3.9, p = 0.05), infrared radiation (χ2 (1, N = 20) = 39, p < 0.001) and sunlight transformed into infrared (χ2 (1, N = 20) = 29, p < 0.001) between statements made before and after the intervention. Notably, all participants mentioned infrared radiation after the intervention compared to two participants before. However, also notable is the decrease in participants’ mentions of human involvement in their description of how climate change works.
Qualitative evidence from interviews also support our claim that conceptual change occurred. When students were asked to reflect on whether anything from the interview “changed their mind,” one student who initially held a misconception about visible pollution said that she “changed [her] mind about how the process of global warming… how the Earth absorbs visible light and gives off infrared and how CO2 keeps increasing and it’s affecting the temperature and things like that.” Statements of this sort suggest that students changed their misconceptions about the greenhouse effect and were also aware of this change.
However, not all students reported changing misconceptions about climate change given that nine students initially held no misconceptions. For many of these students, changes in students’ conceptions of the greenhouse effect were evidenced by greater facility with scientifically normative language. For example, when a student who did not initially hold a misconception was asked to report whether anything from the interview changed her mind, she said “I was like 85% right” about how the greenhouse effect works. When probed further she said, “I guess like, because I always see the diagram of the sunlight coming off and bouncing back, [but my instructors] never explained that the Earth is the one that produces the infrared rays. That was new. I didn’t know that greenhouse gases absorb them, I just thought they reacted, I didn’t really know which way.” Another student said “I mean, I already knew that global warming exists. I guess some of the basic concepts of global warming were refreshed... Now I have more information. And if someone would ask me how to explain it, I’m sure I would be able to explain it in much more detail than I would have been before.” These excerpts further support what we found in the quantitative evidence: students generally used more scientifically correct vocabulary and alluded to scientific processes when articulating the greenhouse effect, even for those who did not initially hold a misconception.
3.2. Case Study
To answer the second research question—What role did participants’ perceptual inferences of a visualization play in their conceptual change process?—we traced the development of one of the 20 participant’s evolving conception of the greenhouse effect as he engaged with the simulation. Daniel (a pseudonym), was chosen to highlight dimensions of participant thinking that are characteristic of many of the participants interviewed. Namely, we highlight instances where Daniel exhibited a misconception, made perceptual inferences, was guided to attend to details that he did not attend to previously (i.e., temperature, CO2 and infrared radiation), formulated rules and fit these rules together when finally articulating his model of the greenhouse effect. We conclude with an evaluation of the design framework in light of its pedagogical affordances and constraints for science teachers.
3.2.1. Daniel’s Persistent Misconception
Daniel was a 23-year-old junior that identified as Latino. He believed that climate change is real and expressed a sense of urgency to take action, yet was not confident in his understanding of how it works. Despite his good intentions and concern for the wellbeing of the planet, stating that “...our country should be doing a better job of sustaining the environment to stop global warming and to prevent climate change,” he held a common misconception. When prompted to explain how climate change works, Daniel made the following statement:
- Daniel:
- I don’t know a whole lot about it. I just know that pollutants in the air kind of erupt, I don’t think it’s the right word but break down the ozone layer that covers our atmosphere and protects us from the harmful rays of the sun being too much. The more that that breaks down, the sun’s able to just, the planet is overheating from the energy from the sun that is able to pass through the atmosphere more clearly without having that protective layer that sustains life on the earth. The more that that breaks down and our planet overheats, eventually over time it could be not sustainable to life.
Like a majority of participants in the sample, Daniel held a misconception regarding the primary mechanisms of climate change (i.e., the greenhouse effect). Namely, he exhibited two widely held misconceptions that global temperature gains are due to (a) general pollution (not primarily CO2) and (b) the depletion of ozone which allows UV light to enter the atmosphere and warm the planet [5,6,7]. Yet, unlike some participants who demonstrated only a surface-level misconception (e.g., using the word ozone instead of the word CO2, saying “ozone traps heat”), Daniel held a deeper misconception, evidenced by his fairly coherent description of atmospheric temperature changes via UV light entering the atmosphere through ozone holes. Daniel’s prior conception shaped how he initially viewed the simulation.
When initially shown the simulation in static state, the interviewer asked Daniel, “What do you see here?” Daniel replied, “The sun. And these look like particles [referring to particles on the ground]. I don’t know what they’re supposed to simulate.” Upon clicking the play button and asked to describe what he saw, he replied with a description that utilized his initial ozone misconception.
- Interviewer:
- Okay, what do you see?
- Daniel:
- UV rays from the sun are coming down hitting the ground, exciting the ground and making it warmer…The more that keeps happening, the more kinetic energy, the more excited the particles are and then the hotter the ground gets and the temperature rises.
Daniel described what he saw on the screen and formulated the intuitive rule: “more motion, more temperature” [49]. Despite this normative inference, his use of the term “UV” also suggests that his initial conception involving ozone and ultraviolet light shaped how he viewed and named the objects in the simulation. In this situation, the interviewer made notice of this confusion and guided him to attend to a legend on the screen with labels for the various representations that appear on the screen. Daniel then initiated a brief conversation with the interviewer about the differences between UV and sunlight, then continued to summarize what he saw on the screen without mention of UV.
- Daniel:
- Sunlight is traveling in waves to the ground, exciting the particles on the ground, which is causing them to have an increase in kinetic energy and give off heat as a result, so the temperature of the ground and the earth is rising.
With guidance, Daniel attended to visual details that allowed him to prioritize and anchor important visual cues that he periodically referred to when re-articulating his model of the greenhouse effect. In this case, the visual cues that helped Daniel to correct his use of the term “UV” were the labels on the screen highlighting important terms that were showcased in the animation.
3.2.2. Perceptual Inferences Become Causal Rules
As the interview progressed, Daniel made inferences based on what he saw in the simulation which subsequently led him to revise his existing model. Sometimes these model revisions occurred rapidly with one quick observation and other times they occurred iteratively over multiple observations and revisions. For example, during the second stage of the simulation Daniel initially incorrectly predicted that “sunlight will excite CO2 molecules,” but quickly revised this hypothesis after observing simulated sunlight pass through CO2. He seemed to effortlessly correct his initial hypothesis, noting that sunlight “...travel[s] through the atmosphere and CO2...There’s really not much of a reaction between them.” Other times, however, the inferences were not quick and effortless. For example, as he progressed through the third stage of the simulation, he was prompted to make a prediction regarding how infrared rays might interact with CO2. The following dialogue highlights the dynamic interplay between perceptual inferences, cognitive conflict, rule formulation and model revision that was typical in most interviews. The following segment occurred immediately after Daniel inferred that infrared rays “crash into” the CO2, as he changes his mind, then pauses multiple times to observe what is happening in the simulation.
- Researcher:
- You said that you noticed that the infrared was interacting with the CO2 this time?
- Daniel:
- Actually, no. I changed my mind. I don’t think the infrared is interacting with the CO2. [pause] Actually, maybe it is. [pause] I think when the infrared rays are passing through [the CO2] it’s exciting them somehow, so yeah I guess it is interacting with them. I don’t know if it’s necessarily interacting with them or if it’s just the presence of the infrared rays is causing the CO2 molecules to move quickly but they’re interacting with each other, not with the infrared, if that makes sense. It’s like having it in the atmosphere is causing them to interact with each other.
- Researcher:
- [Prompts Daniel to put the visualization in slow motion and attend to the “glowing” of CO2] What do you notice this time?
- Daniel:
- When they’re glowing, they’re sucking up the infrared rays. When they’re not glowing they’re exerting the infrared rays.
Here, we see Daniel generating and weighing the plausibility of multiple rules to explain what he sees in the simulation. He had initially noted that infrared crashes into CO2 but after making a closer observation, changed his mind and formulated a rule: “the mere presence of infrared is exciting the CO2 particles.” Then, with guidance, he attended to the glowing of the CO2 particles and searched for a reason for why they were glowing. He therefore changed his mind and asserted a new rule: “Infrared is ‘sucked up’ by the CO2 and later ‘exerted’ again” to account for these new observations. Through this feedback loop between observation, rule generation, model revision and instructor guidance, he quickly rotated through a number of hypotheses and eventually arrived at what he perceived to be the most plausible explanation: that CO2 absorbs and re-emits infrared and gains some energy in the process. Daniel restructured his mental model of the greenhouse effect as he made perceptual inferences from the visualization and recursively revised his causal hypotheses.
3.2.3. Synthesis of Causal Rules
As Daniel progressed through the intervention, he formulated and revised multiple rules to explain what he saw in the simulation. As he progressed, he inferred that (a) sunlight passed freely through CO2, (b) sunlight was absorbed by the ground and was partially re-emitted as infrared, (c) infrared was ‘sucked up’ and later ‘exerted’ by CO2 and (d) all particles gained kinetic energy (and therefore temperature) in the process. When prompted to make a prediction for what would happen on the final screen (“Sun on Ground and CO2”), he synthesized the rules mentioned above to predict how the sun and the ground might interact in the presence of atmospheric CO2.
- Daniel:
- I think that sunlight will travel down in rays, hit the ground, excite the ground, the ground will release infrared into the atmosphere. The infrared will be absorbed by the CO2 molecules, exciting the CO2 molecules, causing there to be more kinetic energy in the atmosphere which rises the temperature. As these CO2 molecules absorb the infrared lights and get more energy, they’ll then release them back aimlessly in different directions. Yeah.
Here we see a coherent integration of his previous inferences in a mechanistic model involving normative mechanisms of the greenhouse effect. The scaffolded nature of this particular simulation enabled Daniel and other participants to discretely establish targeted scientific hypotheses in sequence, building up to a moment where they are able to synthesize the pieces into a coherent (although not always accurate) story. Compared to his initial description, in this final description of the greenhouse effect he clearly mentions infrared, CO2 and processes of absorption and emission that lead to an overall increase in temperature. Moreover, he no longer mentions ozone depletion and later—after viewing an instructional video—comments on his change of mind:
- Daniel:
- I was just like, “Oh, the ozone layer is breaking down, thus the sun has more of an impact on the earth.” I don’t know, that’s not necessarily the case. It is but it’s more so the methane, carbon dioxide and greenhouse gases in the atmosphere that are interacting with infrared that are causing the actual increase in temperature, which scientifically and physically makes sense.
Above we see Daniel coming to articulate an increasingly skilful and more accurate description of the greenhouse effect. This build-up occurred as Daniel made perceptual inferences, was guided by the interviewer to make predictions and attend to relevant details present in the simulation and iteratively formulated and revised intuitive rules and explanations for what he saw. This culminated in a moment of synthesis where Daniel re-articulated his model of the greenhouse effect in terms of the perceptual inferences and intuitive rules that he derived throughout the intervention.
Like many participants in the sample, Daniel accepted that climate change was happening but walked into the interview with several misconceptions about how it works. As he engaged with the simulation, he anchored his descriptions of climate change in the physical/visual representations and actions that he viewed in the simulation, then gradually revised his model as he observed new relationships therein. Daniel’s case illustrates how this grounded learning experience offered opportunities for participants to rearticulate their model of the greenhouse effect in terms of their visual experiences, eventually leading to more normative, episodic descriptions of the greenhouse effect with substantially more scientific accuracy than their original conceptions. This process involved an iterative interplay between observations and model revision that culminated in explanations that Daniel found increasingly more plausible. Daniel can be said to have repeatedly abducted causal rules to speak scientifically about multiple relationships that he observed in the visualization [59].
4. Discussion
The causes of climate change are not well understood among members of the general public. Students in K-12 and higher education also struggle to understand the mechanisms behind climate change, specifically the greenhouse effect [3]. A variety of interventions have met with some success and yet given the gravity of the issue, there is a need for exploring additional instructional approaches that might prove useful. In the present study, we sought to utilize a grounded approach to creating conceptual change. We sought to leverage participants’ ability to draw on concrete, perceivable imagery in order to ground new, abstract language and mechanistic understandings using an interactive simulation. Grounding these abstract notions allowed participants to recall visual imagery in order to re-describe the mechanisms and causal rules that they had discovered while interacting with the simulation.
Our results indicated that through engaging with the visualization, participants reduced their misconceptions and provided more normative scientific language to describe the greenhouse effect. We also found that this conceptual change process occurred as they made observations of the visualization, then repeatedly revised their model to accommodate those observations, culminating in a synthesis of causal rules that participants generated in order to describe what they saw in the visualization. These findings suggest the power of visualization for promoting understanding of complex scientific phenomena such as the greenhouse effect might be enhanced with specific instructor prompts (e.g., to make predictions, describe what they see and offer opportunities for students to explain interactions they observe) that foster more conceptual change.
4.1. Limitations
Although the learning intervention may have led participants to improve upon their models, a limitation to this instructional design is that it did not highlight their personal contributions to climate change nor provide them with potential outlets for action. Surprisingly, the number of participants that mentioned human contributions in their description of how climate change works actually decreased from 50% to 25%. This suggests that human involvement was not as salient a characteristic of the visualization as it could have been (e.g., no people or cars or factories are depicted in the simulation). This also suggests that the interview might have been improved by emphasizing where CO2 comes from and the role of human activities in increased levels of CO2 in the atmosphere. Future research should perhaps consider redesigning the simulation to more directly depict human impacts or supplementing the lesson with a component where individuals can calculate their impact on greenhouse gas emissions (e.g., by using an online carbon footprint calculator; www3.epa.gov/carbon-footprint-calculator) and use this data to brainstorm potential follow-up actions to mitigate climate impacts.
Additional limitations to the present study include that it involved one-on-one interviews with guided prompts which limits the generalizability for scaling up the intervention to larger groups or online populations. Also, our participants were limited to a modestly sized sample of undergraduate psychology students in California and all held favourable attitudes towards the existence of climate change. Our results may have differed had we recruited additional students from a more diverse range of disciplines or locations where people hold different views on climate change. Another limitation is that we did not include a delayed post-test. There is a possibility that the observed reduction in misconceptions might have been temporary and that misconceptions may have returned if measured after a delay. Despite these limitations, we believe there are implications for both classroom instruction and research.
4.2. Implications for Classroom Instruction
The role of the interviewer in this study was critical for supporting student learning. This role was to elicit students’ perceptual judgments of the visualization, guide students to attend to key details in the visualization and support students as they revised their mental models based on incongruent information. With this said, it is unlikely that students would have made the same inferences and arrived at the same conclusions without guidance. Teachers who wish to use visualizations in their classroom should not simply assume that students will learn when given a visualization and should carefully consider their role in facilitating the introduction of a visualization, anticipate students’ missteps and plan for how they will scaffold learning. Based on the recursive development of our interview protocol, we suggest the following instructional techniques.
4.2.1. Elicit Predictions and Explanations
We included prompts to elicit students’ visual explanations and predictions before animating each of the four stages of the simulation. Prompts such as “What do you see?” and “What do you think will happen when we start the animation?” prompted students to share their perceptual judgments and allowed them to articulate their existing mental models before exposing them to the normative scientific model. In this way, students were quick to correct their existing model in based on causal inferences they drew from the simulation.
4.2.2. Scaffold Instruction
We crafted interview questions that became increasingly complex and built upon participants’ prior understandings. For example, we initially asked students to describe their own experiences of the visualization by asking “what do you see,” and were careful to steer students toward noticing important details [e.g., a legend with labels for “infrared” and “sunlight”]. As the interview progressed, we asked students questions that built from previous questions. For example, we first asked students to describe what happens when sunlight encounters the ground and then what happens when sunlight encounters CO2 before asking them to describe what happens when sunlight encounters the ground in the presence of CO2. By scaffolding instruction, students were able to derive a number of causal inferences to be synthesized in a final explanation of how the greenhouse effect works.
4.2.3. Ground Instruction in Visual Details
Visualizations are powerful tools in that can act as anchors to ground student attention and steer them away from defaulting to their occasionally inaccurate conceptions. As such, instructors should anticipate student misconceptions and identify corresponding visual details in the visualization that might prompt students to reflect on those misconceptions. For example, students in our study who assumed that ozone was a central mechanism in the greenhouse effect were instructed to explain the processes they witnessed on the screen and note that ozone was not a part of those processes.
4.2.4. Scaling Up
The intervention created for this study was intended for one-on-one instruction; however, it might also be adapted for full-classroom instruction in either K-12 or higher education settings. For example, when exhibiting the simulation to an entire class, an instructor might call on students to articulate “what they see,” predict “what will happen,” offer multiple opportunities to explain interactions that they observe, revise those explanations and sequentially build students toward a synthesis of their findings in a coherent description of the greenhouse effect, followed up by a supplemental action-oriented activity as mentioned in the limitations section above.
4.3. Implications for Research
Enhancing a visualization with prompts that guide students to leverage their intuitive ideas, perceptual inferences and causal thinking proved useful in a one-on-one setting with a college population of participants. Given the limitations of the projects’ population and scale, future research could examine this intervention or one like it in a larger whole group or classroom setting. It would be interesting to see if the prompts could be embedded within the simulation to be delivered interactively and online, thus allowing for a scale up to larger web-based instructional contexts. It would also be important to extend beyond the population of participants, which was mostly favourable toward the existence of climate change, to populations from different parts of the US who may be more sceptical of the root causes of climate change.
Daniel’s case highlights some ways that a visualization might be used by instructors to divert students from revisiting their misconceptions. Namely, misconceptions might be mitigated by eliciting students’ perceptual inferences, guiding students to attend to visual anchors that then lead to a process where students repeatedly devise and revise explanations for their observations. Future research might use eye-tracking software to gain further insight into what, exactly, students are visually attending to when they make critical inferences. Also, future studies might employ RCT methods to determine how the learning impacts of this intervention compare to other approaches.
Daniel is the case of a student who experienced shifts in his misconceptions about the greenhouse effect, however we acknowledge that differences between students’ learning trajectories may be more nuanced than what is captured by this broad categorization. Students that we interviewed began the interview with either zero, one or two misconceptions and subsequently shifted either a misconception about ozone, a misconception about smog, both misconceptions or neither. Future research might highlight these alternate trajectories in comparative case studies.
Supplementary Materials
The following are available online at https://0-www-mdpi-com.brum.beds.ac.uk/2227-7102/9/1/14/s1, S1: Interview Protocol, S2: Transcribed Interview Data.
Author Contributions
Conceptualization, G.M.S. and I.T.; methodology, I.T.; formal analysis, I.T.; investigation, I.T.; writing—original draft preparation, G.M.S. and I.T.; writing—review and editing, G.M.S. and I.T.; supervision, I.T.
Funding
This research received no external funding.
Acknowledgments
We thank Estela Bensimon, Christine Politte, Julie Posselt and members of the Motivated Change Research Lab for their helpful feedback on the conception, research design and on manuscript drafts.
Conflicts of Interest
The authors declare no conflict of interest.
References
- Goldstone, R.L.; Sakamoto, Y. The transfer of abstract principles governing complex adaptive systems. Cogn. Psychol. 2003, 46, 414–466. [Google Scholar] [CrossRef] [Green Version]
- Chi, M.T.H. Common sense conceptions of emergent processes: Why some misconceptions are robust. J. Learn. Sci. 2005, 14, 161–199. [Google Scholar] [CrossRef]
- Ranney, M.A.; Clark, D. Climate change conceptual change: Scientific information can transform attitudes. Top. Cogn. Sci. 2016, 8, 49–75. [Google Scholar] [CrossRef] [PubMed]
- Lombardi, D.; Sinatra, G.M. College students’ perceptions about the plausibility of human-induced climate change. Res. Sci. Educ. 2012, 42, 201–217. [Google Scholar] [CrossRef]
- Koulaidis, V.; Christidou, V. Models of students’ thinking concerning the greenhouse effect and teaching implications. Sci. Educ. 1999, 83, 559–576. [Google Scholar] [CrossRef]
- Gautier, C.; Deutsch, K.; Rebich, S. Misconceptions about the greenhouse effect. J. Geosci. Educ. 2006, 54, 386–395. [Google Scholar] [CrossRef]
- Jeffries, H.; Stanisstreet, M.; Boyes, E. Knowledge about the “Greenhouse Effect”: Have college students improved? Res. Sci. Technol. Educ. 2001, 19, 205–221. [Google Scholar] [CrossRef]
- Groves, F.; Pugh, A. Cognitive illusions to learning as hindrances to complex environmental issues. J. Sci. Educ. Technol. 2002, 11, 381–390. [Google Scholar] [CrossRef]
- Howe, P.; Mildenberger, M.; Marlon, J.; Leiserowitz, A. Geographic variation in opinions on climate change at state and local scales in the USA. Nat. Clim. Chang. 2015, 5, 596–603. [Google Scholar] [CrossRef] [Green Version]
- Intergovernmental Panel on Climate Change. Global Warming of 1.5 °C above Pre-Industrial Levels and Related Global Greenhouse Gas Emission Pathways, in the Context of Strengthening the Global Response to the Threat of Climate Change, Sustainable Development, and Efforts to Eradicate Poverty; World Meteorological Organization: Geneva, Switzerland, 2018. [Google Scholar]
- Sinatra, G.M.; Kienhues, D.; Hofer, B.K. Addressing challenges to public understanding of science: Epistemic cognition, motivated reasoning, and conceptual change. Educ. Psychol. 2014, 49, 123–138. [Google Scholar] [CrossRef]
- Sinatra, G.M.; Kardash, C.M.; Taasoobshirazi, G.; Lombardi, D. Promoting attitude change and expressed willingness to take action toward climate change in college students. Instr. Sci. 2012, 40, 1–17. [Google Scholar] [CrossRef]
- Cook, J.; Nuccitelli, D.; Green, S.A.; Richardson, M.; Winkler, B.; Painting, R.; Skuce, A. Quantifying the consensus on anthropogenic global warming in the scientific literature. Environ. Res. Lett. 2013, 8, 024024. [Google Scholar] [CrossRef] [Green Version]
- NGSS Lead States. Next Generation Science Standards: For States, by States; The National Academies Press: Washington, DC, USA, 2013. [Google Scholar]
- Sterling, S. Sustainability Education: Perspectives and Practice across Higher Education; Taylor & Francis: Abingdon, UK, 2010. [Google Scholar]
- Knight, R.D.; Jones, B.; Field, S. College Physics; Pearson Education: London, UK, 2009. [Google Scholar]
- Serway, R.A.; Vuille, C. College Physics; Cengage Learning: Boston, MA, USA, 2014. [Google Scholar]
- Hobson, A. Energy, Environment, and Climate; W. W. Norton & Co., Inc.: New York, NY, USA, 2008. [Google Scholar]
- Muller, R.A. Physics for Future Presidents: The Science behind the Headlines; WW Norton & Company: New York, NY, USA, 2008. [Google Scholar]
- Borgford, C.; Champagne, A.; Cuevas, M.; Dumas, L.; Lamb, W.G.; Vonderbrink, S.A. Physical Science; Holt, Rinehart, and Winston: New York, NY, USA, 2007. [Google Scholar]
- Campbell, N.A.; Reece, J.B.; Urry, L.; Cain, M.L.; Wasserman, S.A.; Minorsky, P.V.; Jackson, R.B. Biology; Pearson Education: London, UK, 2017. [Google Scholar]
- Cordova, J.R.; Sinatra, G.M.; Broughton, S.H.; Taasoobshirazi, G.; Lombardi, D. Self-efficacy, interest, prior knowledge, and confidence in prior knowledge: Influences on conceptual change. Contemp. Educ. Psychol. 2014, 39, 164–174. [Google Scholar] [CrossRef]
- Broughton, S.H.; Sinatra, G.M.; Reynolds, R.E. The nature of the refutation text effect: An investigation of attention allocation. J. Educ. Res. 2010, 103, 407–423. [Google Scholar] [CrossRef]
- Heddy, B.C.; Danielson, R.W.; Sinatra, G.M.; Graham, J. Modifying knowledge, emotions, and attitudes regarding genetically modified foods. J. Exp. Educ. 2017, 85, 513–533. [Google Scholar] [CrossRef]
- Danielson, R.; Sinatra, G.M.; Kendeou, P. Augmenting the refutation text effect with analogies and graphics. Discourse Process. 2016, 53, 392–414. [Google Scholar] [CrossRef]
- Danielson, R.; Schwartz, N.; Lippmann, R. Metaphorical graphics aid learning and memory. Learn. Instr. 2015, 39, 194–205. [Google Scholar] [CrossRef]
- Shepardson, D.P.; Niyogi, D.; Choi, S.; Charusombat, U. Students’ conceptions about the greenhouse effect, global warming, and climate change. Clim. Chang. 2011, 104, 481–507. Available online: https://0-link-springer-com.brum.beds.ac.uk/content/pdf/10.1007/s10584-009-9786-9.pdf (accessed on 20 December 2018). [CrossRef]
- National Wildlife Federation. Climate Change Education: Spotlight on Project Based Learning. 2014. Available online: http://www.nwf.org/~/media/mPDFs/Campus-Ecology/Greenforce-Initiative/North%20Carolina/Climate%20Change%20Education%20-%20Spotlight%20on%20Project%20Based%20Learning.pdf (accessed on 13 November 2015).
- National Aeronautics and Space Administration. Climate Change Inquiry Labs. Available online: http://pmm.nasa.gov/education/sites/default/files/lesson_plan_files/climate%20change%20inquiry/Climate%20Change%20Inquiry%20TG.pdf (accessed on 9 December 2015).
- University of Colorado at Boulder. The Greenhouse Effect. PhET Interactive Simulations. 2011. Available online: http://phet.colorado.edu/en/simulation/greenhouse (accessed on 16 November 2017).
- Rooney-Varga, J.N.; Sterman, J.D.; Fracassi, E.; Franck, T.; Kapmeier, F.; Kurker, V.; Rath, K. Combining role-play with interactive simulation to motivate informed climate action: Evidence from the World Climate simulation. PLoS ONE 2018, 13, e0202877. [Google Scholar] [CrossRef]
- Rapp, D.N. Mental models: Theoretical issues for visualizations in science education. In Visualization in Science Education; Gilbert, J.K., Ed.; Springer: Dordrecht, The Netherlands, 2005; pp. 43–60. [Google Scholar]
- Greca, I.M.; Moreira, M.A. Mental, physical, and mathematical models in the teaching and learning of physics. Sci. Educ. 2001, 86, 106–121. [Google Scholar] [CrossRef]
- Dole, J.A.; Sinatra, G.M. Reconceptualizing change in the cognitive construction of knowledge. Educ. Psychol. 1998, 33, 109–128. [Google Scholar] [CrossRef]
- Vosniadou, S. International Handbook of Research on Conceptual Change, 2nd ed.; Routledge: New York, NY, USA, 2013. [Google Scholar]
- Abrahamson, D. Embodied design: Constructing means for constructing meaning. Educ. Stud. Math. 2009, 70, 27–47. [Google Scholar] [CrossRef]
- Gilbert, J. Visualization: A metacognitive skill in science and science education. Vis. Sci. Educ. 2005, 9–27. [Google Scholar] [CrossRef]
- Schwartz, D.L.; Heiser, J. Spatial representations and imagery in learning. In Handbook of the Learning Sciences; Cambridge University Press: Cambridge, UK, 2006; pp. 283–298. [Google Scholar]
- Shepardson, D.P.; Wee, B.; Priddy, M.; Schellenberger, L.; Harbor, J. What is a watershed? Implications of student conceptions for environmental science education and the national science education standards. Sci. Educ. 2007, 91, 554–578. [Google Scholar] [CrossRef]
- Cheek, K.A. Commentary: A summary and analysis of twenty-seven years of geoscience conceptions research. J. Geosci. Educ. 2010, 58, 122–134. [Google Scholar] [CrossRef]
- Coll, R.K.; France, B.; Taylor, I. The role of models/and analogies in science education: Implications from research. Int. J. Sci. Educ. 2005, 27, 183–198. [Google Scholar] [CrossRef]
- Fischbein, E. Intuition in Science and Mathematics; D. Reidel: Dordrecht, The Netherlands, 1987. [Google Scholar]
- Cobb, P. A double-edged sword. J. Res. Math. Educ. 1989, 20, 213–218. [Google Scholar] [CrossRef]
- Posner, G.J.; Strike, K.A.; Hewson, P.W.; Gertzog, W.A. Accommodation of a scientific conception: Towards a theory of conceptual change. Sci. Educ. 1982, 67, 489–508. [Google Scholar] [CrossRef]
- Anderson, T.; Shattuck, J. Design-based research: A decade of progress in education research. Educ. Res. 2012, 41, 16–25. [Google Scholar] [CrossRef]
- Concord Consortium. Sunlight, Infrared, CO2, and the Ground. 2014. Available online: http://lab.concord.org/embeddable.html#interactives/sam/light-matter/sun-on-ground.json (accessed on 9 April 2018).
- Ranney, M.A.; Lamprey, L.N. How Global Warming Works. 2013. Available online: http://www.HowGlobalWarmingWorks.org (accessed on 16 November 2017).
- Maxwell, J.A. Qualitative Research Design: An Interactive Approach; Sage Publications, Inc.: Thousand Oaks, CA, USA, 2013. [Google Scholar]
- Kvale, S.; Brinkmann, S. Interviews: Learning the Craft of Qualitative Research Interviewing, 2nd ed.; Sage Publications: Beverly Hills, CA, USA, 2009. [Google Scholar]
- Barab, S.; Squire, K. Design-based research: Putting a stake in the ground. J. Learn. Sci. 2004, 13, 1–14. [Google Scholar] [CrossRef]
- Miles, M.B.; Huberman, A.M. Drawing valid meaning from qualitative data: Toward a shared craft. Educ. Res. 1984, 13, 20–30. [Google Scholar] [CrossRef]
- Creswell, J.W. Qualitative Inquiry and Research Design: Choosing among Five Approaches; Sage: Thousand Oaks, CA, USA, 2007. [Google Scholar]
- Saldaña, J. The Coding Manual for Qualitative Researchers; Sage: Thousand Oaks, CA, USA, 2010. [Google Scholar]
- Corbin, J.; Strauss, A. Basics of Qualitative Research: Techniques and Procedures for Developing Grounded Theory; Sage: Thousand Oaks, CA, USA, 2008. [Google Scholar]
- Glaser, B.G.; Strauss, A.L. The Discovery of Grounded Theory; Weidenfeld & Nicolson: London, UK, 1967. [Google Scholar]
- Stake, R.E. Qualitative case studies. In Handbook of Qualitative Research; Denzin, N.K., Lincoln, Y.S., Eds.; Sage: Thousand Oaks, CA, USA, 2005; pp. 443–465. [Google Scholar]
- Yin, R.K. Case Study Research: Design and Methods, 2nd ed.; Sage: Thousand Oaks, CA, USA, 1994. [Google Scholar]
- Lombardi, D.; Sinatra, G.M.; Nussbaum, E.M. Plausibility reappraisals and shifts in middle school students’ climate change conceptions. Learn. Instr. 2013, 27, 50–62. [Google Scholar] [CrossRef]
- Abrahamson, D. Orchestrating semiotic leaps from tacit to cultural quantitative reasoning—The case of anticipating experimental outcomes of a quasi-binomial random generator. Cogn. Instr. 2009, 27, 175–224. [Google Scholar] [CrossRef]
Figure 1.
Textbook graphic perpetuating a common misconception about the greenhouse effect: Greenhouse gas layer and pollutants as greenhouse gasses. The representation is misleading because it incorrectly depicts a single layer of visible smog as trapping infrared light rather than invisible greenhouse gasses that are uniformly distributed about the earth’s atmosphere (Lapinski, Schoch, and Tweed 2003, as cited in Shepardson, Niyogi, Choi, and Charusombat, 2011) [27].

Figure 2.
Screenshots from the Concord Consortium Simulation: Screen 1 of 4 “Sun on ground.” (a) The “Sun on ground” screen before the play button has been clicked. (b) The “Sun on ground” screen after the play button has been clicked and the temperature has been given time to stabilize. When particles on the ground absorb sunlight they begin glowing, vibrating (increase in temperature) and then emit infrared light, losing their glow.


Table 1.
Mechanisms referenced by participants to describe their model of climate change. 3.1. Subsection.
Table 1.
Mechanisms referenced by participants to describe their model of climate change. 3.1. Subsection.
| Pre-Intervention % (N = 20) | Post-Intervention % (N = 20) | Significance Test for Difference in Proportion Chi-Squared (p) | |
|---|---|---|---|
| Ozone Depletion or Ultraviolet Light * | 45% | 10% | 6.0 (.014) |
| Visible Smog or Pollution * | 30% | 0% | 6.9 (.009) |
| CO2 | 50% | 75% | 2.6 (.107) |
| Other Greenhouse Gasses | 40% | 70% | 4.8 (.027) |
| Increases in Temperature | 70% | 80% | 0.5 (.471) |
| Human Involvement | 50% | 25% | 2.6 (.107) |
| Heat “Trapped” in Atmosphere | 50% | 80% | 3.9 (.050) |
| Infrared Radiation | 0% | 100% | 39 (<.001) |
| Sunlight is Transformed to Infrared | 0% | 85% | 29 (<.001) |
Note. * Denotes a common misconception.
© 2019 by the authors. Licensee MDPI, Basel, Switzerland. This article is an open access article distributed under the terms and conditions of the Creative Commons Attribution (CC BY) license (http://creativecommons.org/licenses/by/4.0/).
Share and Cite
MDPI and ACS Style
Thacker, I.; Sinatra, G.M. Visualizing the Greenhouse Effect: Restructuring Mental Models of Climate Change Through a Guided Online Simulation. Educ. Sci. 2019, 9, 14. https://0-doi-org.brum.beds.ac.uk/10.3390/educsci9010014
AMA Style
Thacker I, Sinatra GM. Visualizing the Greenhouse Effect: Restructuring Mental Models of Climate Change Through a Guided Online Simulation. Education Sciences. 2019; 9(1):14. https://0-doi-org.brum.beds.ac.uk/10.3390/educsci9010014
Chicago/Turabian StyleThacker, Ian, and Gale M. Sinatra. 2019. "Visualizing the Greenhouse Effect: Restructuring Mental Models of Climate Change Through a Guided Online Simulation" Education Sciences 9, no. 1: 14. https://0-doi-org.brum.beds.ac.uk/10.3390/educsci9010014
Note that from the first issue of 2016, this journal uses article numbers instead of page numbers. See further details here.