
Impact of the Generation System Parameters on the Frequency Response of the Power System: A UK Grid Case Study


School of Engineering, University of Lincoln, Brayford Pool, Lincoln LN6 7TS, UK
*
Author to whom correspondence should be addressed.
Electricity 2021, 2(2), 143-157; https://0-doi-org.brum.beds.ac.uk/10.3390/electricity2020009
Submission received: 27 January 2021
/
Revised: 19 March 2021
/
Accepted: 13 April 2021
/
Published: 20 April 2021
Abstract
:The operation and the development of power system networks introduce new types of stability problems. The effect of the power generation and consumption on the frequency of the power system can be described as a demand/generation imbalance resulting from a sudden increase/decrease in the demand and/or generation. This paper investigates the impact of a loss of generation on the transient behaviour of the power grid frequency. A simplified power system model is proposed to examine the impact of change of the main generation system parameters (system inertia, governor droop setting, load damping constant, and the high-pressure steam turbine power fraction), on the primary frequency response in responding to the disturbance of a 1.32 GW generation loss on the UK power grid. Various rates of primary frequency responses are simulated via adjusting system parameters of the synchronous generators to enable the controlled generators providing a fast-reliable primary frequency response within 10 s after a loss of generation. It is concluded that a generation system inertia and a governor droop setting are the most dominant parameters that effect the system frequency response after a loss of generation. Therefore, for different levels of generation loss, the recovery rate will be dependent on the changes of the governor droop setting values. The proposed model offers a fundamental basis for a further investigation to be carried on how a power system will react during a secondary frequency response.
1. Introduction
The operation and the development of power system networks introduce new types of stability problems [1,2,3]. The effect of the power generation and consumption on the frequency of the power system can be described as a demand/generation imbalance resulting from a loss of generation or load manifests itself as a variation in the system frequency [4]. A high demand on consumption will cause system frequency to decrease, while low demand on consumption will increase the system frequency, and vice versa with the generation [5]. There are many possible parameters involved when analysing the problems associated with the controlled operation of the power systems [6].
A power system is a highly nonlinear system and its dynamic response is influenced by a wide range of devices with different characteristics and response rates [7]. Characteristics such as rapid load changes and generation outputs, loss of synchronisation among generators, short-circuiting on the transmission, and other operating parameters that are affected by the changes of the environment and operational disturbances.
Although the power systems are designed to withstand wide-ranging disturbances, stability of the power system becomes remarkably unstable with the greater disturbances [7,8]. The potential of research in investigating how power generation–consumption and frequency stability affect the overall performance of the power grid system, including the parameters that define and determine the frequency output after a disturbance, has remarkably increased [9].
At the generation side, the rotational speed of synchronous machines is directly proportional to the systems frequency [10,11]. Frequency stability refers to the ability of the power system to maintain steady frequency following a severe system disturbance resulting in a significant imbalance between generation and load [8,12]. Deviations in frequency will result in the use of control applications to regulate the frequency of the power grid to the safe and satisfactory levels [13,14]. The UK Grid regulates frequency to be maintained at ±1% of the nominal system frequency (50 Hz), except at exceptional circumstances [15].
Demand Side Response (DSR) is a real-time intervention using energy controlled applications when the power systems is disturbed or stressed [16]. Load-shedding is a coordinated controlled response which results in reduction in electrical load, this relieves stress on the main power system [17].
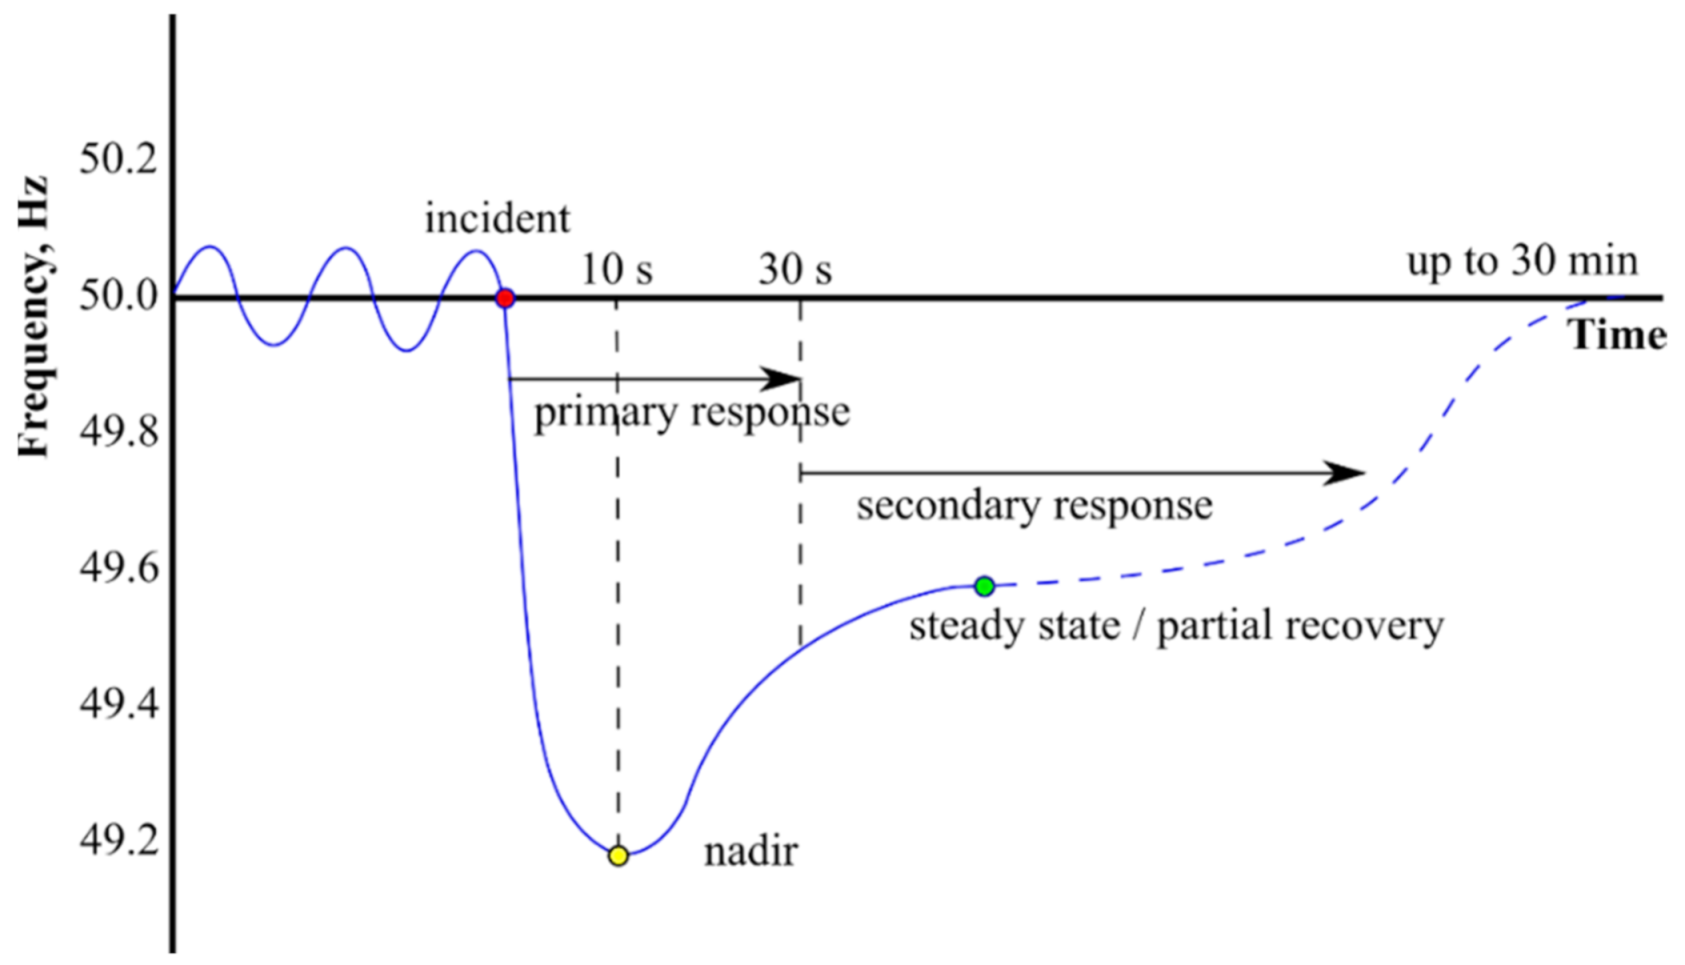
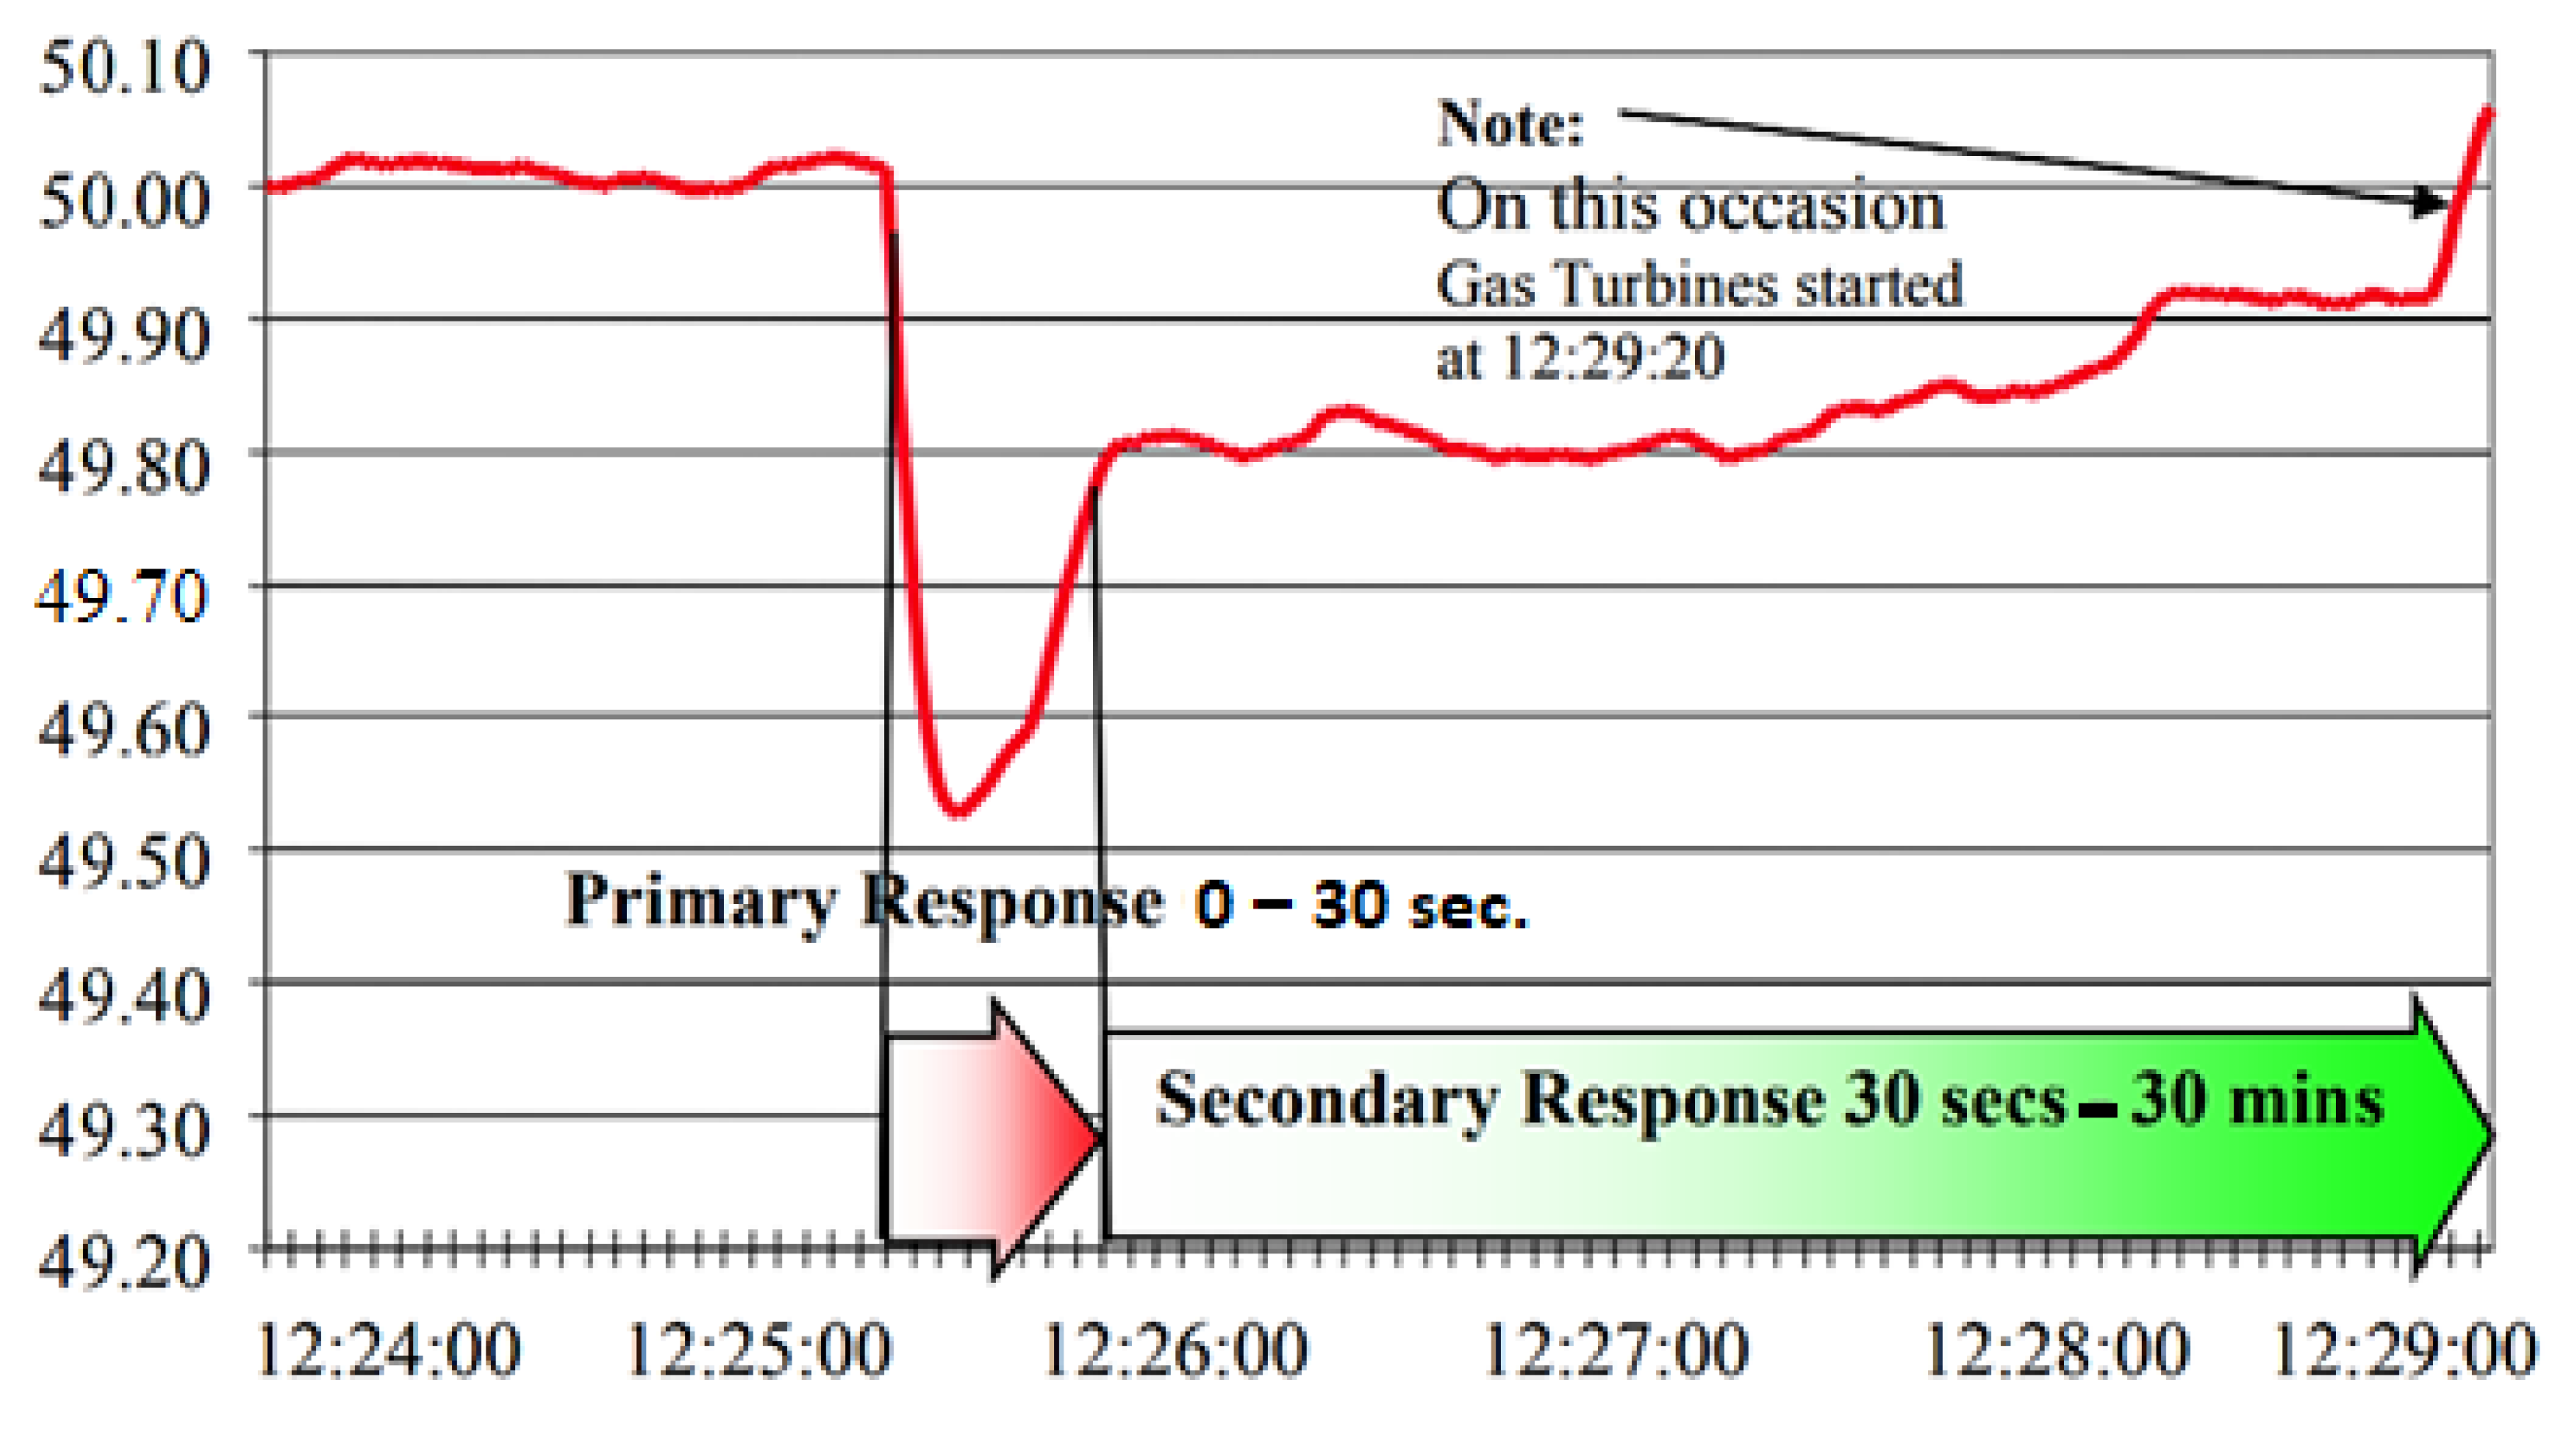
Frequency response services are classified into the following three categories [18], as illustrated in Figure 1. A primary response occurs when the frequency deviation > ±0.2 Hz form the nominal 50 Hz and lasts for 30 s until the secondary response starts. A secondary response occurs after the primary response and lasts up to 30 min. The Firm Frequency Response (FFR) is an additional service that is like the automatic generation control (AGC) uses consumption or generation to provide the service requirements [19].
Dahal et al. [2] investigated a small signal stability of the renewable wind and solar PVs based on distribution system fed by synchronous induction and static generators. The controlled voltage and power factor operations of the synchronous generators were considered. Eigenvalue analyses were corroborated with the time domain analysis to determine the impact of renewable energy resources penetration on the power system. The results showed that wind generators cause a high system oscillation, whilst the solar PVs improve the small signal behaviour of the system.
Teng et al. [15] presented a case study based on using an advanced stochastic generation scheduling model, which suggests that the delivery of frequency response via DSR could significantly reduce the system operation cost, wind power limitation, and CO2 emissions in the future power system characterized by high wind renewable penetration in the UK. The results showed dramatic variations in frequency response requirements caused by high penetration of wind.
Qazi and Flynn [4] investigated and analysed the implications of large-scale decentralised DSR resource seasonal variations on system operation and system recovery post a loss of large infeed/load. Additionally, they addressed how the DSR controller hardware characteristics influence the provision and effectiveness of reserve delivery. The seasonal variations, residential customer behaviours, and the diversity of individual device characteristics were identified, and a thermodynamic model of a flexible load integrated with a detailed power system model was developed.
Zin et al. [17] investigated several static and dynamic low frequency load-shedding schemes, by taking into account the voltage and frequency characteristics and the size of the disturbance on five buses power system in order to determine the amount of load shed, minimum value of low frequency, and recovery time.
Muhssin et al. [18] developed a dynamic frequency control to examine and evaluate the aggregation of large numbers of the domestic small fridges and heat pumps to deliver Firm Frequency Response service in order to maintain a balance between the supply with demand based on a simplified Great Britain power system model. It was reported that the aggregated loads offered high power capacity and hence an instantaneous frequency response service could be cost effectively achieved.
Pathak et al. [21] investigated the operation and performance of the automatic generation control (AGC) of thermal power plants system under different levels/schedules of power generation. It has been reported that that the dynamic model parameters of the steam turbines, turbine time constants and power fractions, were changed with the changes in the generation schedules of the plant, in order to examine the dynamic performance of AGC system. The presented results demonstrate the potential of this approach.
Postnikov et al. [22] presented a novel and validated model that enables a large scale control of distributed retail refrigeration systems in responding to demand side response event. Transient responses of the system during the event showed significant fluctuations of active power when compressor network responds to both primary and secondary parts of a DSR event.
Albayati et al. [23] investigated the impact of responding to the secondary static demand side response events, on the supply power profile and energy efficiency of the widely distributed aggregated commercial refrigeration systems. The aggregated loads contributed to the necessary load-shed by 97.3% at the beginning of response and 27% during the remaining 30 min.
Cheng et al. [24] approached the problem of frequency instability in a power system by incorporating a control algorithm for a model of refrigerators to respond to deviations in system frequency by regulating their power consumption, in responding to a sudden loss of generation of 1.32 GW. A total of four different population number of refrigerators (0, 100, 1000, and 10,000) were used as the demand load acting as direct load control (DLC). The refrigerators help mitigate and regulate the systems frequency variation and thus reduce the pressure on the generators.
Cheng et al. [25] incorporated a virtual energy storage system (VESS) in responding to a sudden loss of generation of 1.22 GW. The VESS releases energy immediately in response to the deviation of the systems frequency. A VESS is designed as a single high capacity energy storage system. The simulated results had shown that the VESS was able to provide low and high frequency response like the conventional ESS. Results show that the VESS provides a quicker response to frequency variations compared to the conventional generators.
This paper investigates the impact of a loss of generation on the transient behaviour of the power grid frequency. A simplified power grid model that tests and simulates the effect of model parameters on the frequency response will be developed to examine the effect of four operational parameters of the generation systems (system inertia, governor droop setting, load damping constant, and the high-pressure steam turbine power fraction) in controlling and stabilising the systems frequency post responding to the primary frequency response. One potential approach would be to regulate the generator speed which can control the power system frequency by incorporating a governor that controls the turbine speed via the turbine gate of the generator, essentially highlighting the effect of the operational parameters of the generation systems in controlling and stabilising the systems frequency post responding to the primary frequency response.
2. Power System Model and Governing Parameters
According to the electricity supply regulations (ESR) in the UK, the system frequency in England and Wales must be maintained at 50 ± 1% Hz apart from exceptional circumstances. The National Grid (NG) has an obligation to plan and operate the power system with respect to the ESR and incorporated with the transmission licence to ensure compliancy, these obligations are presented in Table 1 [26].
A simplified power grid model that tests and simulates the effect of model parameters on the frequency response, will be developed to examine the effect of the operational parameters of the generation systems in controlling and stabilising the systems frequency post responding to the primary frequency response. One potential approach would be to regulate the generator speed which can control the power system frequency by incorporating a governor that controls the turbine speed via the turbine gate of the generator. The primary frequency response will be controlled by the lumped generator units associated with the following assumptions that will be considered in order to simplify the developed model as given below:
- To reduce complexity, islanding and faults along the transmission will not be considered in the power grid model. Assuming there is sufficient transmission capacity enables the modelling from demand tripping. If transmission was not sufficient then the modelling would be more complex and would require a transient model. The results would be more accurate, but the findings would be concluded the same.
- The model represents a collective performance of all generators. Additionally, inter-generator oscillations are neglected, and coherent average response is assumed; therefore, individual generators are not observed. Additionally, only active power is considered while reactive power is relatively independent, assuming an equivalent-generator system model for practicality reasons. If the behaviour of the generators were observed individually rather than averaged, the results would be slightly less accurate, and the investigation would be too complex for this type of research.
- Free-governor operation; therefore, the change in frequency is compensated by the change in generation and not assisted by external power supplies. Assuming no external power supplies means the system is self-dependent. If this was not the case, the primary frequency response would be faster and more efficient; however, this was not the scope of the investigation and therefore the findings would be different.
- A total of 100% generation level; therefore, the generators are working at full capacity.
- Only primary frequency response rate is going to be analysed; therefore, only the high-pressure section of the turbine will be considered in this model, whilst the intermediate and low pressure sections have longer time constants and, therefore, can be neglected.
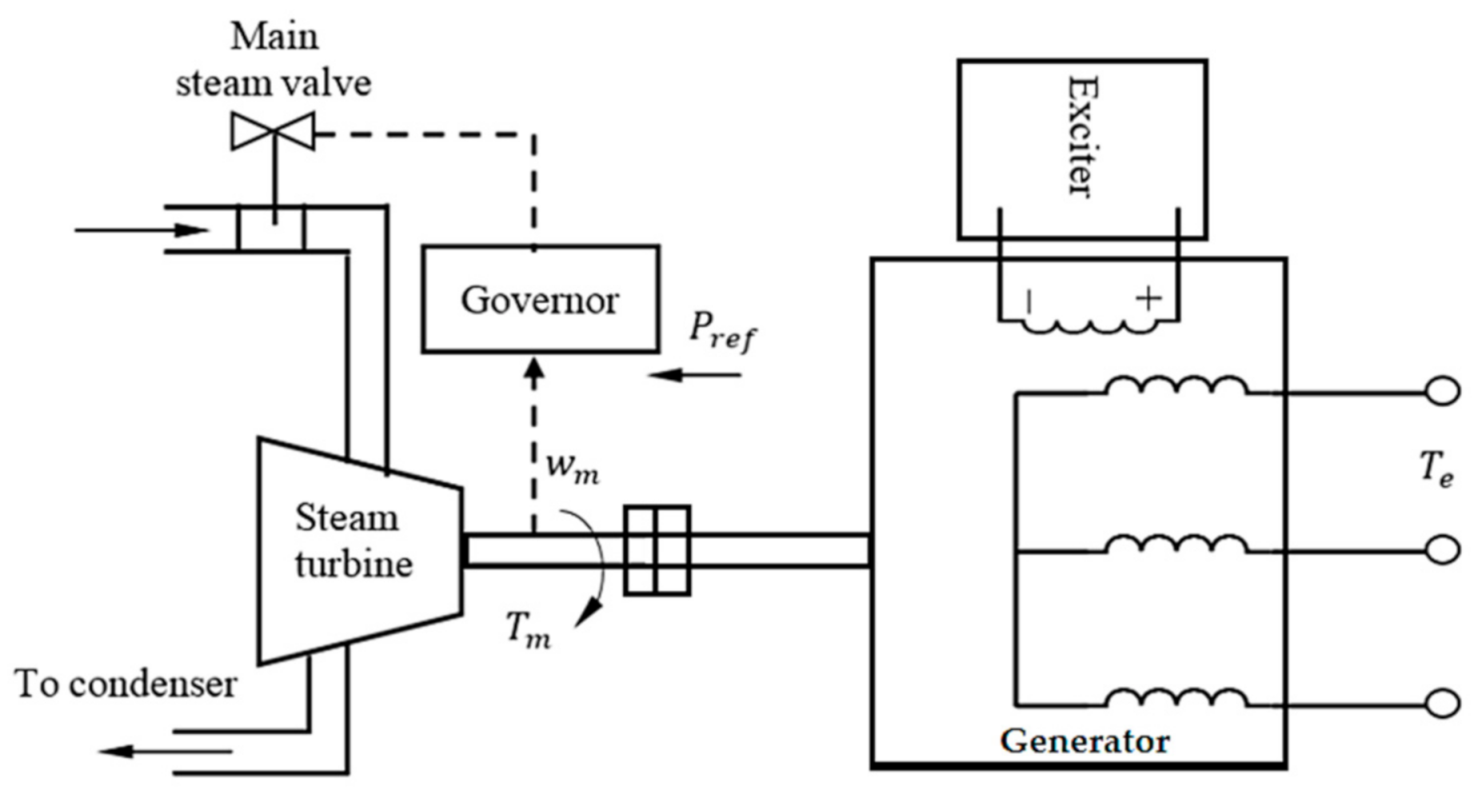
The developed model is designed based on a synchronous generator diagram shown in Figure 2. The change in the load is an automatic change in the electrical power output Te of the generator, this change causes an imbalance between the electrical power Te and the mechanical torque Tm which results in the frequency variation; this imbalance refers to the change in the speed of the shaft wm. To successfully control the frequency of the system, the mechanical output torque Tm must be adjusted and controlled by the main steam valve; this is accomplished through the governor component. When an imbalance occurs, the shaft speed wm acts as a feedback signal, if Tm is greater than Te, the shaft power increases, which results in the governor reducing the main inlet valve; however, when Tm is smaller than Te, the opposite occurs [27].
The changes of the mechanical ∆Pm and electrical power ∆Pe of the generator can be expressed in Equations (1) and (2) below [28,29].
where ∆wm (rad/s) is the change in the angular velocity of the shaft, Heq is the equivalent angular inertia constant of the generator. The change of electrical power ∆Pe due to the changes in frequency can be expressed as [29].
where ∆PL is a non-frequency sensitive load change, D. ∆wm is a frequency sensitive load change, and D is the load damping constant. The damping constant captures the effect of frequency-sensitive load. The load damping constant symbolises the lumped percent change in the load for a 1% change in frequency. Therefore, investigating the impact of Heq and D on the frequency of the power system due to the changes in mechanical power from multiple generators and the change of load ΔPL is a vital [30].
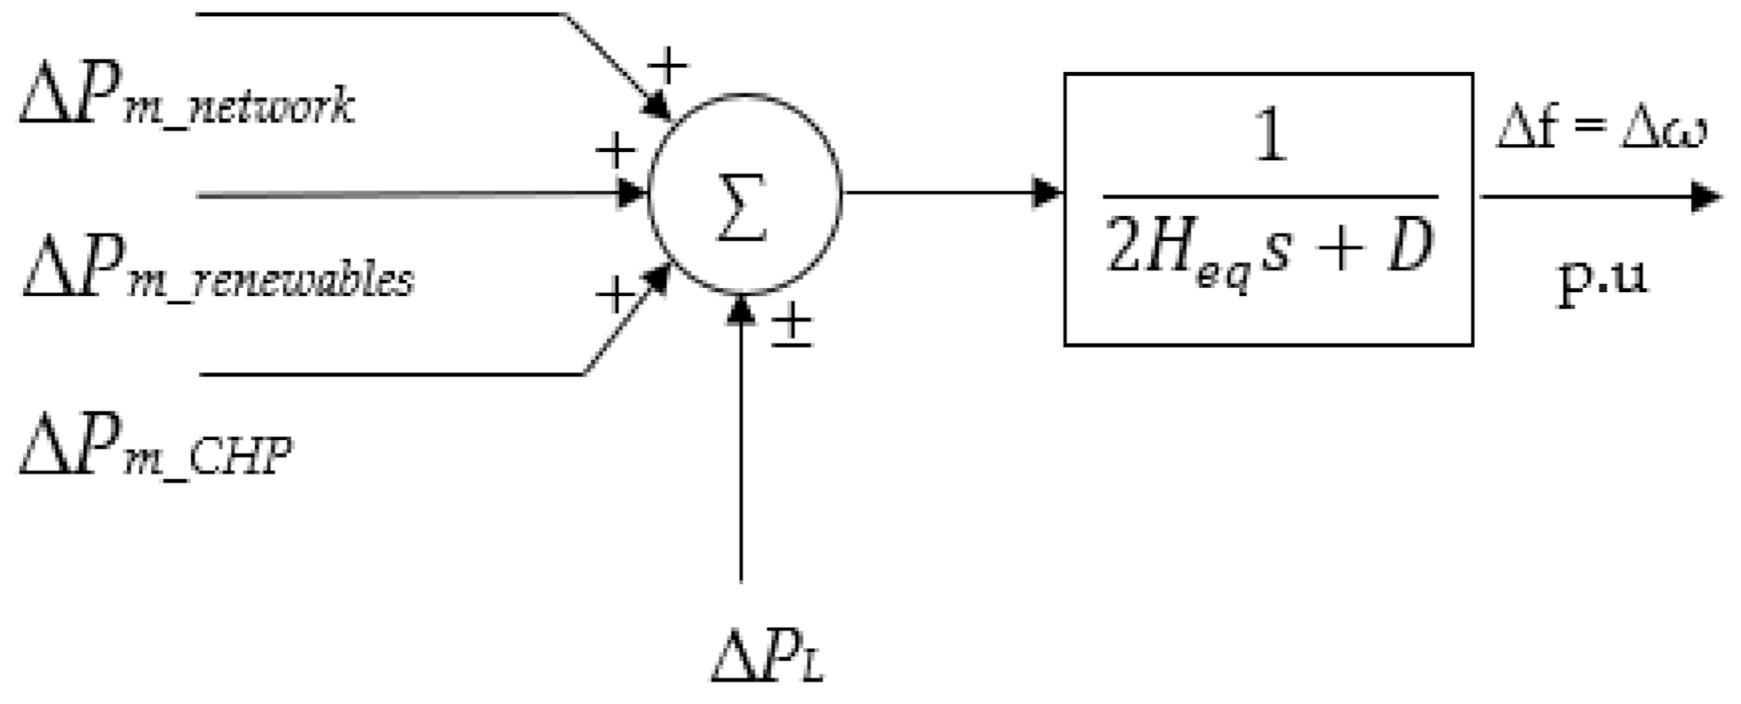
By re-arranging Equations (1) and (2) and Laplace transforming, Equation (3) is yielded, which represents a simplified model with an equivalent inertia constant Heq and lumped load-damping D constant, as shown in Figure 3. Thus, when there is an increase on the power demand, ∆PL will have a negative sign, and a positive for the decrease on the power demand [30].
The equivalent angular inertia constant of the generator Heq represents the sum of the inertia for different types of generators in relation to the power system base SB. The equivalent inertia of the system can be determined by Equations (4) and (5) [30].
The system inertia is a key element of how the generators respond to the changes of the grid frequency. Table 2 presents different inertia constants for different generation systems of nuclear, coal, gas, and combined cycle gas turbine systems CCGT [31].
According to the UK grid code, for a primary response, all generators should have a governor droop setting R (in %) between 3% to 5% [32]. The governor droop setting distinguishes how the generation systems coupled to the power output changes of the power system in relation to the changes in system frequency. This characteristic reduces the speed of the generator rotor as the load increases. The governor droop setting R (in %) can be determined by Equation (6) [30].
where ωo, ωNL, and ωFL represent the rotor speed at steady-state speed, at nominal no load, and at full load, respectively, and where R is the ratio of speed or frequency deviation to the power output change, in p.u. For a multi-generator system, Req can be determined through the combined individual speed-droops of ‘n’ single units, as given in Equation (7) [30].
The change of the system frequency Δf depends on both Req and D values. Δf can be represented by the steady-state frequency deviation Δfss, which follows the change in load ΔPL as given in Equation (8) [30].
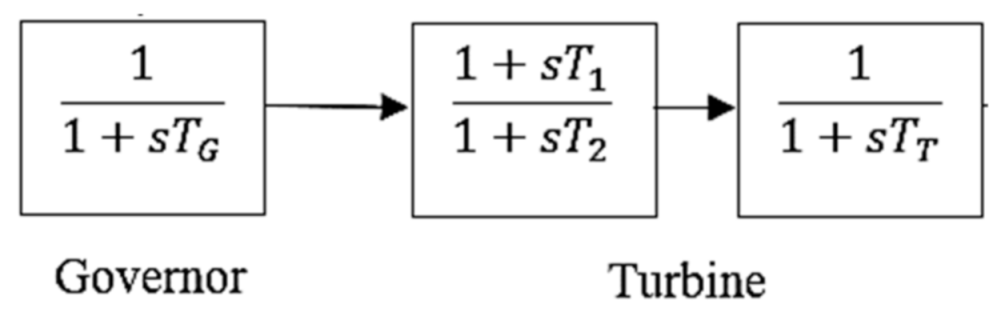
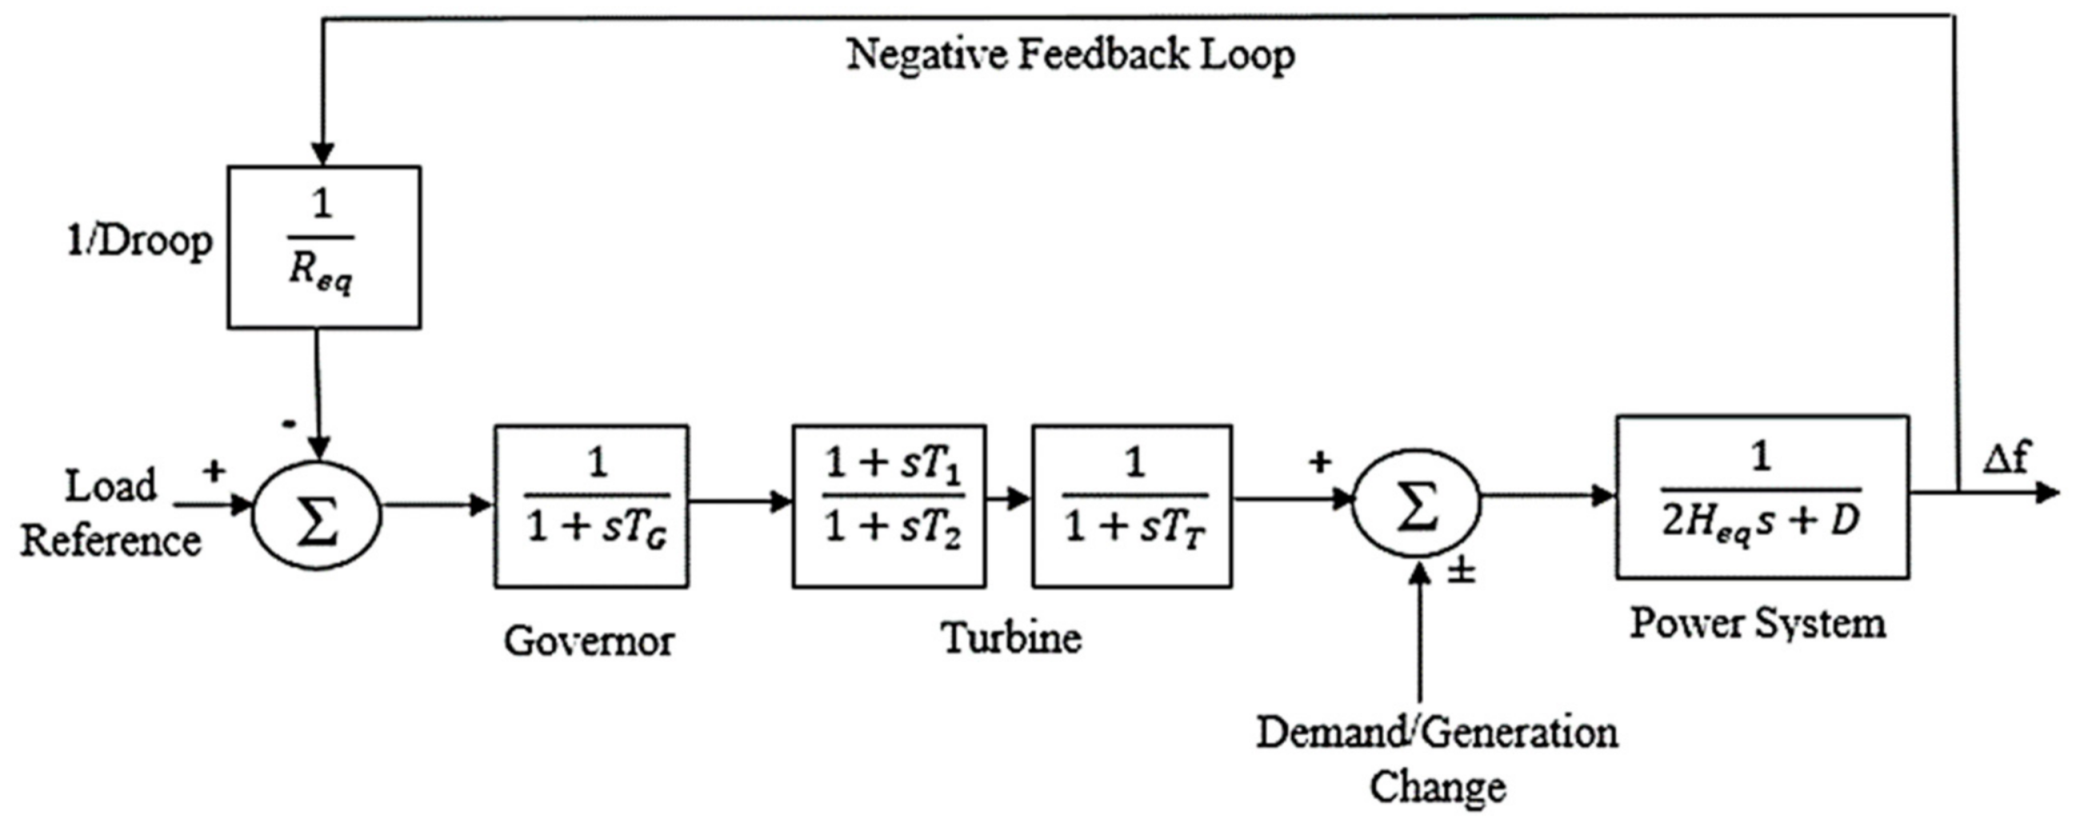
The governor-turbine generation governing settings of the proposed model are presented in Figure 4 [30]. T1/T2 is the high-pressure power fraction which represents the fraction of the total power generated by the high-pressure part of the turbine, TG is the time constant for governor inlet valve, and TT is the time constant for turbine output valve [30]. T1/T2 is not delayed by the reheating; this achieves a stable response from the speed control, while the governor transfer function is a proportional gain of 1/R achieving a stable load division across multiple generating units operating in parallel [30].
By incorporating all the proposed governing equations and the operational assumptions as presented above, the following generic power system model is developed, as shown in Figure 5. This power system model focuses on the generation side in responding to the primary frequency response.
3. Model Testing and Validation
To validate the developed power system model, parameters of the proposed model are adapted from the actual frequency event occurred on the UK National Grid system on 15 August 1995 following a loss of 1.22 GW of generation incident at a 25 GW base load, as shown in Figure 6 [33].
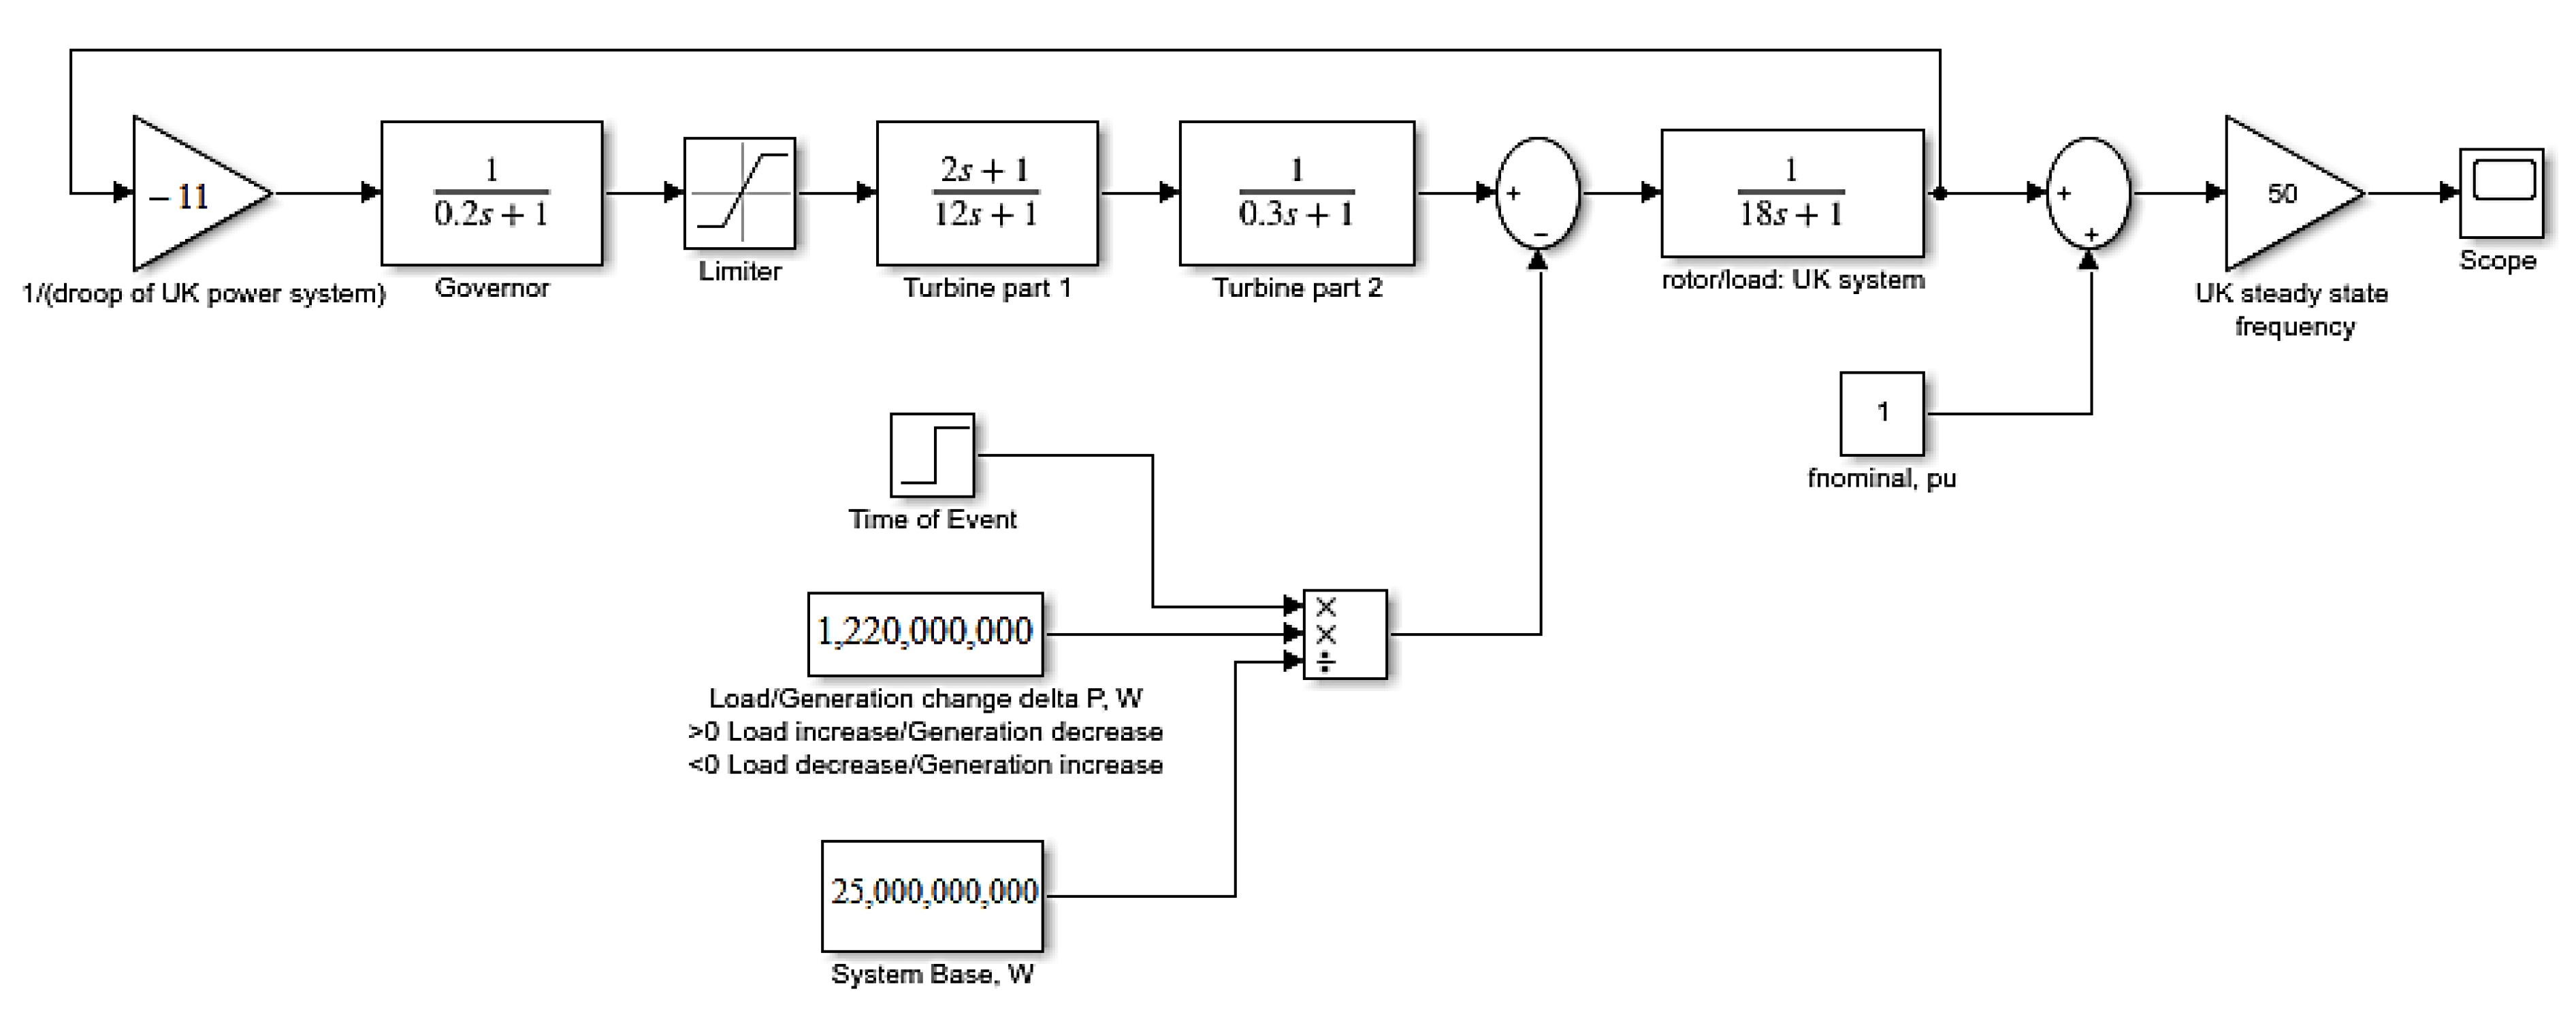
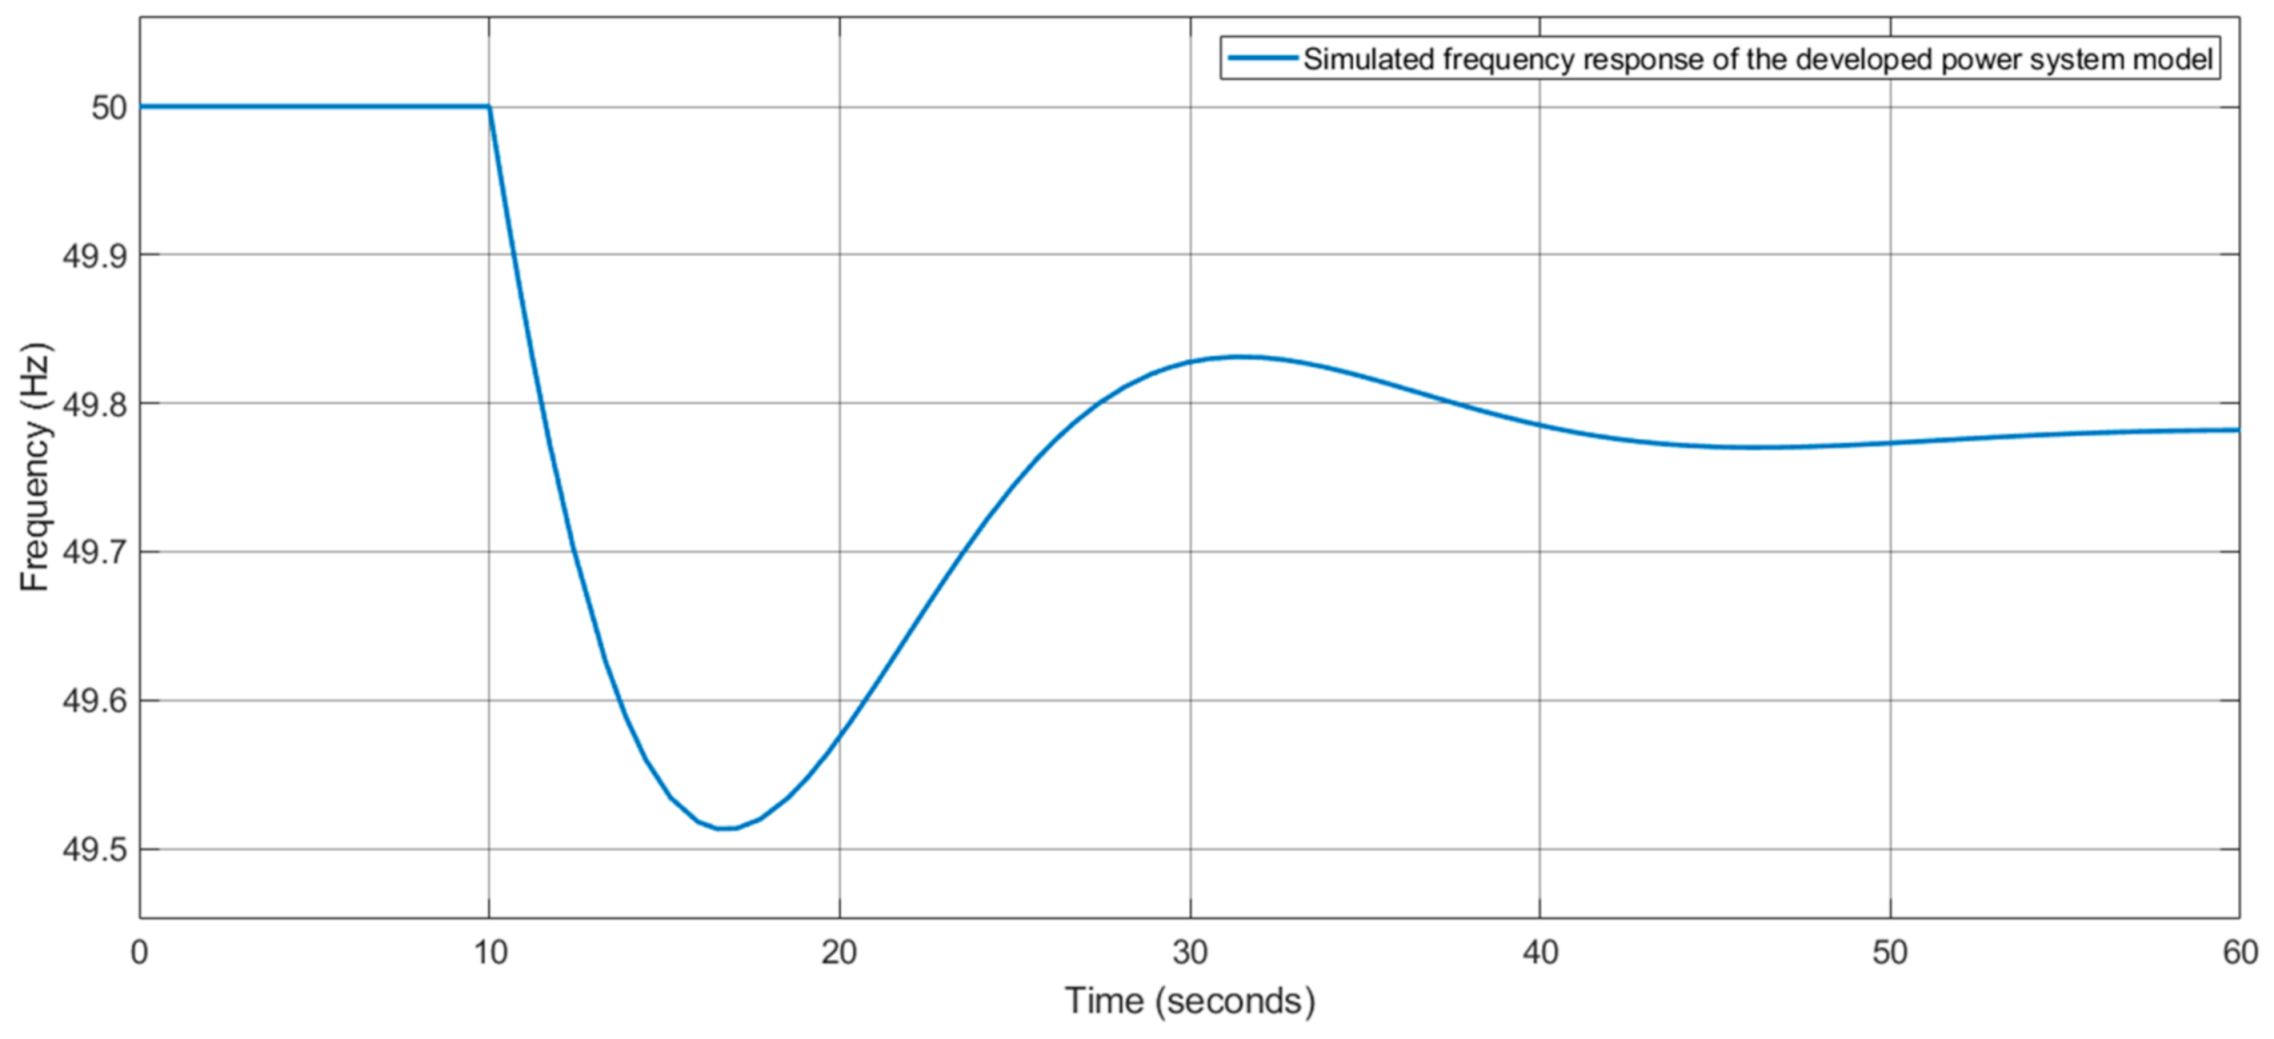
A SIMULINK model that has the capability to simulate and control various rates of primary frequency responses, via adjusting system parameters of the synchronous generator using first order transfer functions, is presented in Figure 7, incorporating the parameters given in Table 1 and Table 2, which are summarised in Table 3 below. These parameters incorporated a generation loss of a 1.22 GW, simulating a frequency drop event due to the loss of generation as presented in Figure 8. Comparing the simulated frequency response to the actual frequency event as shown in Figure 6, the parameters used have successfully achieved high resemblance between the actual frequency event and the simulated response of Figure 8, which provides a reasonable validation. By adjusting four parameters and incorporating a maximum allowable generation loss of a 1.32 GW with a system load base of 25 GW. The parameters that will be investigated are as follows:
- The effect of the systems inertia Heq.
- The effect of the governor droop setting Req.
- The effect of the load damping constant D.
- The effect of the high-pressure steam turbine power fraction (T1/T2).
The initial values of the parameters for the primary frequency response simulation of the power system model are presented in Table 4 below.
Pathak et al. [21] investigated the effect of parameters at different generation levels, for an automatic generation control AGC at 100% generation level, the appropriate steam turbine constant TT was found to be 0.2999 s. It was also concluded that the value for the governor steam turbine constant had less impact on the primary frequency response in comparison to the system inertia, the governor droop setting, load damping constant, and the high-pressure steam turbine power fraction. Therefore, in this research, the values for TT and TG will be kept constant at 0.3 and 0.2 s, respectively.
The UK Grid Code recommended that the governor droop setting Req between 3 and 5% [32]; therefore, the effect of the governor droop setting will be examined from 3% to 5%, at step increment of 0.5%. The load damping constant D will be examined from 0 to 3.0 p.u, at step increment of 0.5 p.u, while the effect of the high-pressure steam turbine power fraction T1/T2 will be examined from 0.2 to 0.6 at step increment of 0.1. Additionally, the effect of the systems inertia Heq will be examined at (3, 4.5, 6, and 9 s), corresponding to four different types of generation systems (Nuclear, Coal, Gas, and combined cycle gas turbine CCGT) as given in Table 2 above.
The impact of change of the main generation system parameters, systems inertia Heq, governor droop setting Req, load damping constant D, and the high-pressure steam turbine power fraction (T1/T2), are adapted to simulate the primary frequency response of the simplified power system model in order to examine and analyse how each of these parameter individually affects primary frequency system response in responding to the disturbance of a 1.32 GW generation loss on the UK power grid which occurs after 5 s from starting the simulation process.
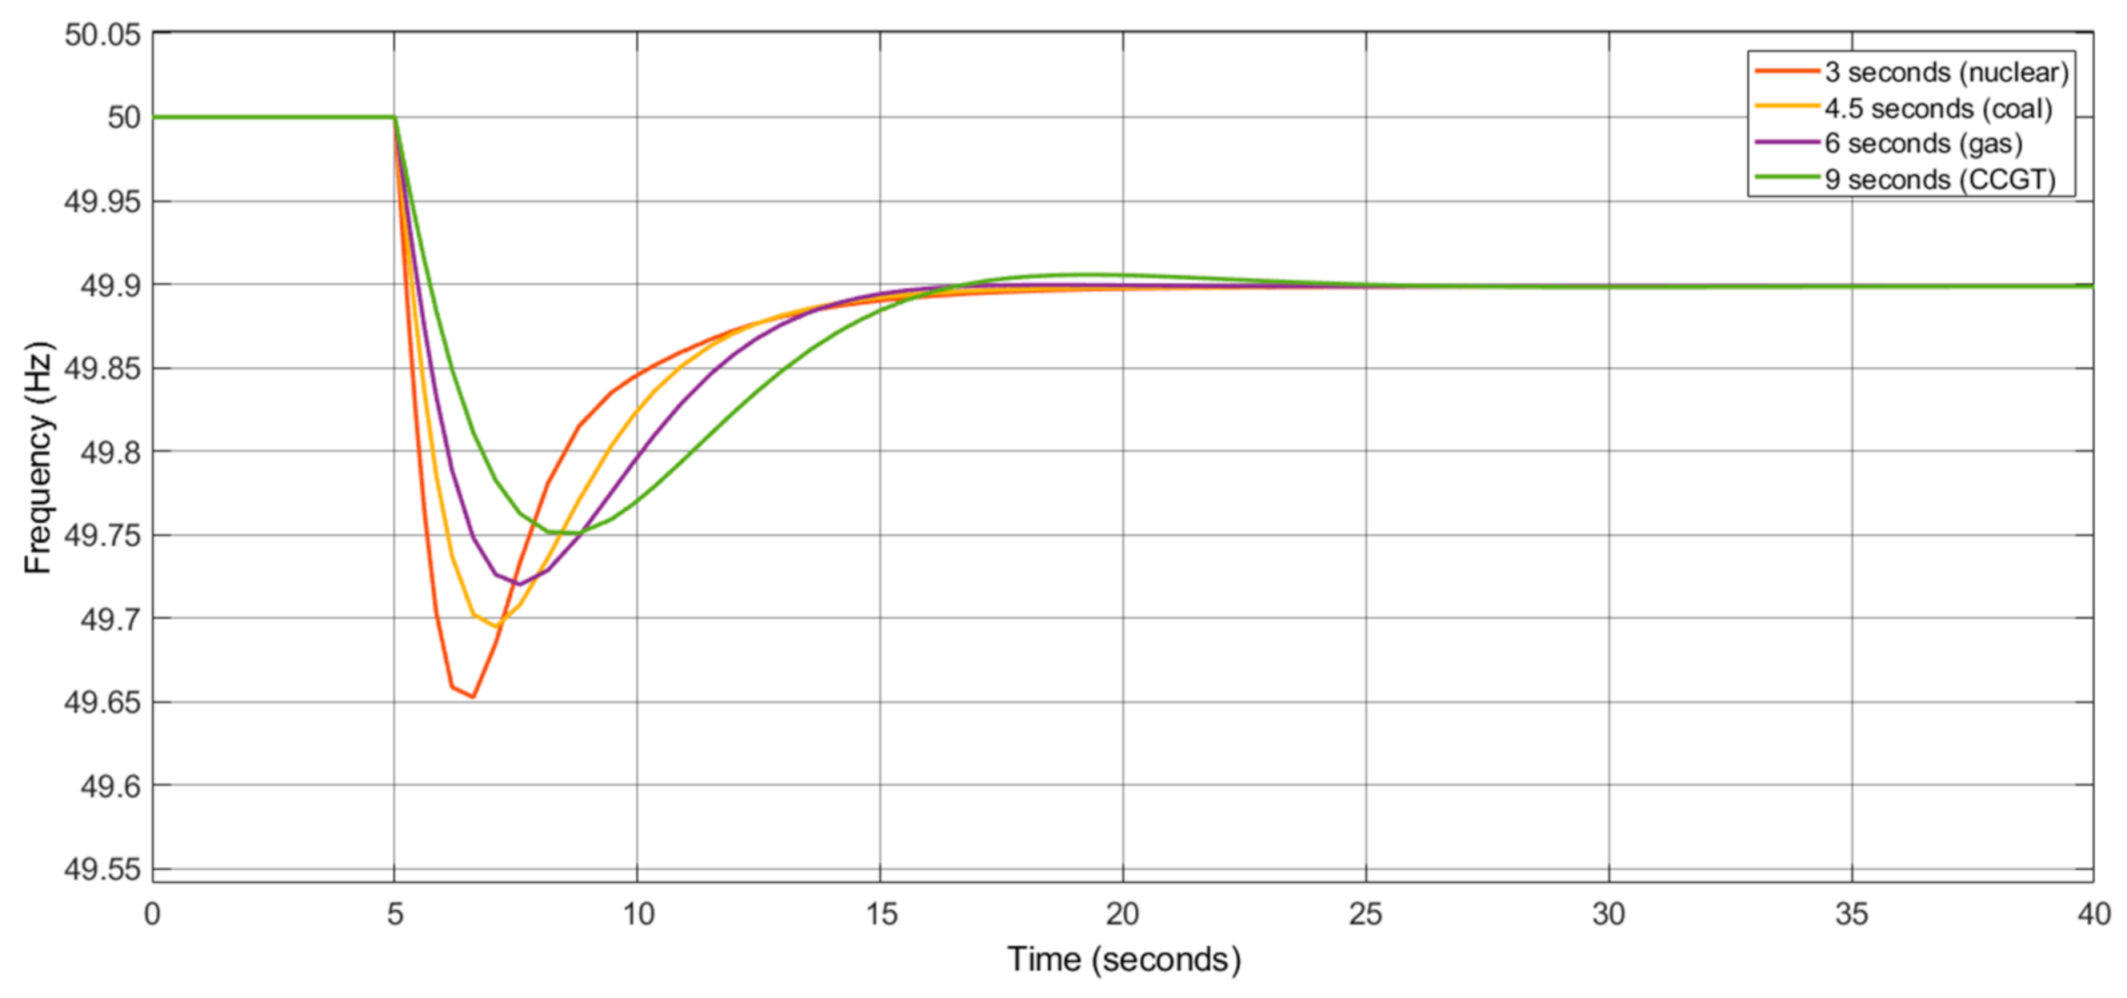
Figure 9 presents the impact of changes of the generation systems inertia Heq for four different types of generation systems (Nuclear, Coal, Gas, and CCGT) at 3, 4.5, 6, and 9 s, respectively, on the primary frequency response of the power system model. It is evident that the power system inertia has a direct effect of the initial slope for various Heq values. The inertia constant has a dominant effect on most of the system response measures, this is observed in Equation (3) above, where the response outcome is determined by the angular velocity of the shaft output wm and the load damping constant D. The increase in the system inertia results in a more gradual frequency deviation response that has a lower maximum frequency drop, with a less responsive frequency output after the maximum frequency deviation occurrence. It is notable that the higher the system inertia value Heq, the less deviation is produced which will reduce the damaging impact to the system. Hence, the higher the inertia value, the more controlled the primary frequency response. Furthermore, the system inertia has no overall impact on the final steady state value of frequency, where all the response curves stabilise at 49.9 Hz. This means that the systems inertia only affects the primary frequency response and does not affect the secondary response. It is also interesting to observe from the model shown in Figure 5 that (1/2Heq) is only involved in the forward loop gain, while all other parameters are incorporated in the negative feedback loop. This is because a primary frequency response is governed by the kinetic energy of the generators obtained through the rotating shafts as given in Equation (1) above.
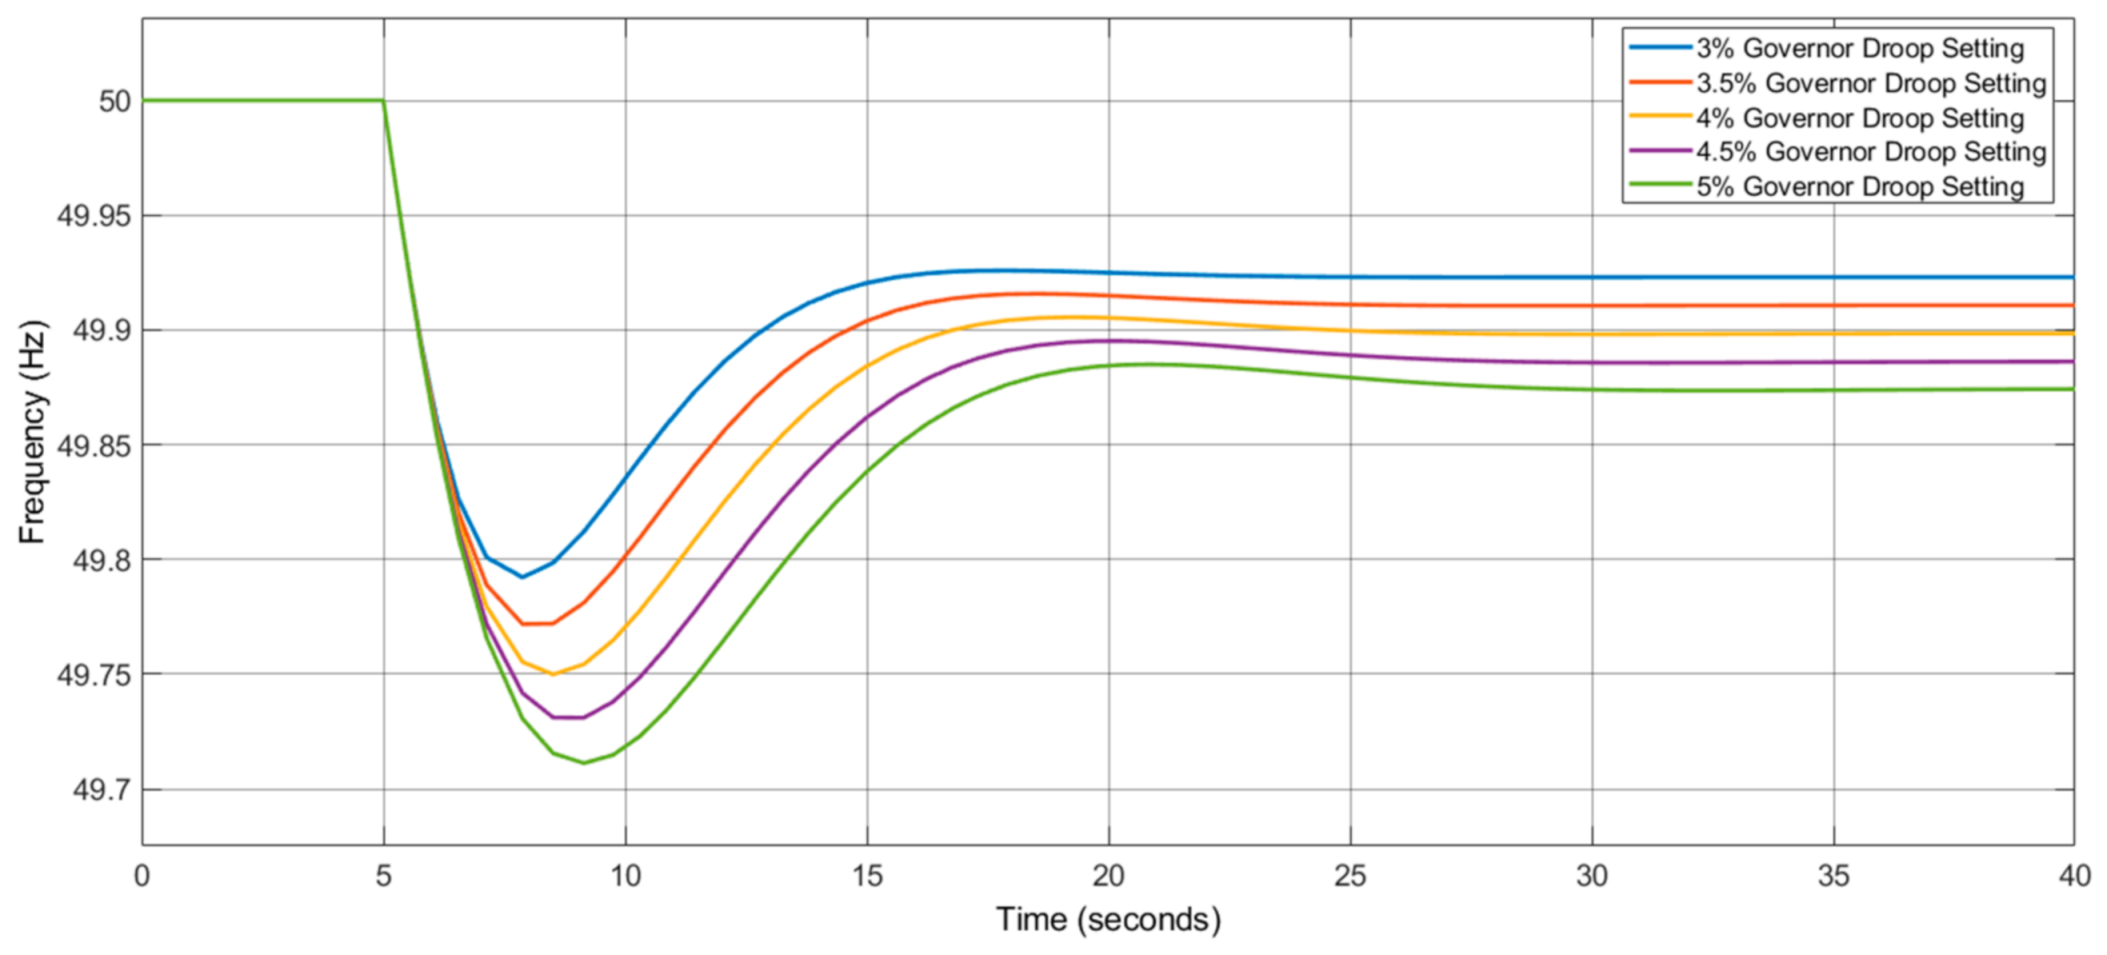
The impact of the governor droop setting Req that varies from 3% to 5% on the primary frequency response, is presented in Figure 10. It is assumed that Req is a composite governor speed-droop characteristic which relates to a combination of generating units with identical governor droop setting values. It is evident that the governor drop setting Req has no effect on the initial rate of the frequency drop before the peak frequency deviation, whilst dominantly affects the steady state frequency deviation which is associated in Equation (8) above. Therefore, for different levels of generation loss, the recovery rate will be dependent on the changes of the governor droop setting values. Thus, the higher drop setting value, the greater decline in frequency response.
The impact of the load damping constant D on the primary frequency response is presented in Figure 11. It is evident that the load damping constant has a direct effect on the maximum frequency deviation that occurs after a loss of generation, the higher the load damping constant, the smaller the frequency deviation decline, thus highly stable primary frequency response. Kundur et al. [10] reported that a value of 1.5 of damping constant would lead to a 1% change in the frequency which would result in a 1.5% change in the frequency sensitive load. This is noticeable in the response curves following the same trend but have been shifted higher up as the damping constant increased, as shown in of Figure 11. Therefore, a good estimation of 1.0 p.u. value for the load damping constant would provide a good response for the power system frequency.
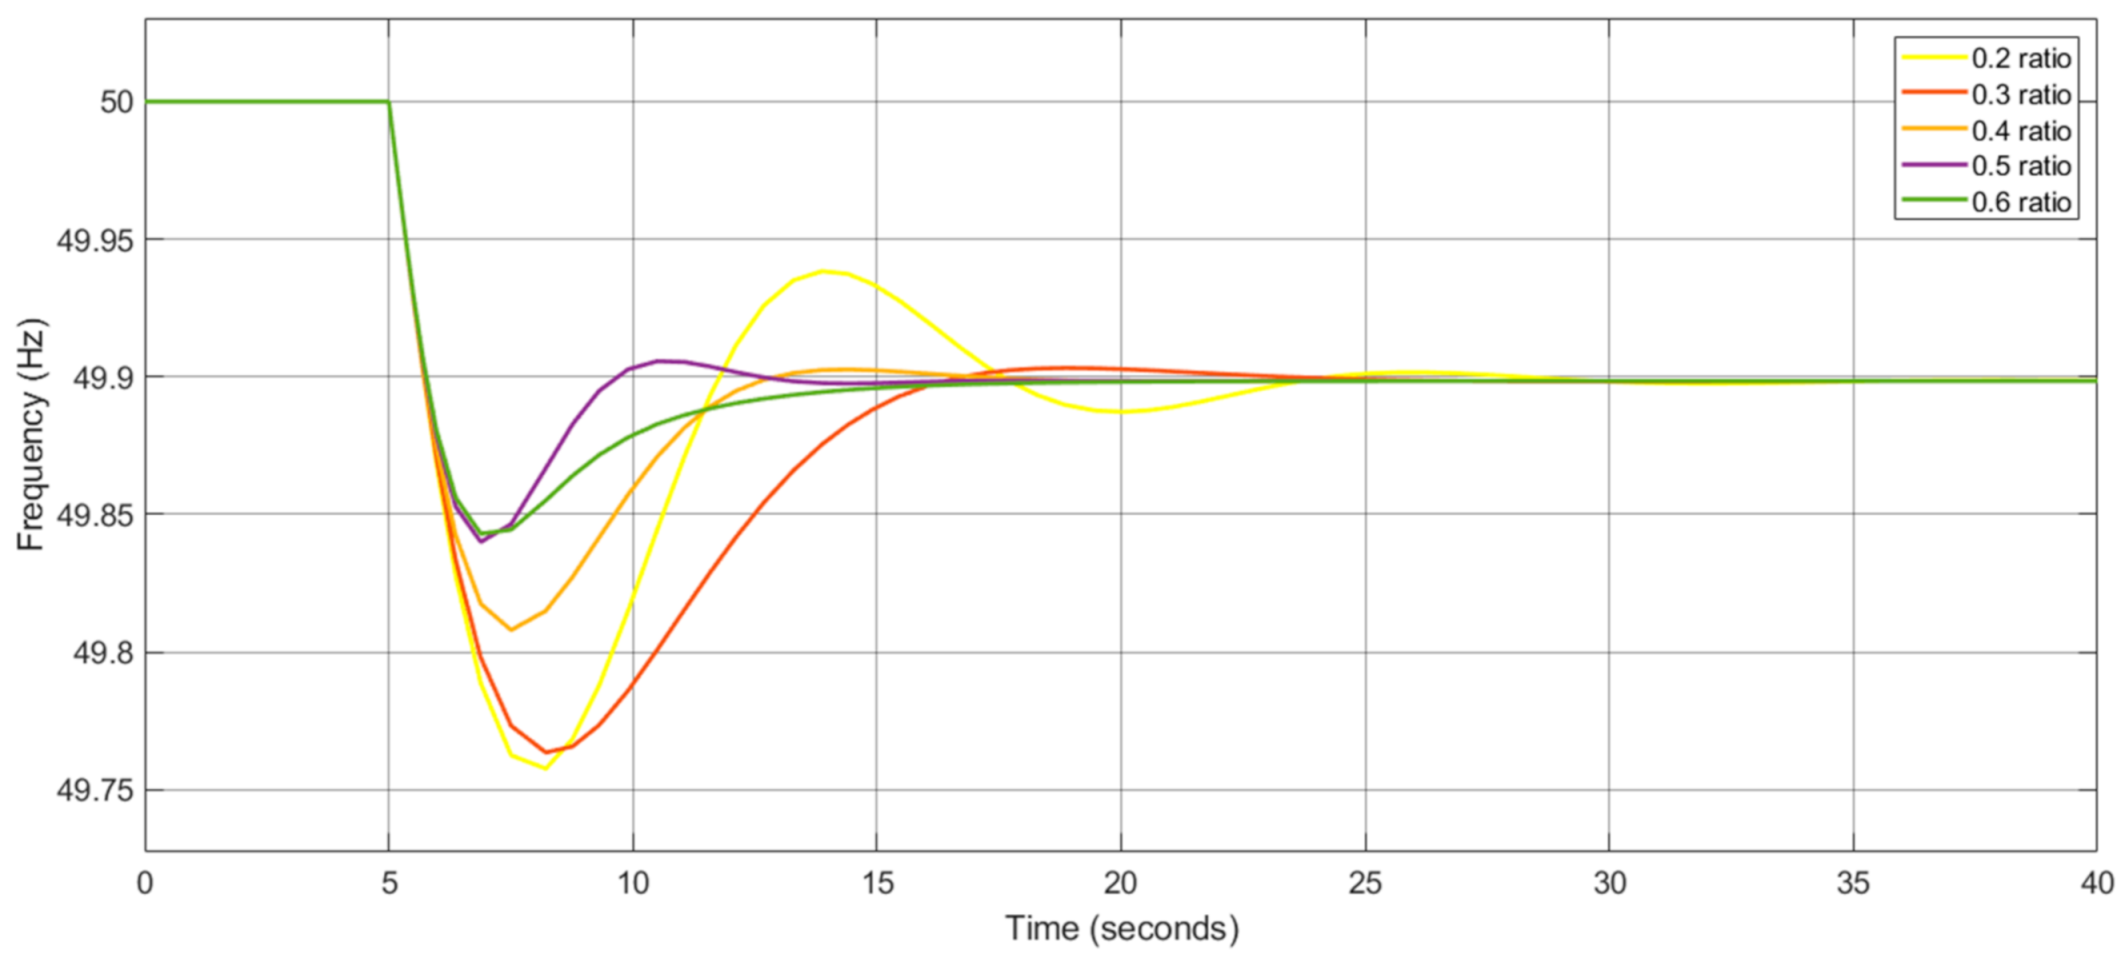
The impact of the high-pressure power fraction values (T1/T2) on the primary frequency response is presented in Figure 12. It is notable that high-pressure power fraction has a direct effect on the damping sensitivity of the system’s frequency restoration, the higher the power fraction ratio, the lower frequency deviation. However, for ratio values above 0.3, the frequency deviation peaks become overdamped, while for the values below 0.2, the frequency response of the system tends towards oscillation. The results presented by Pathak et al. [21] for investigating the effect of automatic generation control using varying steam turbine dynamic parameters, support the results of Figure 12. It was determined that the power fractions of the steam turbines varied with the generation schedule; the total power output was found to be 0.27 (27%) for high-pressure steam turbine power fraction, at 100% generation level. Additionally, for any values above 0.3 (30%), the time taken for frequency restoration was reduced. Comparing this to the simulation results presented in Figure 12, the values above 0.3 become overdamped and the restoration curve after the peak frequency deviation becomes less steep resulting in a longer time period for the frequency to reach normal working limits. Although, for values below 0.3 (e.g., 0.2), the response curve shows a greater transient oscillation behaviour which has a longer time period to reach steady-state frequency. Therefore, a trade of between reducing the peak frequency deviation and the transient oscillation behaviour must be considered in selecting the setting value for the high-pressure power fraction.
4. Conclusions
In this research, a simplified power system model was developed to examine the impact of change of the main generation system parameters, systems inertia Heq, governor droop setting Req, load damping constant D, and the high-pressure steam turbine power fraction (T1/T2), on the primary frequency response in responding to the disturbance of a 1.32 GW generation loss on the UK power grid, which occurs after 5 s from starting the simulation. A SIMULINK model that simulates various rates of primary frequency responses via adjusting system parameters of the synchronous generators to enable the controlled generators providing a fast-reliable primary frequency response within 10 s after a loss of generation, was presented.
It is noticed that the higher the system inertia value Heq, the less deviation is produced which will reduce the damaging impact to the system. Hence, the higher the inertia value the more controlled the primary frequency response. Furthermore, the system inertia has no overall impact on the final steady state value of frequency, where all the response curves stabilise at 49.9 Hz. This means that the systems inertia only affects the primary frequency response and does not affect the secondary response.
It is evident that the governor drop setting Req has no effect on the initial rate of the frequency drop before the peak frequency deviation. Whilst the higher drop setting value, the greater deviation in frequency response. Thus, for different levels of generation loss, the recovery rate will be dependent on the changes of the governor droop setting values. It is evident that the load damping constant D has a direct effect on the maximum frequency deviation that occurs after a loss of generation, the higher the load damping constant, the smaller the frequency deviation decline, thus highly stable primary frequency response. Whilst, the high-pressure power fraction (T1/T2) has a direct effect on the damping sensitivity of the system’s frequency restoration, the higher the power fraction ratio, the lower frequency deviation. It is concluded that the most dominant parameters that caused the most effective primary frequency response is the systems inertia, while the next dominant parameter is the governor droop setting. Where the systems inertia value is dependent on the generator type, the most effective generator constant was found to be the closed-cycle gas turbine HCCGT where the system inertial effect decelerates the rate of change of the frequency decline. While the governor droop setting relates to the steady-state frequency regulation, this parameter is dependent on the loss of load, governor droop setting and the systems damping constant. By comparing these findings to similar studies identified within this paper, the findings highlight the crucial role the power system parameters have on the primary frequency response. While other studies incorporate measures to increase the primary frequency response by using external techniques such as using firm frequency response and aggregating power from refrigeration or battery systems, this paper compares the parameters within the power system without any external measures and highlights which parameter settings achieve greatest impact on the primary frequency response. Moreover, the proposed model offers a fundamental basis for a further investigation to be carried on how a power system will react during a secondary frequency response. A secondary feedback loop can be incorporated to provide a secondary frequency response that restores the system frequency to nominal level.
Author Contributions
J.A. contributed to this paper through conducting the relevant literature survey, building the model, examining and analysing the relevant involved parameters and visualising the results. While I.M.A. was responsible in supervising and directing the research activities and also drafting and revising the content of this paper. All authors have read and agreed to the published version of the manuscript.
Funding
There is no fund in conducting this research.
Institutional Review Board Statement
This research was conducted by the authors in the school of Engineering—University of Lincoln, as a partial fulfilment for the degree of MEng in Mechanical Engineering (Power and Energy).
Informed Consent Statement
This paper demonstrates the effect of the primary frequency response and the internal parameters of various generation systems on the frequency stability of the power system, UK grid as a case study. The impact of the loss of generation on the frequency stability in responding to the demand side response has been investigated.
Data Availability Statement
The authors declare that all the relevant data and results are solely presented in this paper, and no further data is available to be provided for the potential researchers.
Conflicts of Interest
The authors declare that they have no known competing financial interests or personal relationships that could have appeared to influence the work reported in this paper.
Nomenclature
| Symbol | Parameter Description | Unit |
| D | Load damping constant | |
| f | Frequency | Hz |
| Heq | The equivalent angular inertia constant of the generator | |
| n | Number of poles of the generator | |
| P | Electrical power | Watts |
| R | Governor droop setting of the generator | |
| T | The governor-turbine generation setting | |
| T1/T2 | The high-pressure power fraction of the turbine | |
| Te | Electrical power output of the generator | Watts |
| Tm | Mechanical torque output of the generator | |
| w | Rotational speed of synchronous machines | rad/s |
| wm | Speed shaft of the turbine | rad/s |
| ∆f | The change of the system frequency | Hz |
| ∆Pe | The changes of the electrical power of the generator | Watts |
| ∆Pm | The changes of the mechanical ∆Pm of the generator | J/s |
References
- Abdulraheem, B.S.; Gan, C.K. Power system frequency stability and control: Survey. Int. J. Appl. Eng. Res. 2016, 11, 5688–5695. [Google Scholar]
- Dahal, S.; Mithulananthan, N.; Saha, T. Investigation of Small Signal Stability of A Renewable Energy Based Electricity Distribution System. In Proceedings of the IEEE PES General Meeting, Minneapolis, MN, USA, 25–29 July 2010; IEEE: Piscataway, NJ, USA, 2010; pp. 1–8. [Google Scholar]
- Meegahapola, L.; Flynn, D. Impact on Transient and Frequency Stability for A Power System at Very High Wind Penetration. In Proceedings of the IEEE PES General Meeting, Minneapolis, MN, USA, 25 July 2010; IEEE: Piscataway, NJ, USA, 2010; pp. 1–8. [Google Scholar]
- Qazi, H.W.; Flynn, D. Analysing the impact of large-scale decentralised demand side response on frequency stability. Int. J. Electr. Power Energy Syst. 2016, 80, 1–9. [Google Scholar] [CrossRef]
- Kirby, B.J.; Dyer, J.; Martinez, C.; Shoureshi, R.A.; Guttromson, R.; Dagle, J. Frequency Control Concerns in the North. American Electric Power System; United States Department of Energy: Washington, DC, USA, 2003. [Google Scholar]
- Wood, A.J.; Wollenberg, B.F.; Sheblé, G.B. Power Generation, Operation and Control; John Wiley & Sons: Hoboken, NJ, USA, 2013. [Google Scholar]
- Kerahroudi, S.K. Development of Novel Operational Stability Control Systems for Embedded High Voltage DC Links; Brunel University London: London, UK, 2015. [Google Scholar]
- Kundur, P.; Paserba, J.; Ajjarapu, V.; Andersson, G.; Bose, A.; Canizares, C.; Hatziargyriou, N.; Hill, D.; Stankovic, A.; Taylor, C. Definition and Classification of Power System Stability. IEEE Trans. Power Syst. 2004, 19, 1387–1401. [Google Scholar]
- Saleh, I.; Postnikov, A.; Bingham, C.; Bickerton, R.; Zolotas, A.; Pearson, S. Aggregated Power Profile of A Large Network of Refrigeration Compressors Following FFR DSR Events. In Proceedings of the International Conference on Energy Engineering and Smart Grids, Cambridge, UK, 25–26 June 2018. [Google Scholar]
- Kundur, P.; Balu, N.J.; Lauby, M.G. Power System Stability and Control; McGraw-Hill: New York, NY, USA, 1994. [Google Scholar]
- RENAC. Frequency and Voltage Regulation in Electrical Grids; Renewables Academy: Berlin, Germany, 2013. [Google Scholar]
- Force, C.T. Large Frequency Disturbances: Analysis and Modeling Needs. In Proceedings of the IEEE Power Engineering Society, New York, NY, USA, 31 January–4 February 1999; Volume 1, pp. 554–558. Available online: http://0-ieeexplore-ieee-org.brum.beds.ac.uk/stamp/stamp.jsp?tp=&arnumber=747514&isnumber=16105 (accessed on 19 April 2021).
- Sarma, S.M.; Tandel, S.S.; Ami, T.P. Literature Review on Transient Stability. Int. J. Sci. Res. Sci. Eng. Technol. 2015, 1, 45–51. [Google Scholar]
- Frunt, J. Analysis of Balancing Requirements in Future Sustainable and Reliable Power Systems; TU Eindh: Eindhoven, The Netherlands, 2011. [Google Scholar]
- Teng, M.A.F.; Pudjianto, D.; Strbac, G. Benefits of Demand-Side Response in Providing Frequency Response Service in the Future GB Power System. Front. Energy Res. 2015, 3, 36. [Google Scholar] [CrossRef]
- Rand, F. DSR 101-Understanding How Demand Side Reponse Works and How to Participate. Energy Live News. Available online: https://www.energylivenews.com/2018/09/13/dsr-101-understanding-how-demand-side-response-works-and-how-to-participate/ (accessed on 19 April 2021).
- Zin, A.M.; Hafiz, H.M.; Wong, W. Static and Dynamic Under-Frequency Load Shedding: A comparison. In Proceedings of the2004 International Conference on Power System Technology PowerCon 2004, Singapore, 21–24 November 2004; IEEE: Piscataway, NJ, USA, 2004; Volume 1, pp. 941–945. [Google Scholar]
- Muhssin, M.T.; Cipcigan, L.M.; Sami, S.S.; Obaid, Z.A. Potential of demand side response aggregation for the stabilization of the grids frequency. Appl. Energy 2018, 220, 643–656. [Google Scholar] [CrossRef]
- N.G.ESO. Freqeuncy Response Services. Available online: https://www.nationalgrideso.com/industry-information/balancing-services/frequency-response-services (accessed on 24 April 2020).
- Saleh, I.M.; Postnikov, A.; Arsene, C.; Zolotas, A.C.; Bingham, C.; Bickerton, R.; Pearson, S. Impact of demand side response on a commercial retail refrigeration system. Energies 2018, 11, 371. [Google Scholar] [CrossRef] [Green Version]
- Pathak, N.; Verma, A.; Bhatti, T.S. Automatic generation control of thermal power system under varying steam turbine dynamic model parameters based on generation schedules of the plants. J. Eng. 2016, 2016, 302–314. [Google Scholar] [CrossRef]
- Postnikov, A.; Albayati, I.; Pearson, S.; Bingham, C.; Bickerton, R.; Zolotas, A. Facilitating static firm frequency response with aggregated networks of commercial food refrigeration systems. Appl. Energy 2019, 251, 113357. [Google Scholar] [CrossRef]
- Albayati, I.M.; Postnikov, A.; Pearson, S.; Bickerton, R.; Zolotas, A.; Bingham, C. Power and energy analysis for a commercial retail refrigeration system responding to a static demand side response. Int. J. Electr. Power Energy Syst. 2020, 117, 105645. [Google Scholar] [CrossRef]
- Cheng, M.; Wu, J.; Ekanayake, J.; Coleman, T.; Hung, W.; Jenkins, N. Primary Frequency Response in the Great Britain Power System from Dynamically Controlled Refrigerators. In Proceedings of the the 22nd International Conference on Electricity Distribution, Stockholm, Sweden, 10–13 June 2013. [Google Scholar]
- Cheng, M.; Sami, S.S.; Wu, J. Benefits of using virtual energy storage system for power system frequency response. Appl. Energy 2017, 194, 376–385. [Google Scholar] [CrossRef] [Green Version]
- Johnson, P. Technical Requirement and Despatch of Frequency Response Power Reserve Services. In Proceedings of the IEE Colloquium on Economic Provision of a Frequency Responsive Power Reserve Service, London, UK, 5 February 1998; IET: London, UK, 1998; p. 1. [Google Scholar]
- Glover, J.D.; Sarma, M.S.; Overbye, T.J. Power System Analysis and Design; Brooks/Cole: Pacific Grove, CA, USA, 2002. [Google Scholar]
- Vittal, V.; McCalley, J.D.; Anderson, P.M.; Fouad, A. Power System Control and Stability; John Wiley & Sons: Hoboken, NJ, USA, 2019. [Google Scholar]
- Bevrani, H. Robust Power System Frequency Control; Springer: Berlin/Heidelberg, Germany, 2009. [Google Scholar]
- Bopp, T.A. Technical and Commercial Integration of Distributed and Renewable Energy Sources into Existing Electricity Networks; University of Manchester: Manchester, UK, 2006. [Google Scholar]
- N.Grid. UK Gas and Electricity Transmission. UK Future Energy Scenar. 2014. Available online: Fes.nationalgrid.com/media/1298/2014-fes.pdf (accessed on 19 April 2021).
- The Grid Code, No. 5. Available online: https://www.nationalgrideso.com/document/34131/download (accessed on 19 April 2021).
- Wu, X.; Jenkins, N.; Strbac, G.; Watson, J.; Mitchell, C. Integrating Renewables and CHP into the UK Electricity System; Tyndall Centre for Climate Change Research: Norwich, UK, 2004. [Google Scholar]
Figure 1.
A typical frequency response rate to a disturbance identifying primary and secondary response rates (Reprinted with permission from ref. [20]. Copyright 2018 MDPI).
Figure 1.
A typical frequency response rate to a disturbance identifying primary and secondary response rates (Reprinted with permission from ref. [20]. Copyright 2018 MDPI).

Figure 2.
Block diagram of a synchronous generator (Reprinted with permission from ref. [27]).
Figure 2.
Block diagram of a synchronous generator (Reprinted with permission from ref. [27]).

Figure 3.
A simplified model for frequency control, through the analysis of equivalent inertia constant and load damping constant.
Figure 3.
A simplified model for frequency control, through the analysis of equivalent inertia constant and load damping constant.

Figure 4.
Governor-turbine transfer function.

Figure 5.
A generic turbine-governor power system model.

Figure 6.
An actual frequency event occurred on the NG power system on 15 August 1995 (Reprinted with permission from ref. [33]).
Figure 6.
An actual frequency event occurred on the NG power system on 15 August 1995 (Reprinted with permission from ref. [33]).

Figure 7.
Simplified equivalent-generator system SIMULINK model.

Figure 8.
Simulated frequency response of the developed power system model incorporated a loss of 1.22 GW of power generation at a 25 GW base load.
Figure 8.
Simulated frequency response of the developed power system model incorporated a loss of 1.22 GW of power generation at a 25 GW base load.

Figure 9.
Impact of the changes of systems inertia on the primary frequency response.

Figure 10.
Impact of the governor droop setting on the primary frequency response.

Figure 11.
Impact of the load damping constant on the primary frequency response.

Figure 12.
Impact of the high-pressure power fraction on the primary frequency response.


Table 1.
Frequency containment policy of the UK National Grid.
| Frequency Deviation | Conditions |
|---|---|
| ±0.2 Hz | Normal operation limit for an allowable maximum frequency variation for loses ≤±300 MW. |
| ±0.5 Hz | Significant operation limit for an allowable maximum frequency variation for losses >±300 MW but ≤±1000 MW. |
| −0.8 Hz | Major operation limit for an allowable maximum frequency variation for loses >1000 MW but ≤1320 MW, restoration to 49.5 Hz must be achieved within 1 min. |
| >−0.8 Hz | Emergency operational limit when the loss of generation is >1320 MW or when the frequency falls below 49 Hz. Frequency values in this category results in load shedding or complete grid shutdown. |
Table 2.
Different generation systems with respective inertia constants.
| Hgenerator | Hnuclear | Hcoal | Hgas | HCCGT |
|---|---|---|---|---|
| Value (s) | 3 | 4.5 | 6 | 9 |
Table 3.
Summarised parameters for the developed power system model.
| 1/Req (MW/Hz) | TG (s) | T1 (s) | T2 (s) | TT (s) | D (p.u.) | Heq (s) |
|---|---|---|---|---|---|---|
| 11 | 0.2 | 2 | 12 | 0.3 | 1 | 9 |
Table 4.
Initial values of the parameters for the primary frequency response simulation of the power system model.
Table 4.
Initial values of the parameters for the primary frequency response simulation of the power system model.
| Parameters | T1/T2 | D (p.u.) | TG (s) | TT (s) | Heq (s) | Req (Hz/MW) |
|---|---|---|---|---|---|---|
| Values | 0.27 | 1.0 | 0.2 | 0.3 | 9 | 0.04 |
Publisher’s Note: MDPI stays neutral with regard to jurisdictional claims in published maps and institutional affiliations. |
© 2021 by the authors. Licensee MDPI, Basel, Switzerland. This article is an open access article distributed under the terms and conditions of the Creative Commons Attribution (CC BY) license (https://creativecommons.org/licenses/by/4.0/).
Share and Cite
MDPI and ACS Style
Atkinson, J.; Albayati, I.M. Impact of the Generation System Parameters on the Frequency Response of the Power System: A UK Grid Case Study. Electricity 2021, 2, 143-157. https://0-doi-org.brum.beds.ac.uk/10.3390/electricity2020009
AMA Style
Atkinson J, Albayati IM. Impact of the Generation System Parameters on the Frequency Response of the Power System: A UK Grid Case Study. Electricity. 2021; 2(2):143-157. https://0-doi-org.brum.beds.ac.uk/10.3390/electricity2020009
Chicago/Turabian StyleAtkinson, Jovi, and Ibrahim M. Albayati. 2021. "Impact of the Generation System Parameters on the Frequency Response of the Power System: A UK Grid Case Study" Electricity 2, no. 2: 143-157. https://0-doi-org.brum.beds.ac.uk/10.3390/electricity2020009