
Electrolytic Reduction of Titanium Dioxide in Molten LiCl–Li2O


1
Department of Chemical & Biological Engineering, University of Idaho (Idaho Falls), 995 MK Simpson Blvd., Idaho Falls, ID 83401, USA
2
Department of Chemical Engineering, Kansas State University, Manhattan, KS 66506, USA
3
Idaho National Laboratory, Idaho Falls, ID 83401, USA
*
Author to whom correspondence should be addressed.
Electrochem 2021, 2(2), 224-235; https://0-doi-org.brum.beds.ac.uk/10.3390/electrochem2020016
Submission received: 8 March 2021
/
Revised: 23 April 2021
/
Accepted: 23 April 2021
/
Published: 27 April 2021
(This article belongs to the Collection Feature Papers in Electrochemistry)
Abstract
:The electrolytic reduction of TiO2 in LiCl–Li2O (1 wt.%) at 650 °C was investigated under a series of cathodic reduction potentials and applied charges to provide a mechanistic understanding of the electrochemical characteristics of the system. The optimal cathodic reduction potential was determined as being −0.3 V vs. Li/Li+. Li2TiO3 and LiTiO2 were structurally identified as intermediate and partial reduction products of the TiO2 electrolytic reduction. The reduction of LiTiO2 was extremely slow and reversible due to its high stability and the detrimental effect of Li2O accumulation within the solid particles. The most reduced product obtained in this study was LiTiO2, which was achieved when using 150% of the theoretical charge under the optimal reduction potential. The highest reduction extent obtained in this study was 25%. Based on theoretical DFT modeling, a detailed multistep reduction mechanism and scheme were proposed for TiO2 electrolytic reduction in LiCl–Li2O (1 wt.%) at 650 °C.

1. Introduction
Titanates and titanium metal are valuable for batteries, coatings, and structural material applications [1,2,3,4]. Electrolytic reduction is a promising way for Ti metal and intermediates production directly from solid titanium dioxide through molten salt electrolysis. It has attracted extensive research effort that involves using various salt systems under various conditions with different setups [5,6,7,8,9]. The Fray–Farthing–Chen (FFC) Cambridge and calciothermic Ono–Suzuki (OS) processes are the two most well-studied processes utilizing CaCl2 (melting point 772 °C) as electrolytes for electrolytic reduction between 850 and 950 °C. As an alternative electrolyte, LiCl can significantly decrease the reduction temperature to 650 °C for the electrolytic reduction of metal oxides due to its lower melting point [10,11,12]. The FFC process presumes that TiO2 is reduced directly in CaCl2 via electrons through multiple titanate intermediates, including CaTiO3 and CaTi2O4, as well as titanium suboxides (TiOx, x < 2) [13,14,15,16]. Through the OS process, TiO2 is reduced using in-situ-generated calcium metal from the CaCl2 electrolyte at an overpotential when the applied potential is higher than the electrolyte decomposition potential [7,8,9,17,18]. Similarly, the reduction of TiO2 in LiCl leads to the formation of lithium titanates, including LiTiO2 and Li2TiO4 when the reduction potential is lower than the LiCl decomposition potential, that is, an underpotential. The complete reduction of TiO2 to Ti is obtained at high cell potentials [10,19,20]. Regarding the electrolytic reduction of TiO2 in molten LiCl–Li2O, the oxides Li2TiO4, LiTiO2, and suboxides have been identified using XRD and TEM under various temperatures and potentials (Table 1) [10,19,20,21]. Li2TiO3 was reported based on cyclic voltammetry (CV) results.
However, the TiO2 reduction mechanism in LiCl is not as well understood as in CaCl2. The reduction pathways and mechanism of TiO2 in LiCl have mostly been studied using two-electrode electrochemical cells. It is unclear whether the underpotential (lower than the electrolyte decomposition potential) or overpotential electrolytic reduction was employed under these conditions [10,22,23]. To elucidate the TiO2 electrolytic reduction mechanism in LiCl, this work systematically investigated the electrolytic reduction of TiO2 in LiCl–Li2O (1 wt.%) at 650 °C using a three-electrode electrolysis cell by directly controlling the cathodic reduction potential under a series of applied charges. Reduction intermediates and products were analyzed and quantified using X-ray diffraction (XRD) with Rietveld refinement analysis. The CV and chronoamperometry techniques, combined with density functional theory (DFT) calculations, were employed to obtain a detailed understanding of the TiO2 reduction characteristics and mechanisms in the LiCl–Li2O system.
2. Materials and Methods
A molten salt mixture, namely, LiCl–Li2O (1 wt.%), for TiO2 electrolytic reduction was made of ultra-high-grade lithium chloride (LiCl, 99.995% metals basis, ultra-dry, Alfa Aesar, Tewksbury, MA, USA) and lithium oxide (Li2O, 99.5%, Alfa Aesar), which was used as received. Titanium dioxide powders (Rutile TiO2, 99.995% metals basis, Alfa Aesar) were pelletized, grounded, and sieved between mesh 60 and 20 (particle sizes 0.25~0.85 mm). A total of 2.0 g of TiO2 pellets were loaded in a basket for each TiO2 reduction run immersed in a 150 g electrolyte salt bath at 650 °C.
A three-electrode electrochemical cell located in an argon glovebox (MBraun, Labmaster 200G, Stratham, NH, USA) with controlled moisture and oxygen levels (<1 ppm) was used for the electrochemical measurement and TiO2 electrolytic reductions. The three-electrode electrochemical cell was composed of a working electrode, a Ni/NiO reference electrode, and a glassy carbon crucible, which was also used as the counter electrode (HTW GAZ30). VersaSTAT 4 Potentiostat (Princeton Applied Research, Oak Ridge, TN, USA), which interfaced with the glovebox, was employed for the electrochemistry measurement and electrolysis up to 2 amps using VersaStudio for controlling the parameters and for data acquisition. A Kerrlab electric furnace (Auto Electro Melt Maxi, Orange, CA, USA) was used to keep the electrolyte salt bath at 650 °C. This three-electrode electrochemical cell setup has shown high efficiency and reliability in a previous study for NiO electrolytic reduction [24].
Cyclic voltammetry (CV) was measured in the LiCl–Li2O (1 wt.%) salts at 650 °C to determine the Li deposition potential () at a scan rate of 20 mV s−1 using a Ni/NiO reference electrode and a 0.64 mm diameter stainless steel wire as the working electrode. A cathode basket assembly described in a previous work was used for the TiO2 electrolytic reductions [24]. Briefly, the cathode basket assembly included a 1.59 mm diameter stainless steel rod as an electron collector and a stainless-steel cathode basket (height: 2.5 cm, diameter: 1 cm) made of double layers of 100 mesh stainless steel wire cloth, and the TiO2 pellets were loaded and packed around the electron collector. The whole electrode assembly was soaked in the molten salt for 1~1.5 h before the electrolytic reduction started. Various cathodic reduction potentials, including −0.2 V, −0.3 V, and −0.4 V vs. Li/Li+ were applied on TiO2, respectively, using 80% of the theoretical charge (i.e., the theoretical charge for the complete reduction of TiO2 to Ti). The constant reduction potential was applied at an interval mode (the cell spent 8 min on and 2 min off) to minimize the excessive lithium metal generated on the working electrode. Higher theoretical charges, namely 130% and 150%, were also investigated for the TiO2 reduction at the optimal potential, which was determined as being −0.3 V vs. Li/Li+ in this study for further investigation. After the TiO2 reductions, the electrode bundles were lifted out of the molten salt and cooled down to room temperature for further treatment and product analysis. To determine the starting composition for the electrolytic reduction, a soaking test was performed by immersing the TiO2 in the LiCl–Li2O (1 wt.%) salt at 650 °C for 5 h without electrolysis.
The cooled cathode basket assemblies were transferred out of the glovebox and rinsed with nanopure water to remove the extra LiCl–Li2O salts. Then, the samples were retrieved out of the basket and rinsed in acetone for a quick dry. After that, the samples were kept vacuum dried at room temperature overnight. The completely dried samples were ground into fine powders using a pestle and mortar for the X-ray diffraction analysis (Rigaku SmartLab XRD, Wilmington, MA, USA, Cu Kα radiation at 40 kV and 30 mA). The scan range (2θ) was from 10° to 80° at 4 deg min−1. The XRD data were analyzed with Rietveld refinement using WPPF (whole powder pattern fitting) within PDXL 2 (Rigaku) for quantitative compositional analysis.
In this study, reduction intermediates, including Li2TiO3 and LiTiO2, were identified and quantified, but LiTiO2 was the only partial reduction product for TiO2. Theoretically, the charge transfer for the reduction of TiO2 to LiTiO2 is 1, while the charge transfer for the reduction of TiO2 to Ti is 4. The reduction extent of TiO2 is defined as given in Equation (1):
The total applied charge is represented as a percentage of the theoretical charge, which for the complete reduction of TiO2 to Ti metal is given as Equation (2):
where m is the number of moles of TiO2, and F is the Faraday constant (96,485 C mol−1).
The Cottrell equation was employed to estimate the oxygen ion diffusion coefficients (D) during the TiO2 electrolytic reduction using the chronoamperometry technique. The oxygen ion diffusion coefficients were calculated based on the I(t) data fit using Equation (3):
where I is the decay current during the cell-on interval, n is the number of electrons transferred (n = 2), A is the surface area of the working electrode, C0 is the initial concentration of oxygen ions, and t is the time in seconds.
3. Density Function Theory Modeling
Density function theory (DFT) modeling provides theoretical understanding that can be used to determine the TiO2 reduction pathway and mechanism. Vienna Ab Initio Simulation Package (VASP) (Vienna, Austria) was used for the DFT calculation [25]. The Gibbs free energy of formation for titanate intermediates, such as Li2TiO3 and LiTiO2, were calculated. The calculations of the total energies and structural relaxations were carried out using the projector augmented wave (PAW) method to model the core electrons (see the Supplementary Materials) [26]. The Helmholtz free energy, F(V,T), which is a function of both crystal volume (V) and temperature (T), can be expressed using Equation (4):
where E(V) is the total energy. Fvib (V,T) and Fel (V,T) represent the vibrational and thermal electronic contributions to the free energy, respectively. The E(V) of a given crystal can be described using the equation of state (EOS), and its values at different volumes were directly obtained from periodic DFT calculations. Here, the fourth-order Birch–Murnaghan (BM4) EOS, as expressed by Equation (5), was used:
4. Results and Discussion
4.1. Soaking Test for TiO2
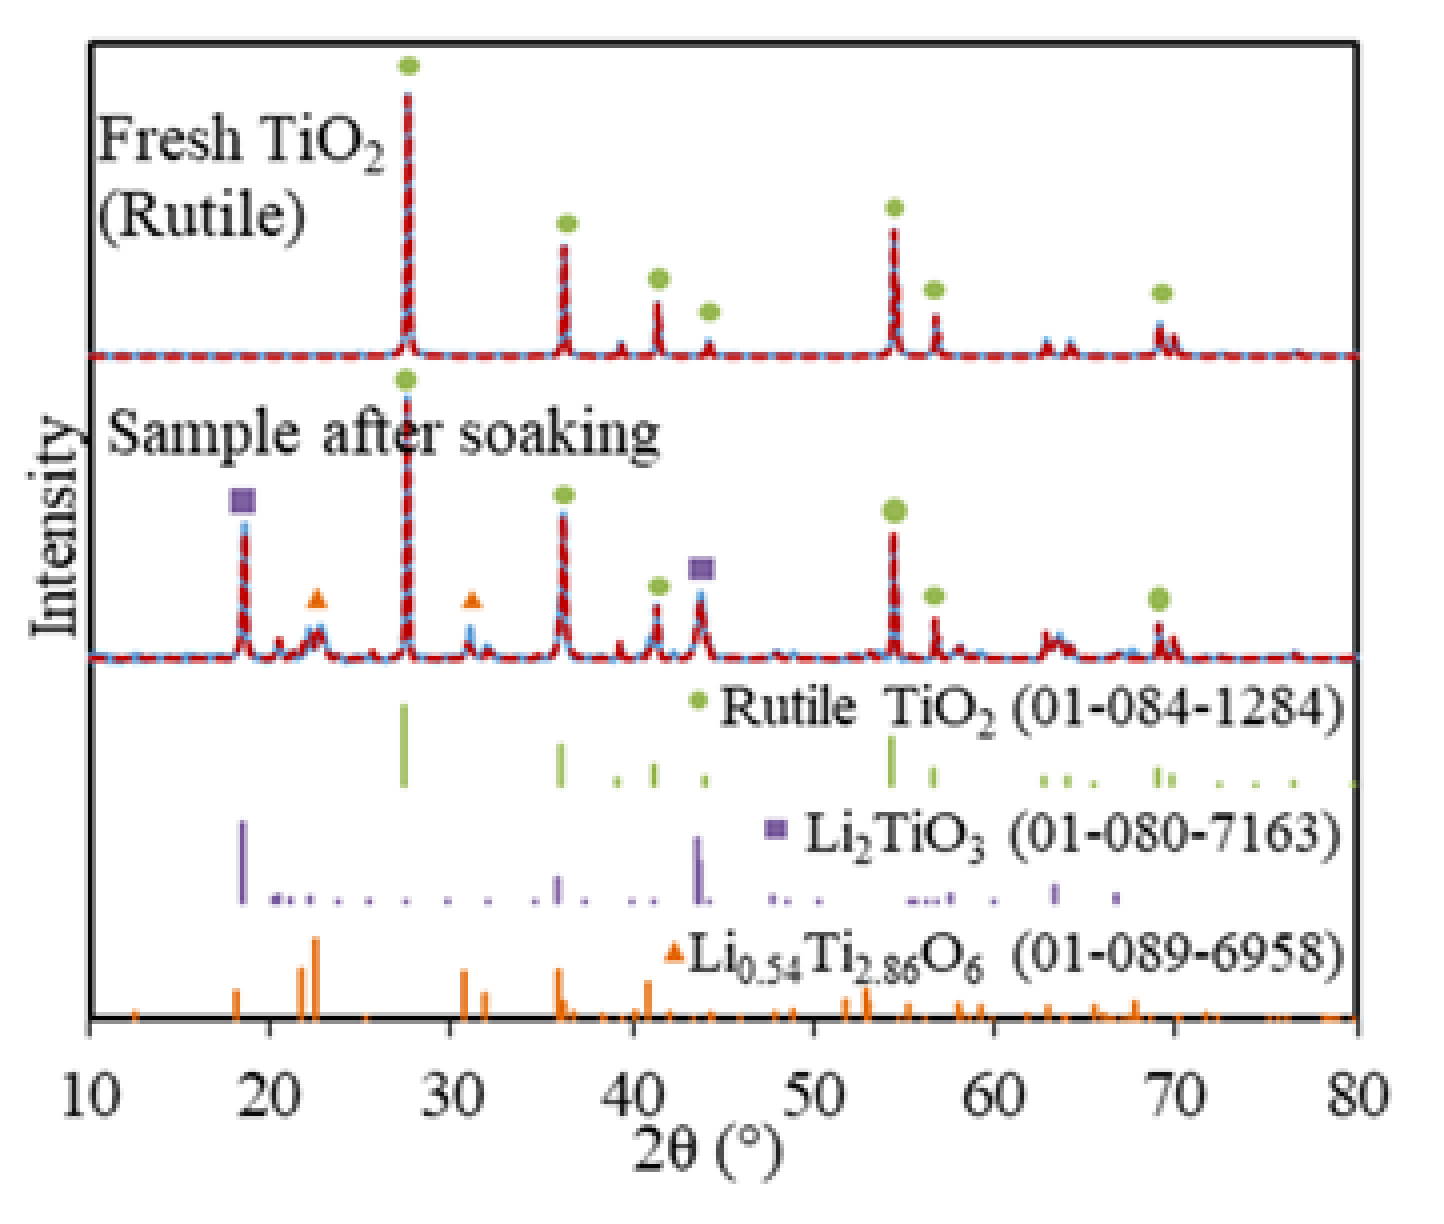
Soaking is a routine step for the electrolytic reduction of metal oxides and spent oxide fuels, which allows time for the system to reach stability and for salts to diffuse into the metal oxides matrix before the lithium metal is formed [11,27,28]. The soaked TiO2 sample in LiCl–Li2O (1 wt.%) at 650 °C without electrolysis consisted of three phases, namely, 60.8 wt.% of TiO2, 38 wt.% of Li2TiO3, and 1.2 wt.% of Li0.54Ti2.86O6, based on the XRD analysis (Figure 1). The Li2TiO3 must be formed chemically via the insertion of Li2O into TiO2 on the surface of TiO2 particles through Equation (6), which is analogous to the formation of perovskite CaTiO3 during the TiO2 reduction in calcium salt melt systems [13,14,15,23]. However, the formation of Li2TiO3 is spontaneous in LiCl–Li2O (1 wt.%) at 650 °C, while the formation of CaTiO3 is slow and regarded as the rate-limiting step for the FFC process [6].
A total of 60.8 wt.% of TiO2 remained after 5 h of soaking, which suggested that the diffusion of Li+ and O2− ions through the increasing thickness of the Li2TiO3 layer had slowed down. The minor Li0.54Ti2.86O6 phase also indicated that Li2O non-stoichiometrically reacted with the bulk TiO2 phase, possibly because only a very small portion of the Li2O reached the fresh TiO2 core due to the slow diffusion through the surface of the Li2TiO3 layer. This was the first time that the Li2TiO3 phase was structurally identified for the TiO2 electrolytic reduction in LiCl salts, which was previously reported only based on the CV measurement of TiO2 in molten LiCl (Table 1) [21].
4.2. Effect of the Reduction Potential on the Electrolytic TiO2 Reduction
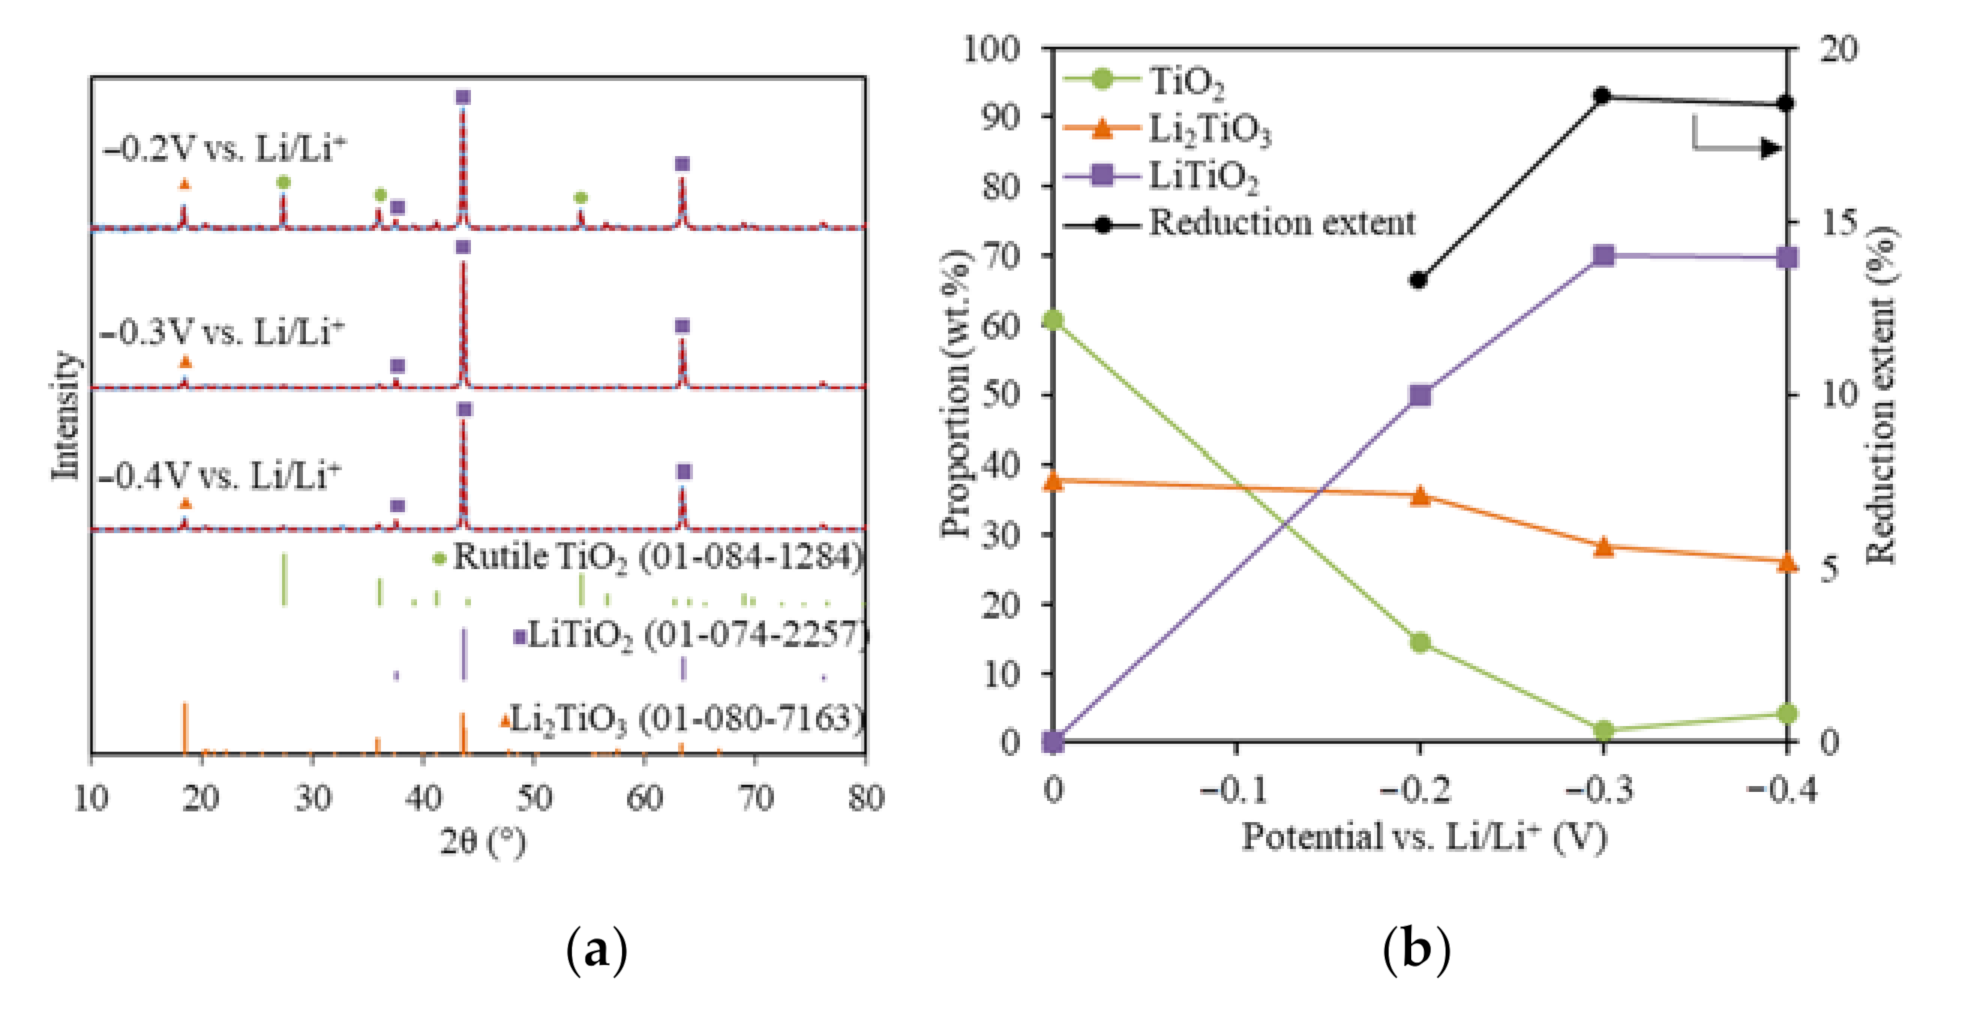
To understand the effect of the reduction potential on the TiO2 electrolytic reduction, various cathodic potentials that were controlled directly using the reference electrode were applied for the TiO2 reduction in LiCl–Li2O (1 wt.%) at 650 °C using 80% of the theoretical charge. The lithium deposition potential was determined at −1.75 V vs. Ni/NiO, as discussed in a previous study [24]. Figure 2a shows the XRD results with Rietveld refinement analysis for TiO2 electrolytic reductions at cathodic potentials of −0.2 V, −0.3 V, and −0.4 V vs. Li/Li+. For all three reduced samples, three phases were identified, including unreacted TiO2, Li2TiO3, and LiTiO2 compared with the standard XRDs (Figure 2a). No other reduced product or metallic Ti was detected. Lithium titanates, including LiTiO2 and Li2TiO4, were reported for the TiO2 electrolytic reduction in LiCl salts under various conditions, but no Li2TiO4 was formed in this study [10,19,20,21]. The quantitative compositional results based on the Rietveld refinement analysis for the three samples reduced at different cathodic potentials were compared with the soaked only TiO2 sample (Figure 2b). Compared with the soaked only TiO2 sample, the unreacted TiO2 content at −0.2 V decreased from 60.8 to 14.5 wt.%, while Li2TiO3 remained at a similar level around 35.7 wt.%. The partial reduction product LiTiO2 accounted for 49.8 wt.%. These results indicate that TiO2 may have been directly reduced to LiTiO2 by the in-situ-generated Li metal at −0.2 V vs. Li/Li+ (Equation (7)).
The TiO2 content further decreased to 1.69 wt.% at −0.3 V, which lay under the XRD detection limit (~2%). The Li2TiO3 decreased from 35.7 to 28.3%, while the partial reduction product, LiTiO2, increased from 49.8 to 70.4%. This suggested that both Li2TiO3 and TiO2 were transformed into LiTiO2 at a higher reduction potential (Equation (8)) and TiO2 was more reducible than Li2TiO3. The reduction of Li2TiO3 to LiTiO2 is a reversible reaction [29,30]. As the cathodic reduction potential further increased to −0.4 V vs. Li/Li+, LiTiO2 stayed almost the same, while both TiO2 and Li2TiO3 only changed slightly within the XRD limit.
Increasing the cathodic reduction potential could promote the TiO2 electrolytic reduction to LiTiO2 to a certain extent, then it started to reduce the current efficiency. A previous study also showed that a high Li metal concentration impeded the O2− diffusion and led to a lower reduction extent of Ti4+ [31]. A similar trend was also observed in CaO/CaCl2 for the TiO2 electrolytic reduction [13]. In this study, the highest achieved TiO2 reduction extent was 18.6% at −0.3 V vs. Li/Li+ using 80% of the theoretical charge (Figure 2b). The optimal reduction potential for TiO2 reduction in the LiCl–Li2O (1 wt.%) salt was determined as being −0.3 V vs. Li/Li+.
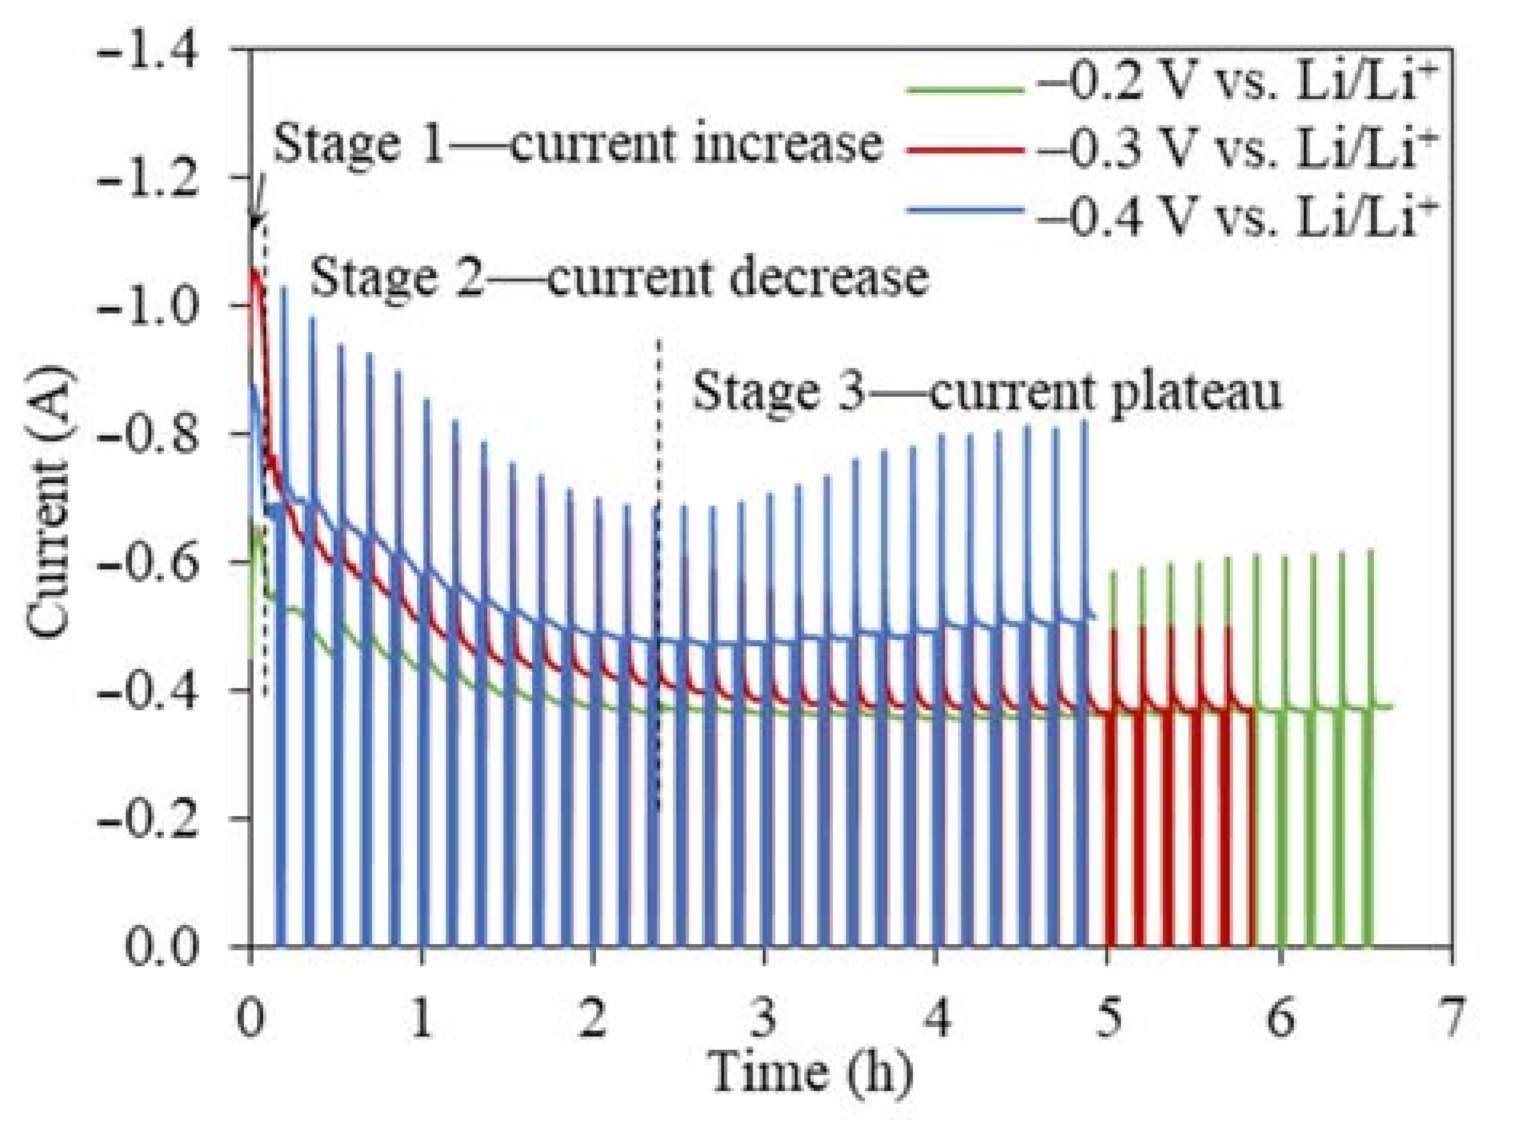
The I(t) curves for the TiO2 reduction at all three cathodic reduction potentials showed a similar three-stage pattern, namely, a sharp current peak in the very beginning (<20 min), a current decrease, and a steady stage remaining between 0.4 and 0.6 A (Figure 3). The I(t) curves for the TiO2 electrolytic reduction were significantly different from the I(t) curves for the NiO and Cr2O3 reductions, which showed high current plateaus for an extended time until the reduction finished [24,32,33]. The same interval operation mode was used in our previous NiO study to prevent the excessive accumulation of in-situ-generated Li metal [24]. The overall current magnitude increased when the reduction potential increased from −0.2 to −0.4 V (vs. Li/Li+), which decreased the experimental time for completing 80% of the theoretical charge for 2 g TiO2 from 6.5 to 5 h. The FFC process of TiO2 reduction also produced a similar I(t) profile [14,34]. The first stage of the current increase was attributed to the transformation of the insulator TiO2 to lithium titanate LiTiO2, which has a conductivity of 0.5 S cm−1 [35]. According to the three-phase interlines (three PIs) reaction mechanism, the conductive LiTiO2, insulator TiO2, and electrolyte LiCl can form three PIs [36,37,38]. As the three PIs expanded from contacting points to a large area, the charge transfer reactions occurring at the three PIs led to an increasing current flow [36]. With more LiTiO2 generated, the interline moved inward to the inside of the TiO2 core. The longer diffusion distance for the three PIs resulted in a sharp current decrease at the beginning of the second stage (Figure 3). When the current continued to decrease at a slower rate, the Li2TiO3 shell started being reduced to the more conductive LiTiO2 and three new PIs of LiTiO2|Li2TiO3|electrolyte were formed. The continuous propagation of the three newly formed three PIs increased the material transfer distance, leading to the continuously decreasing current. The following stage varied little with time (around 0.4 A), indicating that either the reaction at the three PIs was limited by the slow diffusion of reactive species or it had reached equilibrium. For the TiO2 electrolytic reduction at −0.2 V vs. Li/Li+, the final product still contained TiO2, while the Li2TiO3 remained the same, suggesting that the final charge transfer was more relevant with reactions at the three PIs of LiTiO2|TiO2|electrolyte, where the O2− diffusion coefficient was estimated as being 1.12 × 10⁻⁵ cm2 s−1. At −0.3 V and −0.4 V vs. Li/Li+, the reaction stopped at the reduction of Li2TiO3 at the three PIs of LiTiO2|Li2TiO3|electrolyte, where the O2− diffusion coefficients were estimated as being 1.46 × 10⁻⁶ cm2 s−1 and 1.68 × 10⁻⁵ cm2 s−1, respectively [21,36,37,38]. The I(t) curves of the TiO2 reduction were a clear indication of the multistep reaction mechanism, which was limited by the O2− diffusion from the three PIs to the bulk salts [13,15].
4.3. Effect of the Applied Charges on the TiO2 Reductions at −0.3 V vs. Li/Li+
Using 80% of the theoretical charge only led to an 18.6% reduction of TiO2. Thus, further investigation was carried out for TiO2 electrolytic reductions by employing increased charges, namely 130% and 150% of the theoretical charge, at the optimal cathodic potential, namely, −0.3 V vs. Li/Li+.
The XRD analysis showed that no metallic Ti was formed for the TiO2 electrolytic reduction when using 130% and 150% of the theoretical charge at −0.3 V vs. Li/Li+ (Figure 4a). The TiO2 reduction extent increased from 22.3 to 25% when using 130% and 150% of the theoretical charge, respectively; meanwhile, the 13.4 wt.% of Li2TiO3 was completely converted to LiTiO2 (Figure 4b). The 28.3 wt.% of Li2TiO3 remained under 80% of the theoretical charge and required 70% more of the theoretical charge to be reduced completely to LiTiO2, suggesting the passivation behavior and stability of Li2TiO3. Furthermore, the formation of Li2TiO3 in the soaking stage may have slowed down the reduction process in several ways: (1) Li2TiO3 slowed down the outward diffusion of O2− and (2) the reduction of Li2TiO3 was a reversible process, which could be controlled by the O2− concentration [21,39].
These results show that the TiO2 electrolytic reduction was very refractory, with LiTiO2 being the most reduced product using 150% of the theoretical charge within 9 h, which was most likely due to the stability of Li2TiO3 and LiTiO2. The sample geometry played an important role, as the adverse effect of Li2TiO3 and LiTiO2 on the TiO2 reduction is less pronounced in thin-film and fine powder TiO2 [10,32]. The FFC process also shows that the electrolytic reduction of TiO2 in CaCl2 was challenging with a current efficiency that was typically less than 20%, although the much higher temperatures are more kinetically favorable for electrolytic reduction [40]. For the FFC process, the major products obtained within 8 h were a mixture of TiO, CaTiO3, and CaTi2O4, and it took 120 h to completely reduce 8 g TiO2 to Ti in CaO/CaCl2 at 900 °C [14]. The electrochemical or chemical formation of various more thermodynamically stable perovskite phases as the intermediate products is one of the main problems contributing to the low current efficiency. The formation of lithium titanates is much easier and faster because the smaller Li+ ion leads to faster and deeper intercalation chemical reactions. However, LiTiO2 is more thermodynamically stable than LiCl [40].
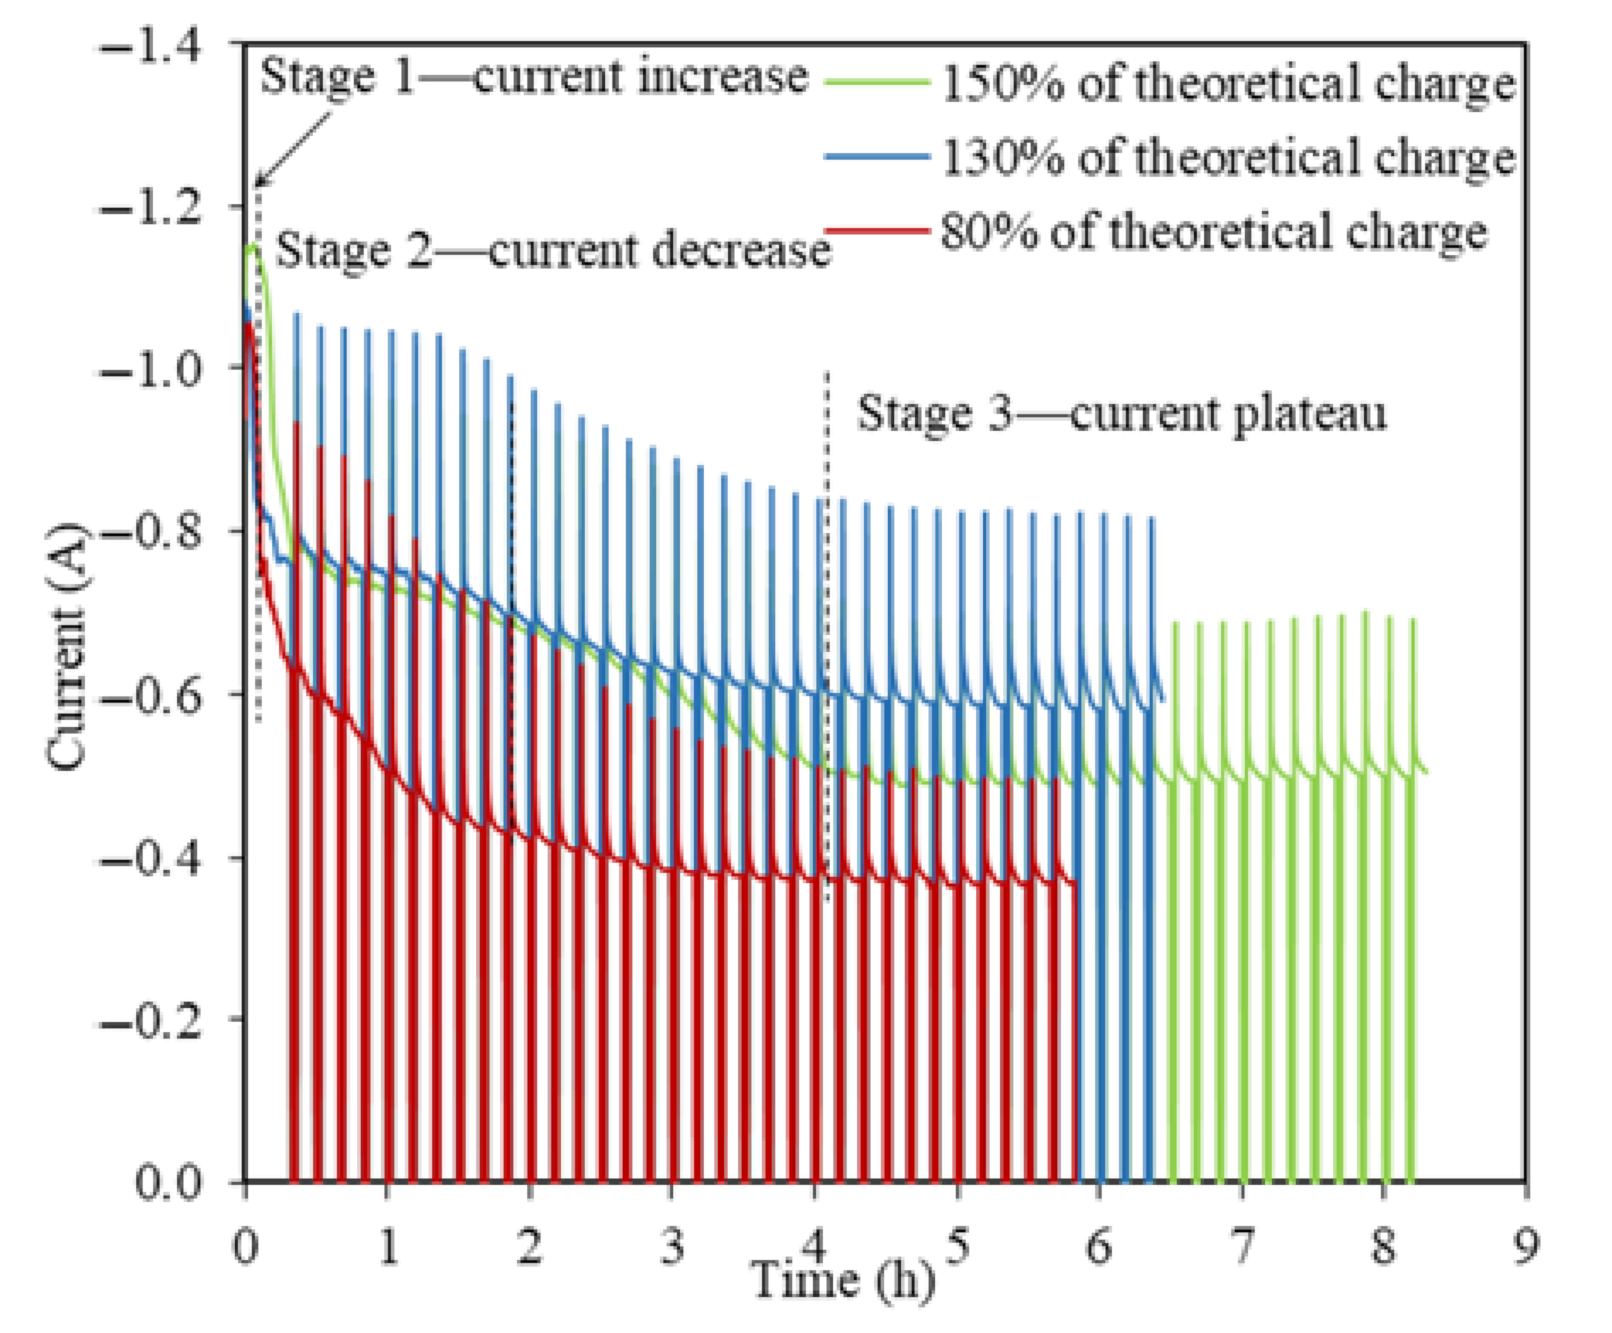
Similar I(t) profiles with a three-stage pattern are observed for TiO2 reductions at −0.3 V vs. Li/Li+ using 130% and 150% of the theoretical charge but with an extended time (Figure 5). It took 8.2 h to apply 150% of the theoretical charge as the longest experiment among all the TiO2 electrolytic tests in this study, with the highest reduction extent of 25% of 2 g TiO2. The steady stage reflects the final charge transfer for the conversion of Li2TiO3 at the three PIs of LiTiO2|Li2TiO3|electrolyte [21]. The O2− diffusion coefficient in the steady state for 130% and 150% of the theoretical charge were estimated as being 8.98 × 10⁻⁷ cm2 s−1 and 4.35 × 10⁻⁷ cm2 s−1, which were about one order smaller than that for the steady state when using 80% of the theoretical charge. The smaller O2− diffusion coefficients at higher theoretical charges indicates that the conversion of Li2TiO3 to LiTiO2 was very refractory in the steady stage, which explains the extended reduction process, and hence, the time taken.
4.4. TiO2 Reduction Mechanism
By employing a systematically controlled cathodic potential reduction and charges, reactions (6)–(8) were revealed and discussed for the TiO2 electrolytic reduction process.
The DFT modeling was calculated based on the optimized bulk structures of the relevant compounds, including Li and Ti (Table S2). Gibbs free energy changes for the possible reactions involved during the TiO2 reduction (Equations (6)–(13)) were calculated (Table 2).
The negative Gibbs free energy ∆G650 °C= −125 kJ mol−1 for the insertion reaction of Li2O to TiO2 indicates that the formation of Li2TiO3 was spontaneous at 650 °C (Equation (6)), which is consistent with the TiO2 soaking only testing result. The for the TiO2 reduction with Li metal was more negative than that for the reduction of Li2TiO3 with Li metal, suggesting that the reduction of TiO2 with Li was more favorable than Li2TiO3 (Equation (7) vs. Equation (8)). The remaining core of the TiO2 was most likely reduced to LiTiO2 before the Li2TiO3 shell reduction, which could be slowed down by the Li2TiO3 passivation layer. The unit cell volume of Li2TiO3 was three times as much as the one for TiO2, which not only reduced the pore volume for the transport of O2− ions but was more thermodynamically stable (Figure 6) [6,40]. The reduction of Li2TiO3 by the Li metal generated Li2O (Equation (8)), which needed to diffuse through the LiTiO2 layer to the bulk molten salts. The slow diffusion of O2− through the LiTiO2 layer led to the accumulation of trapped Li2O in the solid particle, which limited the reversible reduction of Li2TiO3. The further reduction of LiTiO2 by the Li metal also generated Li2O (Equation (9), ∆Gr = 0.8 kJ mol−1). The direct electrolytic reductions of Li2TiO3 and LiTiO2 were alternative pathways for the titanium dioxides’ reduction at underpotentials (Equations (12) and (13)), for which the Gibbs free energies were much higher. Both reduction pathways of LiTiO2 were most likely halted due to the high local Li2O concentration (Equations (9) and (13)), which became the key limiting step for further reduction and caused the extended time. The DFT analysis was consistent with the experimental TiO2 electrolytic reduction results obtained in this study showing that the LiTiO2 was the most reduced product achieved, even when using 150% of the theoretical charge. The passivation and refractory behaviors of LiTiO3 were witnessed for the electrolytic reduction of TiO2 in the LiCl molten salts using underpotentials before the formation of the Li metal [19,40].
By combining the experimental and DFT results, a three-step reaction mechanism for the TiO2 electrolytic reduction at overpotentials in the LiCl–Li2O (1 wt.%) salt at 650 °C was proposed for this study:
Step 1: ;
Step 2: ;
Step 3: (reversible).
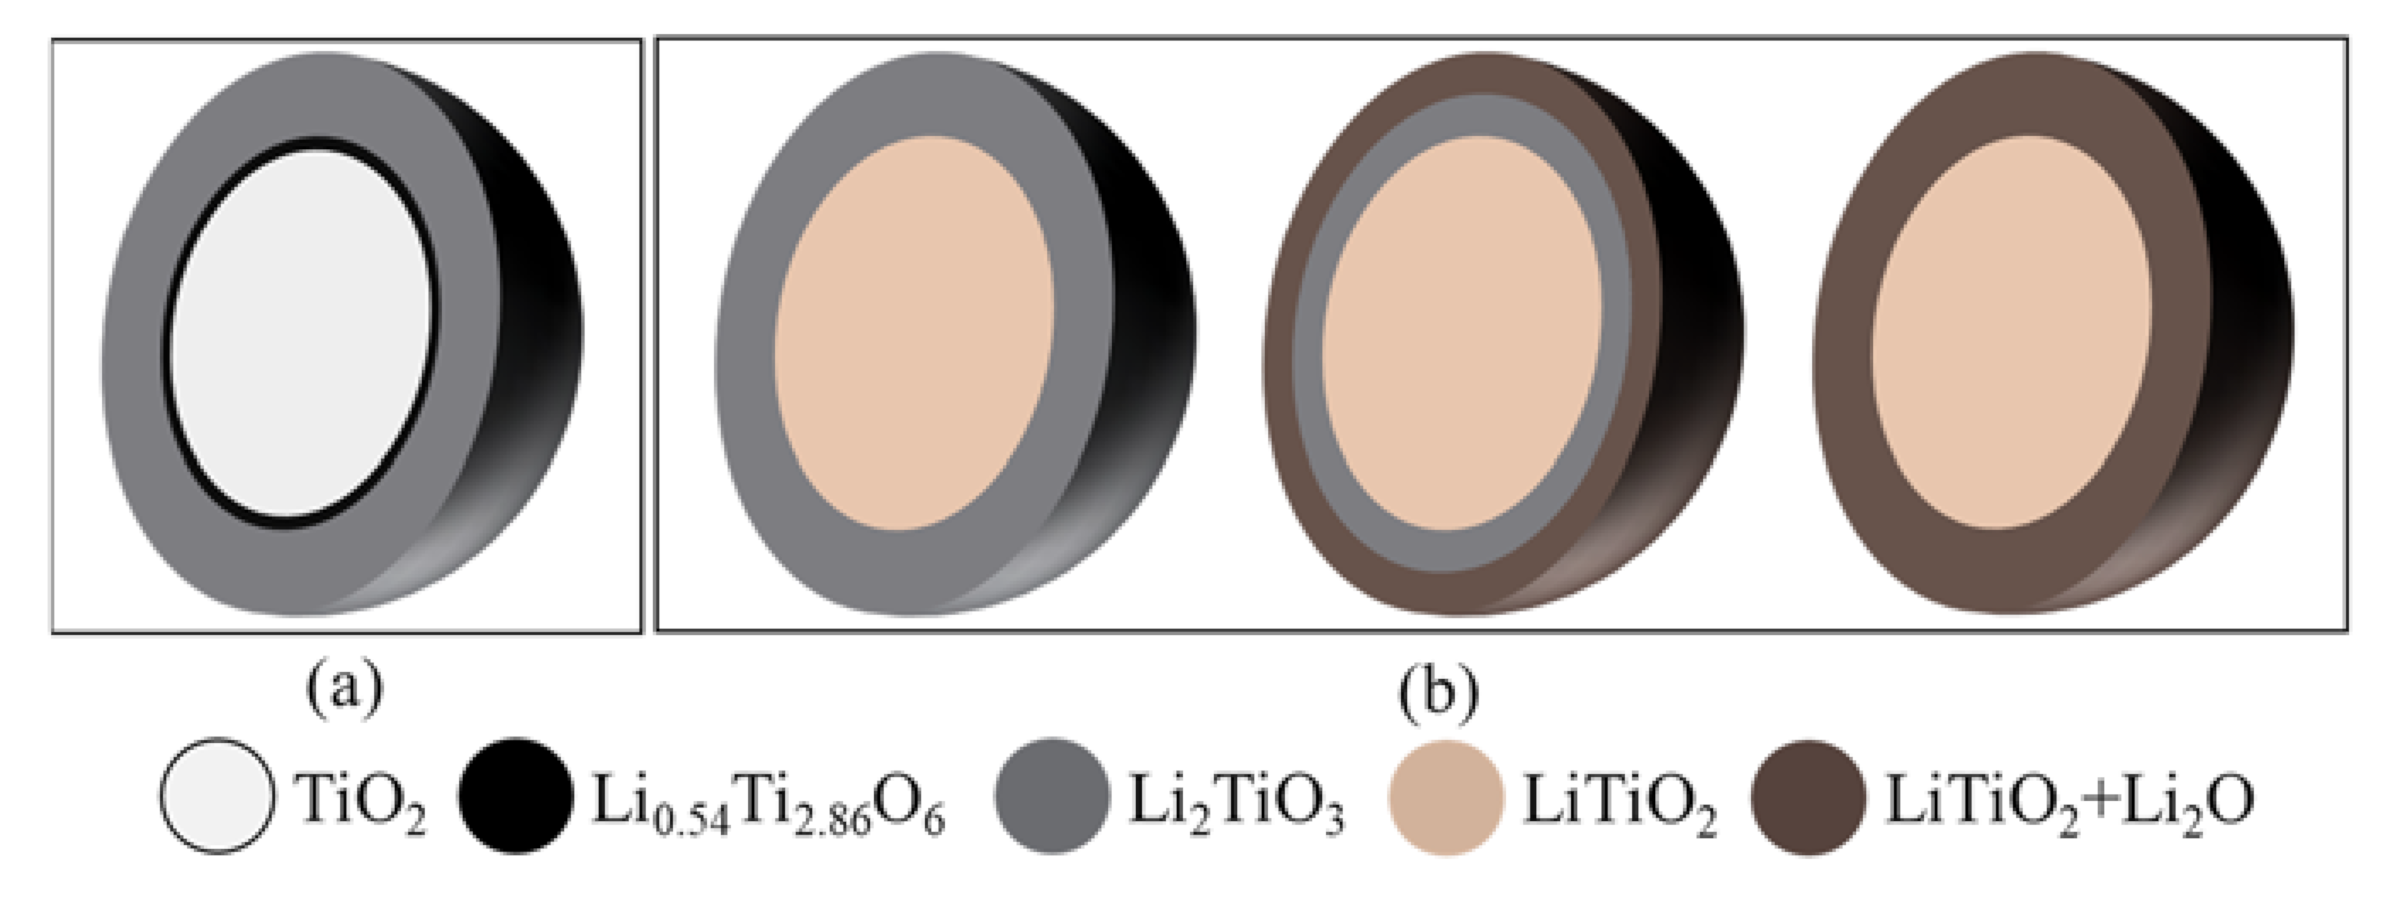
As illustrated in Figure 7, the soaking process followed a shrinking core mechanism, where the insertion of Li2O and TiO2 formed a stoichiometric Li2TiO3 layer on the external surface of the TiO2 particles [16]. The Li2TiO3 layer became thicker and slowed down the O2− diffusion, leading to unstoichiometric Li0.54Ti2.86O6 formation with the unreacted TiO2 core.
The Li2TiO3|TiO2|electrolyte interline initially formed on the surface of the oxide particle and gradually moved to the interior of the particle.
In the second step, the Li metal diffused through the Li2TiO3 and reduced the TiO2 core directly into LiTiO2. The three PIs of LiTiO2|TiO2|electrolyte were formed. The lithium metal continuously moved to the center of the TiO2 core until the core was fully converted to LiTiO2. This step was controlled by the Li diffusion through the Li2TiO3 and newly formed LiTiO2 layer. The second reaction also followed a shrinking-core model. When the TiO2 was completely reduced to LiTiO2, the Li2TiO3 shell started to be reduced to a mixture of LiTiO2 and Li2O, which was different from the inner LiTiO2 core. The reaction occurred at the external layer of Li2TiO3 and formed a new three PIs of Li2O+LiTiO2|Li2TiO3| electrolyte. It stopped when the interline approached the LiTiO2 core. In the I(t) curves, the second current reduction session took a long time and the data presented in Figure 4a shows that the conversion of Li2TiO3 to LiTiO2 was not completed until 150% of the theoretical charge was applied. This indicates that Li2TiO3 was stable and the reduction of Li2TiO3 was refractory. Therefore, the third step was the rate-limiting step in the TiO2 reduction in the molten LiCl–Li2O.
Important physical variables determine the electrolytic reduction process, including the diffusion coefficient of oxygen in various phases, the applied current density, the radius of the grains, and the density of the phase [16]. In this study, the most reduced product obtained for the electrolytic reduction of TiO2 was LiTiO2 with 150% of the theoretical charge in 8.2 h. Previous studies on TiO2 electrolytic reduction using the pellet form (thickness ≈ 0.2 cm) at cell potentials of 1.8 V and 3.2 V also only achieved LiTi2O4 and LiTiO2 within several hours [19]. In contrast, the complete reduction of the TiO2 powder in LiCl was achieved with both CV techniques and potentioamperometry [10,21]. Li2O accumulation within the pellet may alternate the conductivity of the mixtures and slow down the direct electrolytic reduction of Li2TiO3 and LiTiO2, which was observed for other metal oxide reductions [27].
The key to improving the TiO2 reduction in LiCl–Li2O molten salts is to reduce the Li2O local concentration and promote the diffusion of O2− out of the solid phase. Strategies to achieve this include lowering the Li2O concentration in the molten salts, reducing the pellet size, and applying sonication or mechanical stirring to accelerate the O2− diffusion [41]. Furthermore, as the Ti species valence reduced to 0 step by step according to the DFT analysis for the multistep reduction, the ∆G changed from negative to positive. This indicates that the stepwise reduction of TiO2 with the in-situ-generated Li metal reached thermodynamic equilibrium and gradually became more refractory, although the overall ∆G for the TiO2 reduction was negative and the reaction was spontaneous. Another promising way to improve the TiO2 electrolytic reduction in LiCl is to avoid the intermediate steps, such as removing the soaking step or decrease it to a reasonably short time.
5. Conclusions
Electrolytic TiO2 reduction in LiCl–Li2O salts at 650 °C was examined in terms of a soaking only test, the effect of a reduction potential, and the effect of applied charges. The soaking without electrolysis showed the spontaneous formation of Li2TiO3, which is a unique intermediate for TiO2 electrolytic reduction. The increasing reduction potential promoted TiO2 reduction only to a certain extent. The optimal cathodic reduction potential was determined as being −0.3 V vs. Li/Li+. The highest charge, i.e., 150% of the theoretical charge, was applied for 8.2 h and caused the partial reduction of TiO2 through to the full conversion of LiTiO2, which was the most reduced product obtained in this study. Accordingly, the highest reduction extent was 25%.
Combined with the DFT modeling, the electrolytic reduction of TiO2 in molten LiCl–Li2O was proposed to follow a multistep reaction mechanism. The external surface of the TiO2 particles was converted to Li2TiO3 via the chemical insertion of Li2O during the soaking stage. Then, the TiO2 core was partially reduced to LiTiO2 before Li2TiO3 was electrolytically reduced to LiTiO2. The reduction of Li2TiO3 was reversible and led to the formation of Li2O. Due to the accumulation of Li2O at the three PIs, the reduction of Li2TiO3 to LiTiO2 was very slow and the rate-limiting step. Further reduction of LiTiO2 was paused as more Li2O was generated and accumulated.
Based on the understanding of the TiO2 electrolytic reduction mechanism in molten LiCl–Li2O, the key to increasing the efficiency of electrolytic TiO2 reduction is to reduce the O2− ions concentration at the three PIs. Strategies to achieve this include promoting the O2− diffusion at the three PIs, using smaller TiO2 particles or powder, using a lower concentration of Li2O for the bulk salts, and reducing the soaking time to avoid the excessive formation of Li2TiO3.
Supplementary Materials
The followings are available online at https://0-www-mdpi-com.brum.beds.ac.uk/article/10.3390/electrochem2020016/s1. Figure S1: Optimized bulk crystal structures for the Li system, TiO2, TiO, and Ti. Table S1: Rietveld refinement results for the soaked and reduced products. Table S2: Optimized bulk lattice parameters. Table S3: Equation of state, equilibrium volumes (V_0) determined from corresponding BM4 EOS, bulk moduli, and electronic potentials for the materials modeled from DFT.
Author Contributions
Conceptualization, S.L. and H.Z.; methodology, S.L. and H.Z.; software, B.L.; validation, M.S., B.L., S.L. and H.Z.; formal analysis, M.S. and H.Z.; resources, S.L. and B.L.; data curation, M.S.; writing—original draft preparation, M.S.; writing—review and editing, H.Z.; visualization, B.L.; project administration, S.L. and H.Z.; funding acquisition, S.L. All authors have read and agreed to the published version of the manuscript.
Funding
This research was supported through the INL Laboratory Directed Research and Development (LDRD) Program under DOE Idaho Operations Office Contract DE-AC07-05ID14517.
Institutional Review Board Statement
Not applicable.
Informed Consent Statement
Not applicable.
Data Availability Statement
Not applicable.
Acknowledgments
The authors would like to thank the staff at the Center for Advanced Energy Studies for their assistance and the use of their facilities.
Conflicts of Interest
The authors declare no conflict of interest.
References
- Shenouda, A.Y.; Murali, K.R. Electrochemical Properties of Doped Lithium Titanate Compounds and Their Performance in Lithium Rechargeable Batteries. J. Power Sources 2008, 176, 332–339. [Google Scholar] [CrossRef]
- Nemeth, T.; Schröer, P.; Kuipers, M.; Sauer, D.U. Lithium Titanate Oxide Battery Cells for High-Power Automotive Applications —Electro-Thermal Properties, Aging Behavior and Cost Considerations. J. Energy Storage 2020, 31, 101656. [Google Scholar] [CrossRef]
- Cui, C.; Hu, B.; Zhao, L.; Liu, S. Titanium Alloy Production Technology, Market Prospects and Industry Development. Mater. Des. 2011, 32, 1684–1691. [Google Scholar] [CrossRef]
- Smith, P.R.; Froes, F.H. Developments in Titanium Metal Matrix Composites. JOM 1984, 36, 19–26. [Google Scholar] [CrossRef]
- Chen, G.Z.; Fray, D.J.; Farthing, T.W. Direct Electrochemical Reduction of Titanium Dioxide to Titanium in Molten Calcium Chloride. Nature 2000, 407, 361–364. [Google Scholar] [CrossRef] [PubMed]
- Jiang, K.; Hu, X.; Ma, M.; Wang, D.; Qiu, G.; Jin, X.; Chen, G.Z. “Perovskitization”-Assisted Electrochemical Reduction of Solid TiO2 in Molten CaCl2. Angew. Chem. Int. Ed. 2006, 45, 428–432. [Google Scholar] [CrossRef] [PubMed]
- Suzuki, R.O. Calciothermic Reduction of TiO2 and in Situ Electrolysis of CaO in the Molten CaCl2. J. Phys. Chem. Solids 2005, 66, 461–465. [Google Scholar] [CrossRef]
- Suzuki, R.O. Direct Reduction Processes for Titanium Oxide in Molten Salt. JOM 2007, 59, 68–71. [Google Scholar] [CrossRef] [Green Version]
- Ono, K.; Suzuki, R.O. A New Concept for Producing Ti Sponge: Calciothermic Reduction. JOM 2002, 54, 59–61. [Google Scholar] [CrossRef]
- Shin, H.-S.; Hur, J.-M.; Jeong, S.M.; Jung, K.Y. Direct Electrochemical Reduction of Titanium Dioxide in Molten Lithium Chloride. J. Ind. Eng. Chem. 2012, 18, 438–442. [Google Scholar] [CrossRef]
- Herrmann, S.D.; Li, S.X. Separation and Recovery of Uranium Metal from Spent Light Water Reactor Fuel Via Electrolytic Reduction and Electrorefining. Nucl. Technol. 2010, 171, 247–265. [Google Scholar] [CrossRef]
- Jeong, S.M.; Jung, J.-Y.; Seo, C.-S.; Park, S.-W. Characteristics of an Electrochemical Reduction of Ta2O5 for the Preparation of Metallic Tantalum in a LiCl–Li2O Molten Salt. J. Alloy. Compd. 2007, 440, 210–215. [Google Scholar] [CrossRef]
- Schwandt, C.; Alexander, D.T.L.; Fray, D.J. The Electro-Deoxidation of Porous Titanium Dioxide Precursors in Molten Calcium Chloride under Cathodic Potential Control. Electrochim. Acta 2009, 54, 3819–3829. [Google Scholar] [CrossRef]
- Schwandt, C.; Fray, D.J. Determination of the Kinetic Pathway in the Electrochemical Reduction of Titanium Dioxide in Molten Calcium Chloride. Electrochim. Acta 2005, 51, 66–76. [Google Scholar] [CrossRef]
- Alexander, D.T.L.; Schwandt, C.; Fray, D.J. The Electro-Deoxidation of Dense Titanium Dioxide Precursors in Molten Calcium Chloride Giving a New Reaction Pathway. Electrochim. Acta 2011, 56, 3286–3295. [Google Scholar] [CrossRef]
- Kar, P.; Evans, J.W. A Shrinking Core Model for the Electro-Deoxidation of Metal Oxides in Molten Halide Salts. Electrochim. Acta 2008, 53, 5260–5265. [Google Scholar] [CrossRef]
- Suzuki, R.O.; Ono, K.; Teranuma, K. Calciothermic Reduction of Titanium Oxide and In-Situ Electrolysis in Molten CaCl2. Metall. Mater. Trans. B 2003, 34, 287–295. [Google Scholar] [CrossRef]
- Kikuchi, T.; Yoshida, M.; Matsuura, S.; Natsui, S.; Tsuji, E.; Habazaki, H.; Suzuki, R.O. Rapid Reduction of Titanium Dioxide Nano-Particles by Reduction with a Calcium Reductant. J. Phys. Chem. Solids 2014, 75, 1041–1048. [Google Scholar] [CrossRef] [Green Version]
- Jiang, K.; Hu, X.; Sun, H.; Wang, D.; Jin, X.; Ren, Y.; Chen, G.Z. Electrochemical Synthesis of LiTiO2 and LiTi2O4 in Molten LiCl. Chem. Mater. 2004, 16, 4324–4329. [Google Scholar] [CrossRef]
- Jin-Mok, H.; Su-Chul, L.; Sang-Mun, J.; Chung-Seok, S. Electrochemical Reduction of TiO2 in Molten LiCl–Li2O. Chem. Lett. 2007, 36, 1028–1029. [Google Scholar] [CrossRef]
- Dring, K. Direct Electrochemical Reduction of Titanium Dioxide in Molten Salts. Key Eng. Mater. 2010, 436, 27–34. [Google Scholar] [CrossRef]
- Bhagat, R.; Dye, D.; Raghunathan, S.L.; Talling, R.J.; Inman, D.; Jackson, B.K.; Rao, K.K.; Dashwood, R.J. In Situ Synchrotron Diffraction of the Electrochemical Reduction Pathway of TiO2. Acta Mater. 2010, 58, 5057–5062. [Google Scholar] [CrossRef] [Green Version]
- Alexander, D.T.L.; Schwandt, C.; Fray, D.J. Microstructural Kinetics of Phase Transformations during Electrochemical Reduction of Titanium Dioxide in Molten Calcium Chloride. Acta Mater. 2006, 54, 2933–2944. [Google Scholar] [CrossRef]
- Shi, M.; Li, S.; Zhao, H. High Current Efficiency of NiO Electro-Reduction in Molten Salt. J. Electrochem. Soc. 2018, 165, E768–E772. [Google Scholar] [CrossRef]
- Kresse, G.; Hafner, J. Ab Initio Molecular Dynamics for Liquid Metals. Phys. Rev. B 1993, 47, 558–561. [Google Scholar] [CrossRef]
- Kresse, G.; Joubert, D. From Ultrasoft Pseudopotentials to the Projector Augmented-Wave Method. Phys. Rev. B 1999, 59, 1758–1775. [Google Scholar] [CrossRef]
- Burak, A.J.; Simpson, M.F. Electrochemical Measurement of Li2O in Molten LiCl Salt. ECS Trans. 2016, 75, 55–61. [Google Scholar] [CrossRef]
- Joseph, T.B.; Sanil, N.; Mohandas, K.S.; Nagarajan, K. A Study of Graphite as Anode in the Electro-Deoxidation of Solid UO2 in LiCl-Li2O Melt. J. Electrochem. Soc. 2015, 162, E51–E58. [Google Scholar] [CrossRef]
- van de Krol, R.; Goossens, A.; Schoonman, J. Spatial Extent of Lithium Intercalation in Anatase TiO2. J. Phys. Chem. B 1999, 103, 7151–7159. [Google Scholar] [CrossRef]
- Macklin, W.J.; Neat, R.J. Performance of Titanium Dioxide-Based Cathodes in a Lithium Polymer Electrolyte Cell. Solid State Ion. 1992, 53–56, 694–700. [Google Scholar] [CrossRef]
- Merwin, A. Material Interactions with Molten LiCl-Li2O-Li. Ph.D. Thesis, University of Nevada, Reno, NV, USA, 2016. [Google Scholar]
- Chen, G.Z.; Gordo, E.; Fray, D.J. Direct Electrolytic Preparation of Chromium Powder. Metall. Mater. Trans. B 2004, 35, 223–233. [Google Scholar] [CrossRef]
- Gordo, E.; Chen, G.Z.; Fray, D.J. Toward Optimisation of Electrolytic Reduction of Solid Chromium Oxide to Chromium Powder in Molten Chloride Salts. Electrochim. Acta 2004, 49, 2195–2208. [Google Scholar] [CrossRef]
- Fray, D.J.; Chen, G.Z. Reduction of Titanium and Other Metal Oxides Using Electrodeoxidation. Mater. Sci. Technol. 2004, 20, 295–300. [Google Scholar] [CrossRef]
- Robin, M.B.; Day, P. Mixed Valence Chemistry-A Survey and Classification. In Advances in Inorganic Chemistry and Radiochemistry; Emeléus, H.J., Sharpe, A.G., Eds.; Academic Press: Cambridge, UK, 1968; Volume 10, pp. 247–422. ISBN 0065-2792. [Google Scholar]
- Xiao, W.; Jin, X.; Deng, Y.; Wang, D.; Hu, X.; Chen, G.Z. Electrochemically Driven Three-Phase Interlines into Insulator Compounds: Electroreduction of Solid SiO2 in Molten CaCl2. ChemPhysChem 2006, 7, 1750–1758. [Google Scholar] [CrossRef]
- Deng, Y.; Wang, D.; Xiao, W.; Jin, X.; Hu, X.; Chen, G.Z. Electrochemistry at Conductor/Insulator/Electrolyte Three-Phase Interlines: A Thin Layer Model. J. Phys. Chem. B 2005, 109, 14043–14051. [Google Scholar] [CrossRef]
- Wu, T.; Jin, X.; Xiao, W.; Hu, X.; Wang, D.; Chen, G.Z. Thin Pellets: Fast Electrochemical Preparation of Capacitor Tantalum Powders. Chem. Mater. 2007, 19, 153–160. [Google Scholar] [CrossRef]
- Ohzuku, T. Zero-Strain Insertion Material of Li1∕3Ti5∕3O4 for Rechargeable Lithium Cells. J. Electrochem. Soc. 1995, 142, 1431. [Google Scholar] [CrossRef]
- Qiu, G.; Jiang, K.; Ma, M.; Wang, D.; Jin, X.; Chen, G.Z. Roles of Cationic and Elemental Calcium in the Electro-Reduction of Solid Metal Oxides in Molten Calcium Chloride. Z. Nat. A 2014, 62, 292. [Google Scholar] [CrossRef]
- Mandroyan, A.; Mourad-Mahmoud, M.; Doche, M.-L.; Hihn, J.-Y. Effects of Ultrasound and Temperature on Copper Electro Reduction in Deep Eutectic Solvents (DES). Ultrason. Sonochem. 2014, 21, 2010–2019. [Google Scholar] [CrossRef] [PubMed]
Figure 1.
XRD for fresh TiO2 (rutile) and soaked TiO2 in molten LiCl–Li2O (1 wt.%) for 5 h at 650 °C (blue solid lines) and Rietveld refinement fittings (red dash lines, with rutile TiO2, Li2TiO3, and Li0.54Ti2.86O6).
Figure 1.
XRD for fresh TiO2 (rutile) and soaked TiO2 in molten LiCl–Li2O (1 wt.%) for 5 h at 650 °C (blue solid lines) and Rietveld refinement fittings (red dash lines, with rutile TiO2, Li2TiO3, and Li0.54Ti2.86O6).

Figure 2.
(a) XRD results (blue solid lines) and Rietveld refinement analysis (red dash lines) of the reduced TiO2 samples at −0.2 V, −0.3 V, and −0.4 V vs. Li/Li+ with 80% of the theoretical charge; (b) reduced sample compositions and reduction extents for the TiO2 reductions at −0.2 V, −0.3 V, and −0.4 V vs. Li/Li+.

Figure 3.
Current–time profiles for the 2 g TiO2 reductions at cathodic reduction potentials of −0.2 V, −0.3 V, and −0.4 V vs. Li/Li+ with intervals using 80% of the theoretical charge.
Figure 3.
Current–time profiles for the 2 g TiO2 reductions at cathodic reduction potentials of −0.2 V, −0.3 V, and −0.4 V vs. Li/Li+ with intervals using 80% of the theoretical charge.

Figure 4.
(a) XRD results (blue solid lines) and Rietveld refinement analysis (red dash lines) of the reduced TiO2 samples at −0.3 V vs. Li/Li+ using 80%, 130%, and 150% of the theoretical charge; (b) reduced sample compositions and reduction extents for the TiO2 reductions at −0.3 V vs. Li/Li+ using 80%, 130%, and 150% of the theoretical charge.

Figure 5.
Current–time profiles for the TiO2 reductions at −0.3 V vs. Li/Li+ using 80%, 130%, and 150% of the theoretical charge for 2 g TiO2.
Figure 5.
Current–time profiles for the TiO2 reductions at −0.3 V vs. Li/Li+ using 80%, 130%, and 150% of the theoretical charge for 2 g TiO2.

Figure 6.
Unit cell volumes for the related chemicals during the TiO2 electrolytic reduction in the molten LiCl–Li2O (1 wt.%) at 650 °C.
Figure 6.
Unit cell volumes for the related chemicals during the TiO2 electrolytic reduction in the molten LiCl–Li2O (1 wt.%) at 650 °C.

Figure 7.
Shrinking core model for (a) the TiO2 soaking process and (b) for the electrolytic reduction of the TiO2 process with a passivation layer.
Figure 7.
Shrinking core model for (a) the TiO2 soaking process and (b) for the electrolytic reduction of the TiO2 process with a passivation layer.


Table 1.
Electrolytic reduction products for TiO2 in LiCl salts.
| Reference | Temperature | Reduction Conditions | Products | Characterization |
|---|---|---|---|---|
| [19] | 700 °C | TiO2 pellets, cell potentials 1.8 V and 3.2 V | Li2TiO4, LiTiO2 | ICP, XRD, and TEM |
| [20] | 650 °C | TiO2 powder, constant current at 1.2 A, cell potential 2.7 V | Li2TiO4, LiTiO2, Ti | XRD and SEM |
| [10] | 650 °C | TiO2 powder, cell potential 3.0 V | LiTiO2, TiO, Ti2O, Ti | XRD and SEM |
| [21] | 850 °C | Thin TiO2 film, 0 to −2.0 V vs. Ni/NiO | Li2TiO3, TiO, Ti3O5, Ti2O3, Ti | CV |
Table 2.
Gibbs free energy change and reaction potentials for reactions at 650 °C using DFT calculations.
Table 2.
Gibbs free energy change and reaction potentials for reactions at 650 °C using DFT calculations.
| Reaction | Equation | ∆Gr (kJ·mol−1) | Theoretical Potential (V) |
|---|---|---|---|
| (6) | −125.0 | -- | |
| (7) | −113.0 | -- | |
| (8) | −11.0 | -- | |
| (9) | 0.8 | −0.01 | |
| (10) | −22.3 | -- | |
| (11) | 227.0 | −1.18 | |
| (12) | 222.0 | −2.30 | |
| (13) | 212.0 | −2.20 |
Publisher’s Note: MDPI stays neutral with regard to jurisdictional claims in published maps and institutional affiliations. |
© 2021 by the authors. Licensee MDPI, Basel, Switzerland. This article is an open access article distributed under the terms and conditions of the Creative Commons Attribution (CC BY) license (https://creativecommons.org/licenses/by/4.0/).
Share and Cite
MDPI and ACS Style
Shi, M.; Liu, B.; Li, S.; Zhao, H. Electrolytic Reduction of Titanium Dioxide in Molten LiCl–Li2O. Electrochem 2021, 2, 224-235. https://0-doi-org.brum.beds.ac.uk/10.3390/electrochem2020016
AMA Style
Shi M, Liu B, Li S, Zhao H. Electrolytic Reduction of Titanium Dioxide in Molten LiCl–Li2O. Electrochem. 2021; 2(2):224-235. https://0-doi-org.brum.beds.ac.uk/10.3390/electrochem2020016
Chicago/Turabian StyleShi, Meng, Bin Liu, Shelly Li, and Haiyan Zhao. 2021. "Electrolytic Reduction of Titanium Dioxide in Molten LiCl–Li2O" Electrochem 2, no. 2: 224-235. https://0-doi-org.brum.beds.ac.uk/10.3390/electrochem2020016