Article

Joint Successful Transmission Probability, Delay, and Energy Efficiency Caching Optimization in Fog Radio Access Network

by
Alaa Bani-Bakr
,
Kaharudin Dimyati
*,
MHD Nour Hindia
,
Wei Ru Wong
* and
Tengku Faiz Tengku Mohmed Noor Izam
Department of Electrical Engineering, Faculty of Engineering, University of Malaya, Kuala Lumpur 50603, Malaysia
*
Authors to whom correspondence should be addressed.
Submission received: 5 June 2021 / Revised: 24 June 2021 / Accepted: 30 June 2021 / Published: 31 July 2021
(This article belongs to the Special Issue Radio Access Network Planning and Management)

Abstract

:
The fog radio access network (F-RAN) is considered an efficient architecture for caching technology as it can support both edge and centralized caching due to the backhauling of the fog access points (F-APs). Successful transmission probability (STP), delay, and energy efficiency (EE) are key performance metrics for F-RAN. Therefore, this paper proposes a proactive cache placement scheme that jointly optimizes STP, delay, and EE in wireless backhauled cache-enabled F-RAN. First, expressions of the association probability, STP, average delay, and EE are derived using stochastic geometry tools. Then, the optimization problem is formulated to obtain the optimal cache placement that maximizes the weighted sum of STP, EE, and negative delay. To solve the optimization problem, this paper proposes the normalized cuckoo search algorithm (NCSA), which is a novel modified version of the cuckoo search algorithm (CSA). In NCSA, after generating the solutions randomly via Lévy flight and random walk, a simple bound is applied, and then the solutions are normalized to assure their feasibility. The numerical results show that the proposed joint cache placement scheme can effectively achieve significant performance improvement by up to 15% higher STP, 45% lower delay, and 350% higher EE over the well-known benchmark caching schemes.

1. Introduction

Edge caching is an efficient technology to alleviate the traffic congestion, communication delay, and energy consumption [1,2], which is achieved by reducing the data load in the core network by caching the popular contents at the edge devices closer to the end-users. The fog radio network (F-RAN), as a decentralized network architecture, can support the edge caching technology, since their edge devices (i.e., fog access points (F-APs)) are supported with caching and computing capabilities [3,4]. The performance of the edge caching in F-RAN can be further enhanced by taking advantage of the centralized caching provided by the cloud via backhauling the F-APs with the cloud access points (C-APs), which results in more efficient and flexible caching strategies [2]. The optimal cache placement in these hybrid caching strategies is of a great significance as it can further improve the performance.
The key studied performance metrics in optimizing the cache placement in F-RAN are the successful transmission probability (STP), which is also known as success delivery probability and hit probability, delay, and energy efficiency (EE). Recently, the problem of improving the STP in cache-enabled F-RAN has been addressed by several papers [5,6,7,8,9]. Optimizing the delay in cache-enabled F-RAN is addressed in [10,11,12,13,14,15,16,17,18], while the EE of cache-enabled F-RAN is investigated in [19,20,21,22,23,24]. The joint optimization of the delay and EE in cache-enabled F-RAN was addressed by Wan et al. [25], Jiang et al. [26]. STP and delay are jointly optimized in [27,28].
The preferences of the end-users and their QoS were not investigated by Wei [12]. Jiang et al. [8] did not take into account the impacts of the interference originating from the F-APs on the hit rate. The authors of [7,8,9,10,11,13,14,15,16,17,18,19,20,21,22,23,24,25,26,27] did not tackle the wireless backhauling of the F-APs. The F-AP’s optimal cache placement is not addressed in [12,13,14,23,24,25,26,27], the joint optimization of EE and delay is not addressed in [25,26], STP and delay optimization are performed in [25,26] for a cooperative coded caching F-RAN, and the EE is not addressed in [28]. As far as the authors know, the problem of jointly optimizing STP, EE, and delay in uncoded cache-enabled F-RAN has not been addressed before. Motivated by this, a multi-objective optimization of STP, EE, and delay in uncoded wireless backhauled cached-enabled F-RAN is proposed in this paper. Due to the wireless backhauling of F-APs, the proposed hybrid caching scheme takes advantage of both the edge caching at F-APs and the centralized caching provided by C-APs. The main contributions of this paper are as follows:
1.
Stochastic geometry tools are used to derive expressions of the probabilities of direct and transit F-APs and association probabilities with F-APs, STP, EE, and average delay.
2.
The optimization problem is formulated to obtain the optimal cache placement that maximizes the multi-objective function of the weighted sum of STP, EE, and delay.
3.
To obtain the optimal cache placement that balances the performance, a novel normalized cuckoo search algorithm (NCSA) is proposed.
4.
The numerical results show that the proposed hybrid caching scheme in F-RAN outperforms the well-known benchmark caching schemes.
The rest of this paper is organized as follows. Section 2 describes the system model. In Section 3, STP, delay and EE are analyzed. The problem formulation and performance optimization are presented in Section 4. The results are presented and discussed in Section 5. Finally, the conclusions are drawn in Section 7. The key notations used thorough this paper are provided in Table 1.

2. System Model

2.1. Network Model

Consider a downlink F-RAN consisting of a tier limited storage F-APs and a tier of C-APs. The locations of the F-APs and C-APs are spatially distributed according to independent two-dimensional homogeneous Poisson point processes (PPPs) Φ F and Φ C of densities λ F and λ C , respectively. It is assumed that the F-APs are densely deployed in the deployment area, i.e., λ F λ C , and each F-AP is connected via wireless backhaul link with the nearest C-AP to its location. The users are also assumed to be spatially distributed as two-dimensional homogeneous PPP Φ U with density λ U . Each user, F-AP, and C-AP is equipped with a single antenna. The transmission powers of the F-APs and C-APs are P F and P C , respectively. Each F-AP and C-AP has a total transmission bandwidth of W F and W C , respectively. A broadcast transmission scheme is adopted at the access points. Denoting M 0 as the total number of contents cached at an access point, i.e., either a F-AP or C-AP, the access point disseminates each content over 1 / M 0 of its total transmission bandwidth under the adopted transmission scheme. It is assumed that the transmitted signal experiences a large-scale path loss, of which transmitted signal’s power decays by D α , where D is the propagated distance and α is the path loss exponent. It is also assumed that the transmitted signal undergoes a small-scale Rayleigh fading, i.e., the small-scale fading coefficient h is exponentially distributed | h | 2 d exp ( 1 ) .

2.2. Caching Model

Let the set M = { 1 , 2 , . . M } denote the content library, where M is the total number of contents in the system. For analytical tractably, the contents are assumed to have equal size. The content library is assumed to be cached at each C-AP, whereas, due to the storage limitation of the F-APs, it is assumed that each F-AP can only cache a single content. The popularity distribution of the contents among all users is assumed to be identical and a priori known. Denote a = ( a m ) m M as the popularity distribution of the contents, where a m 0 , 1 , such that m = 1 M a m = 1 , represents the probability of randomly requesting content m by a user. It is assumed that the contents are ranked according to a in descending order, i.e., a 1 a 2 a M , and the probability of requesting the mth content follows the Zipf distribution given below.
a m = m γ m M m γ
where γ is the skew parameter of the distribution.
A probabilistic proactive caching strategy is considered in this paper, in which the F-APs cache the content according to the content caching distribution p = p m m M , such that the elements of p satisfy the following conditions:
0 p m 1 , m M
m M p m = 1
where p m is the probability of caching content m at a F-AP.

2.3. Association Model

Based on Slivnyak’s theorem [29], this paper focuses on a typical user located at the origin, with no loss of generality. Denote u 0 as the typical user and R as its discovery range. It is assumed that there is no direct communication between u 0 and the C-APs, i.e., when u 0 requests content m, it can only be associated with the F-APs as follows:
1.
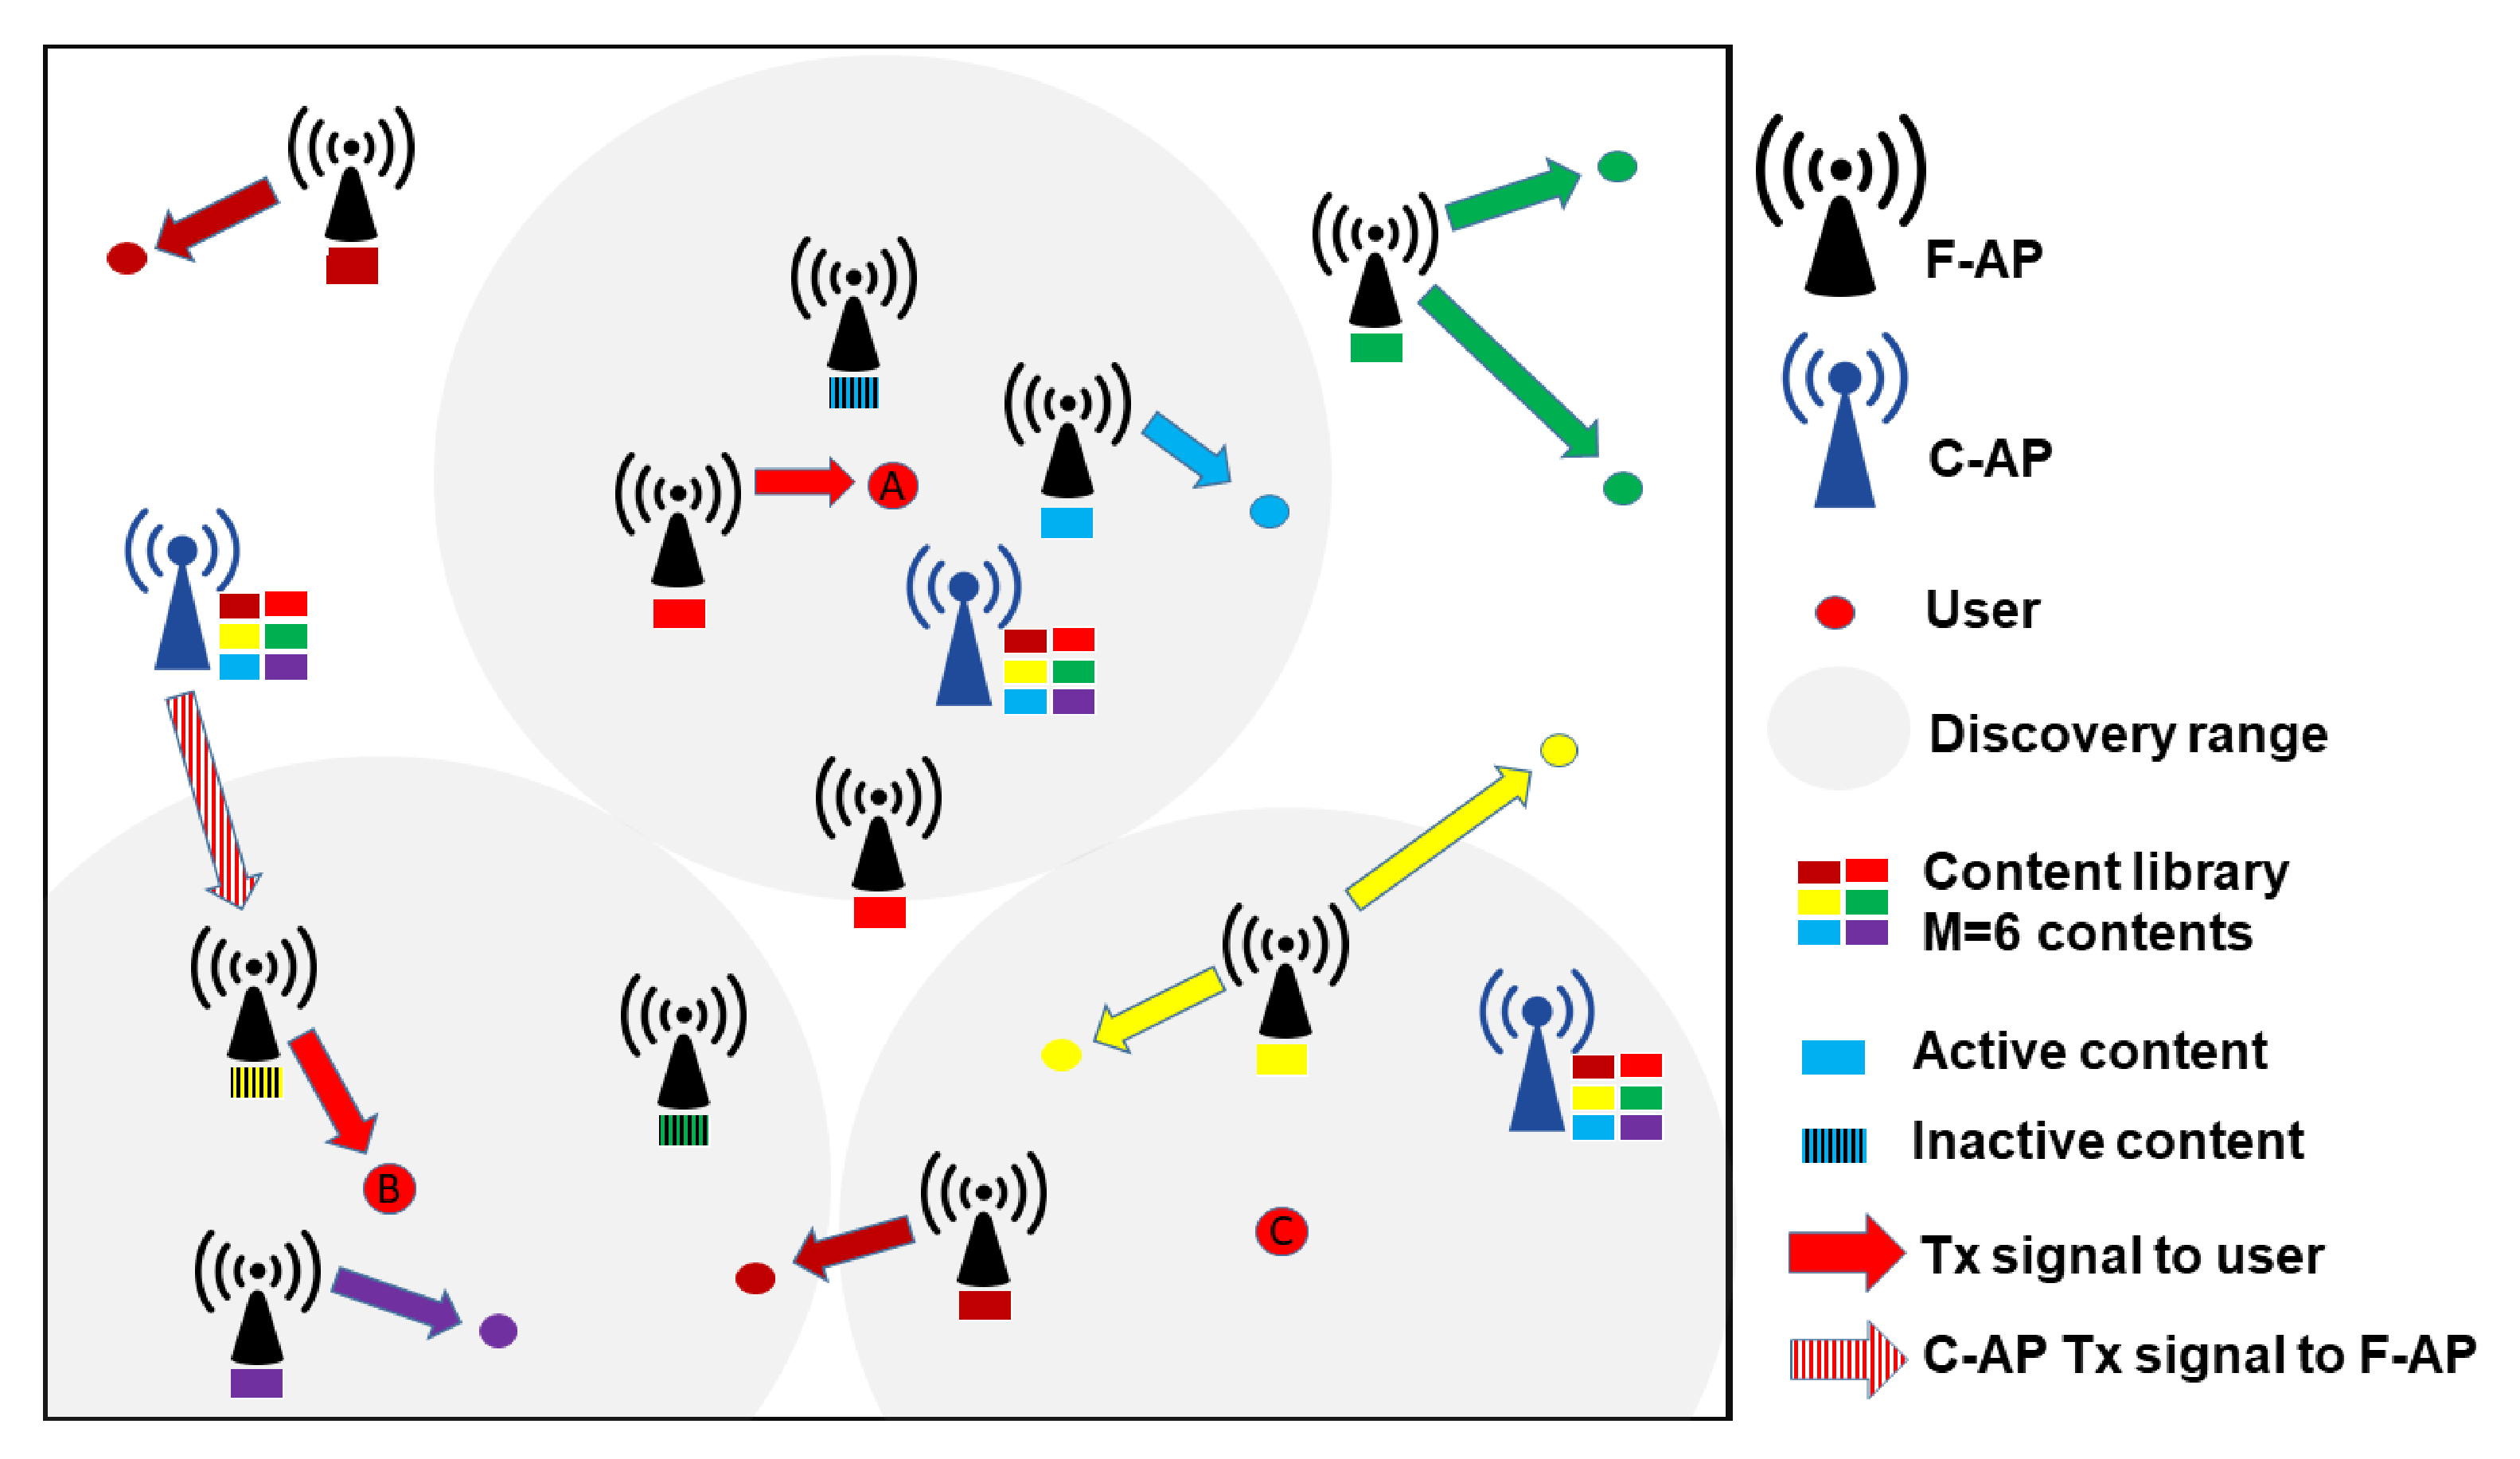
 If content m is cached by F-APs within R, u 0 is associated with the nearest one of them to its location. as illustrated in Figure 1, i.e., user A. Here, the associated F-AP is called ’direct F-AP’ and denoted as F m , 0 .
Lemma 1. 
When u 0 randomly requests content m, the probability of it being associated with the direct F-AP F m , 0 within R can be expressed as follows:
A m , d = 1 exp π p m λ F R 2
Proof. 
See Appendix A. □
2.
 If a F-AP caching content m does not exist within R, u 0 is associated with the nearest available F-AP F a , 0 within R, which in turn fetches content m from the nearest C-AP C 0 to its location. This event is illustrated in Figure 1, i.e., user B. In this work, the available F-AP is defined as a F-AP caches a content that is not requested by the users within its associated region. Due to the two-hop transmission, F a , 0 is called a ‘transit F-AP’.
Lemma 2. 
 When content m is requested, the probability of u 0 being associated with a transit F-AP F a , 0 within R can be expressed as follows:
A m , t = exp π p m λ F R 2 1 exp π Λ m λ F R 2
here,
Λ m = μ M \ m p μ b μ
where Λ m denotes the probability of available F-APs with respect to content m and b μ is the probability of content μ being inactive given as
b μ = 1 + a μ λ U 3.5 p μ λ F 3.5
Proof. 
See Appendix B. □

3. Analysis of Performance Metrics

This section defines and analyzes the performance metrics of interest, which are STP, average delay, and EE.

3.1. STP Analysis

STP is defined as the probability that a requested content can be successfully transmitted. Thus, when the direct F-AP F m , 0 serves u 0 , content m can be successfully transmitted at rate ξ if the channel capacity of the link between F m , 0 and u 0 exceeds ξ . Assuming the interference-limited system for which the interference is modeled as in [29,30], the STP of content m when u 0 is associated with F m , 0 can be expressed as follows
q m , 0 ( p ) = Pr C m , 0 W F log 2 1 + S I R m , 0 ξ
where C m , 0 is the channel capacity and S I R m , 0 is the signal-to-interference ratio of u 0 given by
S I R m , 0 = D 0 , 0 α | h 0 , 0 | 2 Φ m \ F m , 0 D , 0 α | h , 0 | 2 + Φ m D , 0 α | h , 0 | 2 + Φ C D , 0 α | h , 0 | 2 P C P F
where Φ m is the point process of the F-APs that do not cache content m, D 0 , 0 denotes the distance between F m , 0 and u 0 , D , 0 is the distance between access point and u 0 , h 0 , 0 is the channel coefficient of the link from F m , 0 to u 0 , and h , 0 represents the channel coefficient between access point and u 0 .
Theorem 1.
The STP of content m when u 0 is associated with the direct F-AP F m , 0 can be calculated by
q m , 0 ( p ) = 1 exp π p m λ F ( 1 + U p ) R 2 1 + U p
where
U p = 2 α 2 ξ W F 1 2 α β 2 α , 1 2 α , 2 ξ W F + λ F p m λ F + λ C P C P F p m λ F β 2 α , 1 2 α
here, β x , y 0 1 u x 1 1 u y 1 d u and β x , y , z z 1 u x 1 1 u y 1 d u are the Beta function and the complementary incomplete Beta function, respectively.
Proof. 
See Appendix C. □
When u 0 is associated with transit F-AP F a , 0 to serve its request of content m, to successfully deliver content m to u 0 , the channels capacities of the links in the two-hop transmission must exceed the transmission rate ξ . Thus, the STP of content m can be expressed as
q C , a , 0 ( p ) = Pr C a , 0 ξ , C C , a ξ = Pr W F log 2 1 + S I R a , 0 C a , 0 ξ q a , 0 ( p ) Pr W C M log 2 1 + S I R C , a C C , a ξ q C , a ( p )
where q a , 0 ( p ) and C a , 0 are the STP and channel capacity of the link from F a , 0 to u 0 , respectively. q C , a ( p ) and C C , a are the STP and channel capacity of the link between C 0 and F a , 0 , respectively. The second equality is due to the fact that q a , 0 ( p ) and q C , a ( p ) are independent events. Here, S I R a , 0 and S I R C , a denote the signal-to-interference ratio at u 0 and F a , 0 , respectively, and are given as
S I R a , 0 = D a , 0 α | h a , 0 | 2 Φ a , m \ F a , 0 D , 0 α | h , 0 | 2 + Φ a , m D , 0 α | h , 0 | 2 + Φ C D , 0 α | h , 0 | 2 P C P F
S I R C , a = D C , a α | h C , a | 2 Φ C \ C 0 D , a α | h , a | 2 + Φ F \ F a , 0 D , a α | h , a | 2 P F P C
where the point process Φ a , m Φ F \ Φ a , m represents the unavailable F-APs with respect to m. D a , 0 , D C , a , and D , a are the length of the links between F a , 0 and u 0 , C 0 , and access point , respectively. h a , 0 , h C , a , and h , a are the channel coefficients of the aforementioned links, respectively.
Theorem 2.
The STP of content m when u 0 is associated with the transit F-AP F a , 0 can be obtained as
q C , a , 0 ( p ) = 1 exp π Λ m λ F ( 1 + V p ) R 2 ( 1 + G ) ( 1 + V p )
where
V ( p ) = 2 α 2 ξ W F 1 2 α β 2 α , 1 2 α , 2 ξ W F + λ F Λ m λ F + λ C P C P F Λ m λ F β 2 α , 1 2 α
and
G = 2 α 2 M ξ W C 1 2 α β 2 α , 1 2 α , 2 M ξ W C + λ F λ C P F P C β 2 α , 1 2 α
Proof. 
See Appendix D. □
The STP of the typical user u 0 can be obtained as in the following theorem.
Theorem 3.
The STP of u 0 is given as
q ( p ) = m M a m ( A m , d 1 exp π p m λ F ( 1 + U p ) R 2 1 + U p + A m , t 1 exp π Λ m λ F ( 1 + V p ) R 2 ( 1 + G ) ( 1 + V p ) )
Proof. 
Note that the system contains M contents that can be delivered to u 0 via two alternatives. Therefore, total probability theorem can be utilized to obtain the STP of the typical user as given in (18). □

3.2. Delay Analysis

This paper considers the average delay as performance metric. The average delay can be defined as the average time it takes u 0 to successfully receive the requested content, which is correlated with the geometric random variable that represents the average number of required time slots to successfully receive the requested contents.
When u 0 requesting content m is associated with F m , 0 , the number of required time slots to successfully receive content m conditioned on the distance can be obtained as follows:
κ m , 0 , D m , 0 ( p , d ) = 1 q m , 0 , D m , 0 ( p , d )
where q m , 0 , D m , 0 ( p , d ) denotes the conditional STP of content m over the link between F m , 0 and u 0 conditioned on D 0 , 0 = d .
Thus, the delay of content m when it is served by F m , 0 can be given by
τ m , 0 ( p ) = T E D m , 0 κ m , 0 , D m , 0 ( p , d )
Then, τ m , 0 ( p ) can be obtained as in the following theorem.
Theorem 4.
The average delay of content m when u 0 is served by the direct F-AP F m , 0 can be expressed as
τ m , 0 ( p ) = 2 π p m λ F T 0 R d exp π p m λ F 1 U p d 2 d d
Proof. 
The expected value of needed time slots to successfully receive content m can be calculated as follows:
E D m , 0 κ m , 0 , D m , 0 ( p , d ) = 0 R 1 q m , 0 , D 0 , 0 ( p , d ) f D 0 , 0 ( d ) d d
where q m , 0 , D m , 0 ( p , d ) and f D 0 , 0 ( d ) are given in Appendix A by (A8) and (A9), respectively. □
Analogously, when u 0 is associated with F a , 0 , the delay of content m can obtained as in the following theorem.
Theorem 5.
The average delay of content m when u 0 is associated with the transit F-AP F a , 0 is given as follows:
τ C , a , 0 ( p ) = 2 π Λ m λ F T 0 R d exp π Λ m λ F ( 1 V ( p ) ) d 2 d d + 2 π λ C T 0 d exp π λ C ( 1 G ) d 2 d d
Proof. 
The average delay of content m owing to the two-hop transmission can be obtained as follows:
τ C , a , 0 ( p ) = τ a , 0 ( p ) + τ C , a ( p ) = T E D a , 0 κ a , 0 , D a , 0 ( p , d ) + T E D C , a κ C , a , D C , a ( p , d )
where τ a , 0 ( p ) is the average delay of content m over the link between the transit F-AP and u 0 , and τ C , a ( p ) represents the average delay of fetching content m to F a , 0 from the nearest C-AP to its location. κ C , a , D C , a ( p , d ) and κ a , 0 , D a , 0 ( p , d ) are two random variables conditioned on the distance that express the needed time slots to successfully receive content m at F a , 0 and u 0 , respectively. Finally, the expected values of κ a , 0 , D a , 0 ( p , d ) and κ C , a , D C , a ( p , d ) can be calculated as follows:
E D a , 0 κ a , 0 , D a , 0 ( p , d ) = 0 R 1 q a , 0 , D a , 0 ( p , d ) f D a , 0 ( d ) d d
E D C , a κ C , a , D C , a ( p , d ) = 0 1 q C , a , D C , a ( p , d ) f D C , a ( d ) d d
where q a , 0 , D a , 0 ( p , d ) , q C , a , D C , a ( p , d ) , f D a , 0 ( d ) , and f D C , a ( d ) are given in Appendix B by (A14), (A18), (A19), and (A20), respectively. □
Theorem 6.
The average delay of u 0 can be expressed as
τ p = m M a m A m A m , d τ m , 0 p + A m , t τ C , a , 0 p
where A m denotes the total probability of association with respect to content m, which is given as
A m = A m , d + A m , t
Proof. 
Bearing in mind that the delay is conditioned on the association, the probability of the event space A m can be calculated as in (28). Then, we have (27) by total probability theorem. □

3.3. EE Analysis

EE is defined as the ratio between the average spectral efficiency and the average power consumption [31]. This paper adopts the power model in [25,26]. Denote P s as the static power consumption in all hardware blocks, including frequency synthesizer, cooling components, digital-to-analog, analog-to-digital converters, etc. Let ρ represent the slope of load-dependent power dissipation, i.e., ρ reflects influence of the power amplifier.
Theorem 7.
When u 0 is associated with the direct F-AP F m , 0 to serve its request for content m, the EE with respect to content m can obtained as follows:
E E m , d p = ξ q m , 0 ( p ) ρ P F + P s E D m , 0 κ m , 0 , D m , 0 ( p , d )
Proof. 
When u 0 is associated with the direct F-AP F m , 0 to serve its request for content m, due to the retransmission if an outage event occurs in a time slots, the average total consumed power to successfully deliver content m can be expressed as
P m , d p = ρ P F + P s E D m , 0 κ m , 0 , D m , 0 ( p , d )
whereas the average SE is given by
S E m , d p = ξ q m , 0 ( p )
Finally, the theorem is proven by taking the ratio S E m , d over P m , d . □
Theorem 8.
When u 0 requesting content m is associated with the transit F-AP F a , 0 , the EE associated with content m can be obtained as follows
E E m , t p = ξ q a , 0 ( p ) q C , a ( p ) ρ P F + P s E D a , 0 κ a , 0 , D a , 0 ( p , d ) + ρ P C + P s E D C , a κ C , a , D C , a ( p , d )
Proof. 
Due to the two-hop transmission, SE can be obtained as
S E m , t p = ξ q a , 0 ( p ) q C , a ( p )
whereas the total power consumption in the two hops is given by
P m , t p = ρ P F + P s E D a , 0 κ a , 0 , D a , 0 ( p , d ) + ρ P C + P s E D C , a κ C , a , D C , a ( p , d )
Then, by taking the ratio S E m , t over P m , t p , we can prove the theorem. □
Finally, the total probability theorem is utilized to obtain the EE of the typical user in the following theorem.
Theorem 9.
The EE of u 0 can be expressed as
E E p = m M a m A m A m , d E E m , d p + A m , t E E m , t p
Proof. 
The proof is analogous to the proof of Theorem 6. □

4. Performance Optimization

Bani-Bakr et al. [28] showed that improving STP by the wireless backhauling of F-APs does not always minimize the delay due to the large average delays of the backhaul links. Moreover, it is noted in the previous section that EE is fundamentally influenced by STP and delay. To balance the performance, the caching optimization problem is formulated to obtain the optimum caching distribution that maximizes the fitness function U ( p ) , i.e., the weighted sum of STP, EE, and negative delay, as follows:
Problem 1.
Weighted Sum Multi-Objective Caching Optimization
max p U ( p ) = θ q ϖ q q ( p ) + θ E E ϖ E E E E ( p ) θ τ ϖ τ τ ( p ) subjected to ( 2 ) , ( 3 )
where θ q , θ E E , and θ τ , such that 0 θ q , θ E E , θ τ 1 , and θ q + θ E E + θ τ = 1 , reflect the preferences of STP, EE, and delay, respectively. Note that the values of θ q , θ E E , and θ τ represent the sensitivity toward the corresponding performance metric, i.e., a higher value indicates a higher sensitivity toward the corresponding metric. Here, ϖ q , ϖ E E , and ϖ τ are normalization factors. Note that the convexity of Problem 1 cannot be ensured due to the complex forms of STP, EE, and delay.
To solve Problem 1, we propose the NCSA outlined in Algorithm 1, which is a modified version of the original cuckoo search Algorithm (CSA). CSA was proposed by Yang and Deb in 2009 as a nature-inspired heuristic evolutionary algorithm [32]. CSA is gaining higher attention recently, which is due to its simplicity and efficiency in solving complex non-convex problems [33,34]. The main idea of the original CSA is to mimic the natural cuckoo’s behavior in finding new nests and laying eggs by generating the new nests via Lévy flight and random walk, where each nest in the algorithm represents a solution. However, in constraint problems, the randomness of Lévy flight and random walk may result in generating infeasible nests, i.e., nests that do not fulfill the problem’s constraints. To overcome this drawback in NCSA, the feasibility of a randomly generated nest in the initial population, via Lévy flight or random walk, is assured by subjecting the elements of each nest to a simple bound, such they fulfill the constraint in (2). Then, the resulting nest is normalized by dividing it by its 1-norm to assure it fulfills the constraint in (3).
Algorithm 1: Normalized Cuckoo Search Algorithm (NCSA).
Electronics 10 01847 i001
In NCSA, N C represents maximum number of iterations, N P is the population size, P a is the abandon probability, and t is the iteration index. In Steps 3, 7, and 14, the simple bound works as follows:
p ˙ m i = p ˜ m i if 0 p ˜ m i 1 0 if p ˜ m i < 0 1 if p ˜ m i > 1
where p ˜ m i is the mth element of the ith nest. The nests are normalized as follows:
p i = p ˙ i | | p ˙ i | | 1
where | | p ˙ i | | 1 = m = 1 M | p ˙ m i | is the 1-norm.
In Step 6, the new nests are generated via Lévy flight as follows:
p ˜ n e w i = p i + δ L ( Ω )
where the notation ⊗ stands for the entry-wise multiplication, δ is a scaling factor, Ω [ 0.3 , 1.99 ] is the index of Lévy distribution, and L ( Ω ) = ( L m ( Ω ) ) m M is the Lévy vector. According to Mantegna’s algorithm, L m ( Ω ) can be obtained as follows [35]:
L m ( Ω ) = Ψ | Υ | 1 / Ω , m M
where Υ d N ( 0 , 1 ) and Ψ d N ( 0 , σ Ψ 2 ) are two random numbers. Here, Υ is drawn from the normal distribution of zero mean and unit variance and Ψ is drawn from another normal distribution of zero mean and a variance of
σ Ψ 2 = sin ( π Ω / 2 ) Γ ( 1 + Ω ) Ω 2 ( Ω 1 ) / 2 Γ ( ( 1 + Ω ) / 2 ) 1 / Ω
where Γ ( . ) stands for the gamma function.
As the nest gets closer to the solution, the localization of the search is encouraged by considering a decreasing scaling factor δ , which is given by
δ = 1 1 ( t / 25 M ) N c
In Step 13, the same number of abandon nests according to the probability P a are rebuilt in new locations that are discovered via random walks as follows:
p * i = p i + ε p k p l
where p k and p l are the kth and lth nests, which are selected randomly, and ε is a random number uniformly distributed in ( 0 , 1 ) .

Complexity Analysis and Implementation Cost

In each iteration of NCSA, the time complexity of Step 6 is O ( M × N p ) , Steps 8–12 is O ( N p ) , Step 13 is O ( M × N p ) , Steps 15 and 16 is O ( N p ) , and Steps 7 and 14 is O ( M × N p ) . Thus, the overall complexity of each iteration is O ( M × N p ) . Since there are N C iterations, the time complexity of NCSA is O ( N C × M × N p ) , which is of the same order of the original CSA.
Since NCSA can be executed by a simple code, the proposed caching scheme does not require extra hardware to be implemented. However, distributing the contents to the F-APs according to the desired caching distribution might require an extra protocol.

5. Numerical Results

In this section, we present the performance evaluation of the proposed caching, which is compared with two well-known caching benchmark schemes. ’Popular’ is the first benchmark scheme and refers to the caching scheme presented in [36]. In ’Popular’, only the most popular content is cached by the F-APs. ’Uniform’ represents the second benchmark scheme that is proposed in [37]. In ’Uniform’, the caching probability of the contents is uniform, i.e., all contents are cached by the F-APs with the same probability. The benchmark schemes are assumed to adopt the same association and wireless backhanding models of the proposed scheme. In Figure 2, Figure 3, Figure 4, Figure 5, Figure 6, Figure 7, Figure 8, Figure 9, Figure 10 and Figure 11, the performance of the proposed scheme is obtained by averaging after performing 100 trails for an evenly weighted fitness function, i.e., θ q = θ E E = θ τ = 1 / 3 . The parameters of NCSA used to obtain the optimal caching placement are N C = 50 , 000 , N P = 25 , Ω = 1.5 , and P a = 0.25 .
Figure 2 illustrates the relationship between the discovery range and STP, delay, and EE. The figure shows that STP increases with the discovery range for all schemes, which is because the typical user u 0 has a higher association probability with the F-APs as the discovery range increases. However, this increase is small in the Popular scheme as the F-APs cache only the most popular content, whereas the other contents can only be served by the transit F-APs. Moreover, due to the higher probability of the transit F-APs in the Popular scheme compared with the Uniform scheme, which is owing to caching only the most popular content at the F-APs, the Popular scheme achieves higher STPs than the Uniform scheme. The figure also shows that the delay of all schemes increases with the increase in the discovery range. This is mainly due to the high delay of the backhaul link as the probability of serving the requested contents by the transit F-APs increases with the discovery range. In the low discovery ranges (i.e., <90 m), the Popular scheme performs worse than the Uniform scheme due to its higher probability of using the transit F-APs. However, as the range increases beyond 90 m, the average delay of the Uniform scheme becomes higher than the Popular scheme, which is due to the higher separation distances between the requester and its serving F-AP. It is also observed that EE decreases with the discovery range as a result of the higher dissipated power since the contents require higher average number of time slots to be delivered successfully to the requester. The figure also demonstrates that the proposed scheme outperforms the benchmark schemes, which is due to optimizing the cache placement at the F-APs, where up to 15% STP, 45% delay, and 350% EE improvements over the benchmark schemes are observed at ranges greater than 150 m.
Figure 3 plots STP, delay, and EE versus Zipf exponent. Figure 3 shows that the performance of the Uniform scheme is not affected by the Zipf exponent. This can be explained as the increase in the Zipf exponent means an increase in the popularity of the high ranked contents and a decrease in the popularity of the low ranked contents. However, as the contents in the Uniform scheme are evenly cached at the F-APs, the average performance of the scheme is not affected by the contents popularity. The figure also shows that the STP of the Popular scheme increases with the Zipf exponent as a result of the higher popularity of the cached top ranked content. The delay in the Popular scheme decreases with Zipf exponent until it reaches at turning point of γ = 1.2 , which is due to the higher probability of requesting the cached top content. Beyond the turning point, the delay of the Popular scheme increases with the Zipf exponent, which is due to the lower probability of using the F-APs as transit F-APs to serve the other contents, which in turn results in higher average delay of the contents. The EE of the Popular scheme improves with the Zipf exponent owing to the gained improvement of the top ranked content. However, the high average delays beyond the turning point have no impact on EE due to the very low probability of requesting the low ranked contents. Figure 3 shows an improvement in STP, delay, and EE of the proposed scheme with the increase in the Zipf exponent. The proposed scheme achieves higher performance than the benchmark schemes as a result of the optimization process.
In Figure 4, we plot STP, delay, and EE versus the total number of cached contents M. It is observed that the proposed scheme outperforms the benchmark schemes, and STP, delay and EE degrade with the increase in the total number of cached contents for all schemes, which is due to the lower popularity of the contents, the smaller percentage of contents that are cached by the F-APs within the discovery range, and the C-APs’ poor dissemination of contents as the transmission bandwidth is shared by a higher number of them. Moreover, the figure shows that the Uniform scheme is severely impacted by the total number of contents as the requester is often served by a direct F-AP.
Figure 5 illustrates the impacts of the F-APs’ bandwidth on the performance, where an improvement in STP, delay, and EE with the F-APs’ transmission bandwidth is observed for all schemes. However, the impact of the F-APs’ transmission bandwidth on the Uniform scheme is higher than that on the Popular scheme, which is because the requested contents are often delivered via direct F-APs. It can also be observed the the proposed scheme achieves higher performance than the benchmark schemes.
Figure 6 illustrates the relationship between the C-APs’ bandwidth and STP, delay, and EE. Figure 6 shows that the proposed scheme achieves higher STPs and EEs and lower average delays than the benchmark schemes. It also shows that the performance of schemes improves with the C-APs’ bandwidth, which is due to the improvement in disseminating the contents by C-APs. It can be seen that the C-APs’ bandwidth has higher impact on the Popular scheme because the contents are often served by the transit F-APs.
Figure 7 plots STP, delay, and EE versus the user density λ U . We can see that the performance of the proposed and Popular schemes degrades with the increase in the user density. This can be explained as follows. As both schemes are highly relying on serving the requested contents by the transit F-APs, requesting the cached contents by a higher number of end-users results in a lower probability of operating F-APs in the transit mode, which in turn degrades the performance. The user density has no influence on the Uniform scheme as contents are often served by direct F-APs. It can also be seen that the proposed scheme outperforms the benchmark schemes, which is due to optimizing the cache placement to provide the best utilization of the F-APs as transit or direct F-APs that reduces the impact of increasing the user density on the performance.
Figure 8 plots STP, delay, and EE versus the F-AP density λ F . The figure shows that the Uniform scheme performs better with the increase in the F-AP density, which is due to the higher probabilities of the direct and transit F-APs as a result of the higher number of F-APs residing within the discovery range. For the same reason, the performance of the Popular scheme increases until it reaches the peak STP at 0.008 F-APs/m 2 , delay at 0.007 F-APs/m 2 , and EE at 0.006 F-APs/m 2 , and then the performance degrades due to the high interference from F-APs that starts to severely impact the performance of fetching the requested contents from C-APs by transit F-APs. We can observe that the proposed scheme performs better than the benchmark schemes as a result of the optimal cache placement and utilization of F-APs as direct or transit.
In Figure 9, we plot STP, delay, and EE versus the C-AP density λ C . It is observed that the proposed and Popular caching schemes performs better with the increase in the C-AP density, which is due to the higher performance of the transit F-APs. The performance of the Uniform scheme degrades with the C-AP density, which is because the contents are often served by direct F-APs, and thus the increase in C-APs density results in high accumulated interference that degrades the performance. The figure also shows that the proposed scheme achieves higher performance than the benchmark schemes.
Figure 10 illustrates the relationship between the F-APs’ transmission power and STP, delay, and EE. A logistic growth in the STP of the Uniform scheme with the F-APs’ transmission power is observed, which is due to the gained improvement in disseminating the contents by direct F-APs. The STP of the proposed and Popular schemes increases first due to the improvement in disseminating the contents by F-APs. Then, STP decreases until it reaches a convergence value, which is due to the high interference originating from F-APs that degrades the performance of delivering the requested contents by C-APs to transit F-APs as the proposed and Popular schemes are highly relying on operating F-APs in the transit mode. That is to say, the proposed and Popular schemes have their optimal F-APs’ transmission power for STP. We can observe that the delay of all schemes decreases first with the F-APs’ transmission power as a result of the lower delays of the links between F-APs and the end-user. Then, it increases after reaching the optimal value, which is due to high average delays of the links between C-APs and F-APs owing to the high generated interference by F-APs. The figure demonstrates that the EE of all schemes follows a quasi-concave trend, and each scheme has its optimal value of F-APs’ transmission power for EE. This behavior of EE can be explained as follows. First, the increase in the F-APs’ transmission power leads to higher SE and lower delay, i.e., lower number of the required time slots for successful delivery, which improves the performance of EE. However, when the F-APs’ transmission power bounds to a value, EE begins to decrease as the growth in the power consumption is not accompanied with improvements in the SE and the number of required time slot for successful delivery. The figure also shows that the proposed caching scheme performs better than the benchmark caching schemes.
Figure 11 illustrates the relationship between the C-APs’ transmission power and STP, delay, and EE. The figure shows that the STP of the Uniform scheme decreases with the C-APs’ transmission power, which is because the gained improvement in fetching the contents from C-APs by transit F-APs is very low owing to the low probability of association with the transit F-APs, which cannot compensate the higher generated interference that degrades the performance of the direct F-APs that dominate the performance of the scheme. Even if the probability of utilizing transit F-APs is very low in the Uniform scheme, the delays over the links between C-APs and transit F-APs is extremely high when the C-APs’ transmission power is below 40 dBm, which in turns results in high average delays of the scheme. However, with the increase in the C-APs’ transmission power, the average delay of the Uniform scheme becomes lower. Then, it increases fast when the interference originating from the F-APs starts to severely impact the performance of the F-APs. The same behavior of the delay is observed in the proposed and Popular schemes. However, both schemes achieve lower optimum delays than the Uniform scheme as both utilize transit F-APs more. The figure also shows the EE of the Uniform scheme decreases with the C-APs’ transmission power, which is because the gained improvement in the performance of the transit F-APs by the higher power consumption cannot compensate the degradation in the performance of direct F-APs caused by the higher interference as the scheme is dominated by direct F-APs. It is observed that the STP and EE of the proposed and Popular schemes increase first with the C-APs’ transmission power, which is due to performance improvement on the links from C-APs to transit F-APs. After reaching the optimal value, the STP and EE of the proposed and Popular schemes start to decrease with the C-APs’ transmission power as the performance degradation on the links between F-APs and the end-user caused by the higher interference becomes higher than the performance improvement on the links from C-APs to transit F-APs. Finally, we can observe that the proposed scheme always outperforms the benchmark schemes as a result of optimizing the cache placement.

6. Limitations and Future Research Directions

This paper addresses the problem of obtaining the optimal cache placement that minimizes the delay or maximizes the STP or EE in wireless backhauled F-RAN, where it is assumed that STP, delay, and EE have equal importance, i.e., the fitness function is evenly weighted. Many NCSA iterations were required to balance the performance of the examined scenario due to the high sensitivity of the objective function. However, with the higher sensitive scenarios toward one of the metrics, a higher performance corresponding to that metric can be obtained with a lower number of iterations and thus a lower time complexity. Moreover, the proposed caching scheme does not address the impacts of the F-APs’ cache size and transmission techniques (e.g., unicast and multicast) on the optimal cache placement and the performance of the caching scheme.
It is worth highlighting that the performance of the wireless backhauling adopted by this paper can be further improved using node clustering mechanisms [38]. Moreover, machine learning approaches [39] can be utilized to obtain the optimal cache placement based on predicting the content popularity and the user’s mobility and preferences.

7. Concluding Remarks

In this paper, the problem of jointly optimizing STP, delay, and EE in wireless backhauled cache-enabled F-RAN is addressed. First, stochastic geometry tools are used to derive the closed-form expressions of the association probabilities with the direct and transit F-APs. Then, the expressions of STP, delay, and EE are derived by carefully handling the different types of interfering access points. The joint caching optimization problem is formulated to obtain the optimal cache placement that maximizes the weighted sum of STP, delay, and EE. The optimal solution of the caching problem is obtained using NCSA, which is a novel modified version of CSA that assures the feasibility of the solutions by subjecting them to bounding and normalization operations. The numerical simulation evaluated and analyzed the performance of the proposed caching for different network parameters, where it was observed that the proposed caching scheme outperforms the well-known benchmark caching, and it can effectively improve STP, delay, and EE, where an average improvement by up to 15% higher STP, 45% lower delay, and 350% higher EE over the benchmark caching schemes was observed. It was also observed that the wireless backhauling of the F-APs to take advantage of the centralized caching provided by the C-APs and to improve the STP is accompanied with higher average delays and lower EEs. Therefore, a trade-off between those metrics is needed to achieve the desired performance.

Author Contributions

Conceptualization, A.B.-B., M.N.H., W.R.W., K.D., and T.F.T.M.N.I.; methodology, A.B.-B. and M.N.H.; software, A.B.-B. and M.N.H.; validation, K.D. and T.F.T.M.N.I.; formal analysis, A.B.-B. and M.N.H.; investigation, M.N.H. and K.D.; resources, M.N.H., W.R.W., and K.D.; data curation, A.B.-B. and M.N.H.; writing—original draft preparation, A.B.-B. and M.N.H.; writing—review and editing, W.R.W., K.D., and T.F.T.M.N.I.; visualization, A.B.-B., M.N.H., W.R.W., K.D., and T.F.T.M.N.I.; supervision, M.N.H., W.R.W., and K.D.; project administration, K.D. and T.F.T.M.N.I.; and funding acquisition, K.D., W.R.W., and T.F.T.M.N.I. All authors have read and agreed to the published version of the manuscript.

Funding

This research was funded by Fundamental Research Grant Scheme (FRGS) grant numbers FP014-2020 and FRGS/1/2020/TK0/UM/02/39.

Conflicts of Interest

The authors declare no conflict of interest. The funder had no role in the design of the study; in the collection, analyses, or interpretation of data; in the writing of the manuscript, or in the decision to publish the results.

Appendix A. Proof of Lemma 1

The point process of the direct F-APs with respect to content m is simply the point process of F-APs caching content m, i.e., Φ m Φ F , which is a thinned PPP with a density of p m λ F . Denote N ( F m ) as the number of F-APs caching content m within R. Then, A m , d can be obtained as follows
A m , d Pr [ N ( F m ) > 0 ] = 1 Pr [ N F m = 0 ]
Next, using the null property of PPP, we have Pr [ N F m = 0 ] = exp π p m λ F R 2 , which completes the proof.

Appendix B. Proof of Lemma 2

Denote Y μ { 0 , 1 } as the random variable of whether content μ is being requested by the users within the Voronoi cell of the F-AP caching μ , where Y μ = 0 represents the event of μ being inactive (i.e., not requested). Then, using Proposition 1 of [40], the probability of this event b μ = P r Y μ = 0 can be calculated by (7).
By definition, the available F-AP with respect to content m is a F-AP that does not cache content m and caches an inactive content. Accordingly, the probability of the available F-APs when content m is requested can be expressed as
Λ m = P r [ F A P   c a c h e   i n a c t i v e   c o n t e n t m ] = μ M \ m p μ b μ
where the second equality is obtained by noting that the probability of caching the inactive content μ M \ m at a F-AP is p μ b μ , Thus, the probability of the available F-APs is obtained by summing over all the elements of M \ m . Accordingly, the point process of the available F-APs Φ a , m Φ F can be viewed as a thinned PPP with density Λ m λ F . Noting that u 0 is associated with a transit F-AP if a F-AP caching content m does not exist within R and there exists at least a one available F-AP within R, the probability of association with a transit F-AP when content m is requested by u 0 can be obtained as follows:
A m , t P r N F m = 0 , N F a > 0 = P r [ N F m = 0 ] P r [ N F a > 0 ] = P r [ N F m = 0 ] 1 P r [ N F a = 0 ]
where N F a is the number of available F-APs and the second equality is due to N F m and N F a being independent events. Finally, by the null property of PPP, we have (5).

Appendix C. Proof of Theorem 1

The conditional STP q m , 0 , D 0 , 0 ( p , d ) conditioned on the distance D 0 , 0 = d [ 0 , R ] can be expressed as follows
q m , 0 , D 0 , 0 ( p , d ) Pr W F log 2 1 + S I R m , 0 ξ | D 0 , 0 = d = E I m , I m , I C Pr | h 0 , 0 | 2 s I m + I m + I C = E I m , I m , I C exp s I m + I m + I C = E I m exp s I m L I m ( s , d ) E I m exp s I m L I m ( s , d ) E I C exp s I C L I C ( s , d )
where s = 2 ξ W F 1 d α , I m l Φ m \ F m , 0 D l , 0 α | h l , 0 | 2 , I m l Φ m D l , 0 α | h l , 0 | 2 , and I C l Φ C D l , 0 α | h l , 0 | 2 P C P F represents the interference originating from the F-APs caching content m, the F-APs not caching content m, and the C-APs, respectively. L I m ( s , d ) , L I m ( s , d ) , and L I C ( s , d ) are their Laplace transforms, respectively. The third equality is obtained by noting that | h | 2 d exp ( 1 ) and the fourth equality is due to the independence of the Rayleigh fading channels and the independence of the PPPs. Next, the Laplace transform of the interference L I m ( s , d ) can be calculated as follows:
L I m ( s , d ) = E exp s l Φ m \ F m , 0 D l , 0 α | h l , 0 | 2 = E l Φ m \ F m , 0 exp s D l , 0 α | h l , 0 | 2 = exp 2 π p m λ F d 1 1 1 + s r α r d r = exp 2 π α p m λ F s 2 α β 2 α , 1 2 α , 1 1 + s d α = exp 2 π α p m λ F 2 ξ W F 1 2 α d 2 β 2 α , 1 2 α , 2 ξ W F
where the probability generating functional is used to obtain the third equality [29], while the fourth equality is obtained by changing s r 1 / α to t, then 1 / ( 1 + t α ) to w. Following the same procedure above, and noting that Φ m is of density ( 1 p m ) λ F , we have
L I m ( s , d ) = exp 2 π α 1 p m λ F 2 ξ W F 1 2 α d 2 β 2 α , 1 2 α
L I C ( s , d ) = exp 2 π α λ C 2 ξ W F 1 2 α d 2 β 2 α , 1 2 α P C P F
Accordingly, the conditional STP can be expressed as follows
q m , 0 , D 0 , 0 ( p , d ) = exp π p m λ F U p d 2
where U p is given in (11). As Φ m is a homogeneous PPP with density p m λ F , the PDF of D 0 , 0 can be expressed as
f D 0 , 0 ( d ) = 2 π p m λ F d exp π p m λ F d 2
Then, the STP of content m can be obtained by removing the condition on the distance as follows:
q m , 0 ( p ) = 0 R q m , 0 , D 0 , 0 ( p , d ) f D 0 , 0 ( d ) d d = 2 π p m λ F 0 R d exp π p m λ F 1 + U p d 2 d d
Finally, (10) is obtained by solving the integral.

Appendix D. Proof of Theorem 2

Denote I a l Φ a , m \ F a , 0 D l , 0 α | h l , 0 | 2 , and I a l Φ a , m D l , 0 α | h l , 0 | 2 as the interference at u 0 originating from the available and unavailable F-APs, respectively. Then, the conditional STP of content m over the link from the available F-AP F a , 0 to u 0 conditioned on D a , 0 = d [ 0 , R ] can be expressed as follows
q a , 0 , D a , 0 ( p , d ) = L I a ( s , d ) L I a ( s , d ) L I C ( s , d )
where L I a ( s , d ) and L I a ( s , d ) are the Laplace transforms of I a and I a , respectively. As in (A5), L I a ( s , d ) and L I a ( s , d ) can be obtained as follows
L I a ( s , d ) = exp 2 π α Λ m λ F 2 ξ W F 1 2 α d 2 β 2 α , 1 2 α , 2 ξ W F
L I a ( s , d ) = exp 2 π α 1 Λ m λ F 2 ξ W F 1 2 α d 2 β 2 α , 1 2 α
Note that L I C ( s , d ) is given in (A7). Then, we have
q a , 0 , D a , 0 ( p , d ) = exp π Λ m λ F V p d 2
where V p is given in (16).
In the same manner, the conditional STP of content m over the link between F a , 0 and the nearest C-AP C 0 conditioned on D C , a = d [ 0 , ] can be expressed as follows:
q C , a , D C , a ( p , d ) = L I C 0 ( s ˜ , d ) L I F a ( s ˜ , d )
where s ˜ = 2 M ξ W C 1 d α , L I C 0 ( s ˜ , d ) and L I F a ( s ˜ , d ) are the Laplace transforms of I C 0 l Φ C \ C 0 D l , a α | h l , a | 2 and I F a l Φ F \ F a , 0 D l , a α | h l , a | 2 P F P C , which are the interference at F a , 0 from the C-APs and F-APs, respectively. Next, L I C 0 ( s ˜ , d ) and L I F a ( s ˜ , d ) can be calculated as follows
L I C 0 ( s ˜ , d ) = exp 2 π α λ C 2 M ξ W C 1 2 α d 2 β 2 α , 1 2 α , 2 M ξ W C
L I F a ( s ˜ , d ) = exp 2 π α λ F 2 M ξ W C 1 2 α d 2 β 2 α , 1 2 α P F P C
Then, q C , a , D C , a ( p , d ) can be expressed as
q C , a , D C , a ( p , d ) = exp π λ C G d 2
where G is given in (17). Noting that the PDFs of D a , 0 and D C , a are given by
f D a , 0 ( d ) = 2 π Λ m λ F exp π Λ m λ F d 2
f D C , a ( d ) = 2 π λ C d exp π λ C d 2
Then, the condition on that distance can be removed as follows:
q a , 0 ( p ) = 0 R q a , 0 , D a , 0 ( p , d ) f D a , 0 ( d ) d d
q C , a ( p ) = 0 q C , a , D C , a ( p , d ) f D C , a ( d ) d d
Finally, (15) is obtained by solving the above integrals, and then substituting them into (12).

References

  1. Habibi, M.A.; Nasimi, M.; Han, B.; Schotten, H.D. A Comprehensive Survey of RAN Architectures Toward 5G Mobile Communication System. IEEE Access 2019, 7, 70371–70421. [Google Scholar] [CrossRef]
  2. Hu, Z.; Hu, C.; Li, Z.; Li, Y.; Wei, G. Power allocation for video segment based caching strategy in F-RAN architecture. China Commun. 2021, 18, 215–227. [Google Scholar] [CrossRef]
  3. Bani-Bakr, A.; Dimyati, K.; Hindia, M.N.; Wong, W.R.; Al-Omari, A.; Sambo, Y.A.; Imran, M.A. Optimizing the Number of Fog Nodes for Finite Fog Radio Access Networks under Multi-Slope Path Loss Model. Electronics 2020, 9, 2175. [Google Scholar] [CrossRef]
  4. Bani-Bakr, A.; Dimyati, K.; Hindia, M.N.; Wong, W.R.; Imran, M.A. Feasibility study of 28 GHz and 38 GHz millimeter-wave technologies for fog radio access networks using multi-slope path loss model. Phys. Commun. 2021, 101401. [Google Scholar] [CrossRef]
  5. Emara, M.; Elsawy, H.; Sorour, S.; Al-Ghadhban, S.; Alouini, M.S.; Al-Naffouri, T.Y. Optimal Caching in 5G Networks With Opportunistic Spectrum Access. IEEE Trans. Wirel. Commun. 2018, 17, 4447–4461. [Google Scholar] [CrossRef]
  6. Wang, R.; Li, R.; Wang, P.; Liu, E. Analysis and Optimization of Caching in Fog Radio Access Networks. IEEE Trans. Veh. Technol. 2019, 68, 8279–8283. [Google Scholar] [CrossRef]
  7. Peng, A.; Jiang, Y.; Bennis, M.; Zheng, F.C.; You, X. Performance Analysis and Caching Design in Fog Radio Access Networks. In Proceedings of the 2018 IEEE Globecom Workshops (GC Wkshps), Abu Dhabi, UAE, 9–13 December 2018; pp. 1–6. [Google Scholar] [CrossRef] [Green Version]
  8. Jiang, F.; Yuan, Z.; Sun, C.; Wang, J. Deep Q-Learning-Based Content Caching With Update Strategy for Fog Radio Access Networks. IEEE Access 2019, 7, 97505–97514. [Google Scholar] [CrossRef]
  9. Jiang, Y.; Ma, M.; Bennis, M.; Zheng, F.C.; You, X. User Preference Learning-Based Edge Caching for Fog Radio Access Network. IEEE Trans. Commun. 2019, 67, 1268–1283. [Google Scholar] [CrossRef] [Green Version]
  10. Jia, S.; Ai, Y.; Zhao, Z.; Peng, M.; Hu, C. Hierarchical content caching in fog radio access networks: Ergodic rate and transmit latency. China Commun. 2016, 13, 1–14. [Google Scholar] [CrossRef]
  11. Liu, J.; Bai, B.; Zhang, J.; Letaief, K.B. Cache Placement in Fog-RANs: From Centralized to Distributed Algorithms. IEEE Trans. Wirel. Commun. 2017, 16, 7039–7051. [Google Scholar] [CrossRef] [Green Version]
  12. Wei, X. Joint Caching and Multicast for Wireless Fronthaulin Fog Radio Access Networks. In Proceedings of the 2017 IEEE 86th Vehicular Technology Conference (VTC-Fall), Toronto, ON, Canada, 24–27 September 2017; pp. 1–5. [Google Scholar] [CrossRef]
  13. Li, Z.; Chen, J.; Zhang, Z. Socially Aware Caching in D2D Enabled Fog Radio Access Networks. IEEE Access 2019, 7, 84293–84303. [Google Scholar] [CrossRef]
  14. Dang, T.; Peng, M. Joint Radio Communication, Caching, and Computing Design for Mobile Virtual Reality Delivery in Fog Radio Access Networks. IEEE J. Sel. Areas Commun. 2019, 37, 1594–1607. [Google Scholar] [CrossRef]
  15. Wei, Y.; Yu, F.R.; Song, M.; Han, Z. Joint Optimization of Caching, Computing, and Radio Resources for Fog-Enabled IoT Using Natural Actor–Critic Deep Reinforcement Learning. IEEE Internet Things J. 2019, 6, 2061–2073. [Google Scholar] [CrossRef]
  16. Jiang, Y.; Hu, Y.; Bennis, M.; Zheng, F.C.; You, X. A Mean Field Game-Based Distributed Edge Caching in Fog Radio Access Networks. IEEE Trans. Commun. 2020, 68, 1567–1580. [Google Scholar] [CrossRef] [Green Version]
  17. Guo, B.; Zhang, X.; Sheng, Q.; Yang, H. Dueling Deep-Q-Network Based Delay-Aware Cache Update Policy for Mobile Users in Fog Radio Access Networks. IEEE Access 2020, 8, 7131–7141. [Google Scholar] [CrossRef]
  18. Rahman, G.M.S.; Peng, M.; Yan, S.; Dang, T. Learning Based Joint Cache and Power Allocation in Fog Radio Access Networks. IEEE Trans. Veh. Technol. 2020, 69, 4401–4411. [Google Scholar] [CrossRef]
  19. Althamary, I.; Huang, C.W.; Lin, P.; Yang, S.R.; Cheng, C.W. Popularity-Based Cache Placement for Fog Networks. In Proceedings of the 2018 14th International Wireless Communications Mobile Computing Conference (IWCMC), Limassol, Cyprus, 25–29 June 2018; pp. 800–804. [Google Scholar] [CrossRef]
  20. Xing, H.; Cui, J.; Deng, Y.; Nallanathan, A. Energy-Efficient Proactive Caching for Fog Computing with Correlated Task Arrivals. In Proceedings of the 2019 IEEE 20th International Workshop on Signal Processing Advances in Wireless Communications (SPAWC), Cannes, France, 2–5 July 2019; pp. 1–5. [Google Scholar] [CrossRef] [Green Version]
  21. Wang, K.; Li, J.; Yang, Y.; Chen, W.; Hanzo, L. Content-Centric Heterogeneous Fog Networks Relying on Energy Efficiency Optimization. IEEE Trans. Veh. Technol. 2020, 69, 13579–13592. [Google Scholar] [CrossRef]
  22. Wang, K.; Li, J.; Yang, Y.; Chen, W.; Hanzo, L. Energy-Efficient Multi-Tier Caching and Node Association in Heterogeneous Fog Networks. In Proceedings of the 2020 IEEE 92nd Vehicular Technology Conference (VTC2020-Fall), Victoria, BC, Canada, 4–7 October 2020; pp. 1–5. [Google Scholar] [CrossRef]
  23. Zhang, H.; Liu, X.; Long, K.; Nallanathan, A.; Leung, V.C.M. Energy Efficient Resource Allocation and Caching in Fog Radio Access Networks. In Proceedings of the 2018 IEEE Global Communications Conference (GLOBECOM), Abu Dhabi, UAE, 9–13 December 2018; pp. 1–6. [Google Scholar] [CrossRef]
  24. Bhar, C.; Agrell, E. Energy-and Bandwidth-Efficient, QoS-Aware Edge Caching in Fog-Enhanced Radio Access Networks. IEEE J. Sel. Areas Commun. 2021. [Google Scholar] [CrossRef]
  25. Wan, C.; Jiang, Y.; Zheng, F.C.; Zhu, P.; Gao, X.; You, X. Analysis of Delay and Energy Efficiency in Fog Radio Access Networks with Hybrid Caching. In Proceedings of the 2019 IEEE Globecom Workshops (GC Wkshps), Big Island, HI, USA, 9–13 December 2019; pp. 1–6. [Google Scholar] [CrossRef]
  26. Jiang, Y.; Wan, C.; Tao, M.; Zheng, F.C.; Zhu, P.; Gao, X.; You, X. Analysis and Optimization of Fog Radio Access Networks With Hybrid Caching: Delay and Energy Efficiency. IEEE Trans. Wirel. Commun. 2021, 20, 69–82. [Google Scholar] [CrossRef]
  27. Jiang, Y.; Peng, A.; Wan, C.; Cui, Y.; You, X.; Zheng, F.C.; Jin, S. Analysis and Optimization of Cache-Enabled Fog Radio Access Networks: Successful Transmission Probability, Fractional Offloaded Traffic and Delay. IEEE Trans. Veh. Technol. 2020, 69, 5219–5231. [Google Scholar] [CrossRef]
  28. Bani-Bakr, A.; Hindia, M.N.; Dimyati, K.; Hanafi, E.; Tengku Mohmed Noor Izam, T.F. Multi-Objective Caching Optimization for Wireless Backhauled Fog Radio Access Network. Symmetry 2021, 13, 708. [Google Scholar] [CrossRef]
  29. Haenggi, M.; Ganti, R. Interference in Large Wireless Networks. Found. Trends Netw. 2009, 3, 127–248. [Google Scholar] [CrossRef]
  30. Singhal, C.; De, S. (Eds.) Resource Allocation in Next-Generation Broadband Wireless Access Networks; IGI Global: Hershey, PA, USA, 2017. [Google Scholar] [CrossRef]
  31. Di Renzo, M.; Zappone, A.; Lam, T.T.; Debbah, M. System-Level Modeling and Optimization of the Energy Efficiency in Cellular Networks—A Stochastic Geometry Framework. IEEE Trans. Wirel. Commun. 2018, 17, 2539–2556. [Google Scholar] [CrossRef]
  32. Yang, X.S.; Deb, S. Cuckoo Search via Lévy flights. In Proceedings of the 2009 World Congress on Nature Biologically Inspired Computing (NaBIC), Coimbatore, India, 9–11 December 2009; pp. 210–214. [Google Scholar] [CrossRef]
  33. Vo, D.N.; Schegner, P.; Ongsakul, W. Cuckoo search algorithm for non-convex economic dispatch. IET Gener. Transm. Distrib. 2013, 7, 645–654. [Google Scholar] [CrossRef]
  34. Wei, J.; Yu, Y. An Effective Hybrid Cuckoo Search Algorithm for Unknown Parameters and Time Delays Estimation of Chaotic Systems. IEEE Access 2018, 6, 6560–6571. [Google Scholar] [CrossRef]
  35. Mantegna, R.N. Fast, accurate algorithm for numerical simulation of Lévy stable stochastic processes. Phys. Rev. E 1994, 49, 4677–4683. [Google Scholar] [CrossRef] [PubMed]
  36. Baştuǧ, E.; Bennis, M.; Kountouris, M.; Debbah, M. Cache-enabled small cell networks: Modeling and tradeoffs. EURASIP J. Wirel. Commun. Netw. 2015, 2015, 1–11. [Google Scholar] [CrossRef]
  37. Tamoor-ul-Hassan, S.; Bennis, M.; Nardelli, P.H.J.; Latva-Aho, M. Modeling and analysis of content caching in wireless small cell networks. In Proceedings of the 2015 International Symposium on Wireless Communication Systems (ISWCS), Brussels, Belgium, 25–28 August 2015; pp. 765–769. [Google Scholar] [CrossRef] [Green Version]
  38. Tsiropoulou, E.E.; Mitsis, G.; Papavassiliou, S. Interest-aware energy collection & resource management in machine to machine communications. Ad Hoc Netw. 2018, 68, 48–57. [Google Scholar] [CrossRef]
  39. Huang, X.L.; Ma, X.; Hu, F. Machine Learning and Intelligent Communications. Mob. Netw. Appl. 2018, 23, 68–70. [Google Scholar] [CrossRef] [Green Version]
  40. Yu, S.M.; Kim, S. Downlink capacity and base station density in cellular networks. In Proceedings of the 2013 11th International Symposium and Workshops on Modeling and Optimization in Mobile, Ad Hoc and Wireless Networks (WiOpt), Tsukuba Science City, Japan, 13–17 May 2013; pp. 119–124. [Google Scholar]

Short Biography of Authors

Electronics 10 01847 i002Alaa Bani-Bakr received the B.Sc. and M.Sc. degrees in electrical/telecommunication engineering from Mutah University, Karak, Jordan, in 2002 and 2006, respectively. He is currently pursuing the Ph.D. degree with the University of Malaya, Kuala Lumpur, Malaysia. He was a Lecturer at the Department of Electrical Engineering, AlBaha University, Saudi Arabia, from 2010 to 2012. His research interests are fog radio access networks, cache-enabled wireless networks, mmWave communication systems, stochastic analysis, and optimization.
Electronics 10 01847 i003Kaharudin Dimyati graduated from the University of Malaya, Malaysia, in 1992. He received the Ph.D. degree from the University of Wales Swansea, U.K., in 1996. He is currently a Professor at the Department of Electrical Engineering, Faculty of Engineering, University of Malaya. Since joining the university, he has been actively involved in teaching, postgraduate supervision, research, and administration. To date, he has supervised 15 Ph.D. students and 32 master by research students. He has published over 100 journal articles. He is a member of IET and IEICE. He is a Professional Engineer and a Chartered Engineer.
Electronics 10 01847 i004MHD Nour Hindia received the Ph.D. degree from the Faculty of Engineering in Telecommunication, University of Malaya, Kuala Lumpur, Malaysia, in 2015. He is currently involved with research in the field of wireless communications, especially in channel sounding, network planning, converge estimation, handover, scheduling, and quality of service enhancement for 5G networks. He is currently a Post-Doctoral Fellow from the Faculty of Engineering in Telecommunication, University of Malaya. Besides that, he is involved with research with the Research Group in Modulation and Coding Scheme for Internet of Things for Future Network. He has authored or co-authored a number of science citation index journals and conference papers. Dr. Hindia has participated as a Reviewer and a Committee Member of a number of ISI journals and conferences.
Electronics 10 01847 i005Wei Ru Wong received the B.Eng. and Ph.D. degrees from the Department of Electrical Engineering, University of Malaya, Kuala Lumpur, Malaysia. After receiving the Ph.D. degree, she was a Postdoc with the Integrated Lightwave Research Group, University of Malaya. Her Ph.D. thesis involved the development of long-range surface plasmon-based biosensors for dengue detection. She is currently a Senior Lecturer with the Department of Electrical Engineering, University of Malaya. Her work on the dengue biosensor has received significant press coverage. Her research interests include the development of planar waveguides and optical fibers for sensing applications, especially those implemented using surface plasmons.
Electronics 10 01847 i006Tengku Faiz Tengku Mohmed Noor Izam received the Ph.D. degree in electronic engineering from the University of Surrey, U.K., in 2016. He is currently a Lecturer with the Department of Electrical Engineering, University of Malaya, Malaysia. His research interests include parasitic antenna and MIMO systems with antenna selection.
Figure 1. Illustration of the association model.
Electronics 10 01847 g001
Figure 2. STP, delay, and EE versus the discovery range when M = 20 contents, λ U = 0.1 users/m 2 , λ F = 0.01 F-APs/m 2 , λ C = 0.0001 C-APs/m 2 , γ = 0.8 , α = 4 , P F = 30 dBm, P C = 40 dBm, P s = 37 dBm, ρ = 15.13 , W F = 100 MHz, W C = 500 MHz, T = 1 ms, and τ = 0.1 Mbps.
Electronics 10 01847 g002
Figure 3. STP, delay, and EE versus Zipf exponent when M = 20 contents, λ U = 0.1 users/m 2 , λ F = 0.01 F-APs/m 2 , λ C = 0.0001 C-APs/m 2 , R = 150 m, α = 4 , P F = 30 dBm, P C = 40 dBm, P s = 37 dBm, ρ = 15.13 , W F = 100 MHz, W C = 500 MHz, T = 1 ms, and τ = 0.1 Mbps.
Electronics 10 01847 g003
Figure 4. STP, delay, and EE versus total number of contents when λ U = 0.1 users/m 2 , λ F = 0.01 F-APs/m 2 , λ C = 0.0001 C-APs/m 2 , R = 150 m, γ = 0.8 , α = 4 , P F = 30 dBm, P C = 40 dBm, P s = 37 dBm, ρ = 15.13 , W F = 100 MHz, W C = 500 MHz, T = 1 ms, and τ = 0.01 Mbps.
Electronics 10 01847 g004
Figure 5. STP, delay, and EE versus F-APs’ bandwidth when M = 20 contents, λ U = 0.1 users/m 2 , λ F = 0.01 F-APs/m 2 , λ C = 0.0001 C-APs/m 2 , R = 150 m, γ = 0.8 , α = 4 , P F = 30 dBm, P C = 40 dBm, P s = 37 dBm, ρ = 15.13 , W C = 500 MHz, T = 1 ms, and τ = 0.1 Mbps.
Electronics 10 01847 g005
Figure 6. STP, delay, and EE versus C-APs’ bandwidth when M = 20 contents, λ U = 0.1 users/m 2 , λ F = 0.01 F-APs/m 2 , λ C = 0.0001 C-APs/m 2 , R = 150 m, γ = 0.8 , α = 4 , P F = 30 dBm, P C = 40 dBm, P s = 37 dBm, ρ = 15.13 , W F = 100 MHz, T = 1 ms, and τ = 0.1 Mbps.
Electronics 10 01847 g006
Figure 7. STP, delay, and EE versus user density when M = 20 contents, λ F = 0.01 F-APs/m 2 , λ C = 0.0001 C-APs/m 2 , R = 150 m, γ = 0.8 , α = 4 , P F = 30 dBm, P C = 40 dBm, P s = 37 dBm, ρ = 15.13 , W F = 100 MHz, W C = 500 MHz, T = 1 ms, and τ = 0.1 Mbps.
Electronics 10 01847 g007
Figure 8. STP, delay, and EE versus F-AP density when M = 20 contents, λ U = 0.1 users/m 2 , λ C = 0.0001 C-APs/m 2 , R = 150 m, γ = 0.8 , α = 4 , P F = 30 dBm, P C = 40 dBm, P s = 37 dBm, ρ = 15.13 , W F = 100 MHz, W C = 500 MHz, T = 1 ms, and τ = 0.1 Mbps.
Electronics 10 01847 g008
Figure 9. STP, delay, and EE versus C-AP density when M = 20 contents, λ U = 0.1 users/m 2 , λ F = 0.01 F-APs/m 2 , R = 150 m, γ = 0.8 , α = 4 , P F = 30 dBm, P C = 40 dBm, P s = 37 dBm, ρ = 15.13 , W F = 100 MHz, W C = 500 MHz, T = 1 ms, and τ = 0.1 Mbps.
Electronics 10 01847 g009
Figure 10. STP, delay, and EE versus F-APs’ transmission power when M = 20 contents, λ U = 0.1 users/m 2 , λ F = 0.01 F-APs/m 2 , λ C = 0.0001 C-APs/m 2 , R = 150 m, γ = 0.8 , α = 4 , P C = 40 dBm, P s = 37 dBm, ρ = 15.13 , W F = 100 MHz, W C = 500 MHz, T = 1 ms, and τ = 0.1 Mbps.
Electronics 10 01847 g010
Figure 11. STP, delay, and EE versus F-APs’ transmission power when M = 20 contents, λ U = 0.1 users/m 2 , λ F = 0.01 F-APs/m 2 , λ C = 0.0001 C-APs/m 2 , R = 150 m, γ = 0.8 , α = 4 , P F = 30 dBm, P s = 37 dBm, ρ = 15.13 , W F = 100 MHz, W C = 500 MHz, T = 1 ms, and τ = 0.1 Mbps.
Electronics 10 01847 g011
Table 1. Key notations.
NotationDescription
M , MContent library, total number of contents
Φ U , Φ F , Φ C Point process of end-users, F-APs, C-APs
Φ m , Φ m Point process of the F-APs that cache content m, do not cache content m
Φ a , m , Φ a , m Point process of the available F-APs, unavailable F-APs with respect to content m
λ U , λ F , λ C Density of Φ U , Φ F , Φ C
p , p m Caching distribution, probability of caching content m at each F-AP
a m Probability of randomly requesting content m
b μ Content μ inactive probability
Λ m Probability of the available F-APs with respect to content m
F m , 0 , F a , 0 Direct F-AP, transit F-AP with respect to content m
C 0 Nearest C-AP to F a , 0
A m , d , A m , t , A m Probability of association with F m , 0 , F a , 0 , total probability of association with a F-AP when content m is requested
S I R m , 0 , S I R a , 0 , S I R C , a Signal-to-interference ratio at u 0 when it is associated with F m , 0 , at u 0 when it is associated with F a , 0 , at F a , 0
D 0 , 0 , D , 0 , D a , 0 , D C , a , D , a Distance between F m , 0 and u 0 , access point and u 0 , F a , 0 and u 0 , C 0 and F a , 0 , access point and F a , 0
h 0 , 0 , h , 0 , h a , 0 , h C , a , h , a Small-scale channel coefficient between F m , 0 and u 0 , access point and u 0 , F a , 0 and u 0 , C 0 and F a , 0 , access point and F a , 0
q m , 0 ( p ) , q C , a , 0 ( p ) , q a , 0 ( p ) , q C , a ( p ) STP of content m when u 0 is associated with F m , 0 , when u 0 is associated with F a , 0 , over the link F a , 0 to u 0 , over the link C 0 to F a , 0
q m , 0 , D 0 , 0 ( p , d ) , q a , 0 , D a , 0 ( p , d ) , q C , a , D c , a ( p , d ) q m , 0 ( p ) conditioned on D 0 , 0 = d , q a , 0 ( p ) conditioned on D a , 0 = d , q C , 0 ( p ) conditioned on D C , 0 = d
q p STP of u 0
τ m , 0 ( p ) , τ C , a , 0 ( p ) , τ a , 0 ( p ) , τ C , a ( p ) Average delay of content m when u 0 is associated with F m , 0 , when u 0 is associated with F a , 0 , over the links from F a , 0 to u 0 , over the link from C 0 to F a , 0
τ p Average delay of u 0
κ m , 0 , D m , 0 ( p , d ) , κ C , a , D C , a ( p , d ) , κ a , 0 , D a , 0 ( p , d ) Required number of time slots to successfully receive content m conditioned on the distance over the link from F m , 0 to u 0 , from C 0 to F m , 0 , from F a , 0 to u 0
E E m , d p , E E m , t p EE of content m when u 0 is associated with F m , 0 , F a , 0
E E p EE of u 0
Publisher’s Note: MDPI stays neutral with regard to jurisdictional claims in published maps and institutional affiliations.

