Article

Wearable IoTs and Geo-Fencing Based Framework for COVID-19 Remote Patient Health Monitoring and Quarantine Management to Control the Pandemic

1
Department of Electrical & Computer Engineering, Attock Campus, COMSATS University Islamabad, Punjab 43600, Pakistan
2
School of Information and Electronics Engineering, Korea Aerospace University, Deogyang-gu, Goyang-si 412-791, Gyeonggi-do, Korea
*
Author to whom correspondence should be addressed.
Submission received: 22 May 2021 / Revised: 26 July 2021 / Accepted: 11 August 2021 / Published: 23 August 2021
(This article belongs to the Special Issue Applications for Smart Cyber Physical Systems)

Abstract

:
The epidemic disease of Severe Acute Respiratory Syndrome (SARS) called COVID-19 has become a more frequently active disease. Managing and monitoring COVID-19 patients is still a challenging issue for advanced technologies. The first and foremost critical issue in COVID-19 is to diagnose it timely and cut off the chain of transmission by isolating the susceptible and patients. COVID-19 spreads through close interaction and contact with an infected person. It has affected the entire world, and every country is facing the challenges of having adequate medical facilities along with the availability of medical staff in rural and urban areas that have a high number of patients due to the pandemic. Due to the invasive method of treatment, SARS-COVID is spreading swiftly. In this paper, we propose an intelligent health monitoring framework using wearable Internet of Things (IoT) and Geo-fencing for COVID-19 susceptible and patient monitoring, and isolation and quarantine management to control the pandemic. The proposed system consists of four layers, and each layer has different functionality: a wearable sensors layer, IoT gateway layer, cloud server layer, and client application layer for visualization and analysis. The wearable sensors layer consists of wearable biomedical and GPS sensors for physiological parameters, and GPS and Wi-Fi Received Signal Strength Indicator acquisition for health monitoring and user Geo-fencing. The IoT gateway layer provides a Bluetooth and Wi-Fi based wireless body area network and IoT environment for data transmission anytime and anywhere. Cloud servers use Raspberry Pi and ThingSpeak cloud for data analysis and web-based application layers for remote monitoring based on user consent. The susceptible and patient conditions, real-time sensor’s data, and Geo-fencing enables minimizing the spread through close interaction. The results show the effectiveness of the proposed framework.

1. Introduction

The novel epidemic disease of the coronavirus (COVID-19) is becoming a pandemic and spreading all over the world. COVID-19 first originated in the city of Wuhan in the Hubei Province of China [1]. COVID-19 is a type of Severe Acute Respiratory Syndrome (SARS) that spreads through the minute droplets of respiration via sneezing, coughing, interaction among normal and susceptible or patients in close proximity. The COVID-19 respiratory droplets can be inhaled or transmission spread through the mouth, eyes, or nose by touching the surface where the droplets land. The disease has affected the whole world with about 106,358,244 COVID confirmed cases and 2,320,798 deaths [2]. SARS-COV is transmitted from person to person through close interaction and contact with an infected person. The drops containing the living virus can spread up to three feet and attack another person’s mucous membrane when the patient coughs or sneezes without covering the mouth. People who are in close contact with someone with SARS are at high risk, meaning they live or work with SARS or have direct contact with the person by any means. The SARS-COVID transmission and contamination can be controlled by isolating and remote monitoring of the susceptible and patients. The rapid growth in the use of smart sensors, smart watches, smart phones, and mobile technology in daily life and healthcare sector results in having a significant impact on the world. The healthcare services’ providers and experts are taking advantage of a reduction of invasive methods which lead to the cut-off of transmission of viral diseases. In this paper, we propose a Wearable Internet of Things (WIoTs) based platform for Geo-fencing and remote monitoring of SARS-COVID susceptible and patients.
IoTs provide the capability and enable the integration of heterogeneous physical devices and connecting them to the internet [3]. IoT has evolved and has a significant impact on various areas such as sensors and actuators, real time data analysis, machine learning, and embedded systems [3,4,5]. IoT and the cloud can also provide a platform to acquire human physiological data, shares it on the internet for monitoring and decision-making, and provides alerts in case of an emergency situation. Fangyu [6] proposed Wi-COVID as the 4th Industrial Revolution that incorporates IoT, Artificial Intelligence, and Big Data enabling telemedicine technologies to equip humans with sensors to extract human physiological, biomedical, and surveillance movements in society. SARS and/or COVID both severely affect a human being’s respiratory system, which leads to difficulty in breathing, increase of BPM, fall of SpO 2 level in blood, severe coughing, deviation in ECG signal, and increase in human body temperature [7,8]. In this paper, we propose a body temperature sensor, ECG sensor, GPS Sensor, Wi-Fi Received Signal Strength Indicator, breathing sensor and accelerometer based coughing frequency monitoring, heart rate, and blood oxygen based WIoT platform to Geo-fence the COVID susceptible and patients and monitor their health conditions anytime and anywhere by the physicians, guardians, and other government service provider organizations. 
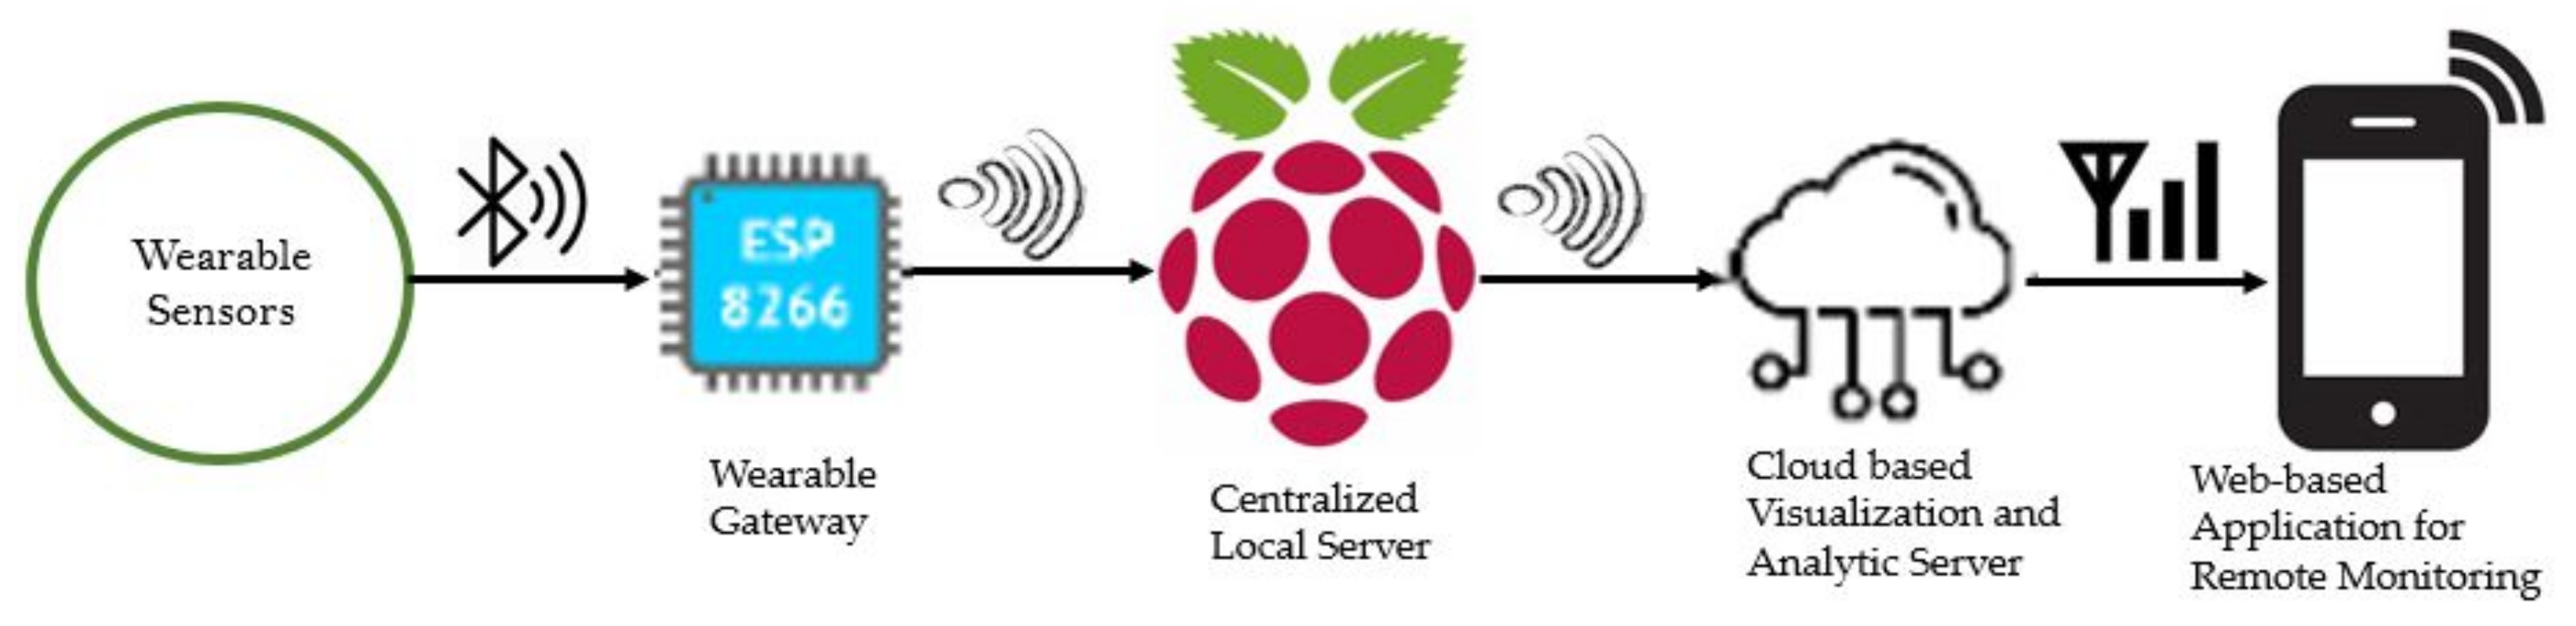
Figure 1 shows the overview of the proposed WIoT based platform for COVID susceptible and patient monitoring that involves various steps.
It is important for the surveillance movements of COVID patients in the society to be diminished. The surge in transmission of the virus in rural areas is due to less medical facilities and no isolation. Regalado et al. [9] discussed the three ways to stop the spread of SARS-COVID: restrictions on the personnel movement in economic and social sectors; the efficient development of vaccinations; and herd immunity. Geo-fencing allows for tracking the COVID-19 susceptible and patients in order to control the pandemic. For analyzing the surveillance movements of patients and depending on the area of isolation, Global Positioning Systems for outdoor environments [10] and Received Signal Strength Indicator (RSSI) of routers for indoor environments [11] are used. In this paper, we propose a Global Positioning System (GPS) and Wi-Fi Received Signal Strength Indicator to isolate and track the susceptible and patients. Since GPS has limitations in an indoor environment so we proposed the Wi-Fi RSSI level to monitor the isolation in an indoor environment. However, in surveillance, the main issue arises due to the privacy and security leakage of the personal identifiable information of the patient. Rahman et al.  [12] suggested that the immigration and hospitals should be ready to share the important and critical information such as the daily movements going in and out of the country, and number of patients with high fever during COVID-19. Using various countries’ case studies, the privacy and security issues associated with SARS-COVID2 prognosis and diagnosis are discussed [13]. Yousaf et al. [14] explained the conflict existing between data access and better service. They suggested the permission (consents) collection for the COVID-19 patients’ data collection and disclosure. In this paper, we propose one-time password based user registration, consent based data collection and sharing, and pseudonyms for the user information, but this is not within the scope of this article.

2. Background and Related Works

In 2003, due to SARS, and currently due to COVID-19, patients died due to uncontrollable transmission of these viruses and unavailability of doctors and physicians’ guidelines in remote areas. The system should be implemented which reduces invasive methods [15] and secures doctor’s and physician’s life. The hype of daily cases and deaths of COVID patients world wide are shown in Figure 2 and Figure 3. In this section, we briefly introduce the literature and related works about SARS-COVID diagnosis, monitoring, and isolation techniques remotely.

2.1. SARS and COVID-II Symptoms

SARS (COVID I) and currently COVID-II all have some common symptoms such as difficulty in breathing, fever, high respiration rate, decrease of SpO 2 level in blood, high cough rate, and increase in heartbeat [7,16,17]. Similarly, SARS and COVID-19 directly affect the respiratory system and make clones in the human body that might lead to worse respiratory contact leading to continuous transmission of disease [15]. During the pandemic, the invasive methods [15] cause the transmission of disease among doctors and physicians. Not isolating COVID-19 patients can lead to the continuous spread of the corona virus to family and society members. Due to high fever, respiration rate, etc., the patient can enter into a critical condition. Timely decisions will save the life of COVID-19 patients using remote monitoring [17].

2.2. Patient Classification and Remote Monitoring

IoT helps in remote monitoring, treatment, and diagnosis of COVID patients [17], and machine learning algorithms help to classify normal, asthmatic, and COVID patients. The real-time extracted data and storage help to analyze patient health historical data, which is done using big data [15]. The classification of the patient uses physiological parameters which are extracted from the wearable sensors data [18,19]. Furthermore, these algorithms work based on digital signal processing for the ECG and extracted PPG signal [20]. The real-time sensor’s data allow for categorizing a patient among normal or infected ones [21] using machine learning algorithms, using previous history data, and performing analysis on this data. The IoT platform enabled sharing of the susceptible and patient conditions to the client i.e., doctors and physicians using web-based client applications [19]. Related work for patient classification and remote monitoring is shown in Table 1.

2.3. Sensors and Hardware Platforms for Physiological Parameters’ Extraction

COVID-19 patients need real-time monitoring of respiratory level, body temperature, and heartbeat rate. In literature, various sensors are used which include breathing sensor/respiration sensors [18], electrocardiogram (ECG) sensors [8,21], and SpO 2 sensors [20,24]. All of these sensors provide information to extract real-time information such as heart rate, oxygen level in blood, and deviation in respiration rate [21]. Table 2 shows the literature review about sensors used in health monitoring for physiological parameters.

2.4. RSSI and GPS Based Geo-Fencing

To enclose a patient within a Geo-fence, many types of techniques are used. The GPS works well for the outside environment, but, in indoor isolation, the GPS does not perform well [11,27]. The GPS National Marine Electronics Association (NMEA) gives information about a position in terms of strings that have coordinates i.e., latitude, longitude, and altitude [28,29]. The Geo-fence for in-door purposes can be implemented by the RSSI level of the communication interface such as Bluetooth [27] and RSSI level of Wi-Fi [11]. In this paper, we integrate both the GPS and RSSI-based Geo-fencing to monitor whether the susceptible and patients is inside the isolation and quarantine place or not. The distance from the access point (Wi-Fi) and the patient can be calculated using RSSI power received by the controller [11]. The drawback for Bluetooth RSSI level is the short-range coverage [27]. Thus, we have used the RSSI level of Wi-Fi for indoor environments with GPS integration for outdoor coordinates. Related work for RSSI and Geo-fencing for COVID patients is shown in Table 3.
The contributions of the research can be summarized as:
  • RSSI level and GPS-based Geo-fencing for isolation of COVID-19 susceptible and patients within a geographical area to restrict his/her movement to minimize the spread maximization;
  • Wearable sensors, master–slave Bluetooth, and Wi-Fi-based IoT framework for physiological parameters acquisition and transmission to the server and cloud;
  • Raspberry Pi-based intelligent local server and ThingSpeak for diagnosing and remote monitoring of COVID-19 patients;
  • Web application for patient condition and isolation activity monitoring;
  • Web of Things based Application for the real-time patient monitoring and sensor data visualization by doctors and physicians, and patient in isolation activity monitoring.

3. The Proposed WIoT and Geo-Fencing Based Framework for COVID-19 Susceptible and Patient Remote Monitoring to Control the Pandemic

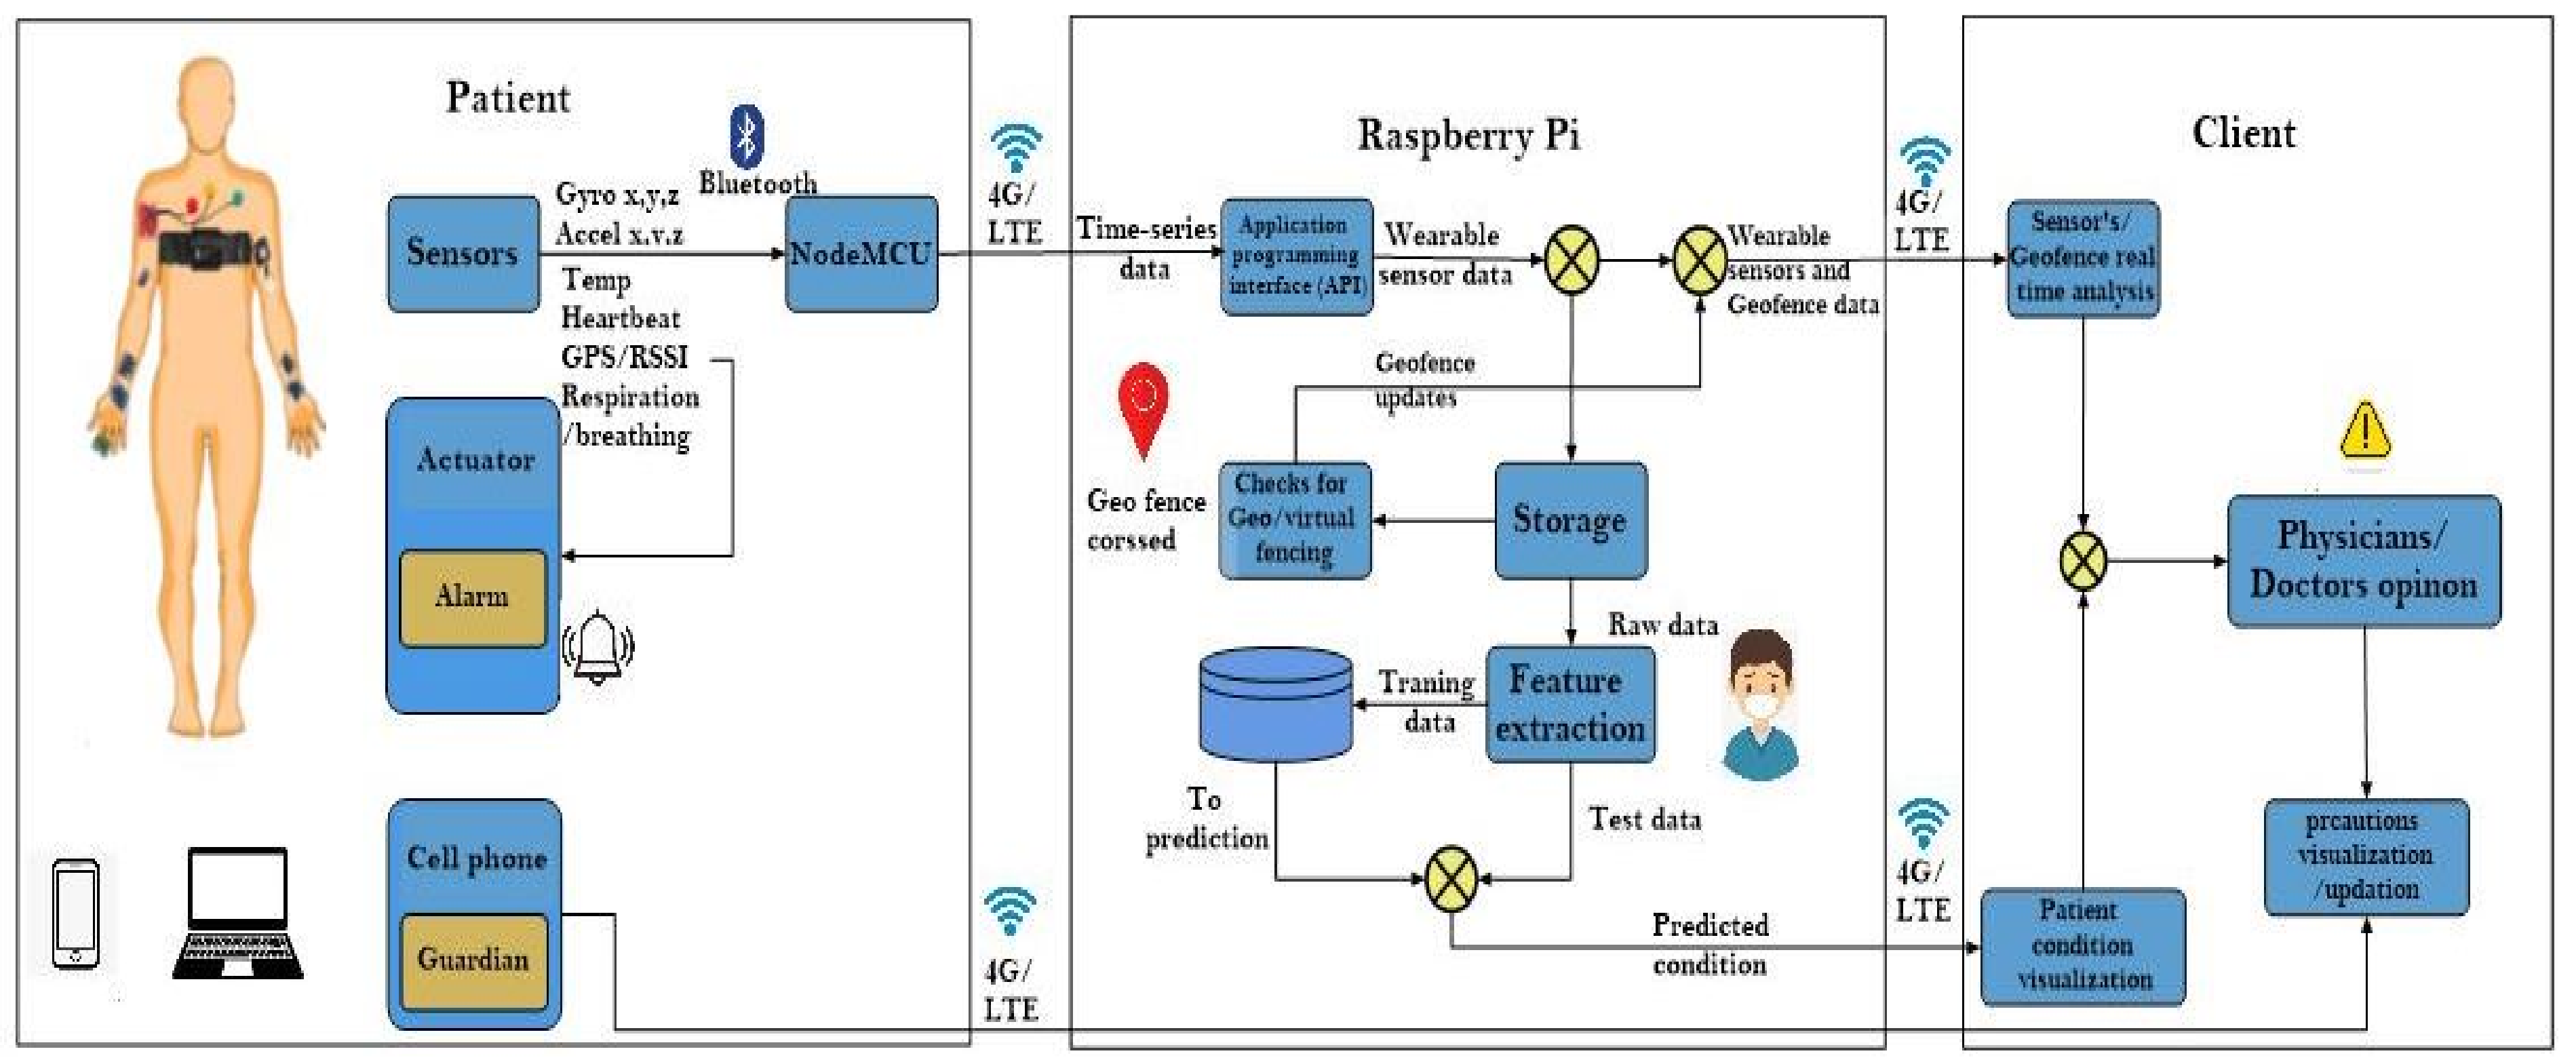
Figure 4 depicts the overview of the proposed architecture to Geo-fence the COVID-19 susceptible and patients and remotely monitoring their health conditions. The proposed system consists of four main modules: (1) Wearable Sensors for physiological data and location information; (2) Bluetooth and Wi-Fi-based wireless transmission of the data; (3) Flask and ThingSpeak cloud servers for data analytic and processing; (4) Web-based Application for remote data and Geo-fence visualization. The proposed system can help to remotely monitor the COVID-19 susceptible and patients to overcome the transmission due to interaction.
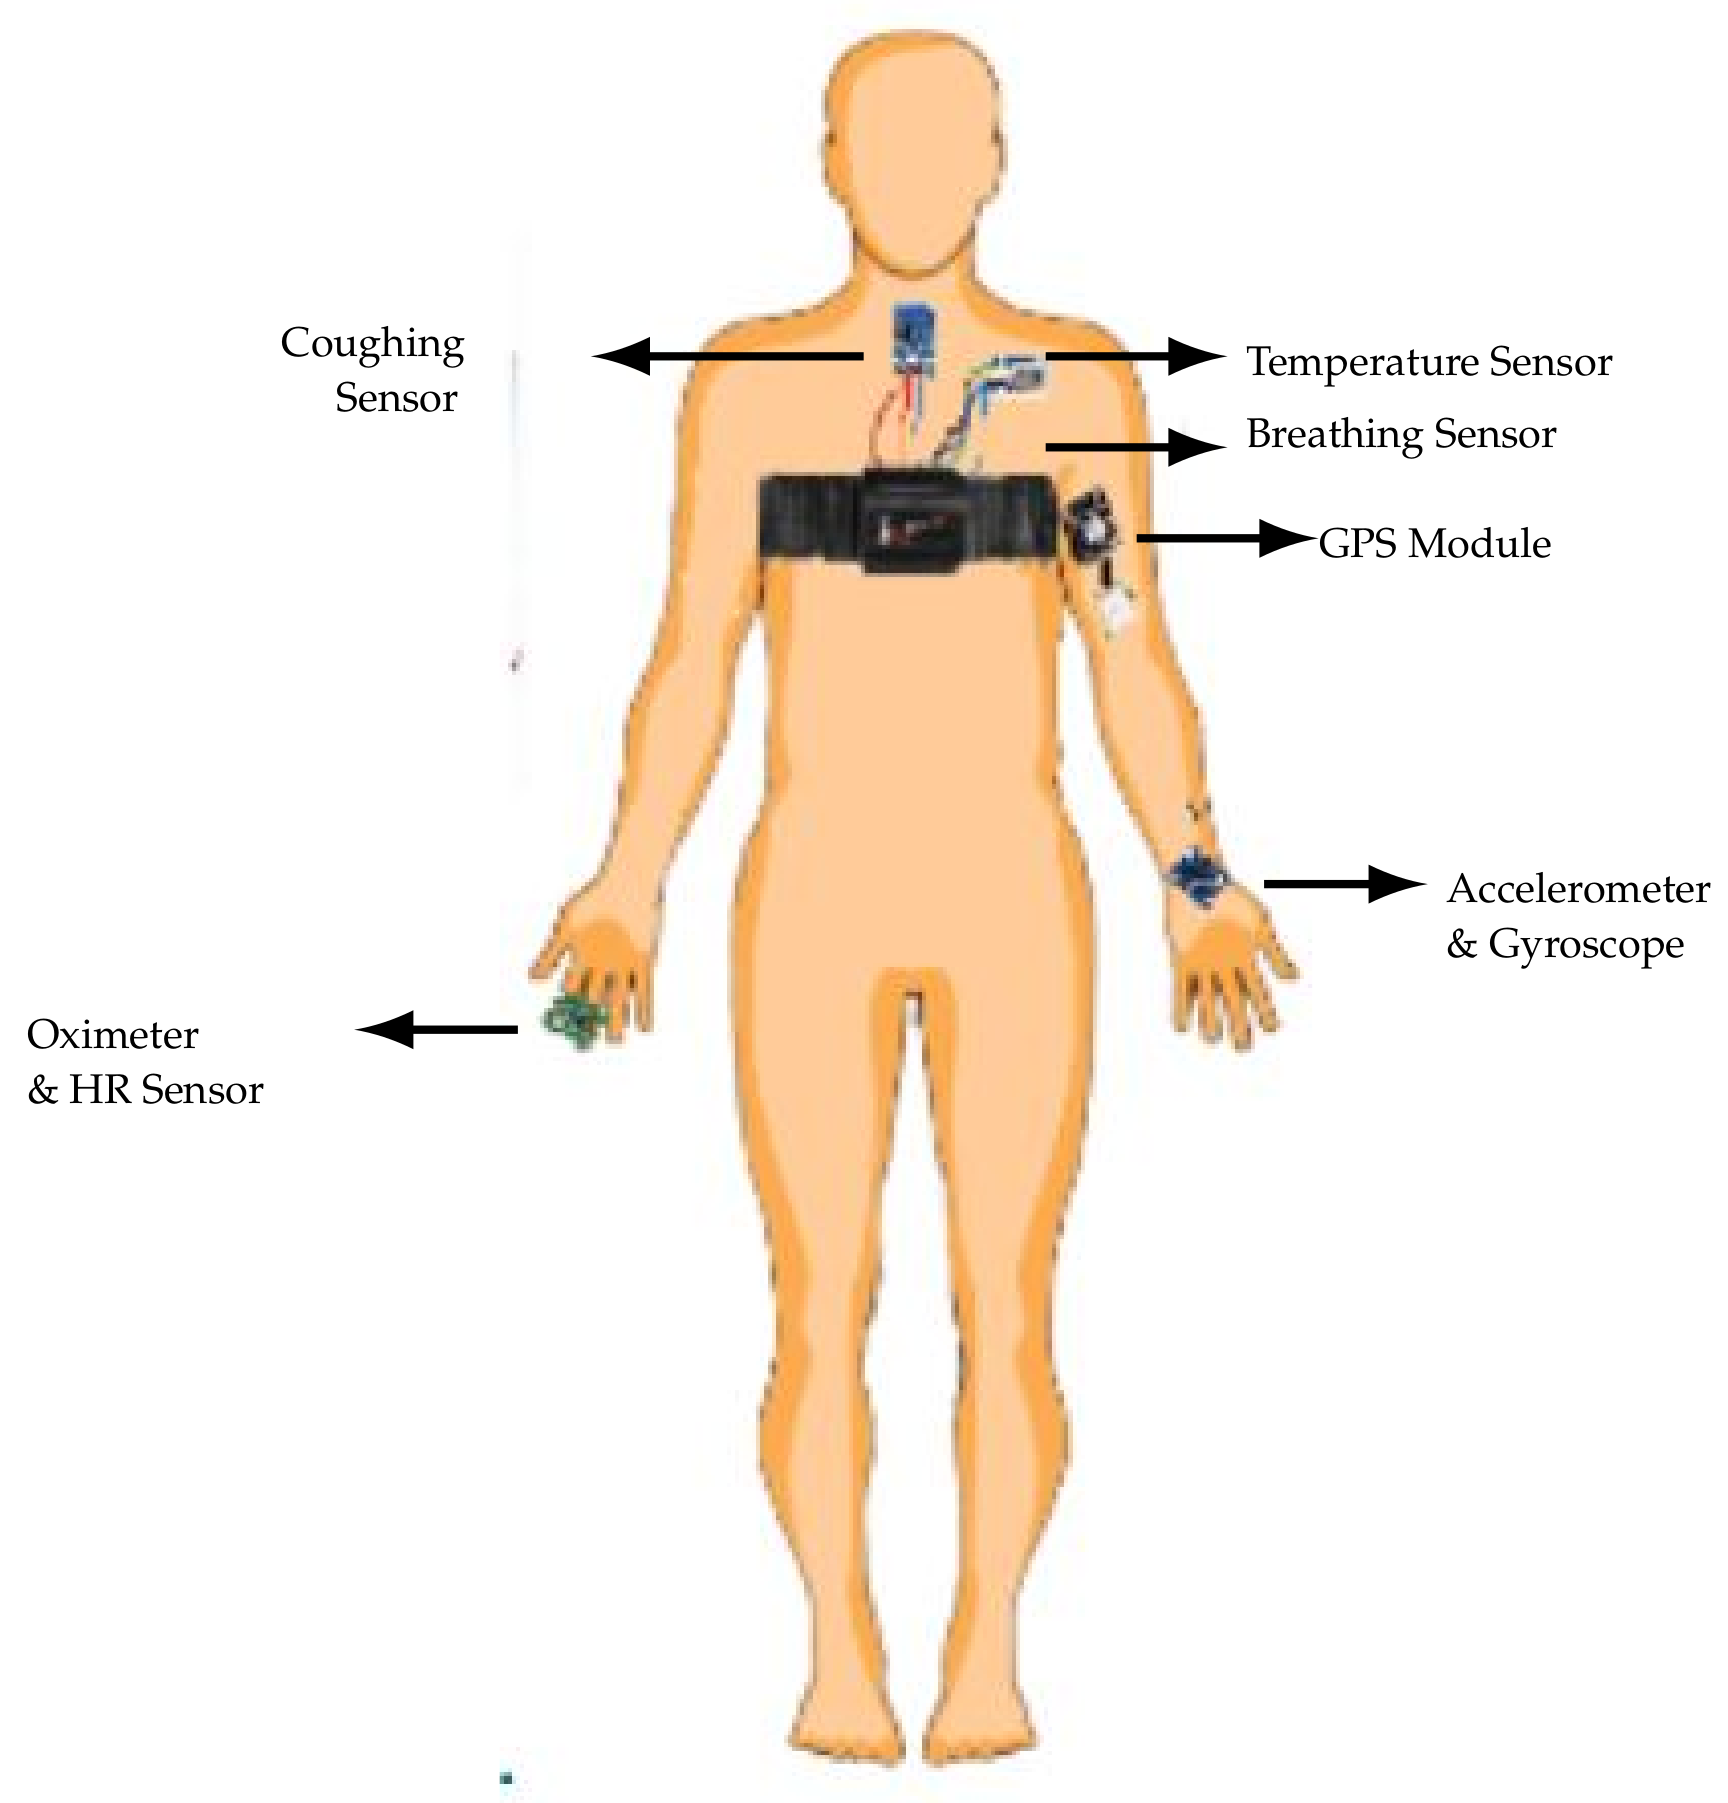
The human body is equipped with wearable biomedical sensors and sensors for surveillance detection, which are placed on left, right, and chest positions of patients, as shown in further details in Figure 5. The physiological biomedical parameters of patient are extracted from the sensors such as Electrocardiogram (ECG), Pulse Oximeter (SpO2), body temperature, respiratory sensor, accelerometer, and gyroscope. We interfaced the Google Map so that the administrator can select the Geo-fence area for the susceptible and patients for quarantine allocation and management. The GPS sensor is installed to send the user location to the server for checking and monitoring the isolation, movement, and Geo-fence of the susceptible and patients. We extract Latitude and Longitude from GPS data. The SpO2, gyroscopes, and accelerometer data are transmitted through Bluetooth to the main-controller installed at the belly position using master–slave Bluetooth configuration. The respiratory, GPS, body temperature, and ECG are directly interfaced with the controller. The NodeMCU (Wi-Fi) is used to enable the Web IoT environment. The NodeMCU sends all the information to the Raspberry Pi and ThingSpeak server to store and remotely visualize.
Figure 6 shows the overall flow chart of the proposed system. The sensors’ initialization is checked to confirm that all sensors output are available. First, the Bluetooth data are sent to the main controller, which sends the data through Wi-Fi to the Raspberry Pi based and ThingSpeak based cloud server. In the server, first the Geo-fence is checked using the GPS and Wi-Fi RSSI to find out whether or not the susceptible/patient crossed the mentioned Geo-fence area. If the Geo-fence area is crossed, the server sends the alert message to the susceptible/patient and the caretaker organizations. After conversion to proper scales and units, the data are visualized in the user web-application.
Since GPS has limitations in an indoor environment, we therefore integrate the Wi-Fi RSSI level with GPS to check the Geo-fence area and actuate alarms in case the Geo-fence is crossed. In an indoor environment, we measured the distance from the Wi-Fi Access Point using the RSSI level. The centralized database i.e., Raspberry Pi is connected to multiple nodemcu for multiple patients’ monitoring. The application peripheral interfaces (API) of Raspberry Pi allows for extracting real-time wearable sensors’ data. These data are stored corresponding to multiple patients ID, age, etc. Using machine learning algorithms, the patient condition is classified which is stored for maintaining historical records of patients’ health. The classified patient condition and real-time sensors data are then sent to a centralized client-based application where doctors and physicians will analyze patients’ health and recommend precautionary measures according to his/her health. These precautionary measures can be accessed by patient and patients’ guardians. In the following subsections, we explained about the breathing rate estimation, oxygen and heart rate estimation, and cough rate estimation.

3.1. Breathing Rate Estimation

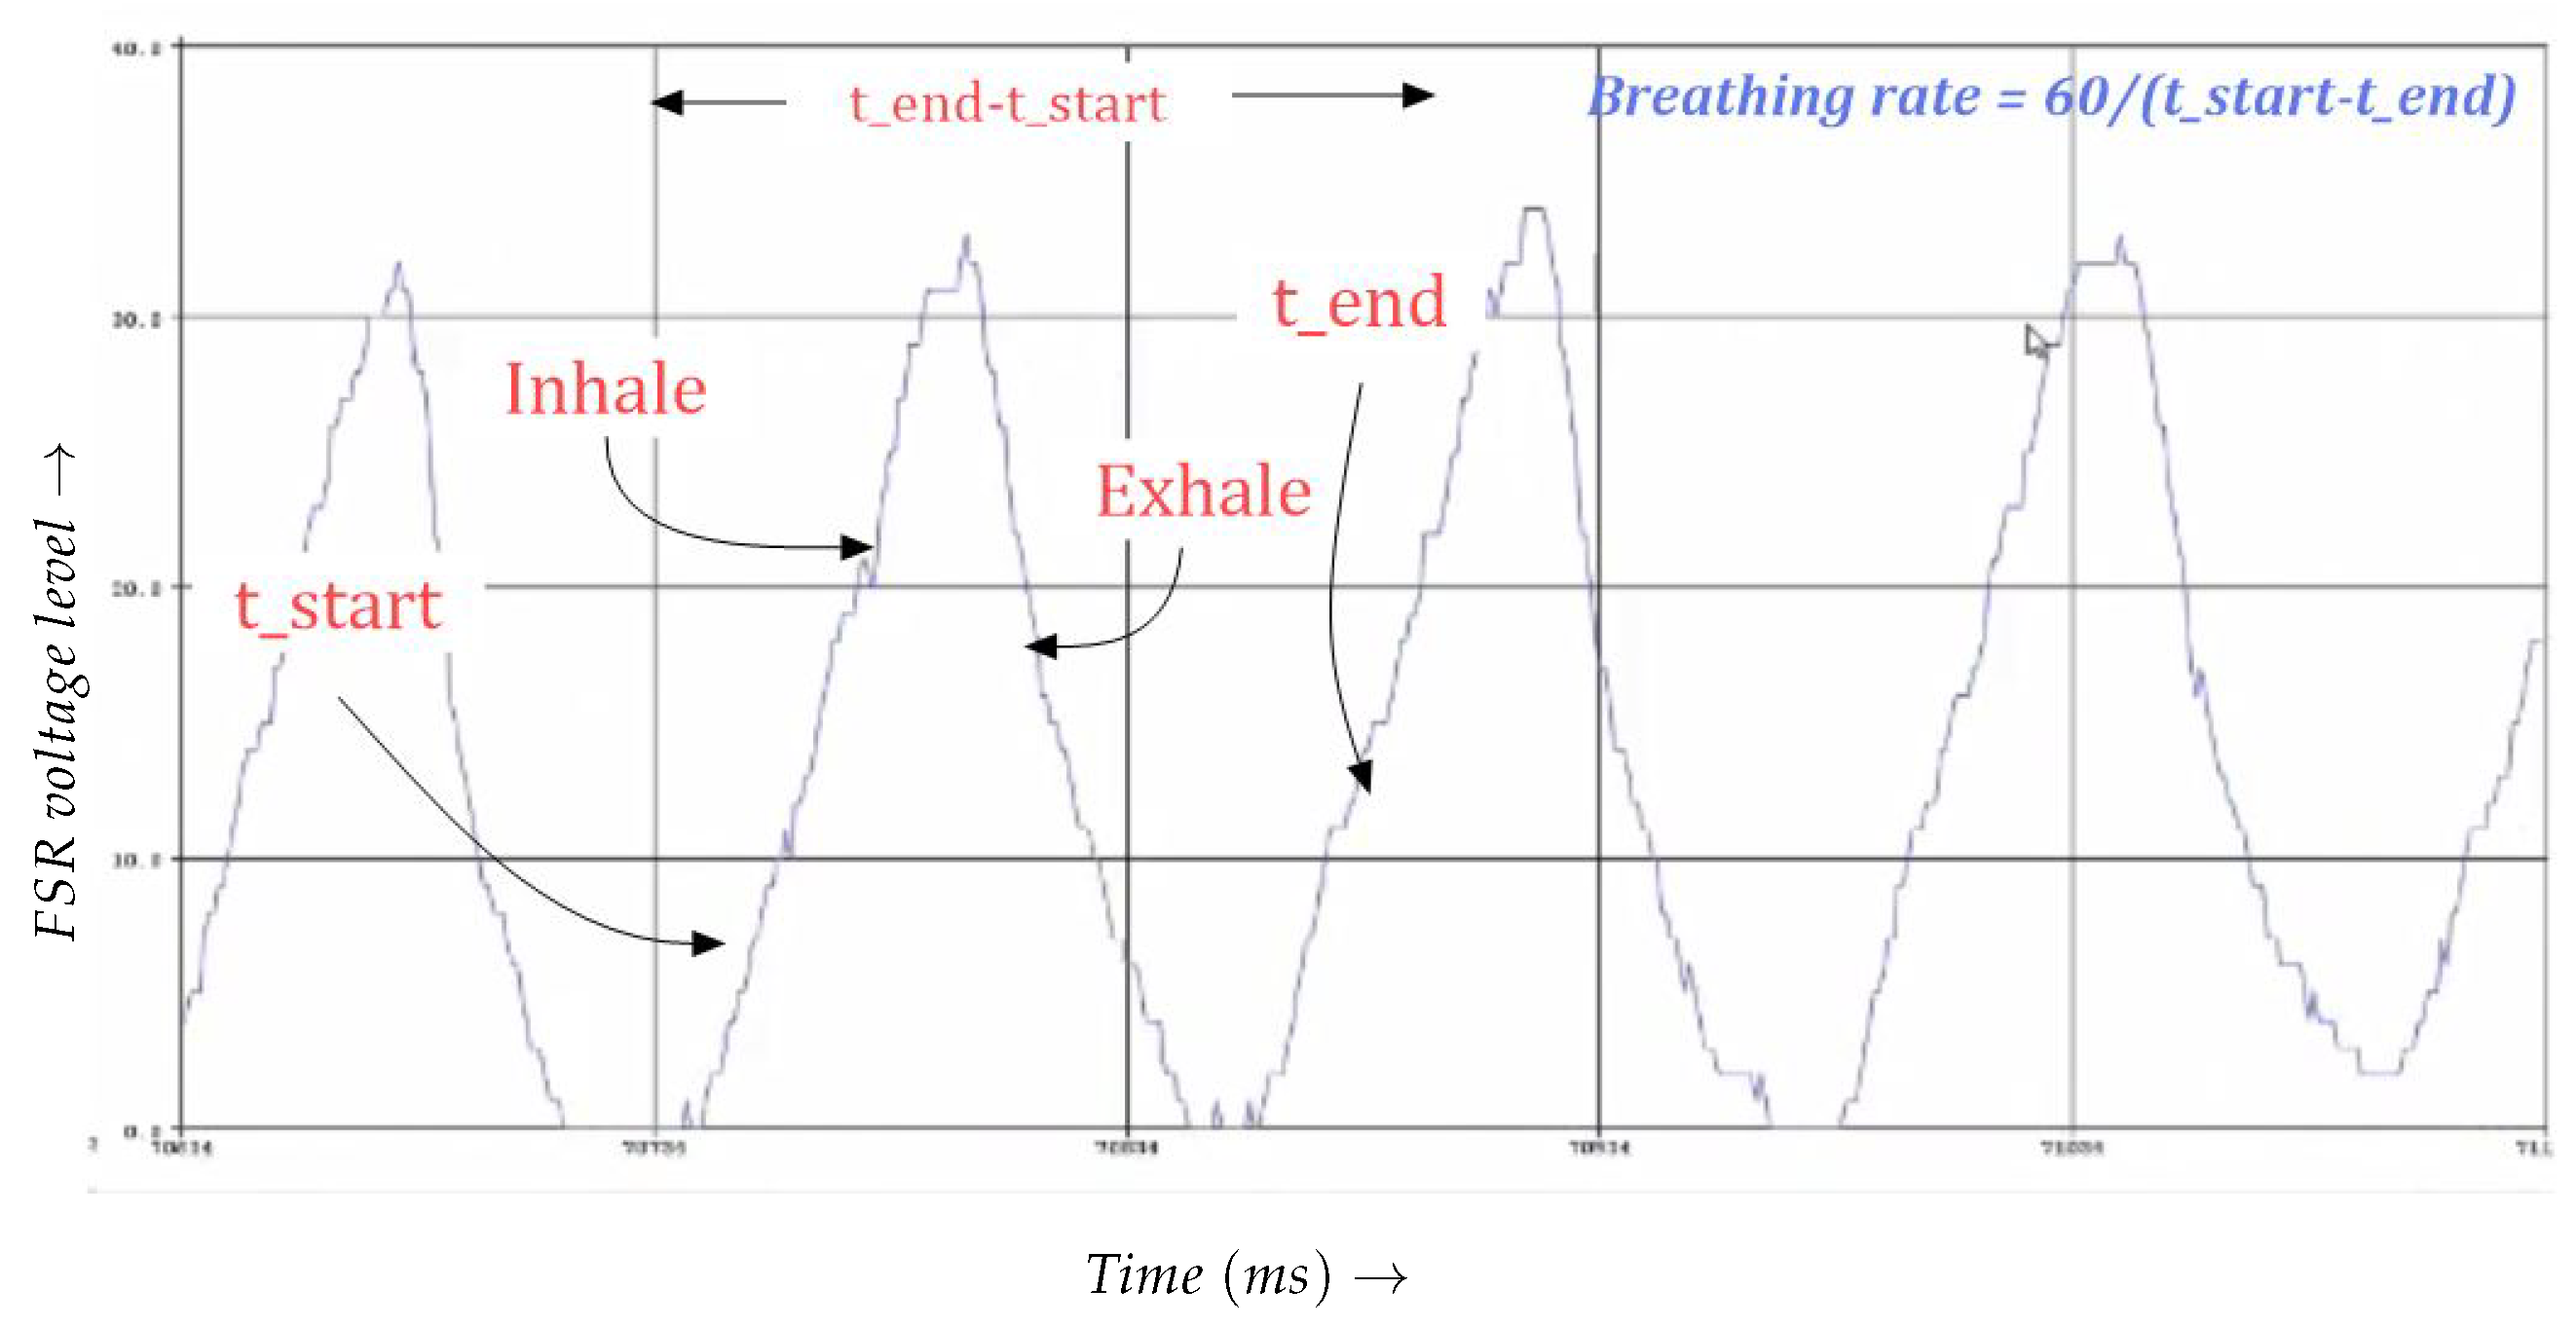
For the extraction of breathing rate, we use the peak detection algorithm by estimating the time difference between two peaks and then dividing it by 60 to get breathing rate per minute. These measurements are done using an FSR sensor and half bridge circuit or voltage divider as shown in Algorithm 1 and as shown in Figure 7.
Algorithm 1 Measuring breathing rate per minute.
1:
f l o a t R i s e _ s t a t u s = 0 ;
2:
function B r e a t h i n g _ R a t e     ▹ Function for finding breathing rate per minute
3:
     f l o a t s t a r t t i m e _ 1 s t _ p e a k ;
4:
     i n t F S R _ p i n =A0
5:
    for  i = 0 to 2 do
6:
         v o l t a g e [ i ] = a n a l o g r e a d ( F S R _ p i n ) 1023 5
7:
    end for
8:
    if  v o l t a g e [ 0 ] > v o l t a g e [ 1 ] > v o l t a g e [ 2 ] R i s e _ s t a t u s = = 0 then  ▹ Uprising peak
9:
         s t a r t t i m e _ 1 s t _ p e a k = m i l l i s ( ) ;
10:
         R i s e _ s t a t u s = 1 ;
11:
    else
12:
        if  v o l t a g e [ 0 ] > v o l t a g e [ 1 ] > v o l t a g e [ 2 ] R i s e _ s t a t u s = = 1  then
13:
            d e l t a = m i l l i s ( ) s t a r t t i m e _ 1 s t _ p e a k ;   ▹ Time difference between last and this peak
14:
            f l o a t b e a t h P e r M i n u t e = 60 1000 d e l t a ;
15:
            R i s e _ s t a t u s = 0 ;
16:
            r e t u r n b e a t h P e r M i n u t e ;
17:
        end if
18:
    end if
19:
end function
20:
void loop ()
21:
f l o a t B r e a t h i n g _ r a t e / m i n ;
22:
B r e a t h i n g _ r a t e / m i n = B r e a t h i n g _ R a t e ( )     ▹ Breathing rate per minute
23:
Output: The breathing rate is extracted accurately.
Figure 7 represents the breathing inhale and exhale waveforms. When the person inhales, the pressure or stress is inserted on the FSR sensor, and the voltage is developed across the static resistor of the voltage divider. This voltage is input into the Arduino controller. The voltage varies and increases when the pressure is inserted into the FSR sensor. The gradual increase on the FSR sensor results in the rising of the waveform as shown in Figure 7. Similarly, when the person exhales, the pressure or stress on the FSR sensor decrease results in descending in the waveform. Hence, using the peak detection algorithms, we obtain the breathing rate per minute.

3.2. S p O 2 and Heart Rate Estimation

The measuring of SpO 2 level in blood and calculation of heartbeat in the left arm of the patient is done using the MAX30102 pulse oximeter. The extraction of these parameters using Arduino is as shown in Algorithm 2.
Algorithm 2 Extracting SpO 2 and Heart rate.
1:
function H e a r t _ R a t e          ▹ Function for finding heart rate
2:
     i n t r e c e i v e d _ i r ;
3:
     i n t r e c e i v e d _ i r = g e t _ i r ( ) ;     ▹ Built in function in Arduino library
4:
    if  c h e c k F o r B e a t ( i r V a l u e ) = = t r u e then       ▹ If beat is detected
5:
         d e l t a = m i l l i s ( ) l a s t B e a t ; ▹ Time difference between last and this beat in mili seconds
6:
         l a s t B e a t = m i l l i s ( ) ;
7:
         b e a t s P e r M i n u t e = 60 1000 d e l t a ;
8:
         r e t u r n b e a t s P e r M i n u t e ;
9:
    end if
10:
end function
11:
void loop ()
12:
i n t O 2 _ l e v e l ;
13:
i n t g e t _ H R ;
14:
g e t _ H R = H e a r t _ R a t e ( )           ▹ Heart rate per minute
15:
O 2 _ l e v e l = 45.060 g e t _ H R g e t _ H R 10000 + 30.354 g e t _ H R 100 + 94.845 ;
16:
Output: The SpO 2 and Hear rate values are extracted.
The red light is emitted from the MAX30102 sensor and, when the finger is pressed, the pulse time is calculated when it beats. This pulse time is saved. As the second beat arrives, it calculates the time difference between the previous and this beat, which shows the time difference in milliseconds. After converting it to pulse rate per minute, we get the resultant heart rate of the patient. Similarly, for the extraction of the SpO 2 level, the formula is given in the built-in library of Arduino where we can extract the oxygenation level in blood corresponding to heart rate.

3.3. Cough Rate Estimation

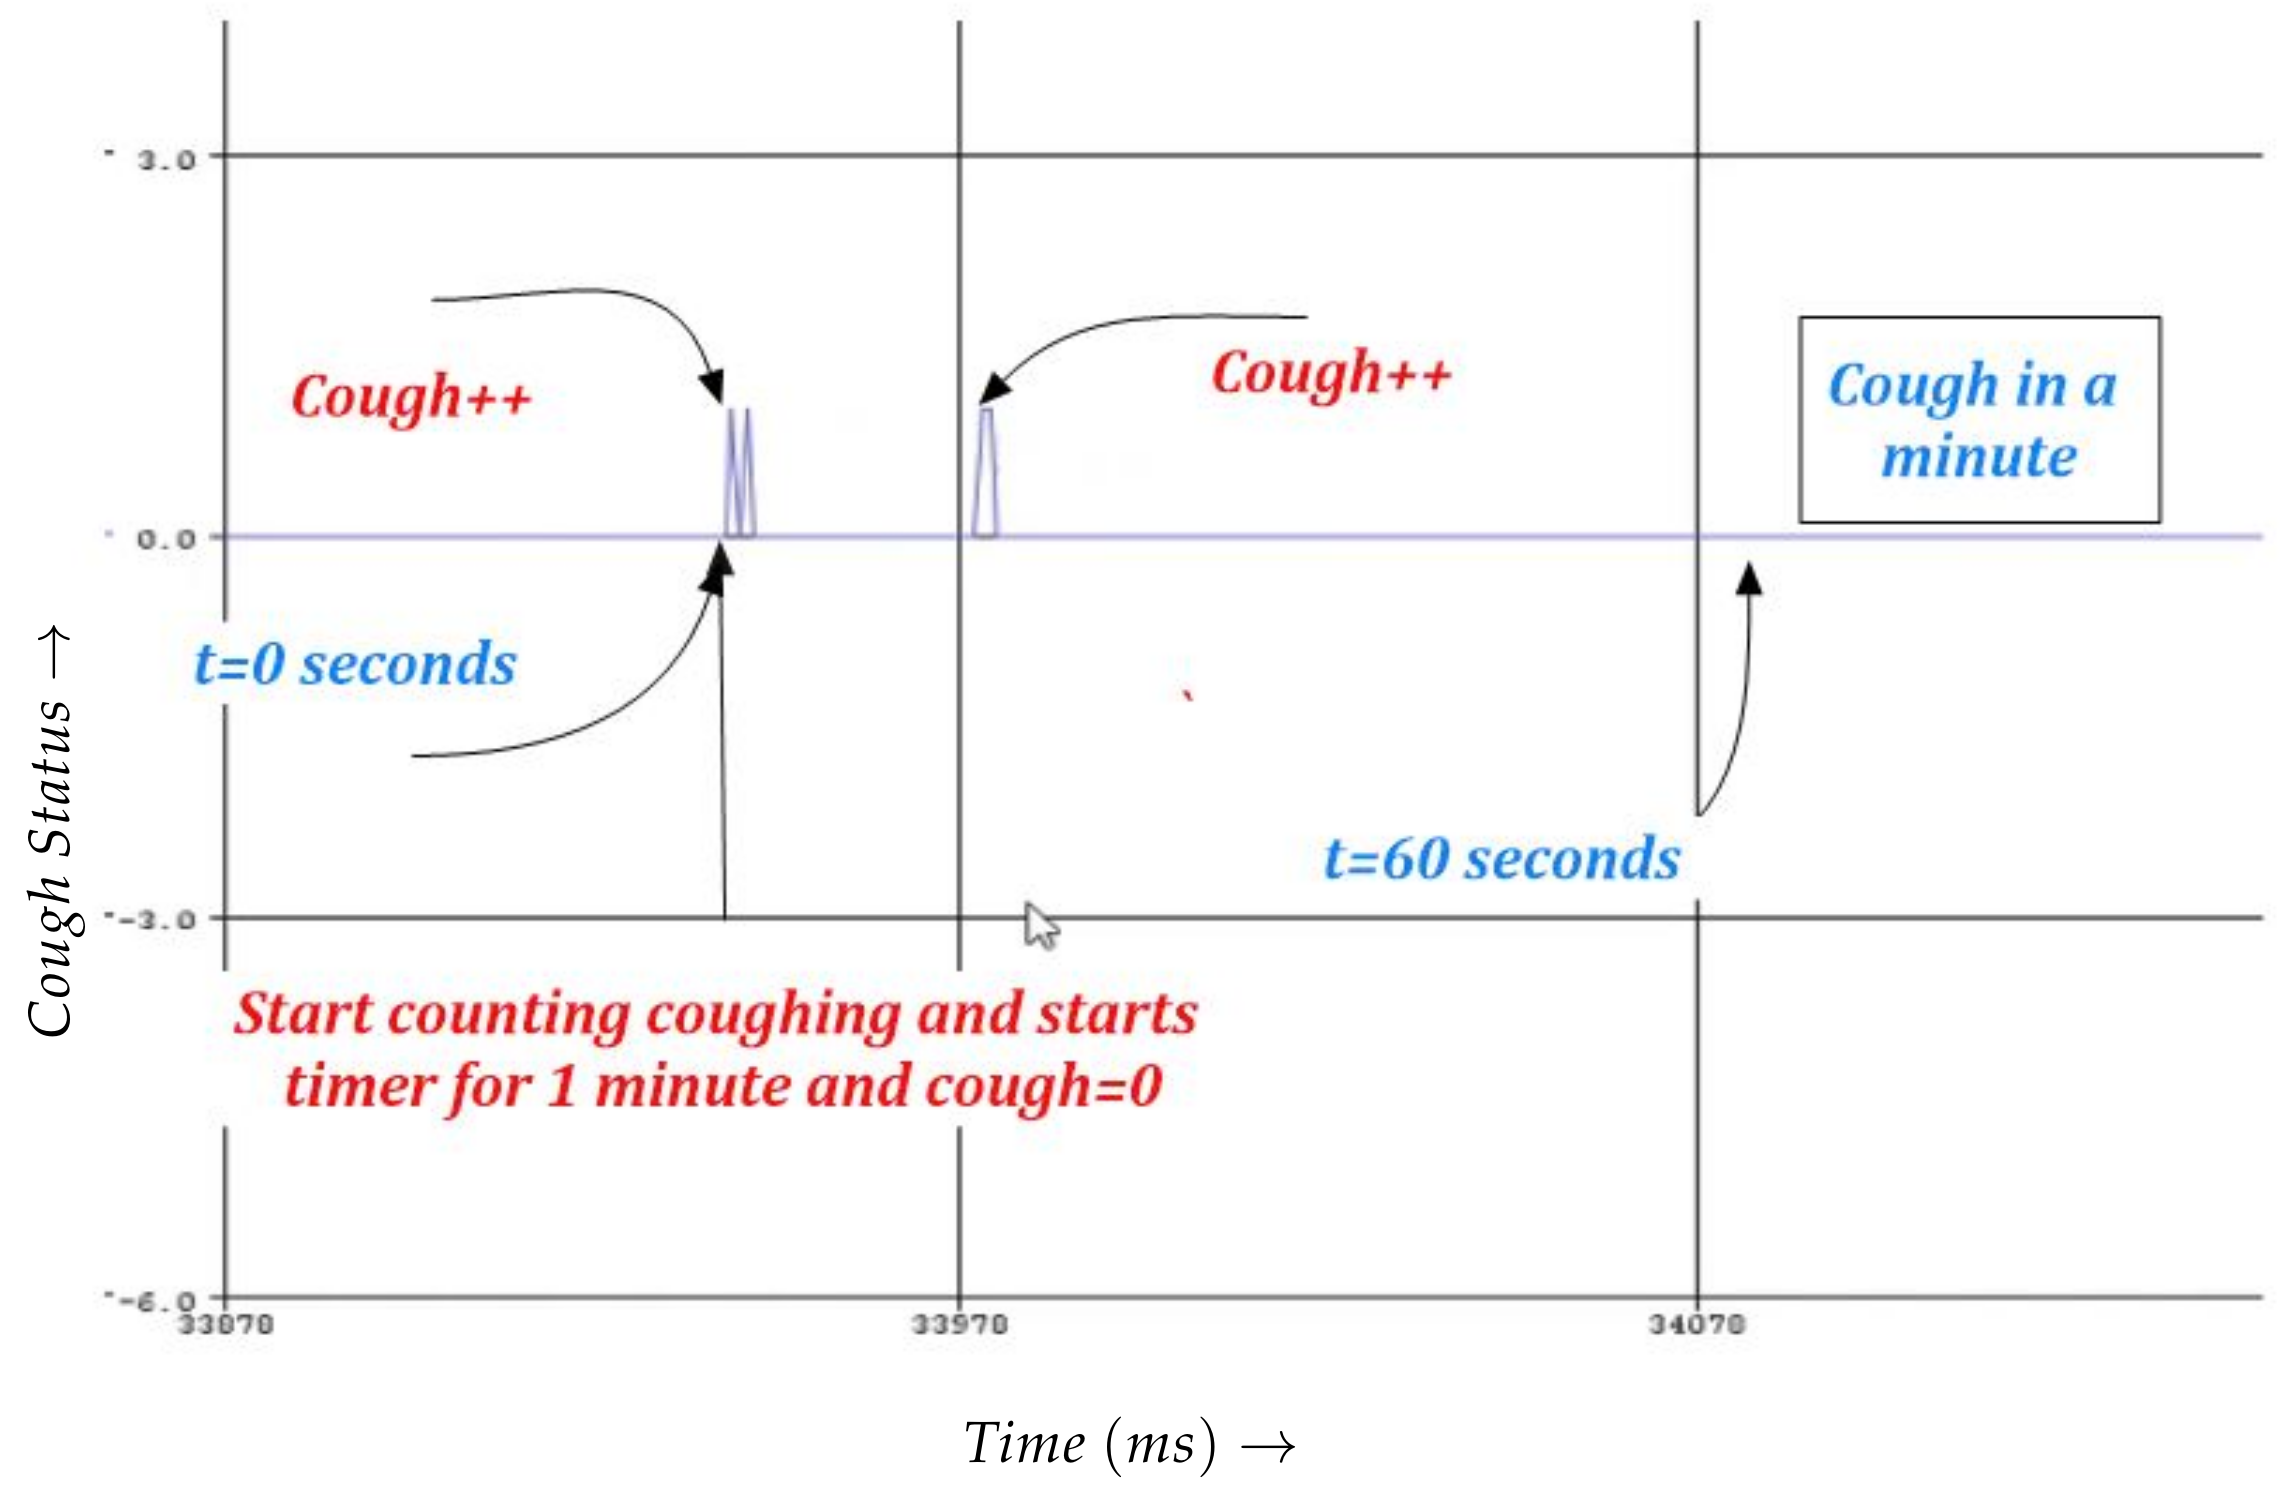
Vibration sensor is used at the below neck position for the measurement of cough. Whenever the person coughs, the output becomes high, and we detect the cough for measuring the coughs per minute. Unlike the breathing rate due to periodicity in nature, the cough is unconditional. Therefore, we have to count total coughs per minute, as shown in Algorithm 3 and Figure 8.
Algorithm 3 Measuring Cough rate per minute.
1:
f l o a t R i s e _ s t a t u s = 0 ;
2:
i n t T o t a l c o u g h s = 0 ;
3:
function C o u g h _ R a t e     ▹ Function for finding Coughing rate per minute
4:
     f l o a t s t a r t t i m e _ 1 s t _ p e a k ;
5:
     i n t V i b r a t i o n _ S e n s o r _ p i n =12
6:
     i n t V i b r a t i o n s = d i g i t a l R e a d ( V i b r a t i o n _ S e n s o r _ p i n )
7:
    if  V i b r a t i o n s > 0 R i s e _ s t a t u s = = 0 then         ▹ 1st peak
8:
         s t a r t t i m e _ 1 s t _ p e a k = m i l l i s ( ) ;
9:
         R i s e _ s t a t u s = 1 ;
10:
    else
11:
        if  V i b r a t i o n s > 0 R i s e _ s t a t u s = = 1  then
12:
            T o t a l c o u g h s + +
13:
            d e l t a = ( m i l l i s ( ) s t a r t t i m e _ 1 s t _ p e a k ) 1000 ;  ▹ Time difference between last and this peak in seconds
14:
           if  d e l t a > 59 then                     ▹ Checks for 1 min
15:
                r e t u r n T o t a l c o u g h s ;
16:
           end if
17:
        end if
18:
    end if
19:
end function
20:
void loop ()
21:
i n t C o u g h i n g _ r a t e / m i n ;
22:
C o u g h i n g _ r a t e / m i n = C o u g h _ R a t e ( )          ▹ Cough rate per minute
23:
Output: The total coughs are extracted after 1 min.

4. Results and Discussion

This section briefly introduces the results of the implemented systems of isolating a COVID patient and analyzing the wearable sensors data. 
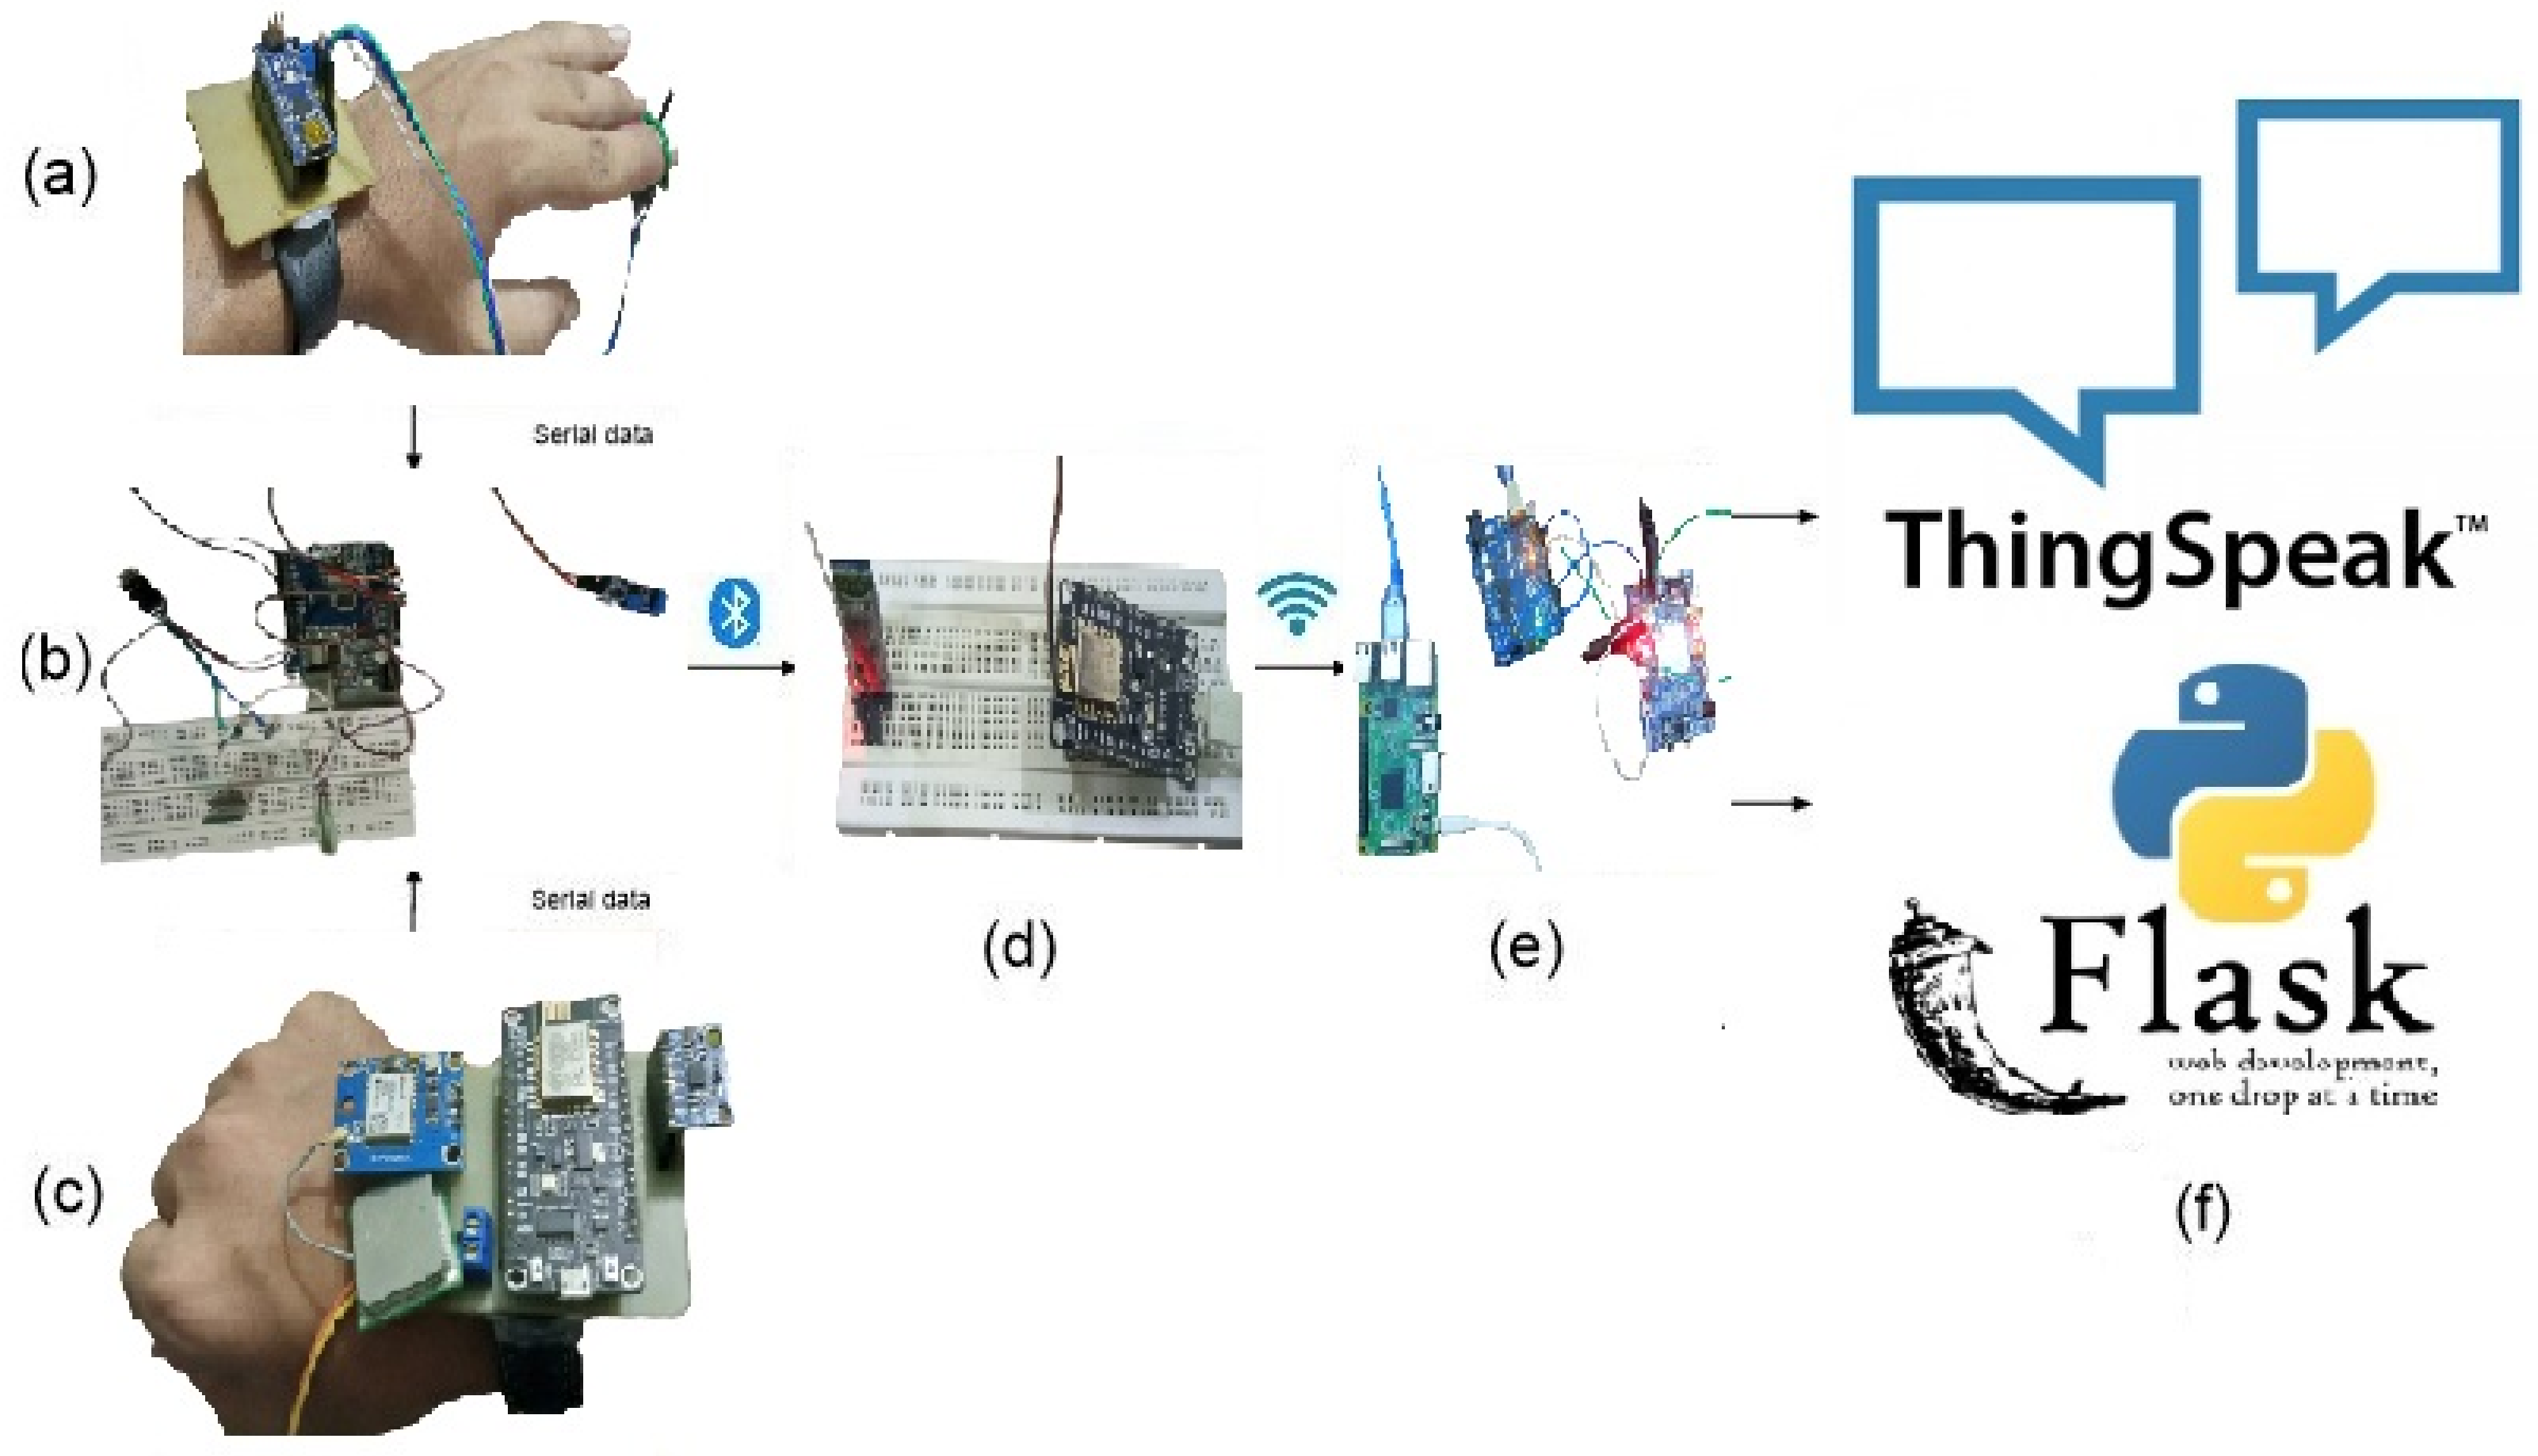
Figure 9 shows the sensors instrumentation, sending the data through Bluetooth and Wi-Fi, and receiving data both at the Flask and ThingSpeak cloud servers. The SpO 2 , accelerometer, and gyroscope are installed at the left arm dorsal. The temperature sensor and ECG sensors are at the chest while the coughing frequency sensor at the check neck position. At right dorsal, the GPS sensor and the NodeMCU based gateway are installed. Figure 10 shows the sensors’ interfaces on different parts of the body. The SpO 2 , temperature, accelerometer, and gyroscope sensors (MPU6050) are connected through the serial interface I 2 C . The breathing sensors and the cough frequency counter sensors (FSR402) are interfaced using the analog input. The GPS sensor and Bluetooth are connected through the RS-232 serial interface. 
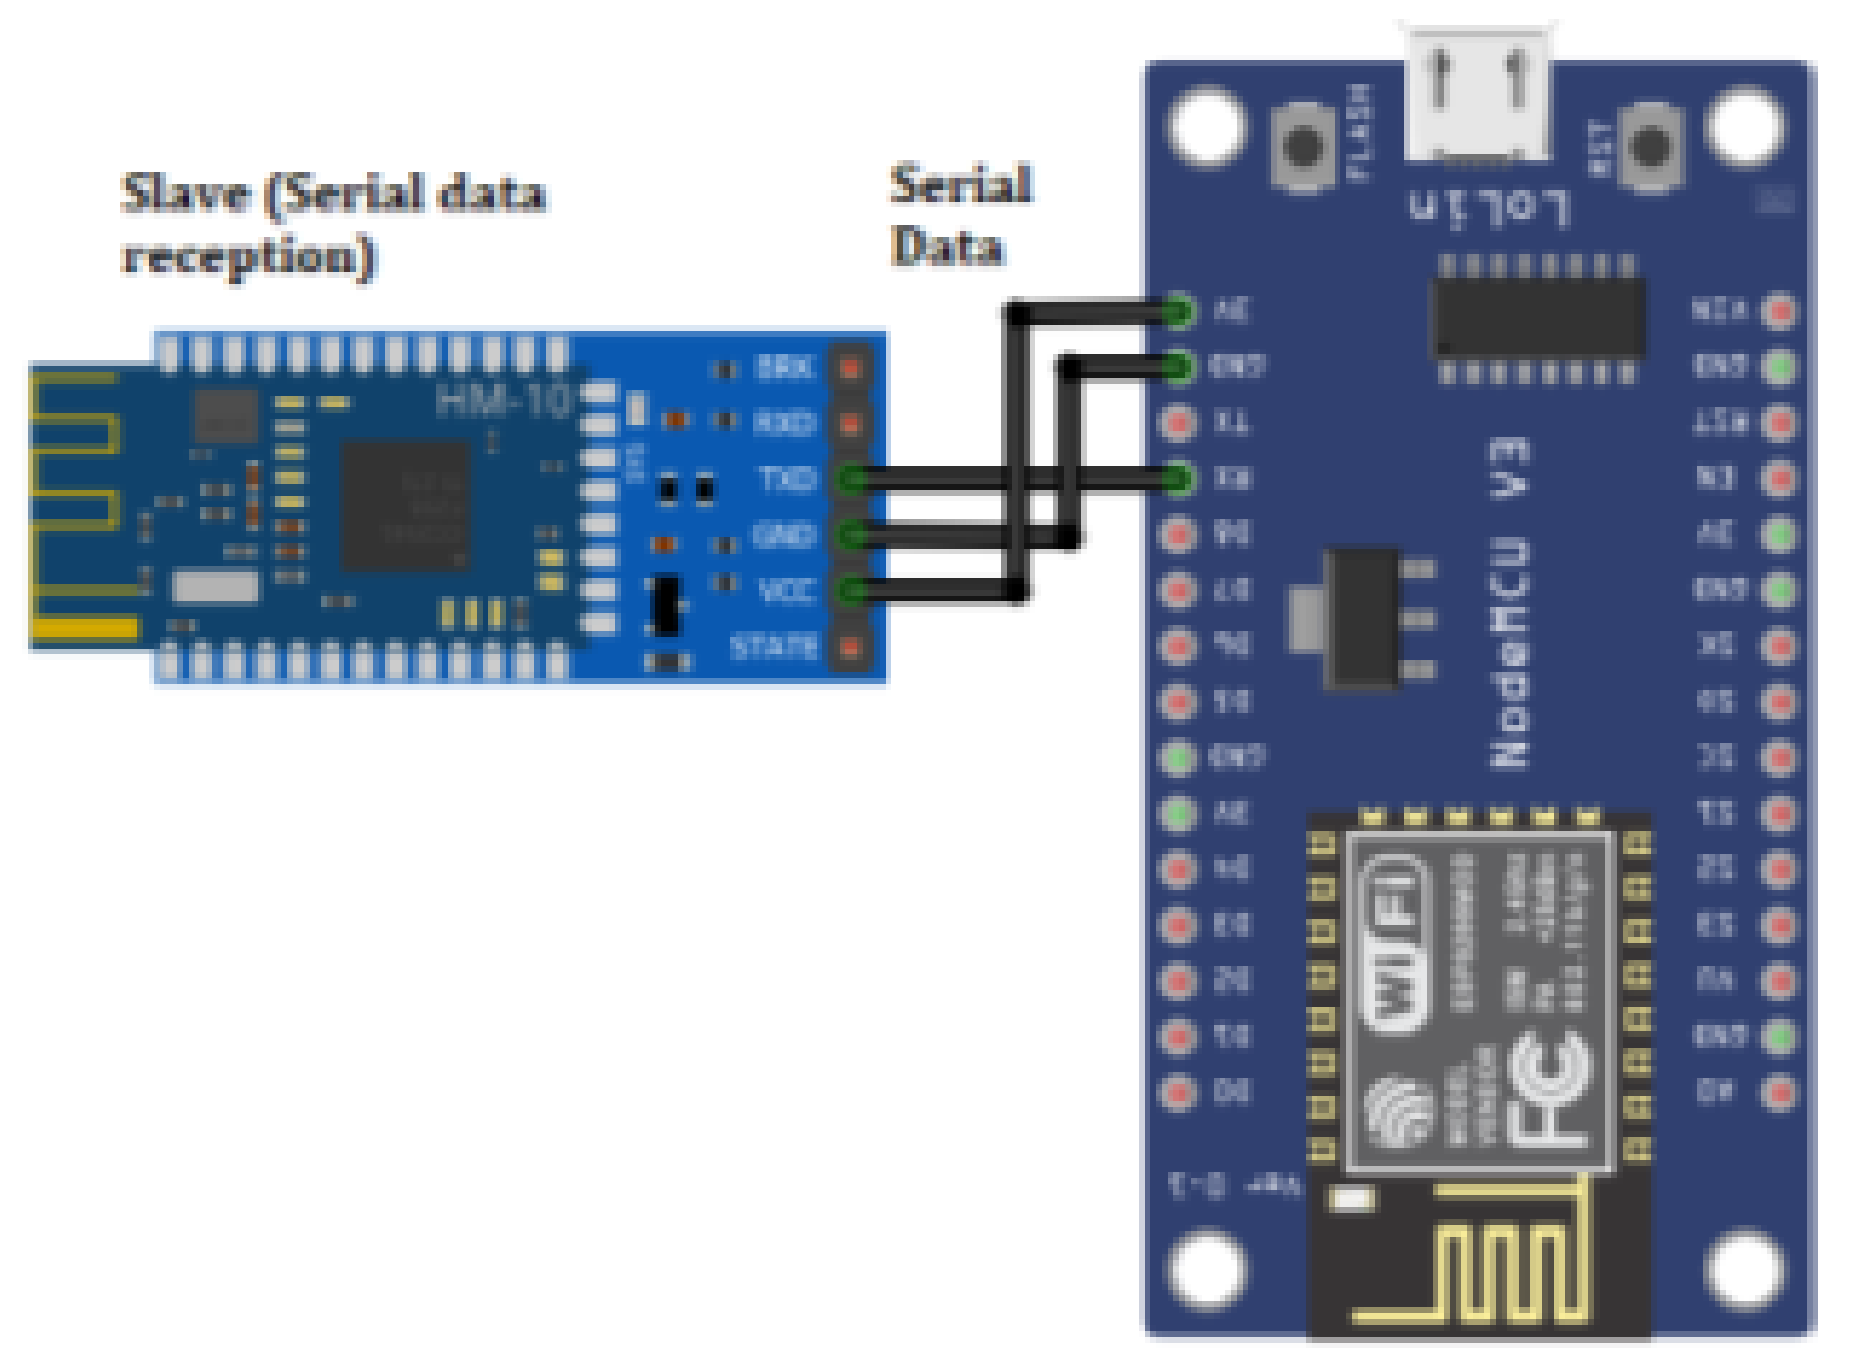
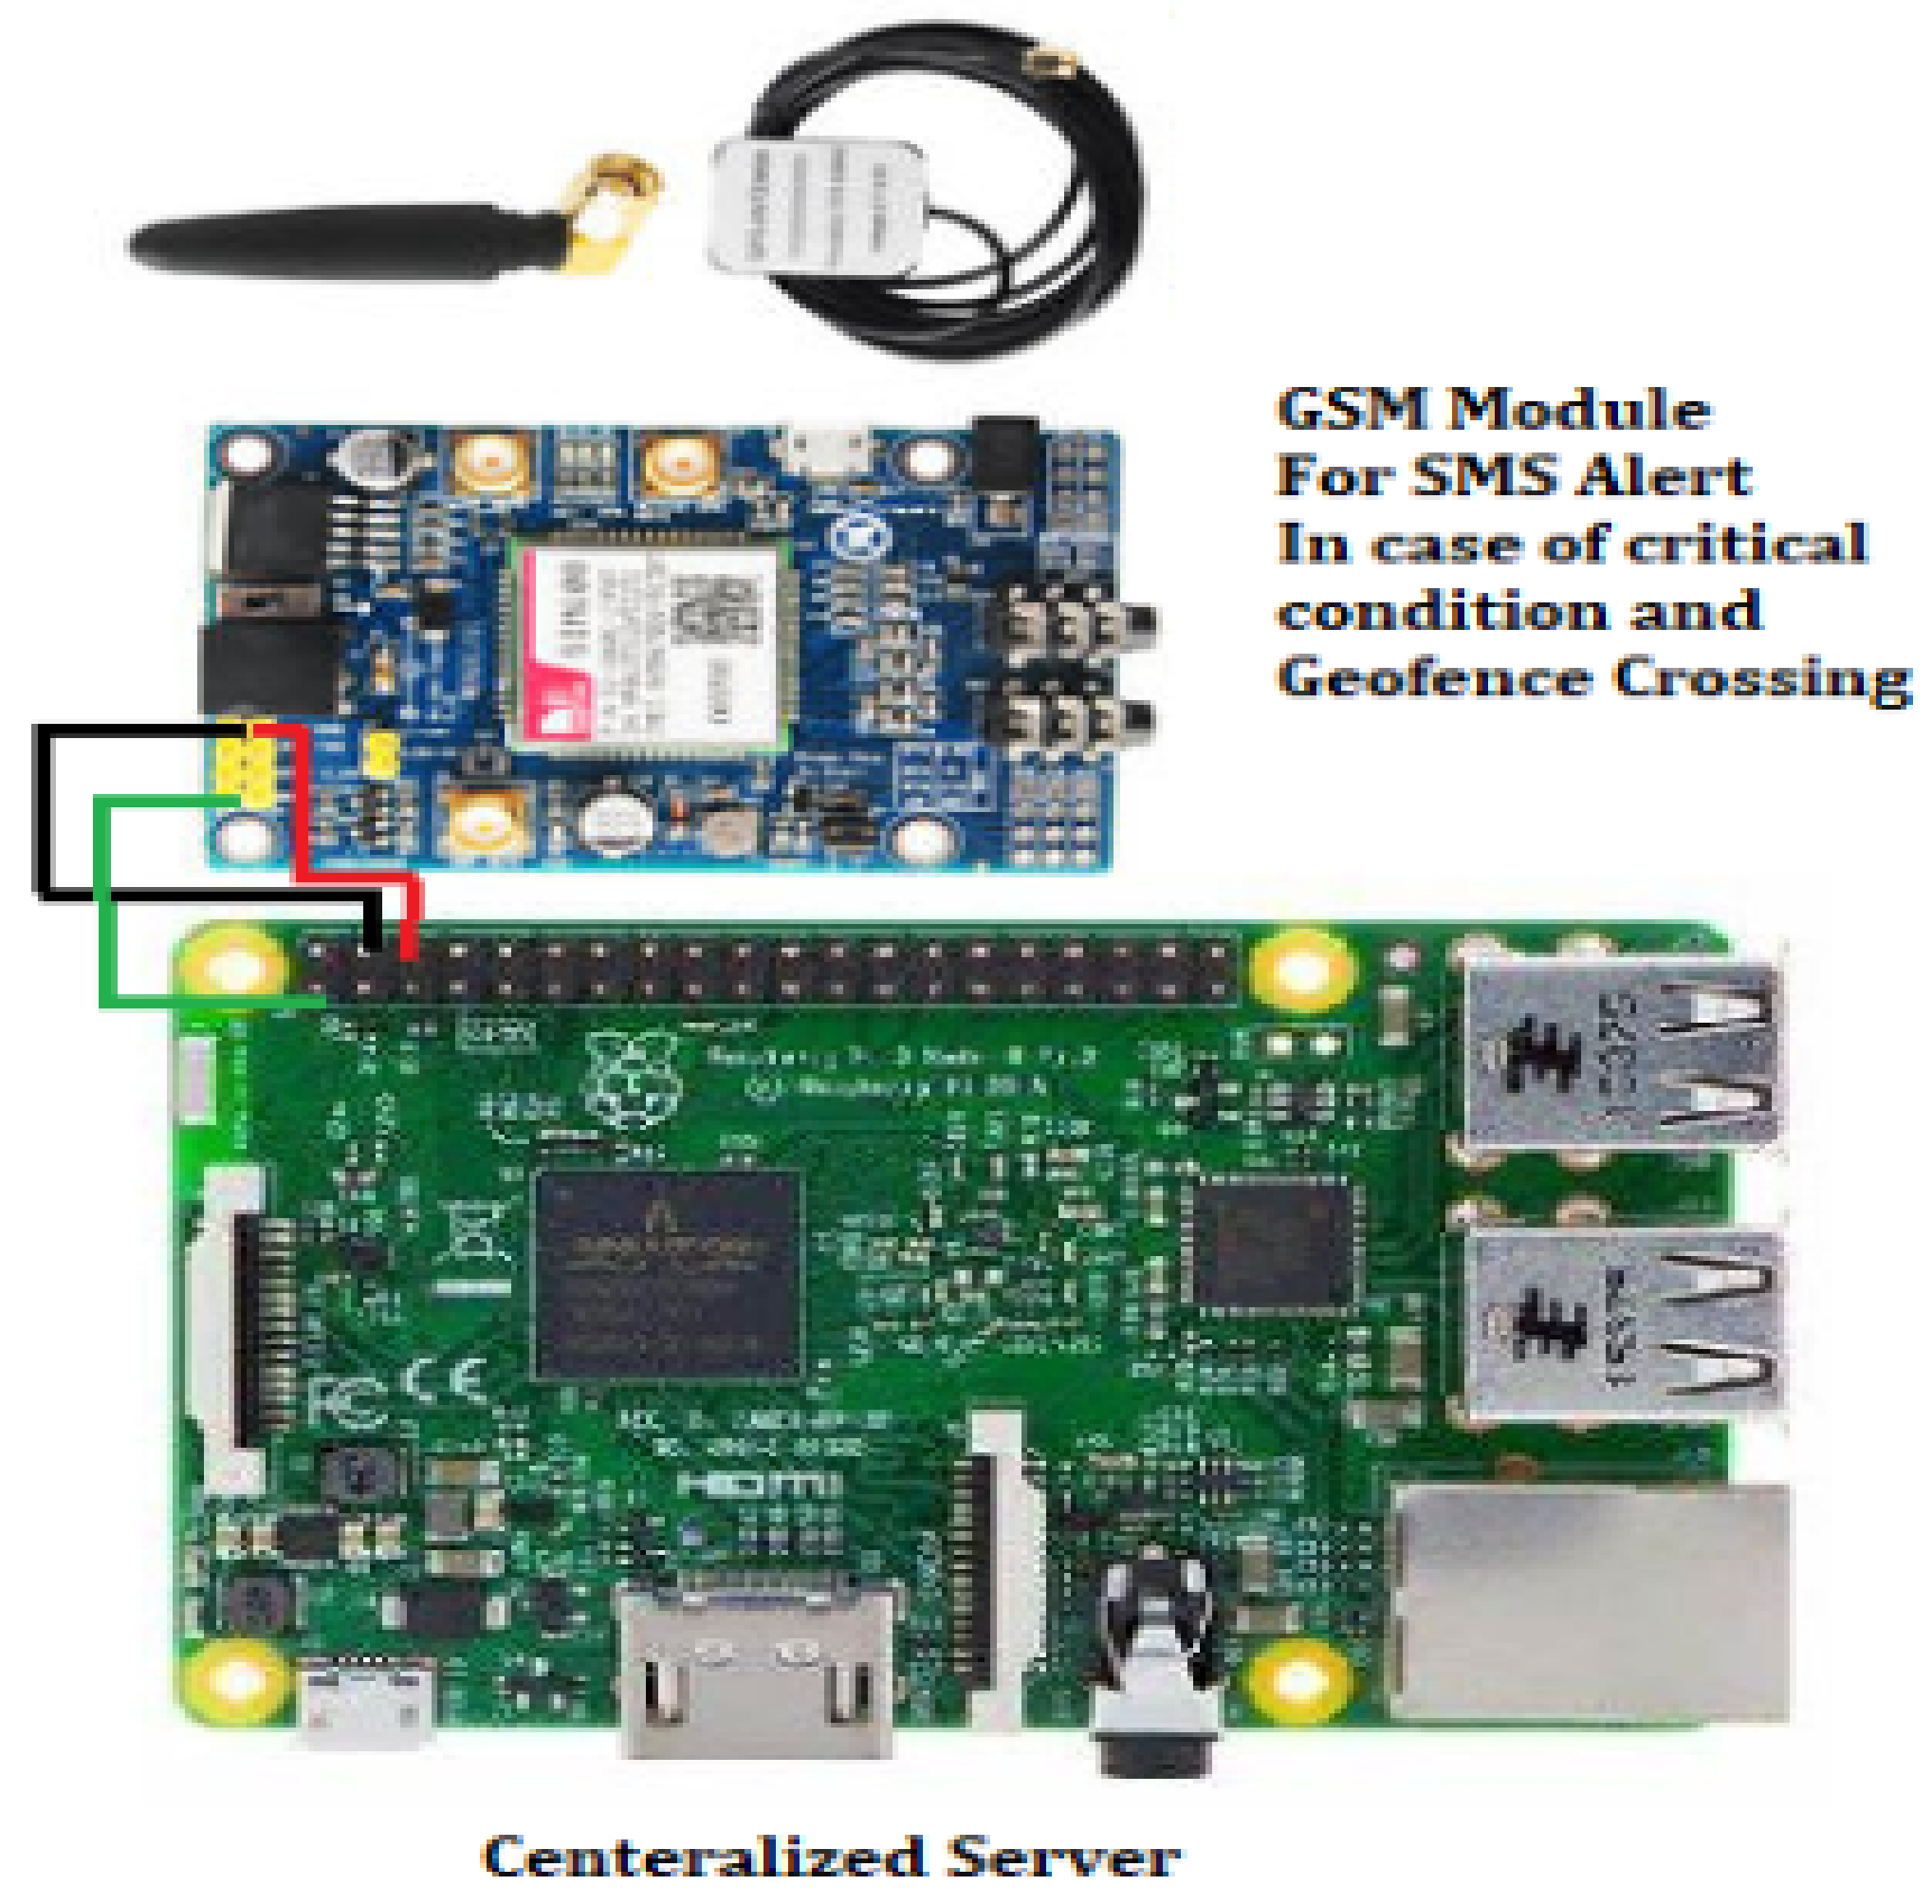
Figure 11 shows the NodeMCU (Wi-Fi module) based Gateway having a Bluetooth master device to get the sensors data and enable the IoT environment to send the data to the Raspberry PI based server as shown in Figure 12 and ThingSpeak also for storage and visualization. The GSM is also interfaced with the Raspberry Pi in order for the SMS because, in most of the regions, internet connectivity may not be possible.
Figure 13 and Figure 14 respectively implemented both Flask server based and ThingSpeak cloud based data analytic and visualization. 
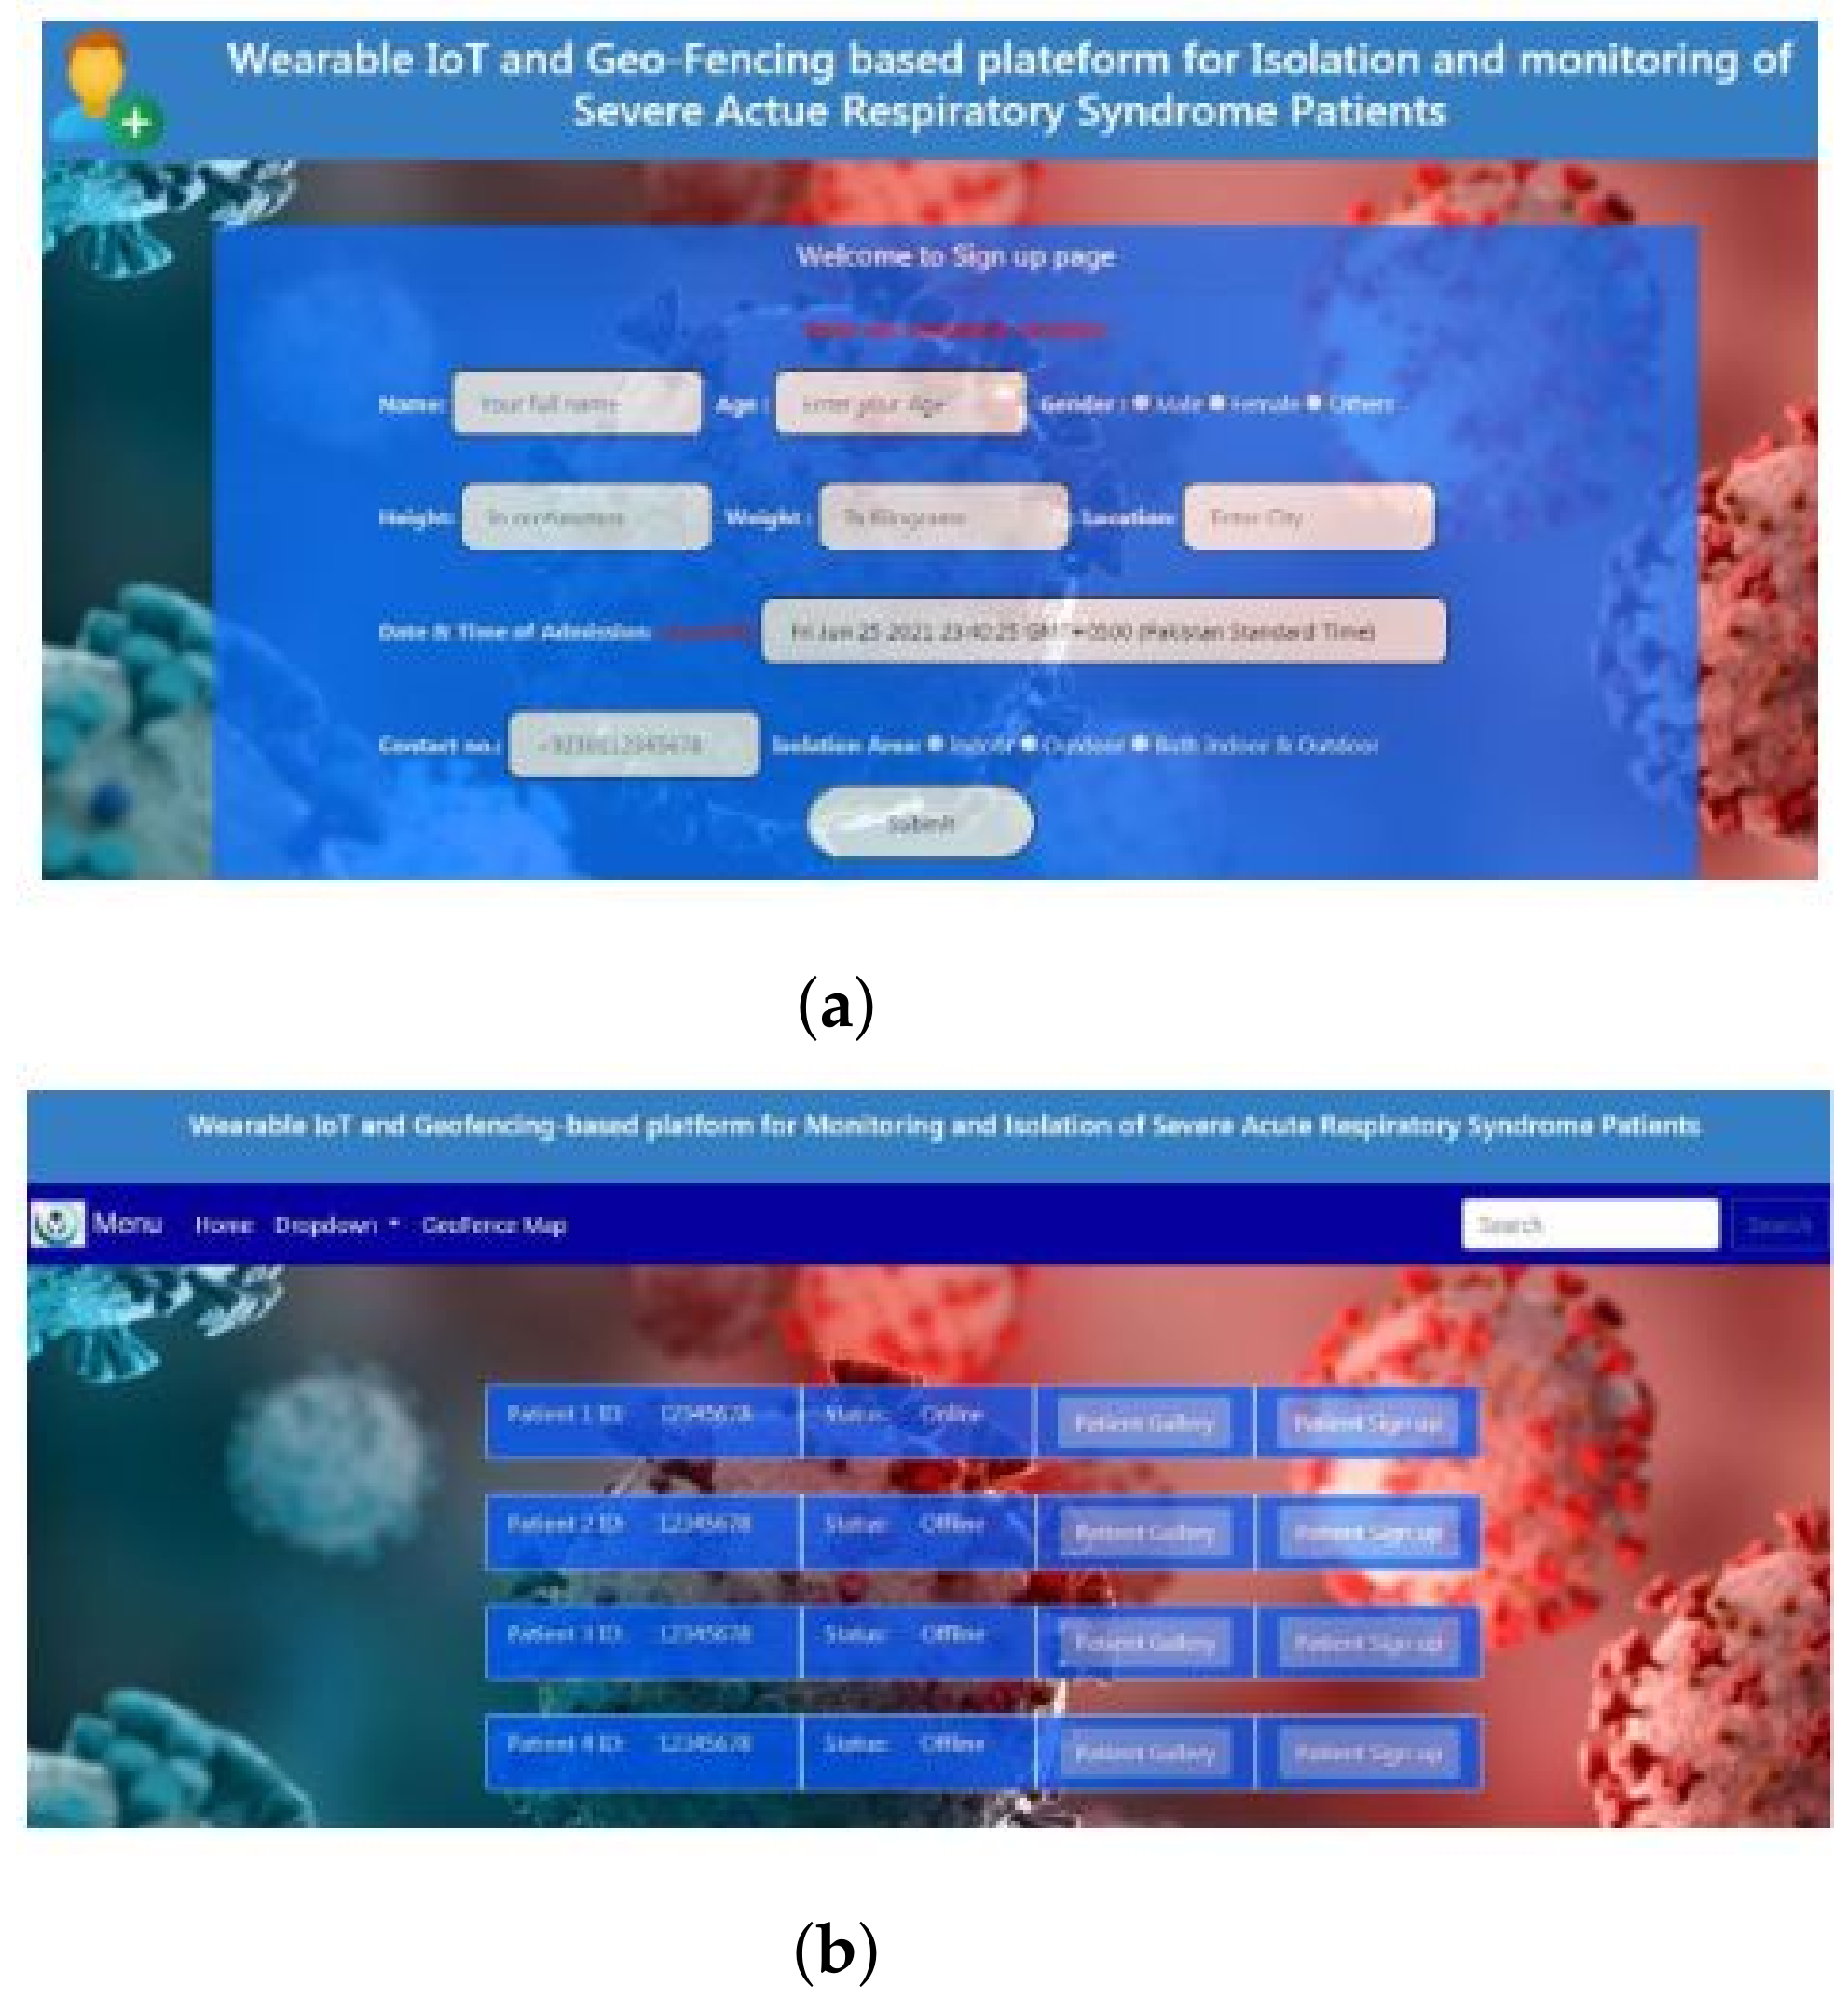
Figure 13 shows the signup page to authorize the concerned authorities for data collection and also the web-based access to patient data. Because internet connectivity is not available in rural areas, the Flask server is used to display the data locally to find the health physiological parameters without directly interacting with the susceptible and patients. All the implemented wearable sensors in the framework are accessible through the URL mentioned in [32]. The Google map API integrated with GPS sensors helps to find and visualize the Geo-fence of susceptible and patient Geo-fencing using ray casting, with which the authority can define the Geo-fence of the patient in real time as shown in Figure 15. The GPS coordinates representing outdoor locations of the patient are sent to the server, which is accessible remotely as shown in Figure 15 with a refreshing rate of 1 H z 
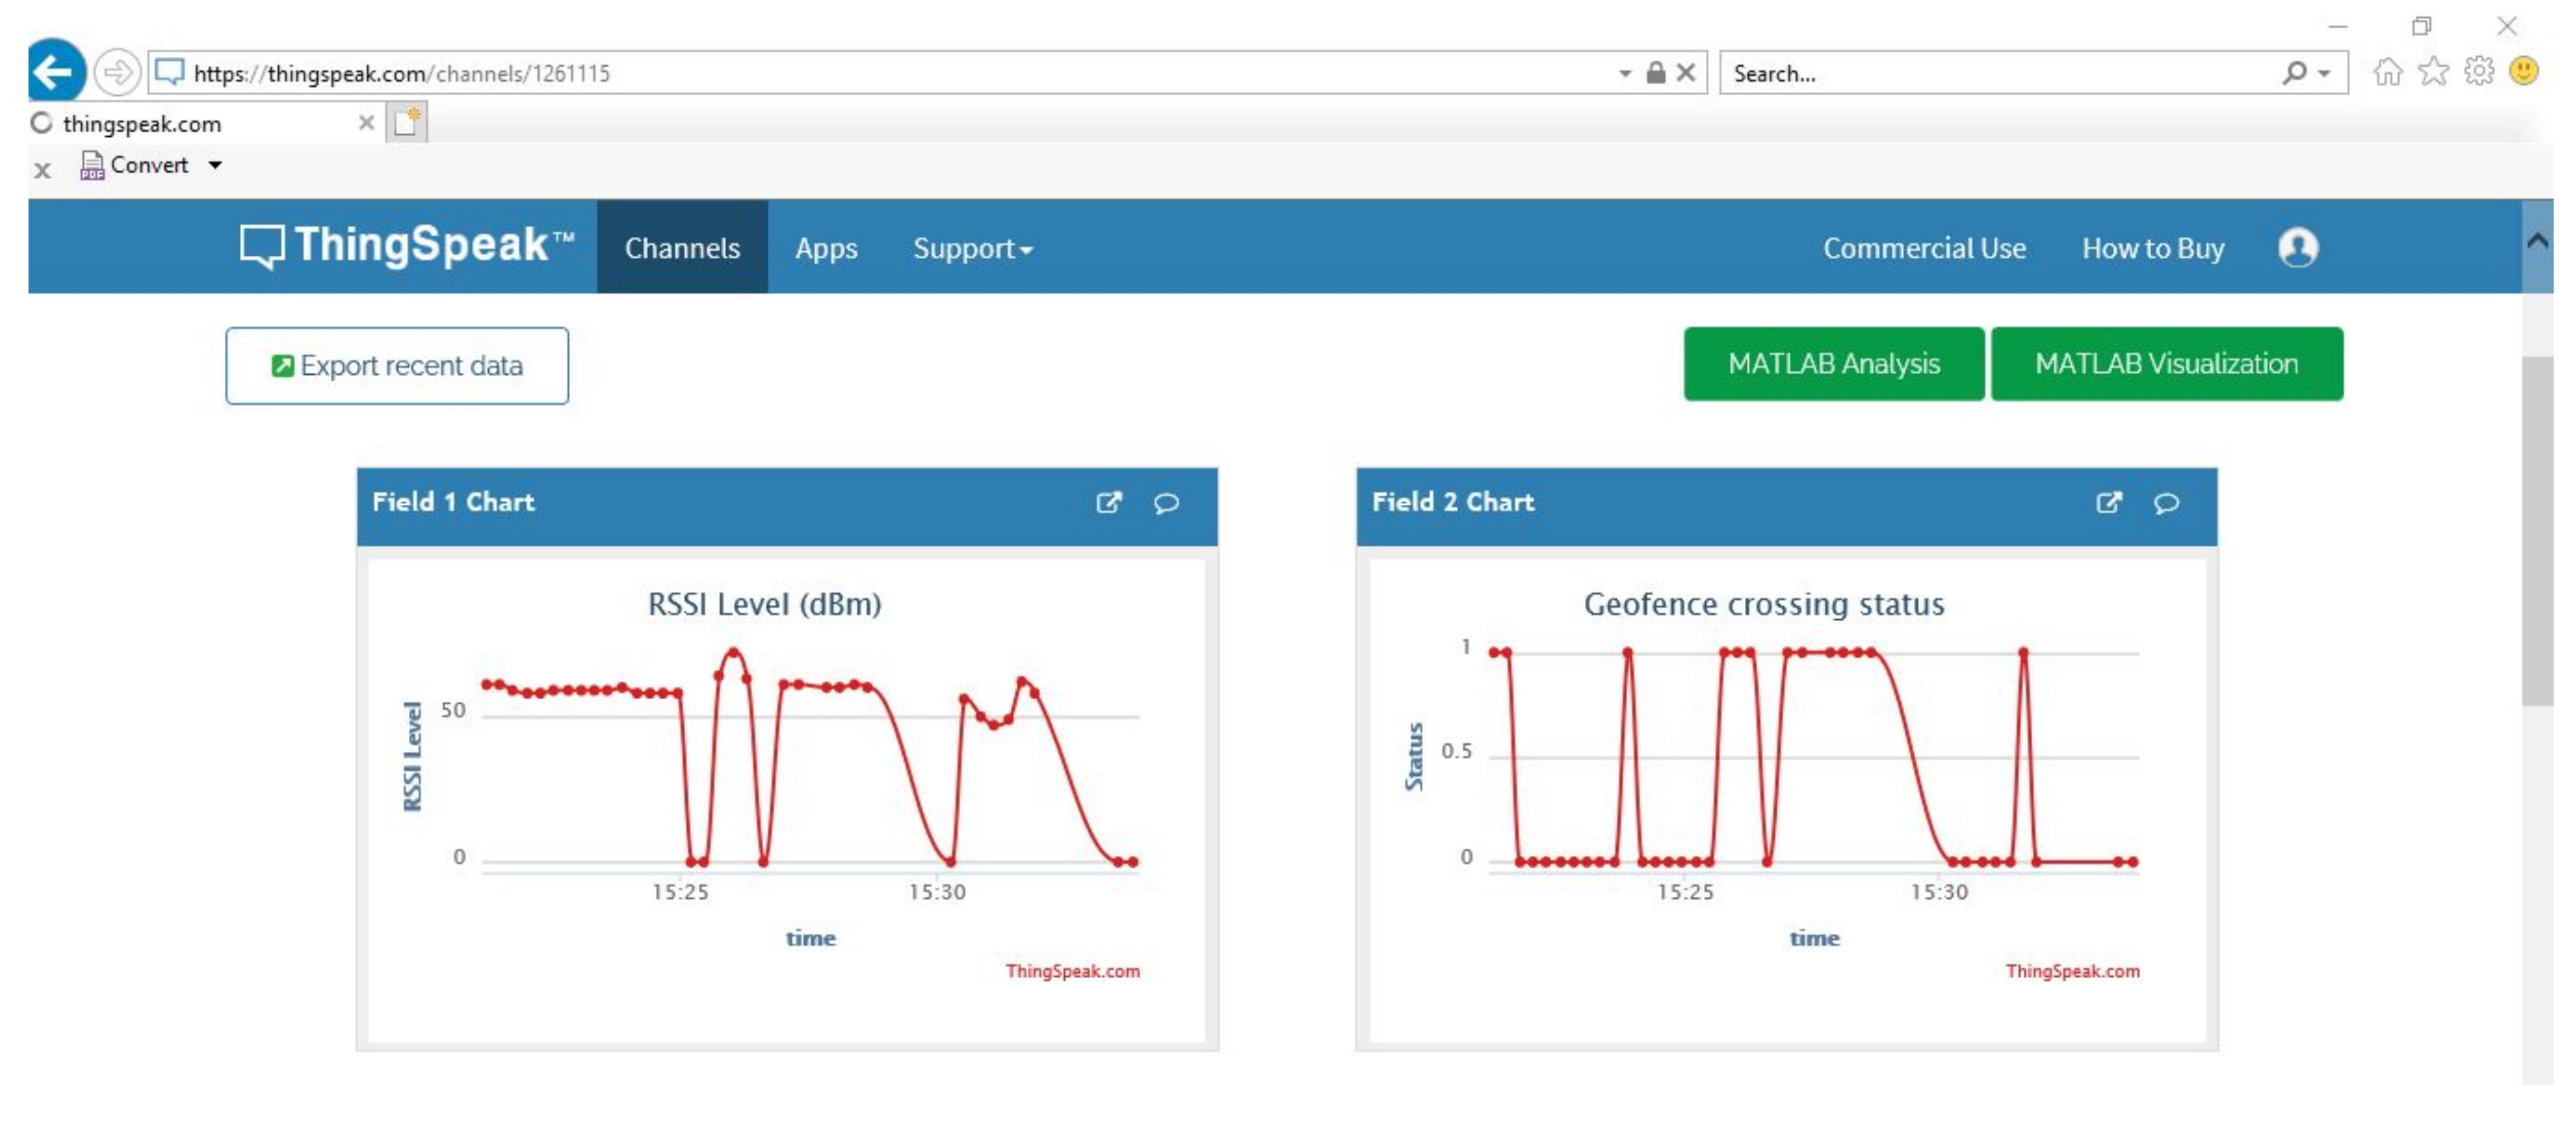
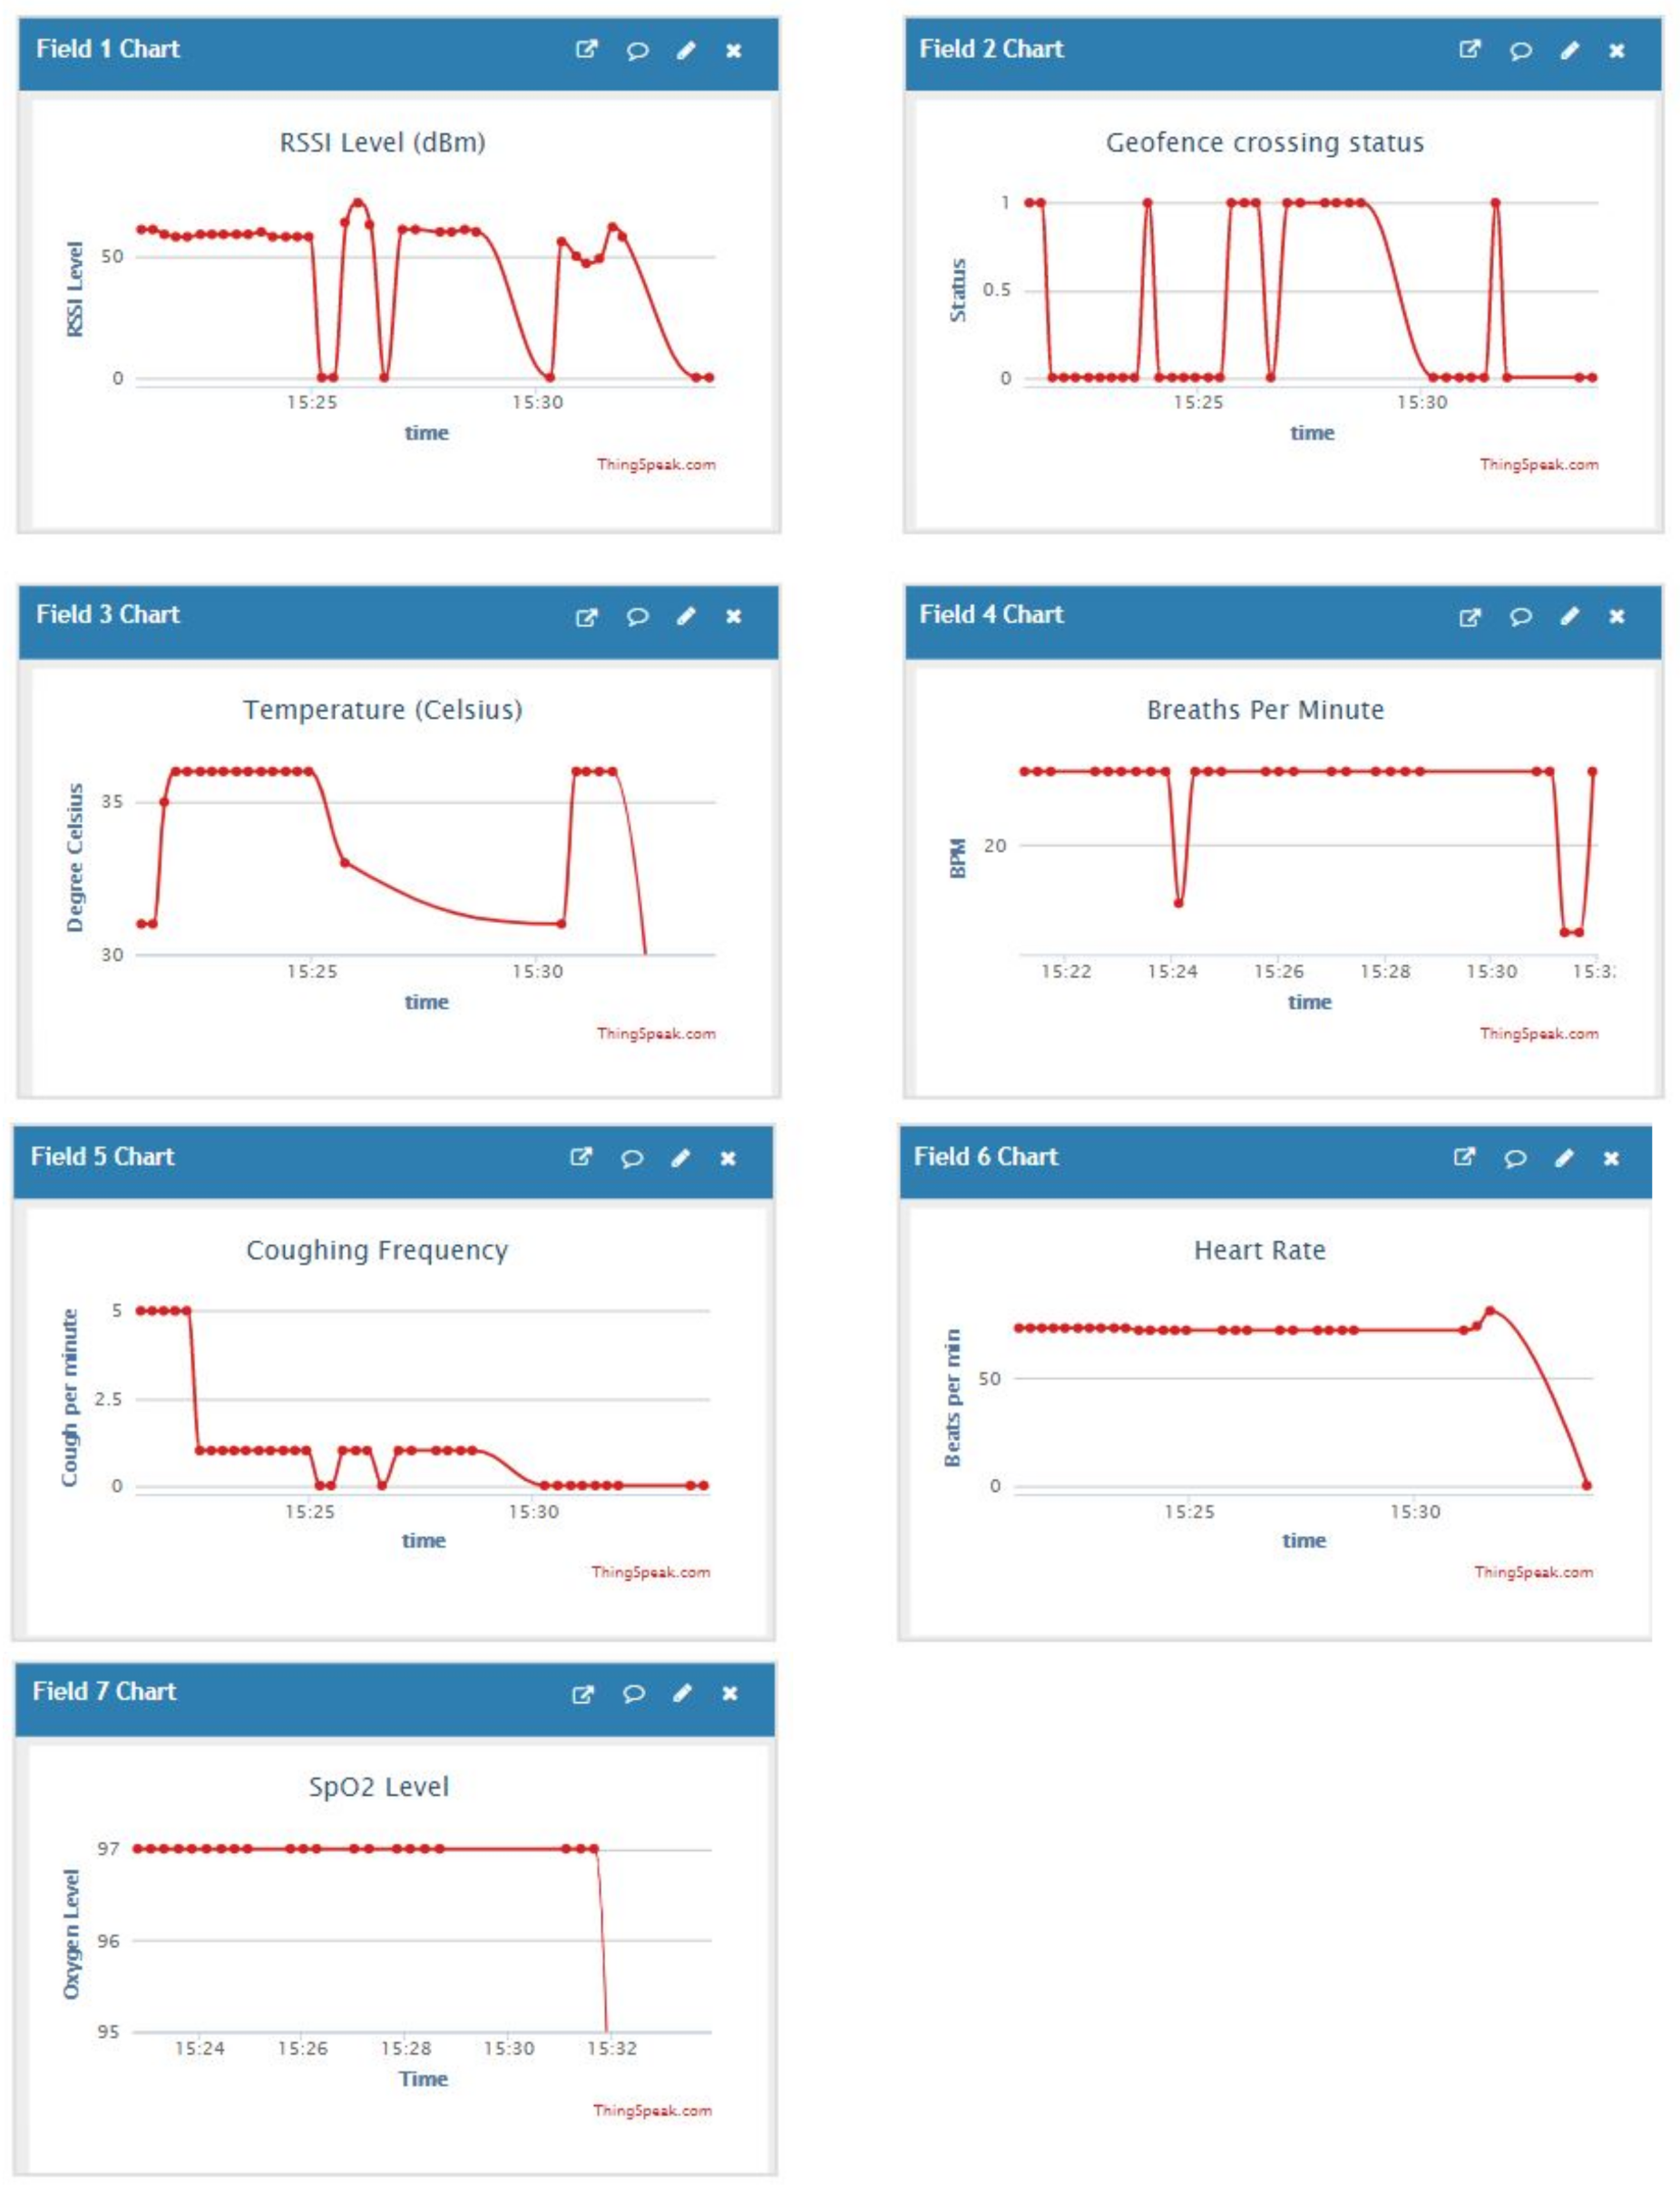
. The indoor localization is done using the RSSI level of the Wi-Fi router, which is in decibels-milli watts (dBm). The RSSI level is adjusted based on the indoor area of isolation. In Figure 16, the first two graphs show the RSSI and GPS based Geo-fencing. Figure 16 shows variation of RSSI level with allowed enclosed area of RSSI level 60 d B m .
The breathing rate of a normal person varies from 12–24 breaths per minute. However, as the COVID patient faces difficulty in breathing, he/she fights to breathe more rapidly. The COVID patient’s BPM (breath per minute) varies B P M 25 B P M . The COVID patient’s breathing rate is shown in Figure 16 sub-Figure 4. The coughing frequency for COVID patients varies. Due to continuous angular movements of dorsal hand to mouth, the coughing frequency integrated with the deviation of ECG signal, and the respiratory sensor leads to the detection of coughing. The increase in coughing frequency is shown in Figure 16 sub-Figure 5. The normal human body temperature varies from 35 C to 37 ° C. However, due to pneumonia or COVID, the patient suffers from fever. The temperature might increase to 40 ° C equivalent to 105 ° F. The results attached in Figure 16 sub-figure 3 represents temperature varying from 38 ° C to 40 ° C.
The normal heart rate variation depends on whether one is male to female. Beats per minute (BPM) for males is 72 and for females is 78. However, due to the increase in respiration rate and fever, the heart rate increases. Figure 16 sub-Figure 6 represents heart rate variation from 85 to 100 BPM of COVID patients. The SpO 2 level of normal human beings varies from 96–100%. However, for COVID patients, it decreases to 90–95%. Figure 16 sub-figure 7 shows the oxygen level in patients’ blood.

5. Conclusions and Future Works

In this paper, we presented a wearable IoT and Geo-fencing based framework to isolate an individual who is infected with COVID-19 or is exposed to the coronavirus. We proposed a wearable IoT based framework to remotely assess the quarantined person health and provide possible treatment. The traditional quarantine monitoring procedures are monitored locally by the medical staff, which increases the risk of spread. The proposed architecture framework consists of four main layers: (i) wearable sensors layer for person biomedical and geo-location information acquisition; (ii) Bluetooth and Wi-Fi based network layer to pass the data and messages between sensors layer, gateway, and the Flask and ThingSpeak cloud server; (iii) Flask servers and ThingSpeak cloud server layer for data storage and visualization; and (iv) Client Application layer for remote monitoring, health assessment, and providing feedback by the physician. The current proposed work is mainly focusing on making life more convenient for those with health challenges who need to visit the hospital regularly. The proposed system has been developed in order to reduce the number of hospital visits, queues in the hospital, and reduction in the cost of taking care of the sick. It minimizes the risk of spread through close interaction and contamination.
We used wearable sensors temperature, heart rate, breathing rate, coughing rate, and SpO2(oxygen blood saturation level), accelerometer, and gyroscope to measure the physiological parameter of the susceptible and patient in remote quarantine. We provided the GPS and Wi-Fi RSSI level based Geo-fencing in order to locate the patient in indoor and outdoor quarantine areas. If the person is outside the specified quarantine area, an alert message will be sent to the person and care taker organizations. The Raspberry Pi based centralized server and ThingSpeak based cloud server provide the remote storage and visualization of the user biomedical physiological parameter and Geo-fencing to monitor and control the social life and manage during the pandemic era.
In the future, we are working to integrate the advanced machine learning algorithm in the proposed system to classify the breathing patterns such as Normal, Ataxic, and Air trapping and also the severity of the susceptible and patient. We also used the accelerometer and gyroscope sensor that will be used in order to precisely measure the breathing and coughing rate considering the hands movement during coughing.

Author Contributions

Conceptualization, F.U., J.K., H.U.H.; Data curation, U.A.; Formal analysis, F.U., J.K.; Funding acquisition, S.L.; Investigation, F.U., H.U.H.; Methodology, H.U.H., A.A.S.; Software, H.U.H., A.A.S.; Hardware, H.U.H., A.A.S., U.A.; Supervision, F.U. and S.L.; Validation, J.K.; Writing—original draft, F.U. and H.U.H.; Writing—review and editing, F.U., J.K., S.L. All authors have read and agreed to the published version of the manuscript.

Funding

This work was supported by a Korea–Sweden science and technology joint research project through the National Research Foundation of Korea (NRF) funded by the Ministry ICT under Grant NRF-2020K1A3A1A47110830.

Institutional Review Board Statement

The study was conducted according to the guidelines, and approved by the Graduate and Research Ethic Committee of the Institutes.

Acknowledgments

This work was supported by a Korea–Sweden science and technology joint research project through the National Research Foundation of Korea (NRF) funded by the Ministry ICT under Grant NRF-2020K1A3A1A47110830.

Conflicts of Interest

All authors declare no conflict of interest.

References

  1. Tan, W.; Zhao, X.; Ma, X.; Wang, W.; Niu, P.; Xu, W.; Gao, G.F.; Wu, G. A novel coronavirus genome identified in a cluster of pneumonia cases—Wuhan, China 2019–2020. China CDC Wkly. 2020, 2, 61–62. [Google Scholar] [CrossRef]
  2. Coronavirus Worldwide Graphs. Available online: www.worldometers.info/coronavirus/worldwide-graphs/ (accessed on 6 February 2021).
  3. Iqbal, A.; Ullah, F.; Anwar, H.; Kwak, K.S.; Imran, M.; Jamal, W.; ur Rahman, A. Interoperable Internet-of-Things platform for smart home system using Web-of-Objects and cloud. Sustain. Cities Soc. 2018, 38, 636–646. [Google Scholar] [CrossRef]
  4. Liu, Y.; Dong, B.; Guo, B.; Yang, J.; Peng, W. Combination of cloud computing and internet of things (IOT) in medical monitoring systems. Int. J. Hybrid Inf. Technol. 2015, 8, 367–376. [Google Scholar] [CrossRef]
  5. Iqbal, A.; Ullah, F.; Anwar, H.; Rehman, A.U.; Shah, K.; Baig, A.; Ali, S.; Yoo, S.; Kwak, K.S. Wearable Internet-of-Things platform for human activity recognition and health care. Int. J. Distrib. Sens. Netw. 2020, 16, 1550147720911561. [Google Scholar] [CrossRef]
  6. Fangyu, L.; Maria, V.; Hossain, S.; Rumi, A.K.; Sheikh, I.A. Wi-COVID: A COVID-19 symptom detection and patient monitoring framework using Wi-Fi. Smart Health 2021, 19, 100147. [Google Scholar]
  7. Karthickraja, R.; Kumar, R.; Kirubakaran, S.; Manikandan, R. COVID-19 prediction and symptom analysis using wearable sensors and IoT. Int. J. Pervasive Comput. Commun. 2020. [Google Scholar] [CrossRef]
  8. Venkataramanaiah, B.; Kamala, J. ECG signal processing and KNN classifier-based abnormality detection by VH-doctor for remote cardiac healthcare monitoring. Soft Comput. 2020, 24, 17457–17466. [Google Scholar] [CrossRef]
  9. Regalado, A. What is herd immunity and can it stop the coronavirus. MIT Technol. Rev. March 2020, 17, 2020. [Google Scholar]
  10. Singla, L.; Bhatia, P. GPS based bus tracking system. In Proceedings of the 2015 International Conference on Computer, Communication and Control (IC4), Indore, India, 10–12 September 2015; pp. 1–6. [Google Scholar]
  11. Sadowski, S.; Spachos, P. Rssi-based indoor localization with the internet of things. IEEE Access 2018, 6, 30149–30161. [Google Scholar] [CrossRef]
  12. Rahman, M.S.; Peeri, N.C.; Shrestha, N.; Zaki, R.; Haque, U.; Ab Hamid, S.H. Defending against the Novel Coronavirus (COVID-19) outbreak: How can the Internet of Things (IoT) help to save the world? Health Policy Technol. 2020, 9, 136. [Google Scholar] [CrossRef] [PubMed]
  13. Bentotahewa, V.; Hewage, C.; Williams, J. Security and Privacy Issues Associated with Coronavirus Diagnosis and Prognosis. Science and Technologies for Smart Cities; Paiva, S., Lopes, S.I., Zitouni, R., Gupta, N., Lopes, S.F., Yonezawa, T., Eds.; Springer International Publishing: Cham, Switzerland, 2021; pp. 108–116. [Google Scholar]
  14. Yousif, M.; Hewage, C.; Nawaf, L. IoT Technologies during and Beyond COVID-19: A Comprehensive Review. Future Internet 2021, 13, 105. [Google Scholar] [CrossRef]
  15. Hassantabar, S.; Stefano, N.; Ghanakota, V.; Ferrari, A.; Nicola, G.N.; Bruno, R.; Marino, I.R.; Jha, N.K. Coviddeep: Sars-cov-2/covid-19 test based on wearable medical sensors and efficient neural networks. arXiv 2020, arXiv:2007.10497. [Google Scholar]
  16. Otoom, M.; Otoum, N.; Alzubaidi, M.A.; Etoom, Y.; Banihani, R. An IoT-based framework for early identification and monitoring of COVID-19 cases. Biomed. Signal Process. Control 2020, 62, 102149. [Google Scholar] [CrossRef] [PubMed]
  17. Bai, L.; Yang, D.; Wang, X.; Tong, L.; Zhu, X.; Zhong, N.; Bai, C.; Powell, C.A.; Chen, R.; Zhou, J.; et al. Chinese experts’ consensus on the Internet of Things-aided diagnosis and treatment of coronavirus disease 2019 (COVID-19). Clin. EHealth 2020, 3, 7–15. [Google Scholar] [CrossRef]
  18. Cernat, R.A.; Ungureanu, C.; Aarts, R.; Arends, J. Real-time extraction of the respiratory rate from photoplethysmographic signals using wearable devices. In Proceedings of the European Conference on Ambient Intelligence, Eindhoven, The Netherlands, 11–13 November 2014; pp. 11–13. [Google Scholar]
  19. Yue, W.; Voronova, L.; Voronov, V. Design and implementation of a remote monitoring human health system. In Proceedings of the 2020 Systems of Signals Generating and Processing in the Field of on Board Communications, Moscow, Russia, 19–20 March 2020; pp. 1–7. [Google Scholar]
  20. Ma, G.; Zhu, W.; Zhong, J.; Tong, T.; Zhang, J.; Wang, L. Wearable ear blood oxygen saturation and pulse measurement system based on PPG. In Proceedings of the 2018 IEEE SmartWorld, Ubiquitous Intelligence & Computing, Advanced & Trusted Computing, Scalable Computing & Communications, Cloud & Big Data Computing, Internet of People and Smart City Innovation (SmartWorld/SCALCOM/UIC/ATC/CBDCom/IOP/SCI), Guangzhou, China, 8–12 October 2018; pp. 111–116. [Google Scholar]
  21. Gia, T.N.; Jiang, M.; Rahmani, A.M.; Westerlund, T.; Liljeberg, P.; Tenhunen, H. Fog computing in healthcare internet of things: A case study on ecg feature extraction. In Proceedings of the 2015 IEEE International Conference on Computer and Information Technology; Ubiquitous Computing In addition, Communications; Dependable, Autonomic In addition, Secure Computing; Pervasive Intelligence In addition, Computing, Liverpool, UK, 26–28 October 2015; pp. 356–363. [Google Scholar]
  22. Mo, L.; Li, F.; Zhu, Y.; Huang, A. Human physical activity recognition based on computer vision with deep learning model. In Proceedings of the 2016 IEEE International Instrumentation and Measurement Technology Conference Proceedings, Taipei, Taiwan, 23–26 May 2016; pp. 1–6. [Google Scholar]
  23. Jiang, W.; Yin, Z. Human activity recognition using wearable sensors by deep convolutional neural networks. In Proceedings of the 23rd ACM International Conference on Multimedia, Brisbane, Australia, 26–30 October 2015; pp. 1307–1310. [Google Scholar]
  24. Puspitasari, A.J.; Famella, D.; Ridwan, M.S.; Khoiri, M. Design of low-flow oxygen monitor and control system for respiration and SpO2 rates optimization. J. Phys. Conf. Ser. 2020, 1436, 012042. [Google Scholar] [CrossRef]
  25. D’Aloia, M.; Longo, A.; Rizzi, M. Noisy ECG signal analysis for automatic peak detection. Information 2019, 10, 35. [Google Scholar] [CrossRef]
  26. Elumalai, G.; Ramakrishnan, R. A Novel Approach to Monitor and Maintain Database About Physiological Parameters of (Javelin) Athletes Using Internet of Things (IoT). Wirel. Pers. Commun. 2020, 111, 343–355. [Google Scholar] [CrossRef]
  27. Wang, Y.; Ye, Q.; Cheng, J.; Wang, L. RSSI-based bluetooth indoor localization. In Proceedings of the 2015 11th International Conference on Mobile Ad-hoc and Sensor Networks (MSN), Shenzhen, China, 16–18 December 2015; pp. 165–171. [Google Scholar]
  28. Devi, S.; Alvares, S.; Lobo, S. GPS Tracking System Based on Setting Waypoint Using Geo-Fencing. Asian J. Converg. Technol. AJCT. 2019. Available online: https://asianssr.org/index.php/ajct/article/view/738 (accessed on 19 August 2021).
  29. Muminov, A.; Na, D.; Lee, C.; Kang, H.K.; Jeon, H.S. Modern virtual fencing application: Monitoring and controlling behavior of goats using GPS collars and warning signals. Sensors 2019, 19, 1598. [Google Scholar] [CrossRef] [Green Version]
  30. Senthamilarasi, N.; Bharathi, N.D.; Ezhilarasi, D.; Sangavi, R. Child Safety Monitoring System Based on IoT. J. Phys. Conf. Ser. 2019, 1362, 012012. [Google Scholar] [CrossRef]
  31. Alsmady, A.; Awad, F. Optimal Wi-Fi access point placement for RSSI-based indoor localization using genetic algorithm. In Proceedings of the 2017 8th International Conference on Information and Communication Systems (ICICS), Irbid, Jordan, 4–6 April 2017; pp. 287–291. [Google Scholar]
  32. ThingSpeak. ThingSpeak. Available online: https://thingspeak.com/channels/1261115 (accessed on 10 February 2021).
Figure 1. Overview of the proposed WIoT based framework for Geo-fencing and remote monitoring of COVID-19 susceptible and patients.
Electronics 10 02035 g001
Figure 2. Worldwide daily COVID-19 reported cases [2].
Electronics 10 02035 g002
Figure 3. Worldwide daily COVID-19 deaths [2].
Electronics 10 02035 g003
Figure 4. The proposed WIoT based framework for Geo-fencing and Remote Monitoring of COVID-19 susceptible and patients.
Electronics 10 02035 g004
Figure 5. Wearable sensors placement on COVID patients.
Electronics 10 02035 g005
Figure 6. Algorithmic flow chart of the proposed wearable sensors placement and WIoT based framework for Geo-fencing and Remote Monitoring of COVID-19 susceptible and patients for health monitoring and quarantine management.
Electronics 10 02035 g006
Figure 7. Breathing rate estimation algorithm visualization.
Electronics 10 02035 g007
Figure 8. Cough estimation algorithm visualization.
Electronics 10 02035 g008
Figure 9. (a) Left arm dorsal (SpO 2 , Gyroscope and accelerometer sensors); (b) Chest (ECG, Breathing and temperature sensor, Bluetooth module (Master)); (c) Right arm dorsal (RSSI, Alarm status, GPS coordinates); (d) Gateway to centralized data (Slave for receiving data from sensors); (e) Centralized server for multiple patients; (f) Flask server for local server monitoring and ThingSpeak for remote analysis.
Electronics 10 02035 g009
Figure 10. Interfaced sensors with their connecting interfaces with Arduino.
Electronics 10 02035 g010
Figure 11. NodeMCU based Gateway for sensors data collection and enabling the IoT environment.
Electronics 10 02035 g011
Figure 12. Raspberry Pi centralized Flask server for data collection and visualization.
Electronics 10 02035 g012
Figure 13. Flask server for local monitoring for patient condition. (a) sign up page for patients authorized for concern authorities only; (b) index page with patient sign up and patient data integrated tabs.
Electronics 10 02035 g013
Figure 14. Sensors’ data visualization on the ThingSpeak Cloud.
Electronics 10 02035 g014
Figure 15. Geo-fencing of the COVID-19 susceptible and patients in Quarantine Management. (a) inside Geo-fence area; (b) outside Geo-fence area.
Electronics 10 02035 g015
Figure 16. ThingSpeak Channel visualization available at https://ThingSpeak.com/channels/1261115, accessed on 19 August 2021.
Electronics 10 02035 g016
Table 1. Literature review and related works for remote monitoring and classification of SARS-COVID patients using machine learning algorithms.
Ref. No.Research Paper ProposalSensorsAlgorithmsDetected ParametersTools
 [22]Human Activities Monitoring Based on Computer vision and deep learningMicrosoft’s Kinect SensorDeep learning; convolutional neural networkHuman physical activityTheano framework
 [23]Human Activity Recognition using Wearable SensorsTri-axial accelerometer and gyroscopeDeep Convolutional Neural Networks (DCNN)Human physical activityDSP Matlab, Machine learning tool (weka)
 [18]Real-time extraction of the respiratory rate from PPG signalsPulse oximeter sensorPPG feature extraction, Peak detection algorithm, Bland–Altman Plot, Majority rule algorithmRespiration Rate, heartbeatMatlab
 [20]PPG signal based extraction of Wearable ear blood saturation and pulse measurement systemPulse oximeter sensorMorphological filtering, Moving Average Algorithm, Peak detection AlgorithmSpO 2 , and Heart rate (HR)Matlab, other signal processing tools
 [19]Designing and Implementation of a Remote Monitoring Health SystemWearable sensorsRF algorithm, other classifiersHR, SpO 2 and cardiovascular disorderMachine learning suite i.e., Weka
 [15]CovidDeep: SARS- CoV-2/ COVID-19 Test Based on Wearable with efficient neural networksWearable Medical sensorsDNNsSARS COVID-II IdentificationWeka 3.0
 [16]Early Identification and Monitoring of COVID-19 Cases using IoTWearable sensor technology(SVM), Neural Network, Naive Bayes, (KNN)COVID-II IdentificationMachine learning tool
 [17]Chinese experts’ consensus on the IoT aided treatment and diagnosis of COVID-19Wearable sensors technologyIntelligent Diagnosis and Treatment Assistant Program (nCapp)COVID-II IdentificationMachine learning tool
 [7]wearable sensors and IoT based COVID-19 prediction and symptom analysiswearable sensors (Temperature, SpO 2 , RR, HR)Intelligent Diagnosis and IoT technologyCOVID-II IdentificationArduino, cloud computing
Table 2. Related work about sensors for physiological parameter extraction and processing.
Ref. No.Research Paper ProposalSensorsAlgorithmsDetected ParametersTools
 [25]Noisy ECG Signal AnalysisNoise containing ECG raw signalSignal enhancing Algorithm, Filtration Algorithm, Peak detection AlgorithmQRS complex and R-peak detectionMatlab
 [21]Fog computation in HIoT A Case Study on ECG Feature ExtractionRaw ECG SignalPeak detection algorithmQRS complex, R-peak detection and HRMatlab, Python
 [26]Monitoring and Maintaining Database About Physiological Parameters of Athletes Using IoTBlood pressure, Heart rate, and ECG sensorsCloud uploadingBlood pressure, Heart rateMatlab, SQL database and Arduino IDE
 [8]ECG Signal processing and abnormality detection using KNN classifier by VH-doctorECG biomedical sensor (AD 8232)KNN AlgorithmHR, HRV, and cardiovascular disease detectionMachine Learning suite i.e., WEKA
Table 3. Related work for surveillance detection using GPS and RSSI level integration.
Ref. No.Research Paper ProposalSensorsAlgorithmsDetected ParametersTools
 [30]IoT based Child Safety Monitoring SystemTemperature Sensor, GPSMachine learning algorithm, Big dataTemperature, web camera images, GPS locationPython, PHP
 [10]Bus tracking system using GPSGPS SensorAndroid, GPS, GSM, Location Based Services, Clustering, Artificial Neural NetworkGPS coordinates, Distance from station, VelocityPython
 [29]Controlling and Monitoring Behavior of goats Using GPS CollarsGPS SensorKinematic Differential Global Positioning System, Kernel Trick algorithmGPS Coordination and Artificial intelligenceServer GUI, Google Maps
 [28]Setting way point using geofencing and GPS TrackingGPS SensorDjikstra’s shortest path algorithmGPS live position monitoring, Tracking recordsLinux, Apache. MySQL, PHP Python
 [11]RSSI-Based Indoor Localization With IoTZigbee, BLE, Wi-FiLoRaWAN, path loss model architectureRSSI Level, Distance measurement using Path loss modelPython, Arduino
 [27]RSSI-based Indoor Localization using BluetoothBluegiga’s Bluetooth Smart SDKLIL (Low precision indoor Localization) and HIL (High precision indoor localization) schemes.BLE RSSI Level using HIL and LIL localizationANSI C
 [31]Optimal Wi-Fi Placement for RSSI-Based Indoor Localization Using Genetic AlgorithmWi-FiGenetic algorithmRSSI level, Distance measurementJava
Publisher’s Note: MDPI stays neutral with regard to jurisdictional claims in published maps and institutional affiliations.

