
Stock Market Prediction Using Machine Learning Techniques: A Decade Survey on Methodologies, Recent Developments, and Future Directions

 ,
,  and
and
Abstract
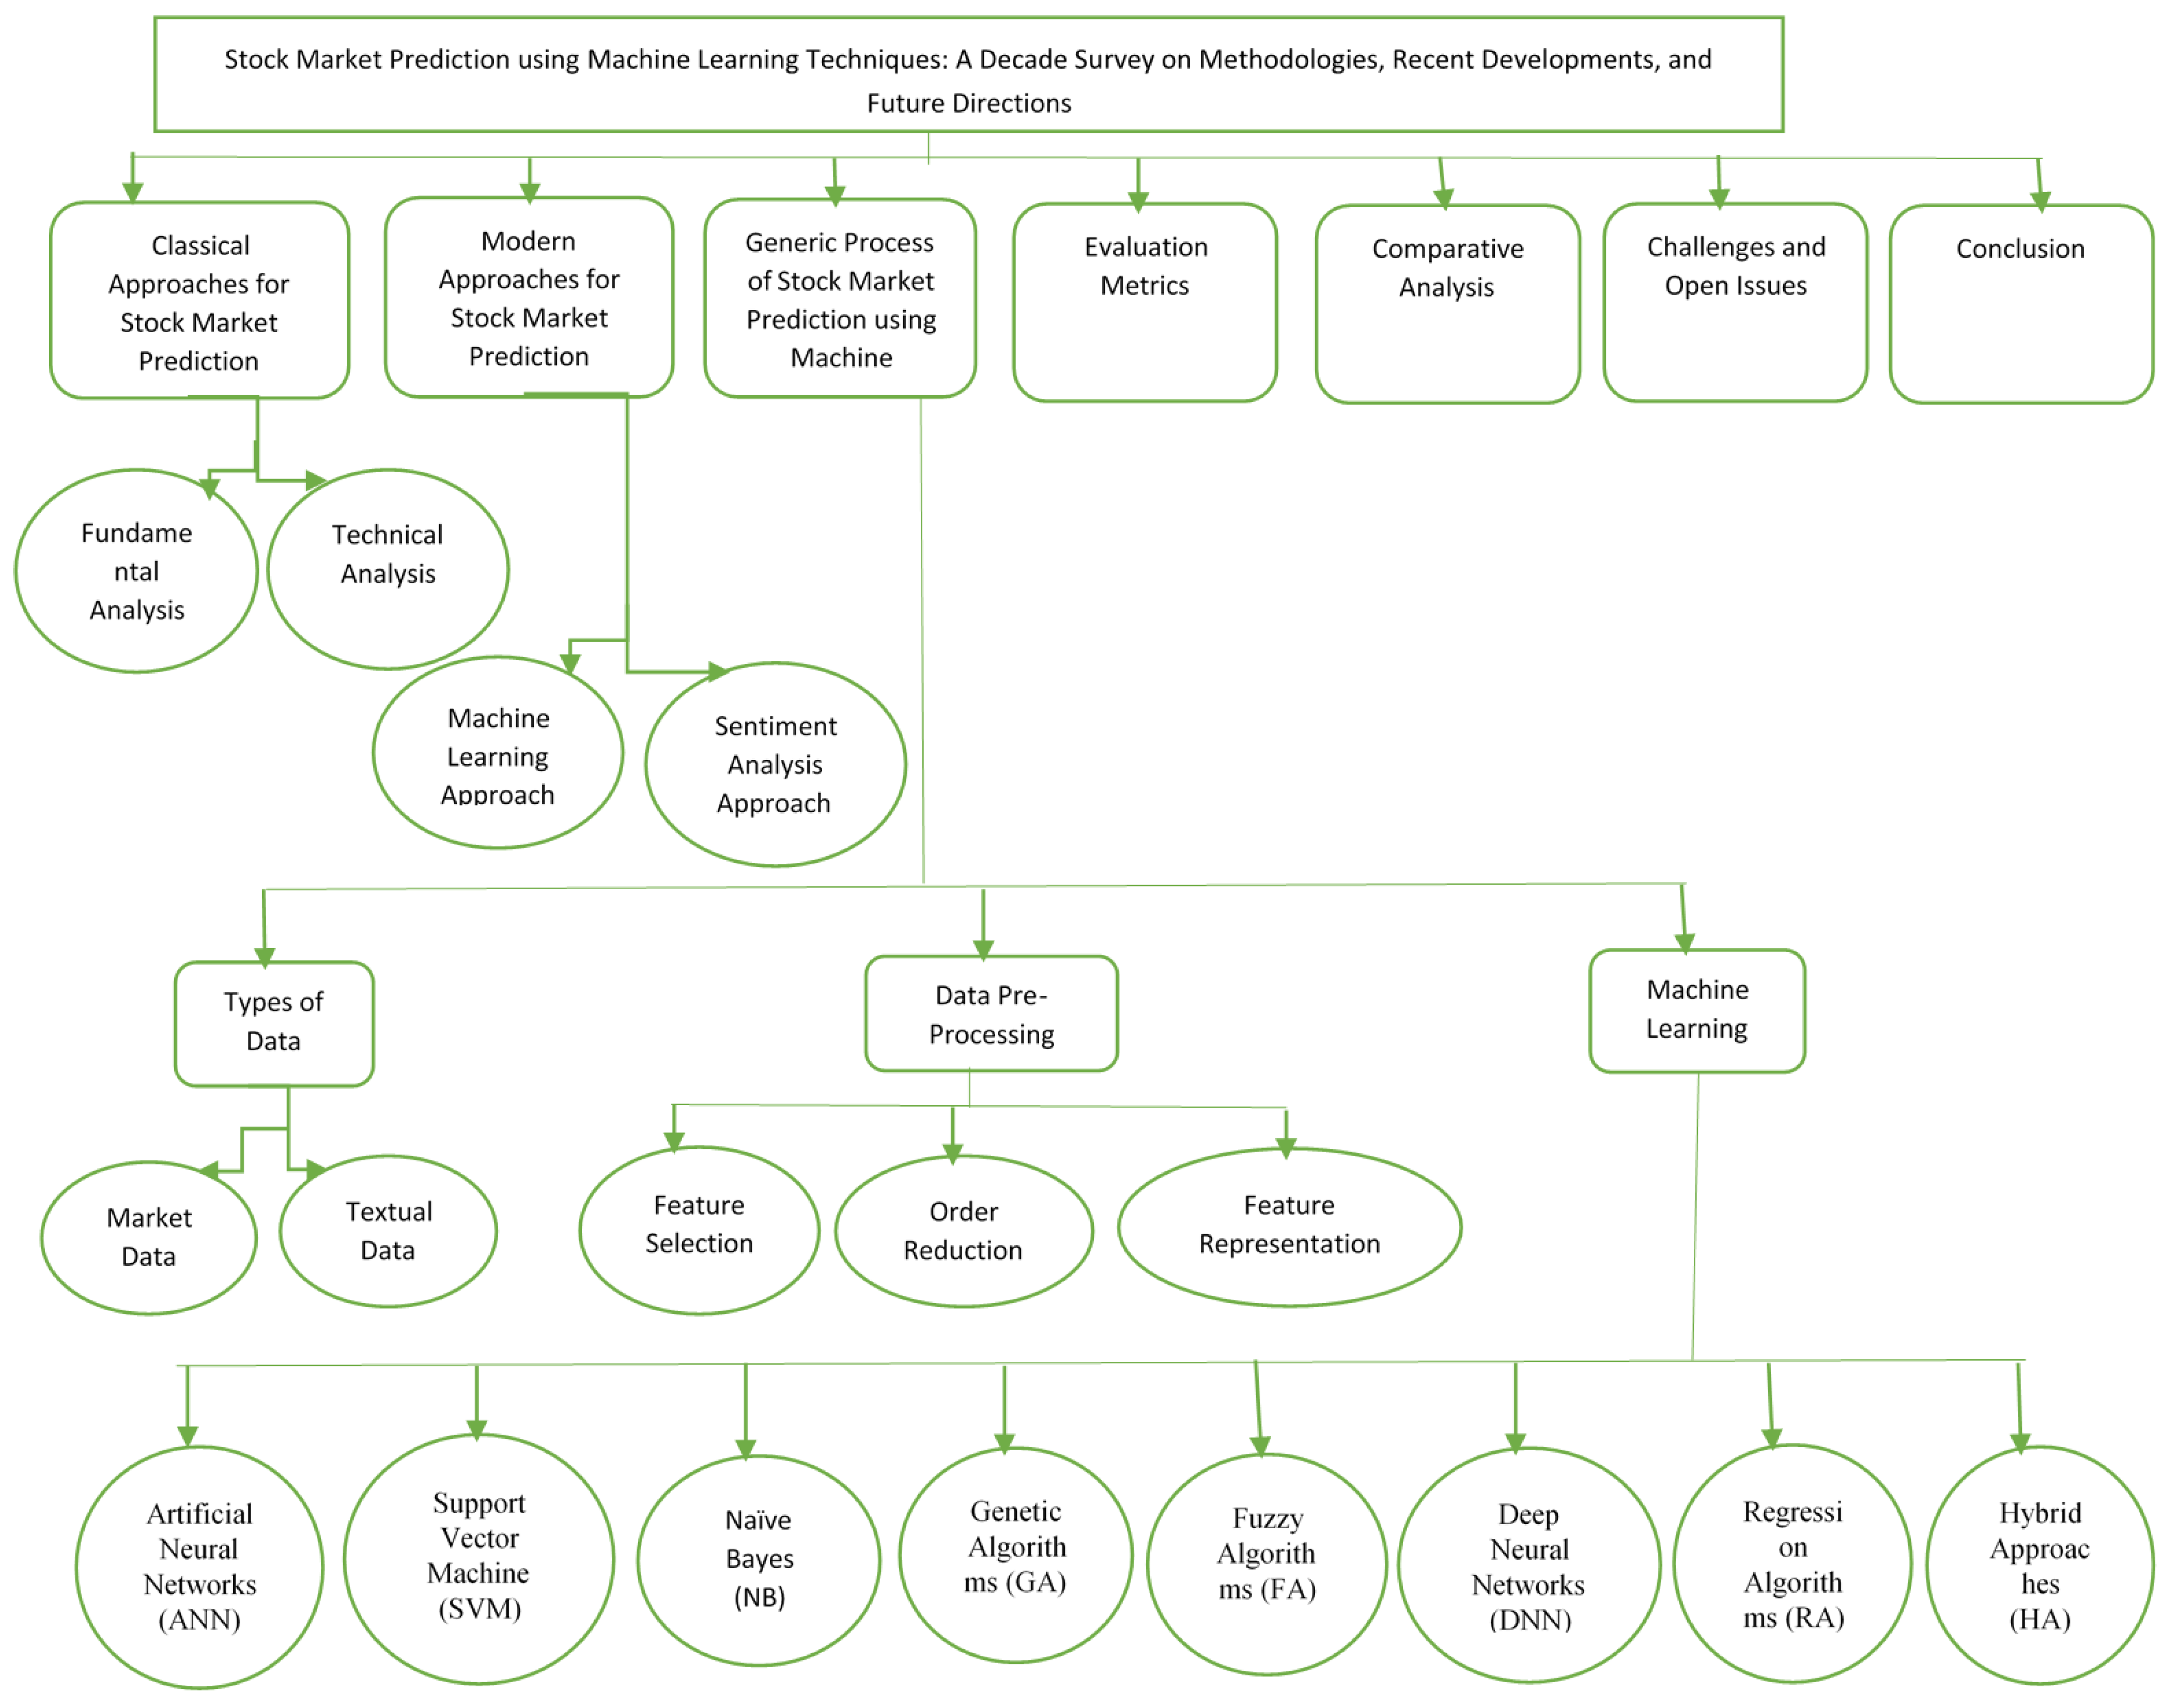
:1. Introduction
1.1. Classical Approaches for SMP
1.1.1. Fundamental Analysis
1.1.2. Technical Analysis
1.2. Modern Approaches for SMP
1.2.1. Machine Learning Approach
1.2.2. Sentiment Analysis Approach
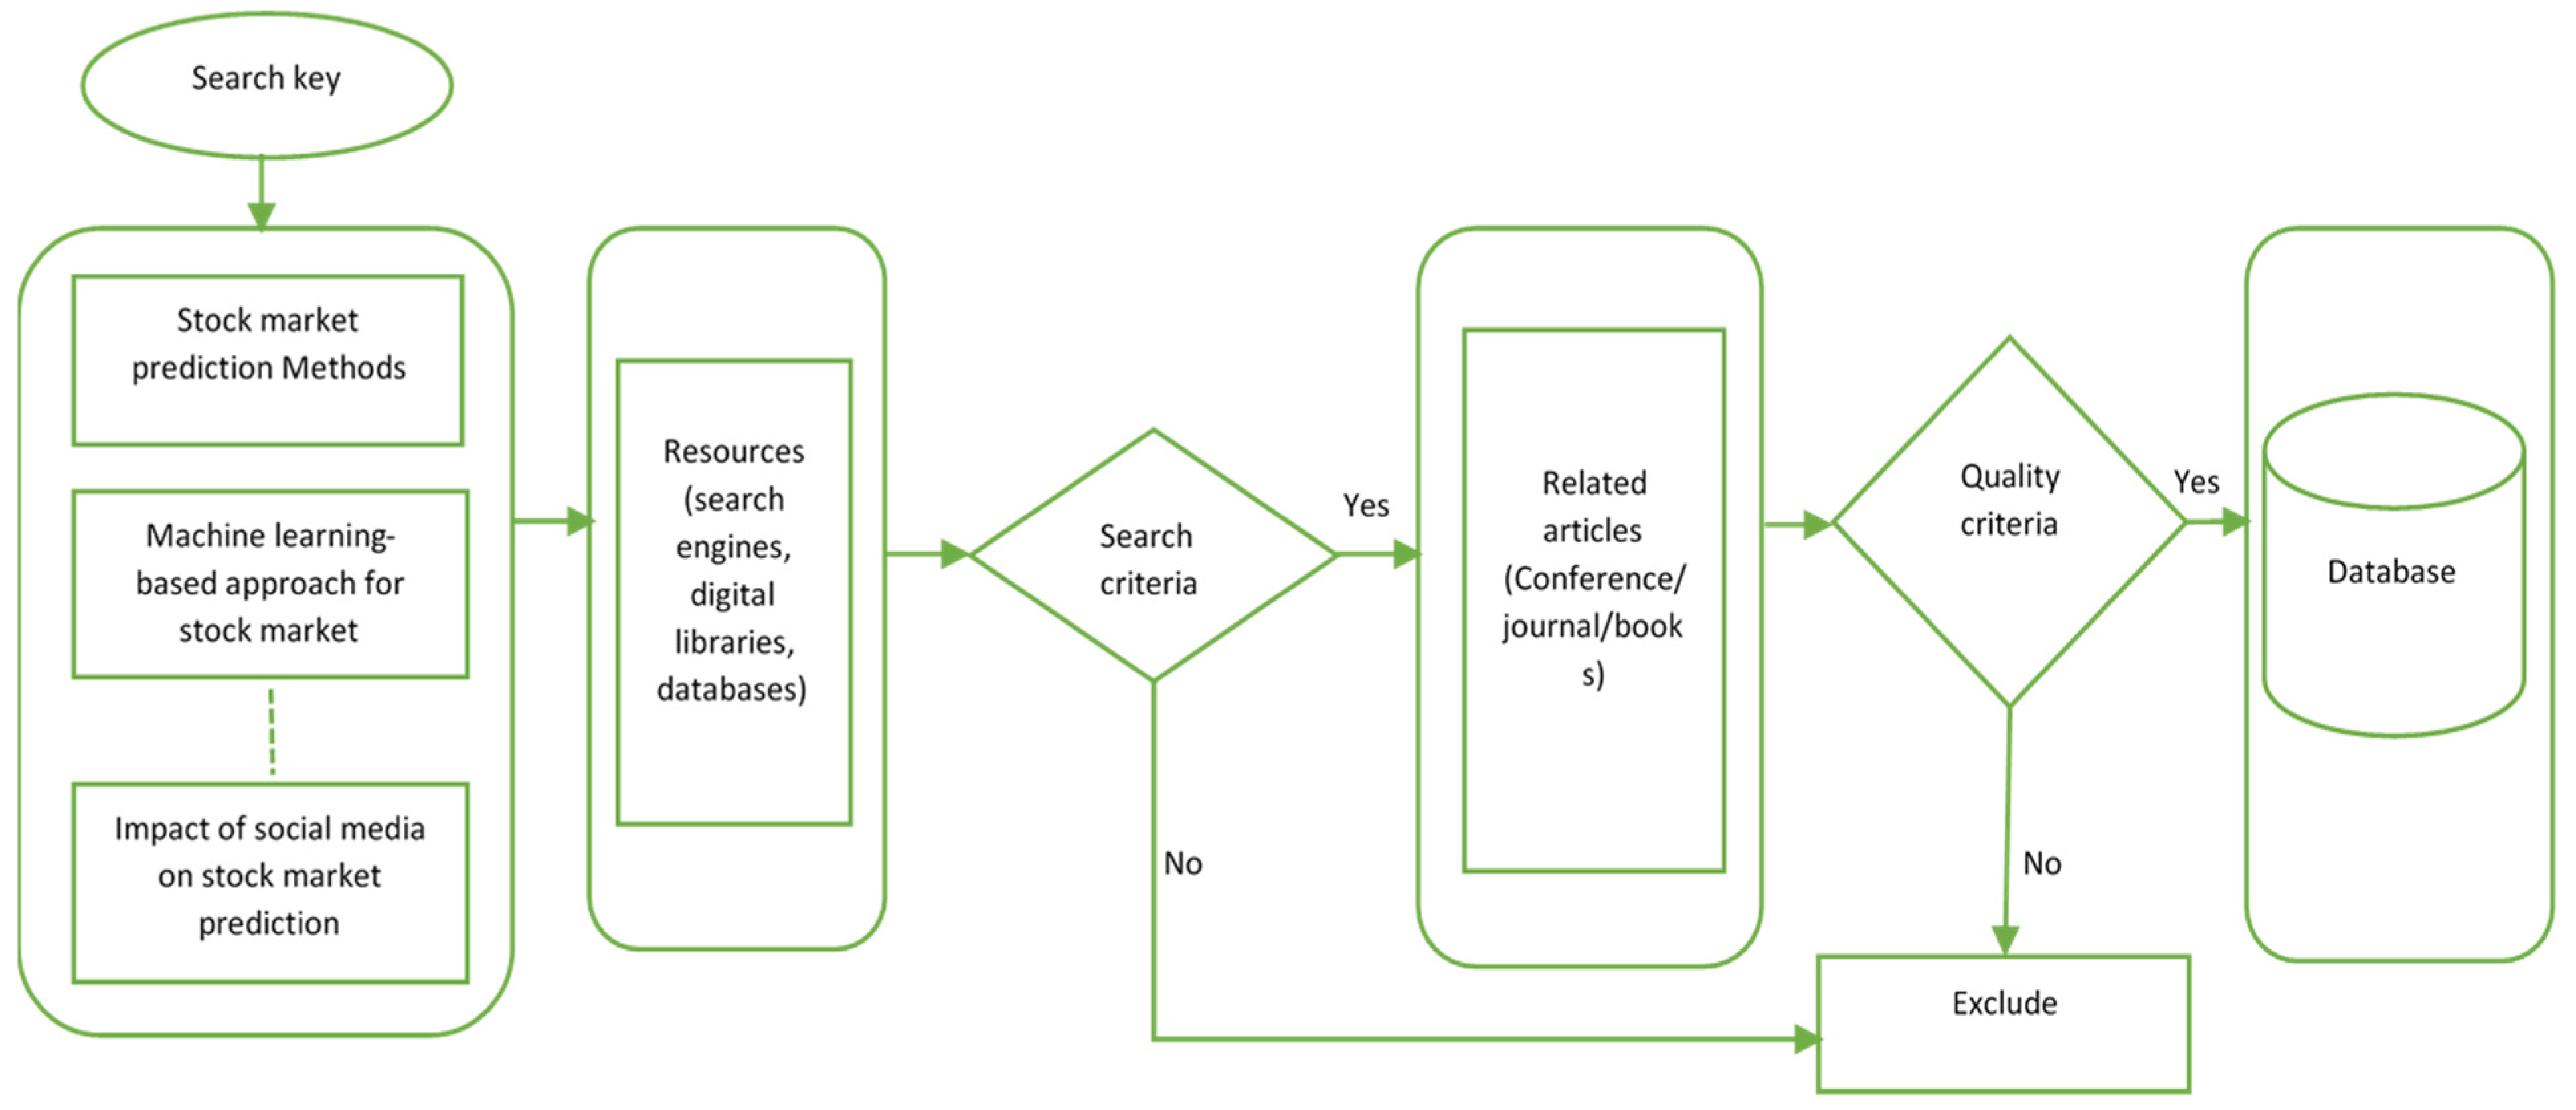
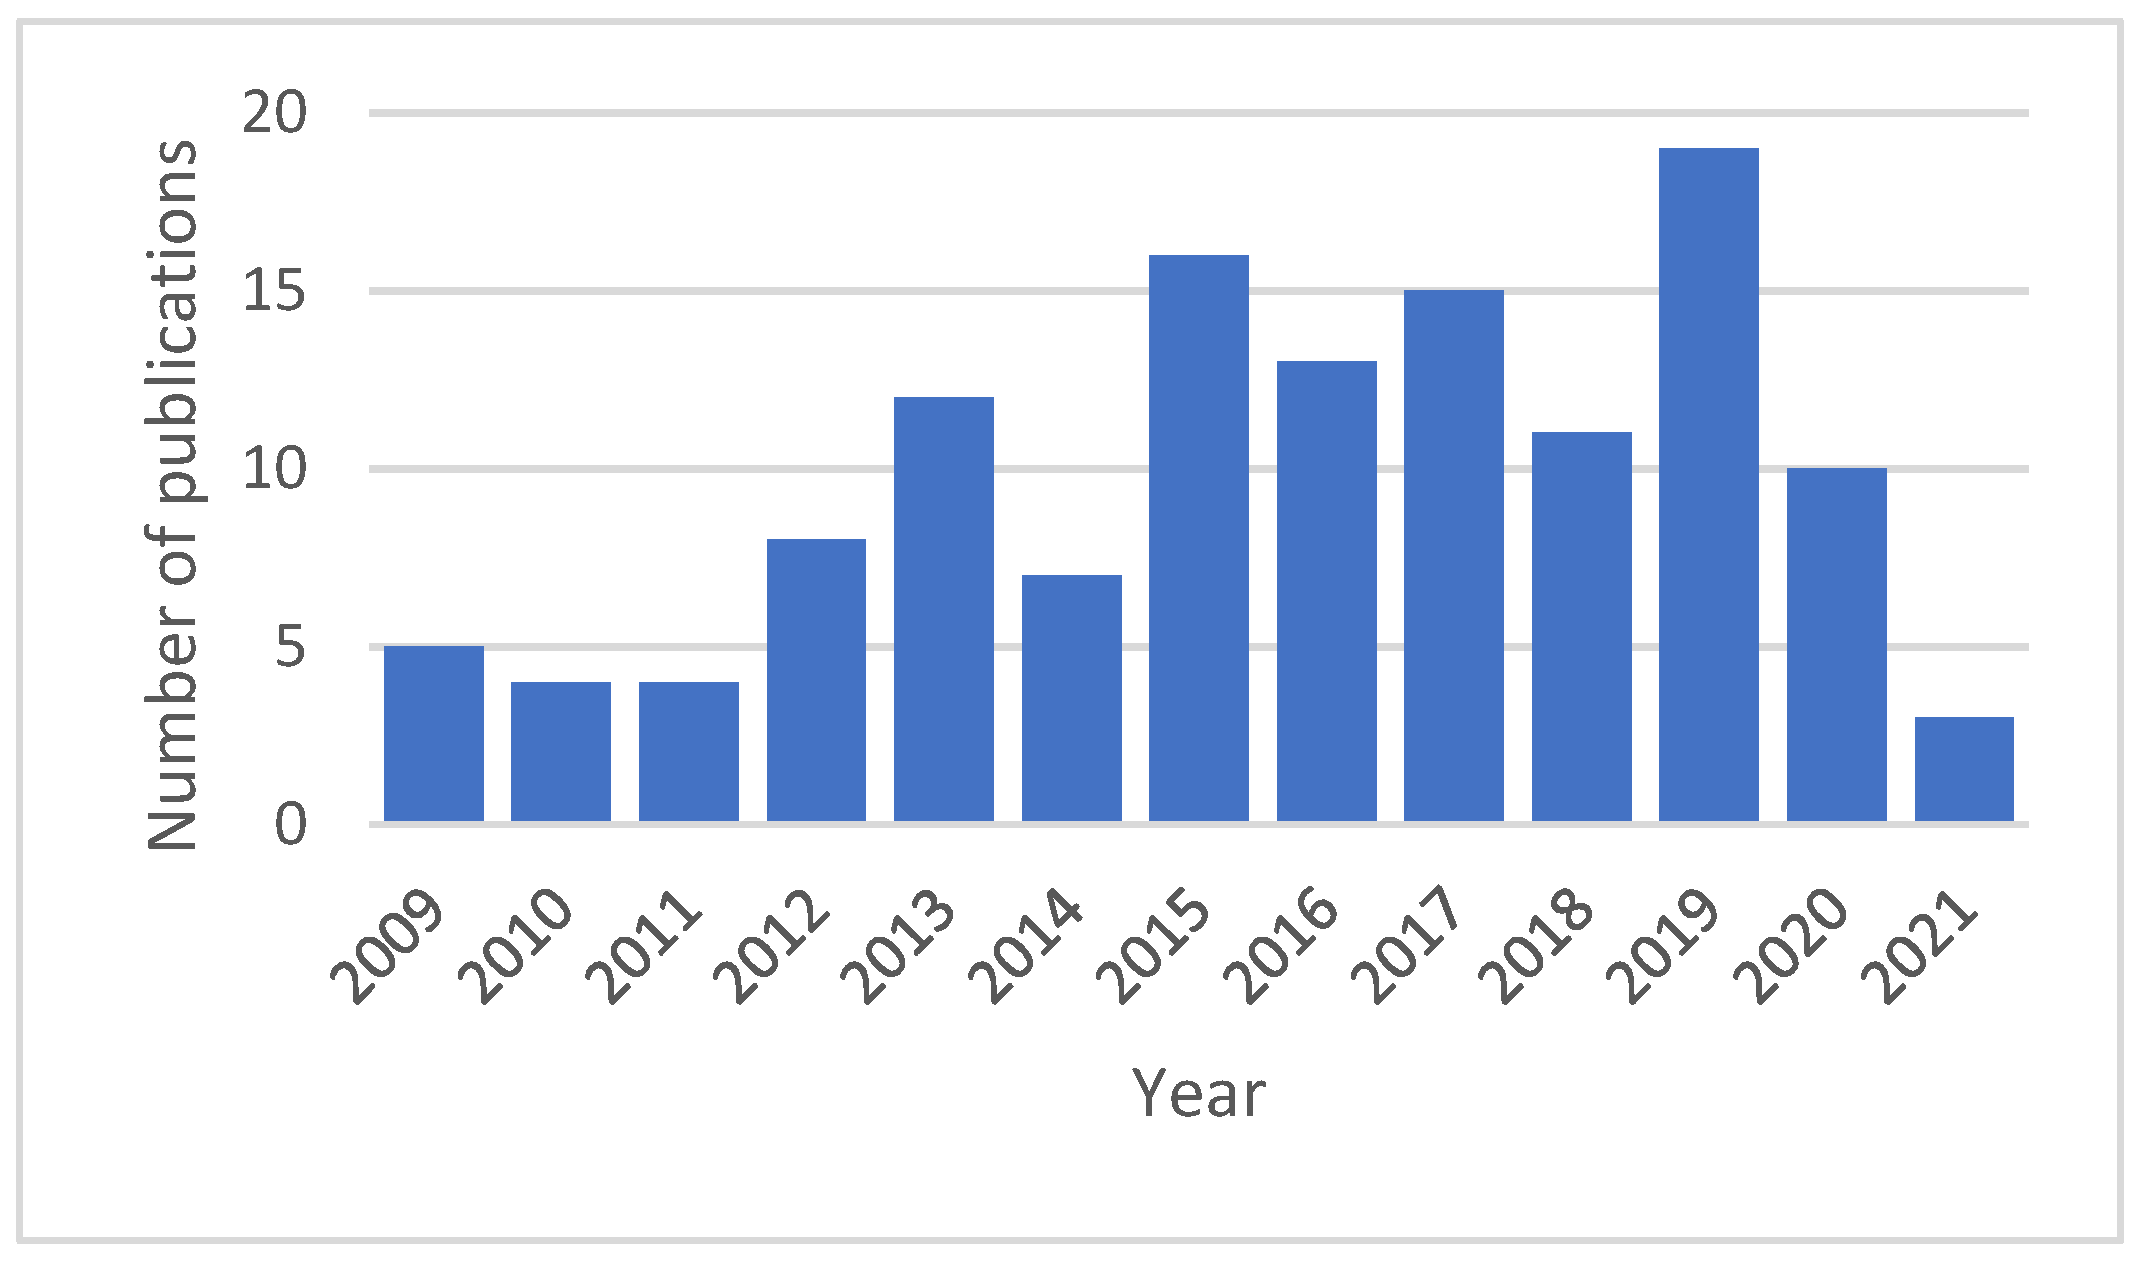
2. Research Methodology
3. Generic Scheme for SMP
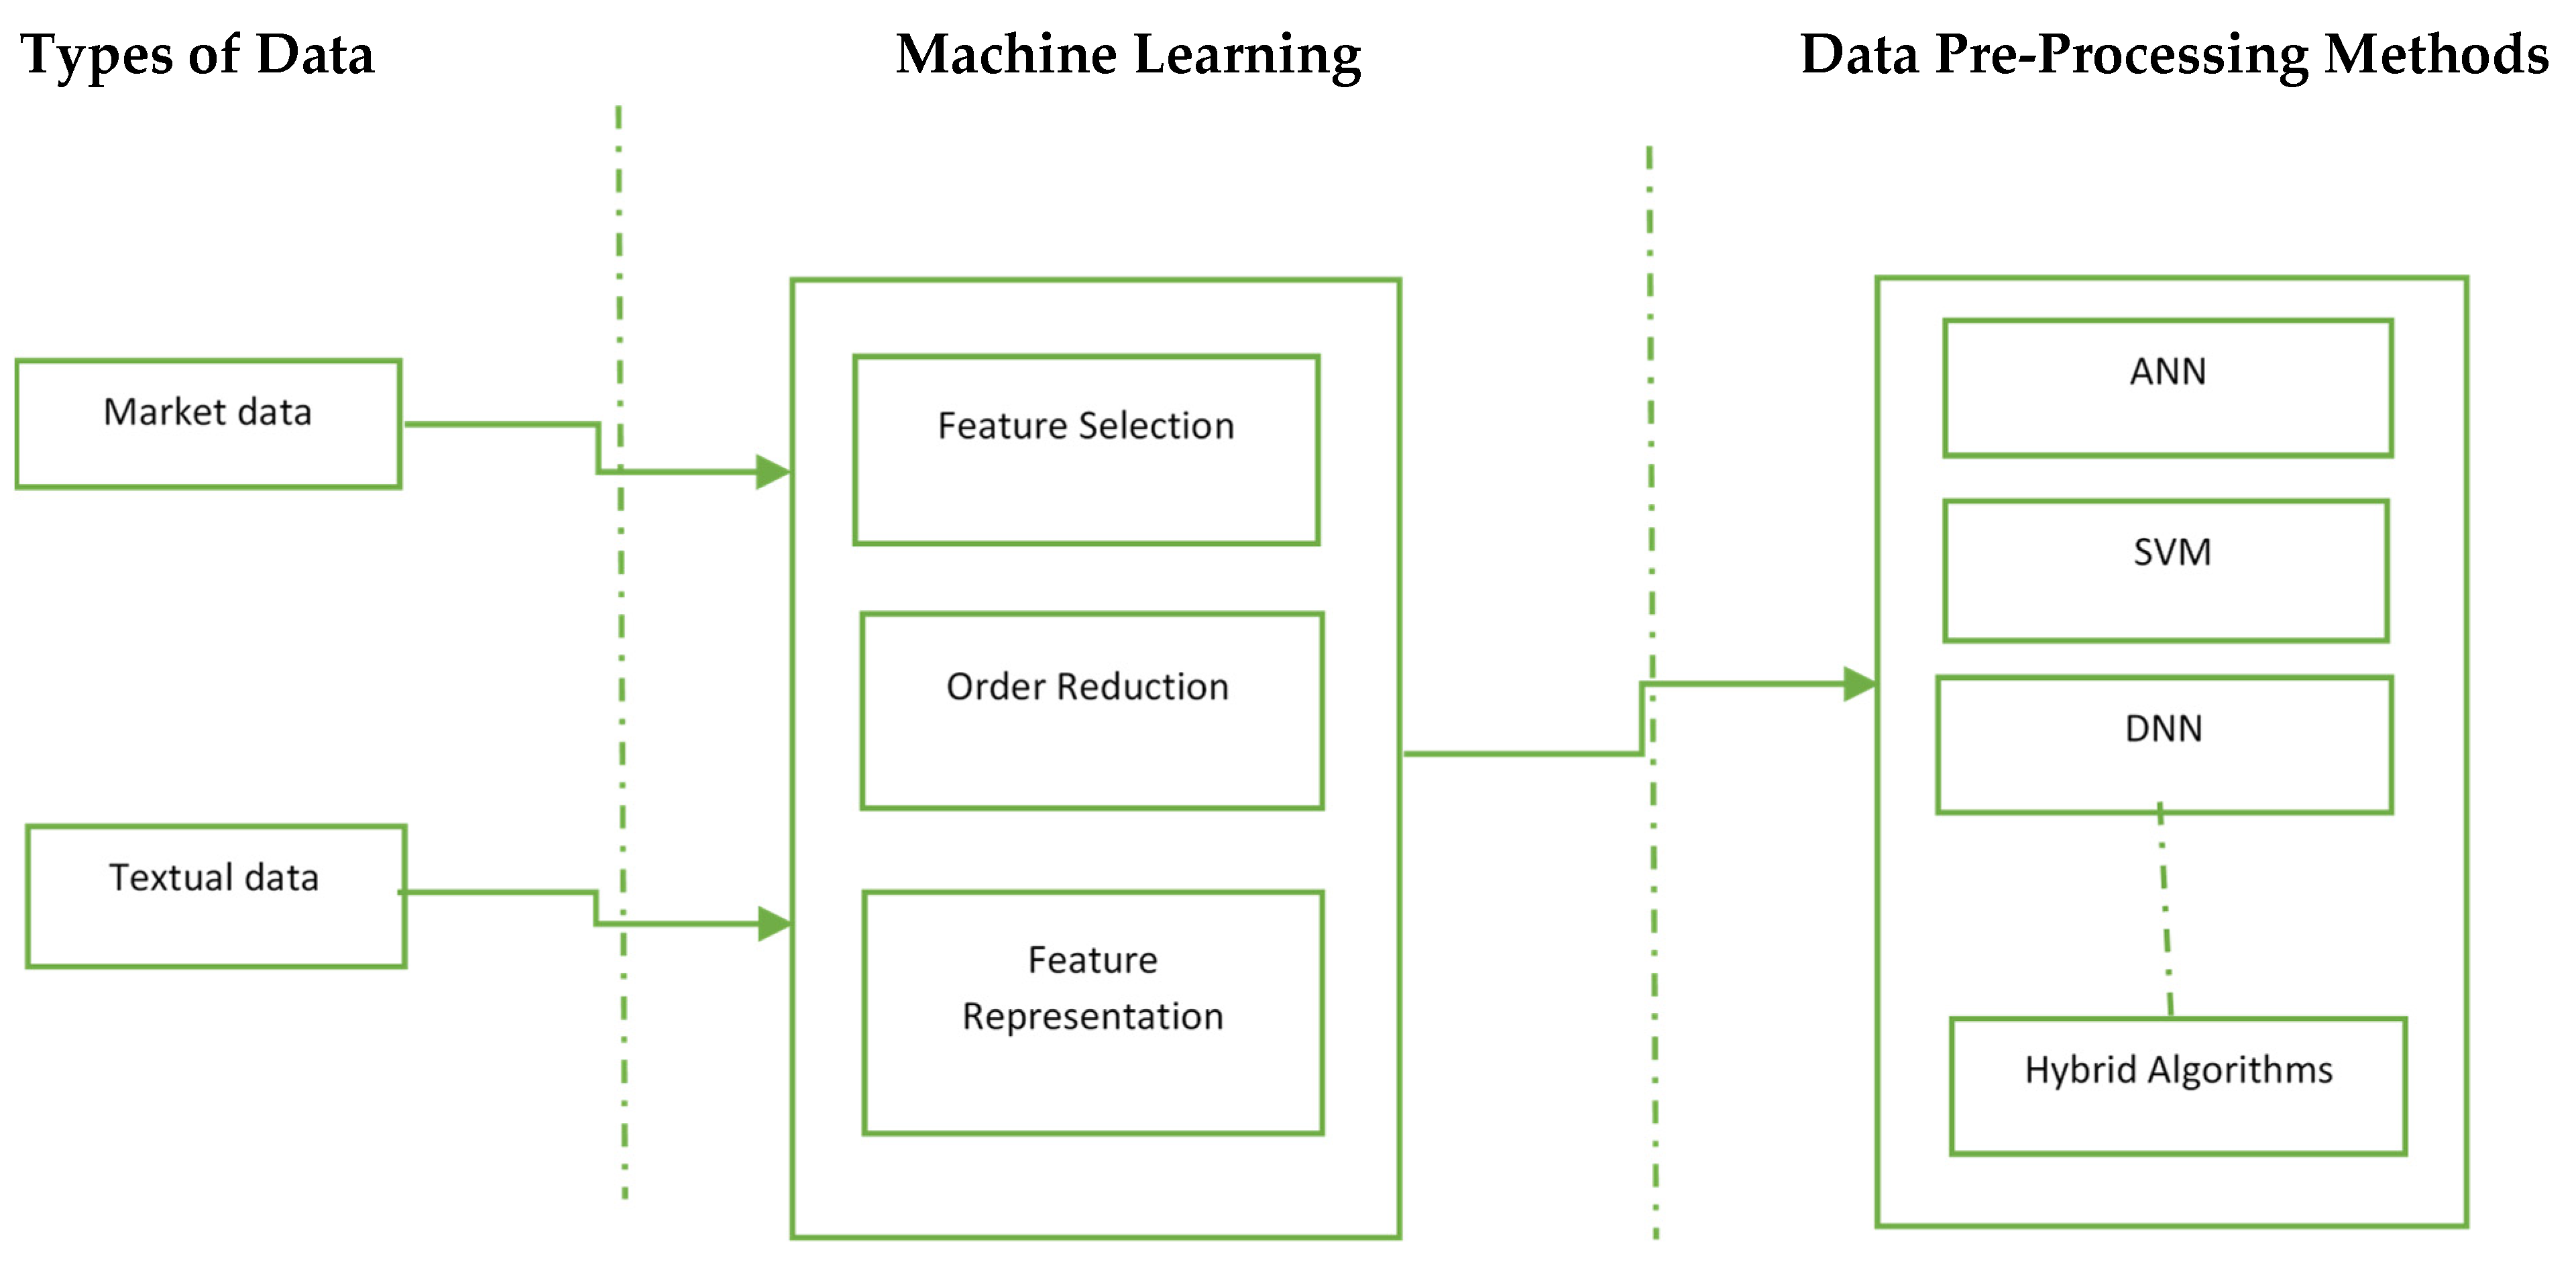
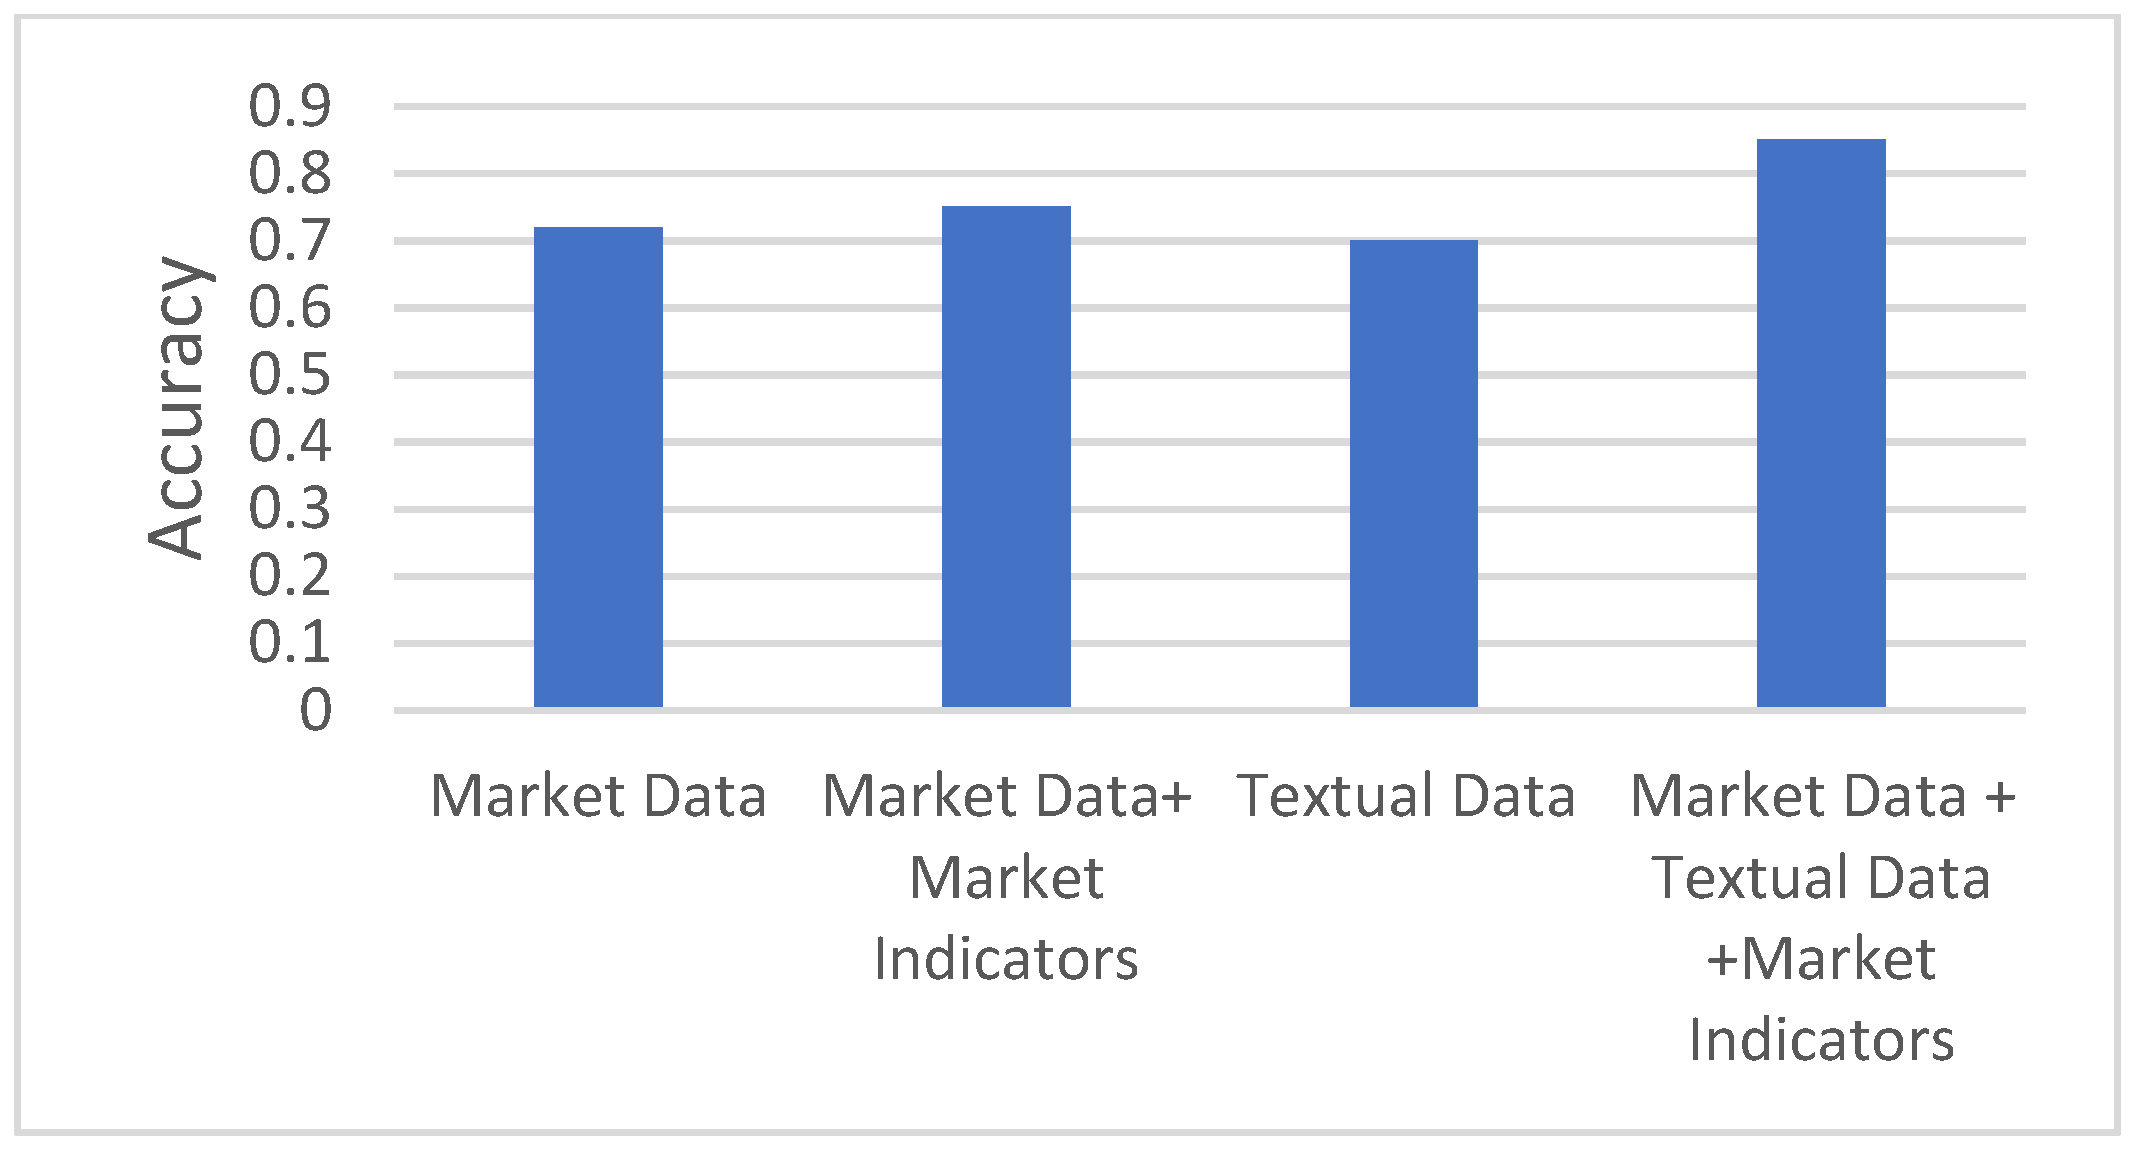
4. Types of Data
4.1. Market Data
4.2. Textual Data
5. Data Pre-Processing

| References | Data | Type of Input | Prediction Duration |
|---|---|---|---|
| [37] | S&P 500 | Market data | Few days ahead |
| [38] | NASDAQ index | Market data | Few days ahead |
| [39] | DAX 30 | broker house newsletters, RSS market feeds, and stock exchange data | Intraday |
| [56] | Yahoo Finance | Financial News | Intraday |
| [44] | DGAP, Euro-Adhoc | Corporate announcements financial new | Daily |
| [58] | Yahoo finance (18 Stock Companies data) | Market data, yahoo finance message board data | Daily |
| [35] | DJIA | Market data and Twitter | Daily |
| [32] | BSE and NSE stocks | Market data, technical indicators, Twitter data | Intraday |
| [36] | Nifty and Sensex | Market data and news | Intraday |
| [47] | Yahoo Finance | Market data, Twitter data, and news data | Daily and monthly |
| [49] | S&P, NYSE, DJIA | Market data, Technical Indicators, Social media data | Daily weekly |
| [51] | Apple, yahoo | Market data, technical indicators | 60 day and 90-day prediction |
| [63] | Microsoft company | Daily | |
| [42] | NASDAQ, DJIA, Apple Stock (AAPL) | Market data, technical indicators, news. | One-day ahead |
| [43] | Google stock | Market data | Five days horizon |
| [45] | Taiwan Stock Exchange CWI | Market data | High-frequency trading |
| [68] | S&P 500 | Market data | Daily |
| [50] | Columbia Stock Market | Market data, Technical indicators | Next day |
| [69] | S&P 500 | Financial news from Noodle, Reuters | Intraday |
| [70] | Enron Corpus | Sentiment data | Daily, weekly |
| [46] | BSE, Tech Mahindra | Market data | Daily and weekly |
| [71] | Apple stock data | Market data | Daily |
| [72] | United States stock exchange | Market data, technical indicator | Daily |
| [73] | KSE, LSE, Nasdaq, NYSE | Twitter, yahoo finance, Wikipedia | Weekly |
| [74] | Google stock | Market data | Daily |
| References | Feature Selection | Order Reduction | Feature Representation |
|---|---|---|---|
| [39] | Bag of Words | Stemming | Sentiment value |
| [56] | Opinion Finder overall tone and polarity | Minimum Occurrence per document | Boolean |
| [44] | Bag-of-words, noun phrases, word combinations, n-gram | Frequency for news, Chi2-approach and bi-normal separation (BNS) for exogenous-feedback-based feature selection, dictionary | TF-IDF |
| [75] | Bag-of-words | WordNet to replace words | TF-IDF |
| [76] | N-grams | Document frequency | Boolean |
| [32] | Context based approach | SentiWordNet | Sentiment value |
| [58] | Bag of words, LDA, JST, Aspect Based | - | TF-IDF |
| [47] | Correlation | Lemmatization | Boolean |
| [69] | Bag of Words | Chi2, Information Gain, Document Frequency, Occurrence | TF-IDF |
| [77] | Bag-of-word, Word2vec | TF-IDF | |
| [78] | GA | PCA, FA, FO | - |
| [79] | N-grams | SVM based Recursive Feature Elimination, PCA, KPCA, and XGB | - |
| [73] | Bag-of-words | Occurrence | TF-IDF |
| [80] | GA, Feature Ranking | PCA-SVM, DA-RNN | - |
5.1. Feature Selection
5.2. Order Reduction
5.3. Feature Representation
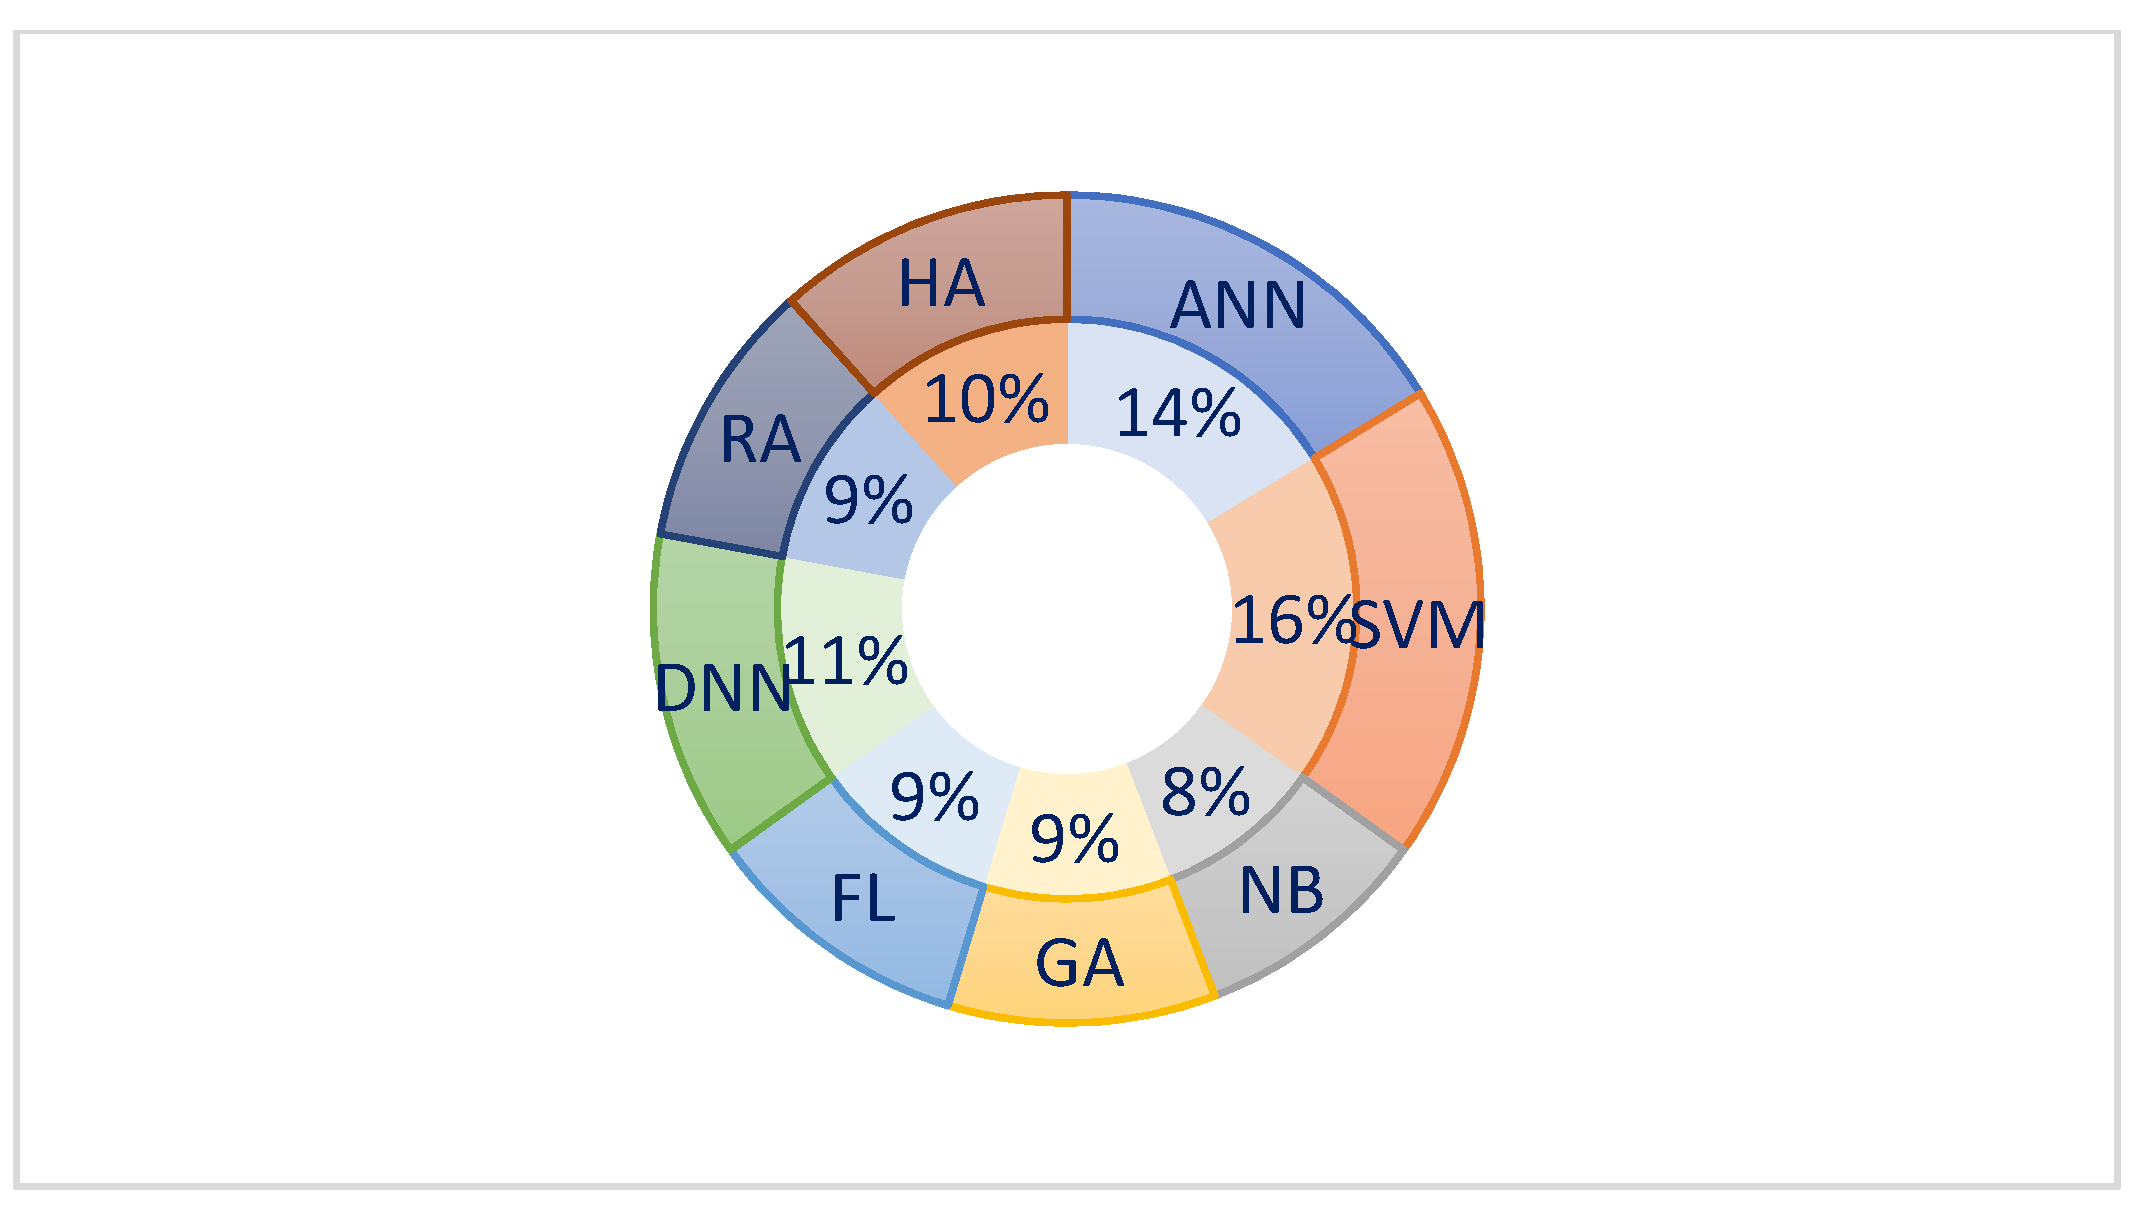
6. Machine Learning Methods
- Artificial Neural Networks (ANN)
- Support Vector Machine (SVM)
- Naïve Bayes (NB)
- Genetic Algorithms (GA)
- Fuzzy Algorithms (FA)
- Deep Neural Networks (DNN)
- Regression Algorithms (RA)
- Hybrid Approaches (HA)
6.1. Artificial Neural Networks (ANN)
6.2. Support Vector Machine (SVM)
6.3. Naïve Bayes (NB)
6.4. Genetic Algorithms (GA)
6.5. Fuzzy Algorithms (FA)
6.6. Deep Neural Networks (DNN)
6.7. Regression Algorithms (RA)
6.8. Hybrid Approaches (HA)
| References | ANN | SVM | NB | DNN | FL | HA | GA | RA | EA |
|---|---|---|---|---|---|---|---|---|---|
| [134] | ✓ | ||||||||
| [38] | ✓ | ||||||||
| [44] | ✓ | ||||||||
| [39] | ✓ | ||||||||
| [56] | ✓ | ||||||||
| [92] | ✓ | ||||||||
| [40] | ✓ | ✓ | |||||||
| [143] | ✓ | ✓ | |||||||
| [58] | ✓ | ||||||||
| [63] | ✓ | ✓ | |||||||
| [103] | ✓ | ✓ | ✓ | ||||||
| [51] | ✓ | ✓ | |||||||
| [68] | ✓ | ||||||||
| [43] | ✓ | ✓ | |||||||
| [102] | ✓ | ||||||||
| [114] | ✓ | ||||||||
| [42] | ✓ | ✓ | ✓ | ||||||
| [45] | ✓ | ✓ | |||||||
| [69] | ✓ | ✓ | ✓ | ||||||
| [77] | ✓ | ||||||||
| [133] | ✓ | ✓ | |||||||
| [106] | ✓ | ✓ | ✓ | ||||||
| [71] | ✓ | ✓ | |||||||
| [72] | ✓ | ✓ | ✓ | ||||||
| [124] | ✓ | ✓ | |||||||
| [41] | ✓ | ✓ | ✓ | ||||||
| [74] | ✓ | ✓ | |||||||
| [73] | ✓ | ✓ | ✓ | ||||||
| [80] | ✓ | ✓ |
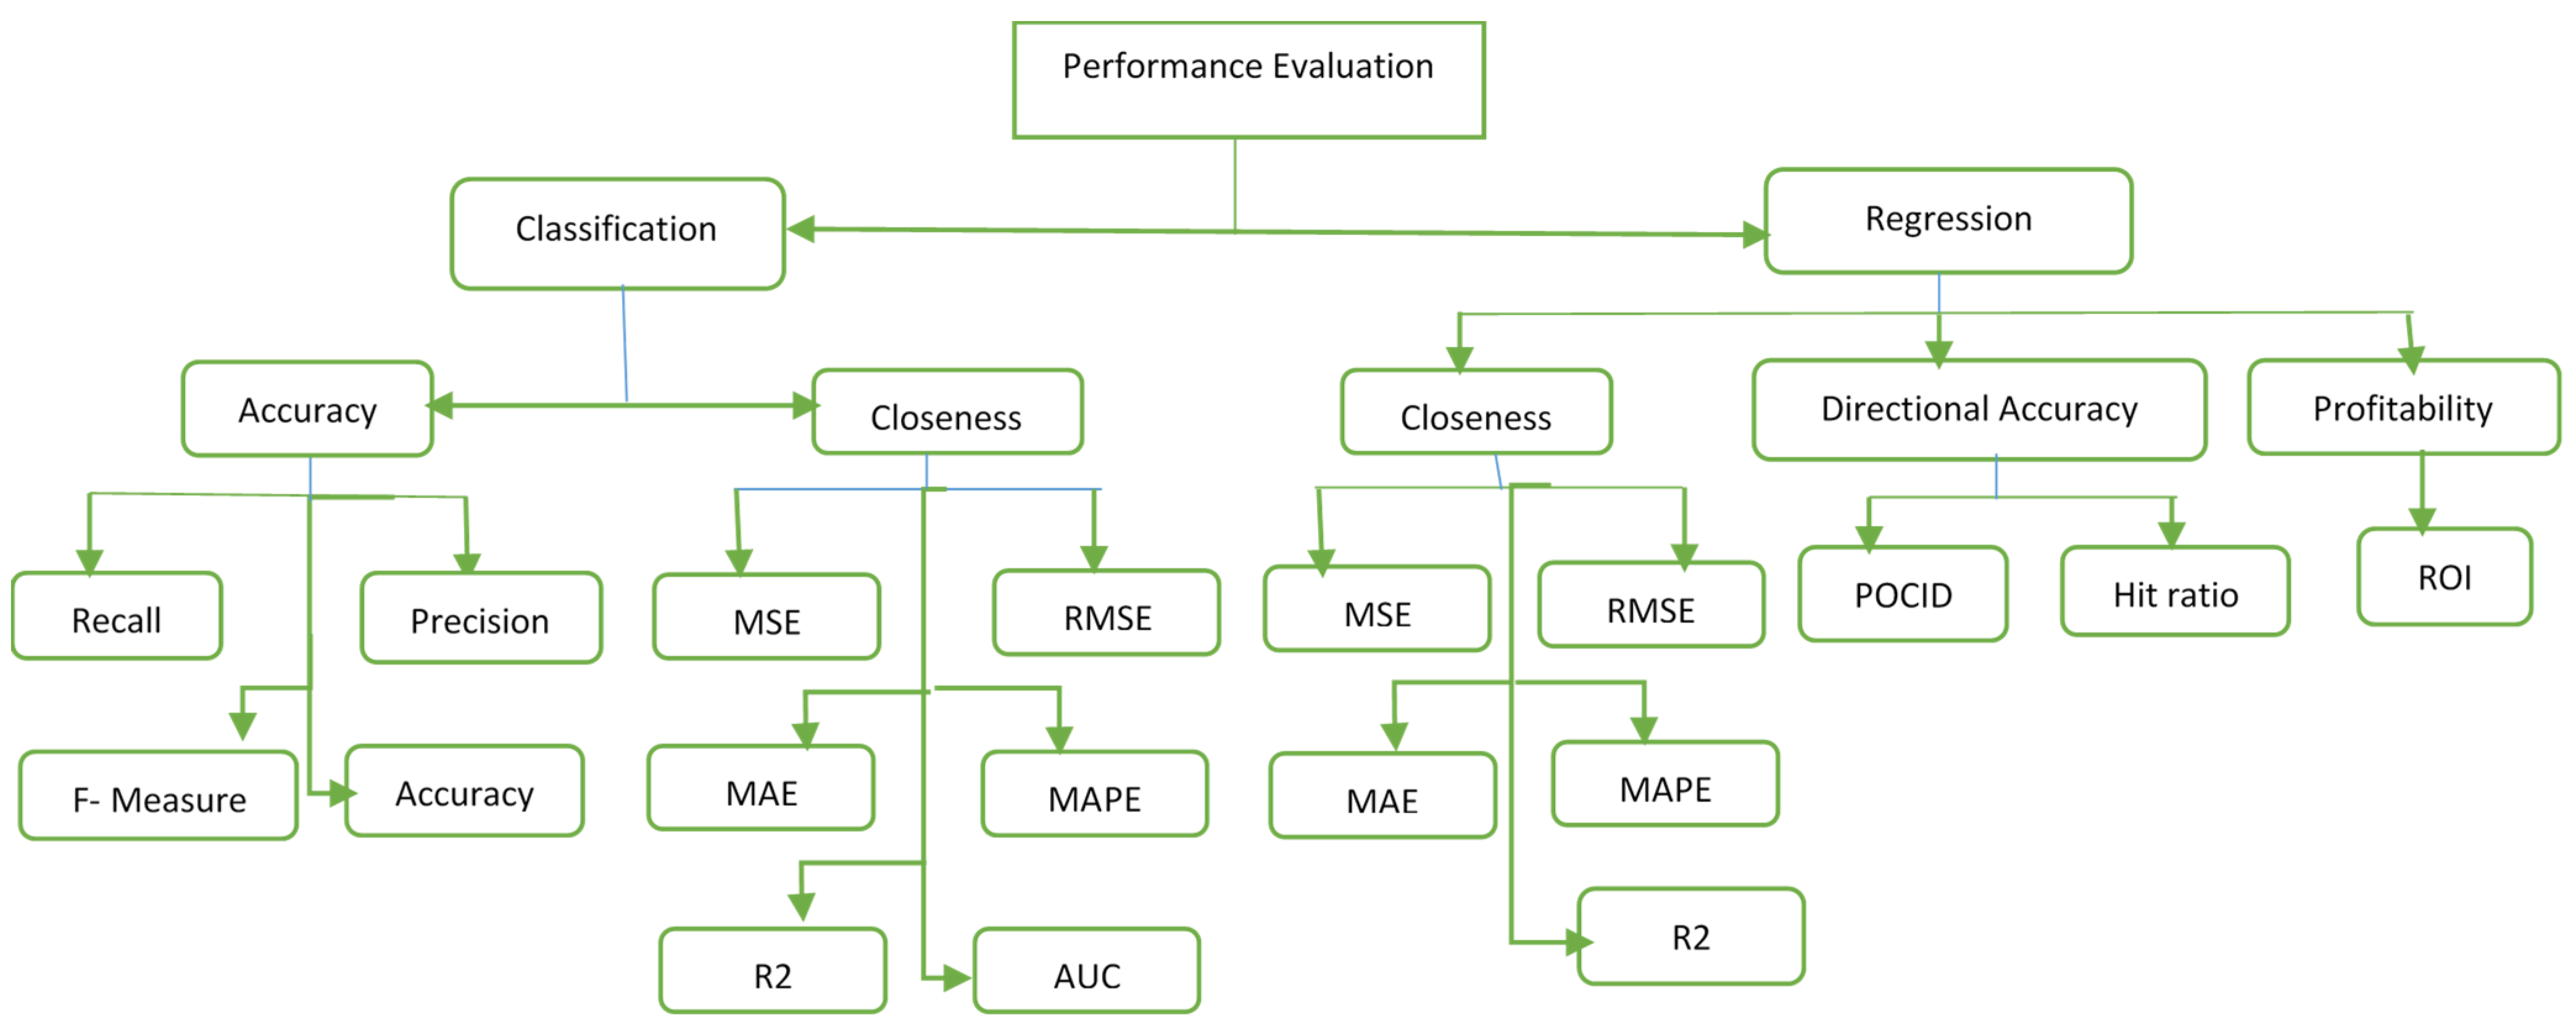
7. Evaluation Metrics
| Reference | Performance Measure | Prediction Type | Output |
|---|---|---|---|
| [38] | MSE, MAD% | Few days ahead | MAD% (2.32) MLP |
| [56] | Accuracy, trading return | Intraday | 59.0%, 3.30% |
| [44] | Accuracy | Daily | 65.1% |
| Kalyanaraman, V., 2014 | Accuracy | Daily | 81.82% |
| [58] | Accuracy | Daily | Average accuracy of 54.4% |
| [40] | Accuracy, RMSE | Daily | 59.6% |
| [47] | Accuracy | Daily and monthly | DBT achieved better accuracy (76.9%) than SVM and LR |
| [63] | Accuracy and correlation | Daily | Accuracy of around 70% |
| [51] | Accuracy, RMSE | Long-term | 99% accuracy for yahoo data (XGBoost) |
| [49] | Error Rate, F-measure | Next Month, Next Week | 0.85 |
| [42] | Accuracy, f-measure, precision, AUC | One day ahead | 85% |
| [43] | Log loss and accuracy | Daily, weekly | 72% accuracy (LSTM) |
| [68] | Accuracy, Return | Daily | 58.1% |
| [123] | Accuracy, MSE | Long short-term | 56.7% (LSTM),57.2% (ELSTM) |
| [70] | Accuracy | Daily, weekly | 80% |
| [69] | Accuracy, f-measure | 0.84 | |
| [50] | Accuracy | Daily | 72% |
| [133] | MSE, MAE, MAPE and R2 | Daily | LR 0.73SVM 0.93 |
| [106] | MAPE | Daily | 2.03–2.17 |
| [71] | training error, testing error | Daily | 0.03, 0.072 |
| [41] | RMSE, Accuracy, AUC, R2, MAE | Monthly | >90%(Ensemble) |
| [74] | Accuracy | Monthly | 87.32 |
| Seethalakshmi, R., 2020 | R2, AIC | ……… | 0.992 (R2) |
| [140] | Accuracy | Next few days | 90–96% (KNN Regression) |
| [73] | Precision, recall, f-measure, accuracy | Weekly | 76.5% |
| [80] | MSE | Daily | 0.0039(GA-LSTM) |
8. Overfitting
9. Comparative Analysis
10. Challenges and Open Issues
11. Conclusions
Author Contributions
Funding
Data Availability Statement
Conflicts of Interest
Abbreviations
| SMP | Stock Market Prediction |
| SVM | Support Vector Machine |
| ANN | Artificial Neural Network |
| DNN | Deep Neural Network |
| RA | Regression Analysis |
| FA | Fuzzy Algorithm |
| NB | Naïve Bayes |
| GA | Genetic Algorithm |
| HA | Hybrid Approach |
| kNN | k- Nearest Neighbors |
| LDA | Latent Dirichlet Allocation |
| PCA | Principle Component Analysis |
| XGB | eXtreme Gradient Boost |
| FO | Firefly Optimization |
| TF-IDF | Term Frequency- Inverse Document Frequency |
| GARCH | Generalized Auto-regressive Conditional Heteroskedasticity |
| DAN | Deep Attention Neural Network |
| MLP | Multi-linear Perceptron |
| GFF | Generalized Feed Forward |
| NARX | Non-linear Auto-regressive Network with exogenous inputs |
| RBF | Radial Basis |
| MA | Moving Average |
| LPP | Locality Preserving Projection |
| FRPCA | Fast Robust Principle Component Analysis |
| KPCA | Kernel Principle Component Analysis |
| GRU | Gated Recurrent Unit |
| LSTM | Long Short Term Memory |
| ANFIS | Adaptive Neuro-Fuzzy Inference System |
| ABC | Ant Bee Colony |
| RNN | Recurrent Neural Network |
| RMSE | Root Mean Square Error |
| SVR | Support Vector Regression |
| CNN | Convolution Neural Network |
| DBN | Deep Belief Network |
| ARIMA | Auto Regressive Integrated Moving Average |
| VAR | Vector Auto-regression |
| AUC | Area Under Curve |
| MSE | Mean Square Error |
| MAE | Mean Absolute Error |
| R2 | R-Squared |
| MAPE | Mean Absolute Percentage Error |
| POCID | Prediction of Change in Direction |
| DJIA | Dow Jones Industrial Average |
| S&P | Standard and Poor’s |
| GDP | Gross Domestic Product |
| NASDAQ | National Association of Securities Dealers Automated Quotations |
| DAX | Deutscher Aktien Index |
| KSE | Karachi Stock Exchange |
| LSE | London Stock Exchange |
| NYSE | New York Stock Exchange |
| BSE | Bombay Stock Exchange |
| AIC | Akaike Information Criterion |
References
- Krishna, V. ScienceDirect ScienceDirect NSE Stock Stock Market Market Prediction Prediction Using Using Deep-Learning Deep-Learning Models Models. Procedia Comput. Sci. 2018, 132, 1351–1362. [Google Scholar]
- Market Capitalization of Listed Domestic Companies (Current US$) Data. Available online: https://data.worldbank.org/indicator/CM.MKT.LCAP.CD (accessed on 19 May 2021).
- Upadhyay, A.; Bandyopadhyay, G. Forecasting Stock Performance in Indian Market using Multinomial Logistic Regression. J. Bus. Stud. Q. 2012, 3, 16–39. [Google Scholar]
- Tan, T.Z.; Quek, C.; Ng, G.S. Biological Brain-Inspired Genetic Complementary Learning for Stock Market and Bank Failure Prediction. Comput. Intell. 2007, 23, 236–261. [Google Scholar] [CrossRef]
- Ali Khan, J. Predicting Trend in Stock Market Exchange Using Machine Learning Classifiers. Sci. Int. 2016, 28, 1363–1367. [Google Scholar]
- Gupta, R.; Garg, N.; Singh, S. Stock Market Prediction Accuracy Analysis Using Kappa Measure. In Proceedings of the 2013 International Conference on Communication Systems and Network Technologies, Gwalior, India, 6–8 April 2013; pp. 635–639. [Google Scholar]
- Fama, E.F. Random walks in stock-market prices. Financ. Anal. J. 1995, 51, 75–80. [Google Scholar] [CrossRef] [Green Version]
- Bujari, A.; Furini, M.; Laina, N. On using cashtags to predict companies stock trends. In Proceedings of the 2017 14th IEEE Annual Consumer Communications & Networking Conference (CCNC), Las Vegas, NV, USA, 8–11 January 2017; pp. 25–28. [Google Scholar]
- Inthachot, M.; Boonjing, V.; Intakosum, S. Artificial Neural Network and Genetic Algorithm Hybrid Intelligence for Predicting Thai Stock Price Index Trend. Comput. Intell. Neurosci. 2016, 2016, 3045254. [Google Scholar] [CrossRef] [Green Version]
- Park, C.-H.; Irwin, S.H. What Do We Know about the Profitability of Technical Analysis? J. Econ. Surv. 2007, 21, 786–826. [Google Scholar] [CrossRef]
- Venkatesh, C.K.; Tyagi, M. Fundamental Analysis as a Method of Share Valuation in Comparison with Technical Analysis. Bangladesh Res. Publ. J. 2011, 1, 167–174. [Google Scholar]
- Nair, B.B.; Mohandas, V. An intelligent recommender system for stock trading. Intell. Decis. Technol. 2015, 9, 243–269. [Google Scholar] [CrossRef]
- Shiller, R. Measuring bubble expectations and investor confidence RJ Shiller. J. Psychol. Financ. Mark. 2000, 1, 49–60. [Google Scholar] [CrossRef]
- Aharon, D.Y.; Gavious, I.; Yosef, R. Stock market bubble effects on mergers and acquisitions. Q. Rev. Econ. Financ. 2010, 50, 456–470. [Google Scholar] [CrossRef]
- Molodovsky, N. A Theory of Price-Earnings Ratios. Financ. Anal. J. 1953, 9, 65–80. [Google Scholar] [CrossRef]
- Kurach, R.; Słoński, T. The PE Ratio and the Predicted Earnings Growth—The Case of Poland. Folia Oecon. Stetin. 2015, 15, 127–138. [Google Scholar] [CrossRef] [Green Version]
- Dutta, A. Prediction of Stock Performance in the Indian Stock Market Using Logistic Regression. Intern. J. Bus. Inf. 2012, 7, 105–136. [Google Scholar]
- Deboeck, G. Trading on the Edge: Neural, Genetic, and Fuzzy Systems for Chaotic Financial Markets; Wiley: New York, NY, USA, 1994. [Google Scholar]
- Zhu, Y.; Zhou, G. Technical analysis: An asset allocation perspective on the use of moving averages. J. Financ. Econ. 2009, 92, 519–544. [Google Scholar] [CrossRef]
- Peachavanish, R. Stock selection and trading based on cluster analysis of trend and momentum indicators. Lect. Notes Eng. Comput. Sci. 2016, 1, 317–321. [Google Scholar]
- Hulbert, M. Viewpoint: More Proof for the Dow Theory. Available online: https://www.nytimes.com/1998/09/06/business/viewpoint-more-proof-for-the-dow-theory.html (accessed on 17 October 2021).
- Rahman, A.S.A.; Abdul-Rahman, S.; Mutalib, S. Mining Textual Terms for Stock Market Prediction Analysis Using Financial News. In International Conference on Soft Computing in Data Science; Springer: Singapore, 2017; pp. 293–305. [Google Scholar] [CrossRef]
- Ballings, M.; Poel, D.V.D.; Hespeels, N.; Gryp, R. Evaluating multiple classifiers for stock price direction prediction. Expert Syst. Appl. 2015, 42, 7046–7056. [Google Scholar] [CrossRef]
- Cortes, C.; Vapnik, V. Support-vector networks. Mach. Learn. 1995, 20, 273–297. [Google Scholar] [CrossRef]
- Srivastava, D.K.; Bhambhu, L. Data classification using support vector machine. J. Theor. Appl. Inf. Technol. 2010, 12, 1–7. [Google Scholar]
- Venugopal, K.R.; Srinivasa, K.G.; Patnaik, L.M. Fuzzy based neuro—Genetic algorithm for stock market prediction. Stud. Comput. Intell. 2009, 190, 139–166. [Google Scholar]
- Number of Social Network Users Worldwide from 2017 to 2025. Available online: https://0-www-statista-com.brum.beds.ac.uk/statistics/278414/number-of-worldwide-social-network-users/ (accessed on 30 May 2021).
- Ding, X.; Zhang, Y.; Liu, T.; Duan, J. Using Structured Events to Predict Stock Price Movement: An Empirical Investigation. In Proceedings of the 2014 Conference on Empirical Methods in Natural Language Processing, Doha, Qatar, 25–29 October 2014; pp. 1415–1425. [Google Scholar]
- Howells, K.; Ertugan, A. Applying fuzzy logic for sentiment analysis of social media network data in marketing. Procedia Comput. Sci. 2017, 120, 664–670. [Google Scholar] [CrossRef]
- Liu, B. Sentiment Analysis and Opinion Mining; Morgan & Claypool Publishers: San Rafael, CA, USA, 2012; p. 167. [Google Scholar]
- Li, W. Improvement of Stochastic Competitive Learning for Social Network. Comput. Mater. Contin. 2020, 63, 755–768. [Google Scholar]
- Devi, K.N.; Bhaskaran, V.M. Semantic Enhanced Social Media Sentiments for Stock Market Prediction. Int. J. Econ. Manag. Eng. 2015, 9, 684–688. [Google Scholar]
- Hill, S.; Ready-Campbell, N. Expert Stock Picker: The Wisdom of (Experts in) Crowds. Int. J. Electron. Commer. 2011, 15, 73–102. [Google Scholar] [CrossRef]
- Chen, T.-L.; Chen, F.-Y. An intelligent pattern recognition model for supporting investment decisions in stock market. Inf. Sci. 2016, 346–347, 261–274. [Google Scholar] [CrossRef]
- Ranco, G.; Aleksovski, D.; Caldarelli, G.; Grčar, M.; Mozetic, I. The effects of Twitter sentiment on stock price returns. PLoS ONE 2015, 10, e0138441. [Google Scholar] [CrossRef] [PubMed] [Green Version]
- Bhardwaj, A.; Narayan, Y.; Dutta, M. Sentiment Analysis for Indian Stock Market Prediction Using Sensex and Nifty. Procedia Comput. Sci. 2015, 70, 85–91. [Google Scholar] [CrossRef] [Green Version]
- Zhang, Y.; Wu, L. Stock market prediction of S&P 500 via combination of improved BCO approach and BP neural network. Expert Syst. Appl. 2009, 36, 8849–8854. [Google Scholar]
- Guresen, E.; Kayakutlu, G.; Daim, T.U. Using artificial neural network models in stock market index prediction. Expert Syst. Appl. 2011, 38, 10389–10397. [Google Scholar] [CrossRef]
- Lugmayr, A.; Gossen, G. Evaluation of methods and techniques for language based sentiment analysis for dax 30 stock exchange—A first concept of a ‘LUGO’ sentiment indicator. In Proceedings of the 5th International Workshop on Semantic Ambient Media Experience (SAME), Newcastle, UK, 18 June 2012; pp. 69–76. [Google Scholar]
- Porshnev, A.; Redkin, I.; Karpov, N. Modelling Movement of Stock Market Indexes with Data from Emoticons of Twitter Users. Commun. Comput. Inf. Sci. 2015, 205, 297–306. [Google Scholar] [CrossRef]
- Nti, I.K.; Adekoya, A.F.; Weyori, B.A. A comprehensive evaluation of ensemble learning for stock-market prediction. J. Big Data 2020, 7, 1–40. [Google Scholar] [CrossRef]
- Weng, B.; Ahmed, M.A.; Megahed, F. Stock market one-day ahead movement prediction using disparate data sources. Expert Syst. Appl. 2017, 79, 153–163. [Google Scholar] [CrossRef]
- Di Persio, L.; Honchar, O. Recurrent neural networks approach to the financial forecast of Google assets. Int. J. Math. Comput. Simul. 2017, 11, 7–13. [Google Scholar]
- Hagenau, M.; Liebmann, M.; Hedwig, M.; Neumann, D. Automated News Reading: Stock Price Prediction Based on Financial News Using Context-Specific Features. In Proceedings of the 2012 45th Hawaii International Conference on System Sciences, Maui, HI, USA, 4–9 January 2012; pp. 1040–1049. [Google Scholar]
- Huang, C.-F.; Li, H.-C. An Evolutionary Method for Financial Forecasting in Microscopic High-Speed Trading Environment. Comput. Intell. Neurosci. 2017, 2017, 9580815. [Google Scholar] [CrossRef] [PubMed] [Green Version]
- Shah, D.; Isah, H.; Zulkernine, F. Stock Market Analysis: A Review and Taxonomy of Prediction Techniques. Int. J. Financ. Stud. 2019, 7, 26. [Google Scholar] [CrossRef] [Green Version]
- Nayak, A.; Pai, M.M.M.; Pai, R.M. Prediction Models for Indian Stock Market. Procedia Comput. Sci. 2016, 89, 441–449. [Google Scholar] [CrossRef] [Green Version]
- Makrehchi, M.; Shah, S.; Liao, W. Stock Prediction Using Event-Based Sentiment Analysis. In Proceedings of the 2013 IEEE/WIC/ACM International Joint Conferences on Web Intelligence (WI) and Intelligent Agent Technologies (IAT), Atlanta, GA, USA, 17–20 November 2013; Volume 1, pp. 337–342. [Google Scholar]
- Ghanavati, M.; Wong, R.K.; Chen, F.; Wang, Y.; Fong, S. A Generic Service Framework for Stock Market Prediction. In Proceedings of the 2016 IEEE International Conference on Services Computing (SCC), San Francisco, CA, USA, 27 June–2 July 2016; pp. 283–290. [Google Scholar]
- Bustos, O.; Pomares, A.; Gonzalez, E. A comparison between SVM and multilayer perceptron in predicting an emerging financial market: Colombian stock market. In Proceedings of the 2017 Congreso Internacional de Innovacion y Tendencias en Ingenieria (CONIITI), Bogota, Colombia, 4–6 October 2017; pp. 1–6. [Google Scholar]
- Dey, S.; Kumar, Y.; Saha, S.; Basak, S. Forecasting to Classification: Predicting the direction of stock market price using Xtreme Gradient Boosting Forecasting to Classification: Predicting the direction of stock market price using Xtreme Gradient Boosting. PESIT South Campus 2016. [Google Scholar] [CrossRef]
- Murshed, B.A.H.; Al-Ariki, H.D.E.; Mallappa, S. Semantic Analysis Techniques using Twitter Datasets on Big Data: Comparative Analysis Study. Comput. Syst. Sci. Eng. 2020, 35, 495–512. [Google Scholar] [CrossRef]
- Xie, B.; Passonneau, R.; Wu, L.; Creamer, G.G. Semantic Frames to Predict Stock Price Movement. In Proceedings of the 51st Annual Meeting of the Association for Computational Linguistics, Sofia, Bulgaria, 4–9 August 2013; pp. 873–883. [Google Scholar]
- Ding, X.; Zhang, Y.; Liu, T.; Duan, J. Knowledge-Driven Event Embedding for Stock Prediction. In Proceedings of the COLING 2016, the 26th International Conference on Computational Linguistics: Technical Papers, Osaka, Japan, 11–17 December 2016; pp. 2133–2142. [Google Scholar]
- Sirimevan, N.; Mamalgaha, I.G.U.H.; Jayasekara, C.; Mayuran, Y.S.; Jayawardena, C. Stock Market Prediction Using Machine Learning Techniques. In Proceedings of the IEEE 2019 International Conference on Advancements in Computing (ICAC), Malabe, Sri Lanka, 5–7 December 2019; Volume 1, pp. 192–197. [Google Scholar]
- Schumaker, R.P.; Zhang, Y.; Huang, C.-N.; Chen, H. Evaluating sentiment in financial news articles. Decis. Support Syst. 2012, 53, 458–464. [Google Scholar] [CrossRef]
- Huang, C.-J.; Liao, J.-J.; Yang, D.-X.; Chang, T.-Y.; Luo, Y.-C. Realization of a news dissemination agent based on weighted association rules and text mining techniques. Expert Syst. Appl. 2010, 37, 6409–6413. [Google Scholar] [CrossRef]
- Nguyen, T.H.; Shirai, K.; Velcin, J. Sentiment analysis on social media for stock movement prediction. Expert Syst. Appl. 2015, 42, 9603–9611. [Google Scholar] [CrossRef]
- Rajput, V.; Bobde, S. Stock market prediction using hybrid approach. In Proceedings of the 2016 International Conference on Computing, Communication and Automation (ICCCA), Greater Noida, India, 29–30 April 2016; pp. 82–86. [Google Scholar]
- Asghar, M.Z.; Subhan, F.; Imran, M.; Kundi, F.M.; Khan, A.; Shamshirband, S.; Mosavi, A.; Koczy, A.R.V.; Csiba, P. Performance Evaluation of Supervised Machine Learning Techniques for Efficient Detection of Emotions from Online Content. Comput. Mater. Contin. 2020, 63, 1093–1118. [Google Scholar] [CrossRef]
- Akhtar, M.J.; Ahmad, Z.; Amin, R.; Almotiri, S.H.; Al Ghamdi, M.A.; Aldabbas, H. An Efficient Mechanism for Product Data Extraction from E-Commerce Websites. Comput. Mater. Contin. 2020, 65, 2639–2663. [Google Scholar] [CrossRef]
- Pandarachalil, R.; Sendhilkumar, S.; Mahalakshmi, G.S. Twitter Sentiment Analysis for Large-Scale Data: An Unsupervised Approach. Cogn. Comput. 2014, 7, 254–262. [Google Scholar] [CrossRef]
- Pagolu, V.S.; Reddy, K.N.; Panda, G.; Majhi, B. Sentiment analysis of Twitter data for predicting stock market movements. In Proceedings of the 2016 International Conference on Signal Processing, Communication, Power and Embedded System (SCOPES), Paralakhemundi, India, 3–5 October 2016; pp. 1345–1350. [Google Scholar]
- Mittal, A.; Goel, A. Stock Prediction Using Twitter Sentiment Analysis; Stanford University: Stanford, CA, USA, 2009; Volume 1, pp. 337–342. [Google Scholar]
- Zhang, X.; Fuehres, H.; Gloor, P.A. Gloor, Predicting Stock Market Indicators Through Twitter “I hope it is not as bad as I fear”. Procedia-Soc. Behav. Sci. 2011, 26, 55–62. [Google Scholar] [CrossRef] [Green Version]
- Uysal, A.; Gunal, S. The impact of preprocessing on text classification. Inf. Process. Manag. 2014, 50, 104–112. [Google Scholar] [CrossRef]
- Wang, J.; Wang, X.; Yang, Y.; Zhang, H.; Fang, B. A Review of Data Cleaning Methods for Web Information System. Comput. Mater. Contin. 2020, 62, 1053–1075. [Google Scholar] [CrossRef]
- Zhong, X.; Enke, D. Forecasting daily stock market return using dimensionality reduction. Expert Syst. Appl. 2017, 67, 126–139. [Google Scholar] [CrossRef]
- Ihlayyel, H.A.; Sharef, N.M.; Nazri, M.Z.A.; Abu Bakar, A. An enhanced feature representation based on linear regression model for stock market prediction. Intell. Data Anal. 2018, 22, 45–76. [Google Scholar] [CrossRef]
- Zhou, P.-Y.; Chan, K.C.C.; Ou, C.X. Corporate Communication Network and Stock Price Movements: Insights from Data Mining. IEEE Trans. Comput. Soc. Syst. 2018, 5, 391–402. [Google Scholar] [CrossRef]
- Chandar, S.K. Fusion model of wavelet transform and adaptive neuro fuzzy inference system for stock market prediction. J. Ambient. Intell. Humaniz. Comput. 2019, 1–9. [Google Scholar] [CrossRef]
- Sedighi, M.; Jahangirnia, H.; Gharakhani, M.; Fard, S.F. A Novel Hybrid Model for Stock Price Forecasting Based on Metaheuristics and Support Vector Machine. Data 2019, 4, 75. [Google Scholar] [CrossRef] [Green Version]
- Khan, W.; Malik, U.; Ghazanfar, M.A.; Azam, M.A.; Alyoubi, K.H.; Alfakeeh, A. Predicting stock market trends using machine learning algorithms via public sentiment and political situation analysis. Soft Comput. 2019, 24, 11019–11043. [Google Scholar] [CrossRef]
- Ullah, K.; Qasim, M. Google Stock Prices Prediction Using Deep Learning. In Proceedings of the 2020 IEEE 10th International Conference on System Engineering and Technology (ICSET), Shah Alam, Malaysia, 9 November 2020; pp. 108–113. [Google Scholar]
- Nassirtoussi, A.K.; Aghabozorgi, S.; Wah, T.Y.; Ngo, D.C.L. Text mining of news-headlines for FOREX market prediction: A Multi-layer Dimension Reduction Algorithm with semantics and sentiment. Expert Syst. Appl. 2015, 42, 306–324. [Google Scholar] [CrossRef]
- Wu, D.D.; Olson, D.L. Enterprise Risk Management in Finance; Palgrave Macmillan: London, UK, 2015. [Google Scholar]
- Chen, M.-Y.; Liao, C.-H.; Hsieh, R.-P. Modeling public mood and emotion: Stock market trend prediction with anticipatory computing approach. Comput. Hum. Behav. 2019, 101, 402–408. [Google Scholar] [CrossRef]
- Das, S.R.; Mishra, D.; Rout, M. Stock market prediction using Firefly algorithm with evolutionary framework optimized feature reduction for OSELM method. Expert Syst. Appl. X 2019, 4, 100016. [Google Scholar] [CrossRef]
- Bouktif, S.; Fiaz, A.; Awad, M. Augmented Textual Features-Based Stock Market Prediction. IEEE Access 2020, 8, 40269–40282. [Google Scholar] [CrossRef]
- Chen, S.; Zhou, C. Stock Prediction Based on Genetic Algorithm Feature Selection and Long Short-Term Memory Neural Network. IEEE Access 2020, 9, 9066–9072. [Google Scholar] [CrossRef]
- Mikolov, T.; Sutskever, I.; Chen, K.; Corrado, G.S.; Dean, J. Distributed representations ofwords and phrases and their compositionality. In Advances in Neural Information Processing Systems; The MIT Press: Cambridge, MA, USA, 2013; pp. 3111–3119. [Google Scholar]
- Si, J.; Mukherjee, A.; Liu, B.; Li, Q.; Li, H.; Deng, X. Exploiting Topic based Twitter Sentiment for Stock Prediction. In Proceedings of the 51st Annual Meeting of the Association for Computational Linguistics, Sofia, Bulgaria, 4–9 August 2013; pp. 24–29. [Google Scholar]
- Zhang, X.; Zhang, Y.; Wang, S.; Yao, Y.; Fang, B.; Yu, P.S. Improving stock market prediction via heterogeneous information fusion. Knowl.-Based Syst. 2018, 143, 236–247. [Google Scholar] [CrossRef] [Green Version]
- Zhou, Z.; Qin, J.; Xiang, X.; Tan, Y.; Liu, Q.; Xiong, N.N. News Text Topic Clustering Optimized Method Based on TF-IDF Algorithm on Spark. Comput. Mater. Contin. 2020, 62, 217–231. [Google Scholar] [CrossRef]
- El Seidy, E.; Ibrahim, B.; Jamous, R.A.; Bayoum, B.I. A Novel Efficient Forecasting of Stock Market Using Particle Swarm Optimization with Center of Mass Based Technique. Int. J. Adv. Comput. Sci. Appl. 2016, 7. [Google Scholar] [CrossRef] [Green Version]
- He, S.; Li, Z.; Tang, Y.; Liao, Z.; Li, F.; Lim, S.-J. Parameters Compressing in Deep Learning. Comput. Mater. Contin. 2020, 62, 321–336. [Google Scholar] [CrossRef]
- Pestov, V. Is the k-NN classifier in high dimensions affected by the curse of dimensionality? Comput. Math. Appl. 2013, 65, 1427–1437. [Google Scholar] [CrossRef]
- Kalra, V.; Aggarwal, R. Importance of Text Data Preprocessing & Implementation in RapidMiner. Proc. First Int. Conf. Inf. Technol. Knowl. Manag. 2018, 14, 71–75. [Google Scholar] [CrossRef] [Green Version]
- Zhang, C.; Cheng, J.; Tang, X.; Sheng, V.S.; Dong, Z.; Li, J. Novel DDoS Feature Representation Model Combining Deep Belief Network and Canonical Correlation Analysis. Comput. Mater. Contin. 2019, 61, 657–675. [Google Scholar] [CrossRef]
- Sharma, S.; Ahmed, S.; Naseem, M.; Alnumay, W.S.; Singh, S.; Cho, G.H. A Survey on Applications of Artificial Intelligence for Pre-Parametric Project Cost and Soil Shear-Strength Estimation in Construction and Geotechnical Engineering. Sensors 2021, 21, 463. [Google Scholar] [CrossRef] [PubMed]
- Ganser, A.; Hollaus, B.; Stabinger, S. Classification of Tennis Shots with a Neural Network Approach. Sensors 2021, 21, 5703. [Google Scholar] [CrossRef]
- Ticknor, J.L. A Bayesian regularized artificial neural network for stock market forecasting. Expert Syst. Appl. 2013, 40, 5501–5506. [Google Scholar] [CrossRef]
- Adebiyi, A.A.; Adewumi, A.; Ayo, C.K. Comparison of ARIMA and Artificial Neural Networks Models for Stock Price Prediction. J. Appl. Math. 2014, 2014, 614342. [Google Scholar] [CrossRef] [Green Version]
- Chopra, S.; Yadav, D.; Chopra, A.N. Artificial Neural Networks Based Indian Stock Market Price Prediction: Before and After Demonetization. Int. J. Swarm Intell. Evol. Comput. 2019, 8, 174. [Google Scholar]
- Seo, M.; Kim, G. Hybrid Forecasting Models Based on the Neural Networks for the Volatility of Bitcoin. Appl. Sci. 2020, 10, 4768. [Google Scholar] [CrossRef]
- Vanstone, B.; Finnie, G.; Hahn, T. Creating trading systems with fundamental variables and neural networks: The Aby case study. Math. Comput. Simul. 2012, 86, 78–91. [Google Scholar] [CrossRef]
- Khashei, M.; Hajirahimi, Z. Performance evaluation of series and parallel strategies for financial time series forecasting. Financ. Innov. 2017, 3, 24. [Google Scholar] [CrossRef] [Green Version]
- Goh, A. Back-propagation neural networks for modeling complex systems. Artif. Intell. Eng. 1995, 9, 143–151. [Google Scholar] [CrossRef]
- Zhang, F.; Li, J.; Wang, Y.; Guo, L.; Wu, D.; Wu, H.; Zhao, H. Ensemble Learning Based on Policy Optimization Neural Networks for Capability Assessment. Sensors 2021, 21, 5802. [Google Scholar] [CrossRef] [PubMed]
- Bing, Y.; Hao, J.K.; Zhang, S.C. Stock Market Prediction Using Artificial Neural Networks. Adv. Eng. Forum 2012, 6, 1055–1060. [Google Scholar] [CrossRef] [Green Version]
- Hota, H.S.; Handa, R.; Shrivas, A.K. Time Series Data Prediction Using Sliding Window Based RBF Neural Network. Int. J. Comput. Intell. Res. 2017, 13, 1145–1156. [Google Scholar]
- Guo, Z.; Ye, W.; Yang, J.; Zeng, Y. Financial index time series prediction based on bidirectional two dimensional locality preserving projection. In Proceedings of the 2017 IEEE 2nd International Conference on Big Data Analysis (ICBDA), Beijing, China, 10–12 March 2017; pp. 934–938. [Google Scholar]
- Milosevic, N. Equity forecast: Predicting long term stock price movement using machine learning. arXiv 2016, arXiv:1603.00751. [Google Scholar]
- Li, X.; Xie, H.; Wang, R.; Cai, Y.; Cao, J.; Wang, F.; Min, H.; Deng, X. Empirical analysis: Stock market prediction via extreme learning machine. Neural Comput. Appl. 2014, 27, 67–78. [Google Scholar] [CrossRef]
- More, A.M.; Rathod, P.U.; Patil, R.H.; Sarode, D.R.; Student, B. Stock Market Prediction System using Hadoop. Int. J. Eng. Sci. Comput. 2018, 8, 16138–16140. [Google Scholar]
- Mohan, S.; Mullapudi, S.; Sammeta, S.; Vijayvergia, P.; Anastasiu, D.C. Stock Price Prediction Using News Sentiment Analysis. In Proceedings of the 2019 IEEE Fifth International Conference on Big Data Computing Service and Applications (BigDataService), Newark, CA, USA, 4–9 April 2019; pp. 205–208. [Google Scholar]
- Xianya, J.; Mo, H.; Haifeng, L. Stock Classification Prediction Based on Spark. Procedia Comput. Sci. 2019, 162, 243–250. [Google Scholar] [CrossRef]
- Yu, Y.; Duan, W.; Cao, Q. The impact of social and conventional media on firm equity value: A sentiment analysis approach. Decis. Support Syst. 2013, 55, 919–926. [Google Scholar] [CrossRef]
- Lin, L.; Cao, L.; Wang, J.; Zhang, C. The applications of genetic algorithms in stock market data mining optimization. Manag. Inf. Syst. 2004, 10, 273–280. [Google Scholar]
- Pimenta, A.; Nametala, C.; Guimarães, F.G.; Carrano, E.G. An Automated Investing Method for Stock Market Based on Multiobjective Genetic Programming. Comput. Econ. 2017, 52, 125–144. [Google Scholar] [CrossRef]
- Strader, T.J.; Rozycki, J.J.; Root, T.H.; Huang, Y.H.J. Machine Learning Stock Market Prediction Studies: Review and Research Directions. J. Int. Technol. Inf. Manag. 2020, 28, 63–83. [Google Scholar]
- Kim, Y.; Ahn, W.; Oh, K.J.; Enke, D. An intelligent hybrid trading system for discovering trading rules for the futures market using rough sets and genetic algorithms. Appl. Soft Comput. 2017, 55, 127–140. [Google Scholar] [CrossRef]
- Nair, B.B.; Dharini, N.M.; Mohandas, V. A Stock Market Trend Prediction System Using a Hybrid Decision Tree-Neuro-Fuzzy System. In Proceedings of the 2010 International Conference on Advances in Recent Technologies in Communication and Computing, Kottayam, India, 16–17 October 2010; pp. 381–385. [Google Scholar]
- Chandar, S.K. Stock market prediction using subtractive clustering for a neuro fuzzy hybrid approach. Clust. Comput. 2017, 22, 13159–13166. [Google Scholar] [CrossRef]
- Chang, P.-C.; Wu, J.-L.; Lin, J.-J. A Takagi–Sugeno fuzzy model combined with a support vector regression for stock trading forecasting. Appl. Soft Comput. 2016, 38, 831–842. [Google Scholar] [CrossRef]
- Yolcu, O.C.; Lam, H.-K. A combined robust fuzzy time series method for prediction of time series. Neurocomputing 2017, 247, 87–101. [Google Scholar] [CrossRef] [Green Version]
- Rajab, S.; Sharma, V. An interpretable neuro-fuzzy approach to stock price forecasting. Soft Comput. 2019, 23, 921–936. [Google Scholar] [CrossRef]
- LeCun, Y.; Bengio, Y.; Hinton, G. Deep learning. Nature 2015, 521, 436–444. [Google Scholar] [CrossRef] [PubMed]
- Wu, H.; Liu, Y.; Wang, J. Review of Text Classification Methods on Deep Learning. Comput. Mater. Contin. 2020, 63, 1309–1321. [Google Scholar] [CrossRef]
- Hoseinzade, E.; Haratizadeh, S. CNNpred: CNN-based stock market prediction using a diverse set of variables. Expert Syst. Appl. 2019, 129, 273–285. [Google Scholar] [CrossRef]
- Gao, P.; Zhang, R.; Yang, X. The Application of Stock Index Price Prediction with Neural Network. Math. Comput. Appl. 2020, 25, 53. [Google Scholar] [CrossRef]
- Sezer, O.; Ozbayoglu, A. Financial Trading Model with Stock Bar Chart Image Time Series with Deep Convolutional Neural Networks. Intell. Autom. Soft Comput. 2018. [Google Scholar] [CrossRef]
- Pang, X.; Zhou, Y.; Wang, P.; Lin, W.; Chang, V. An innovative neural network approach for stock market prediction. J. Supercomput. 2018, 76, 2098–2118. [Google Scholar] [CrossRef]
- Shah, D.; Campbell, W.; Zulkernine, F.H. A Comparative Study of LSTM and DNN for Stock Market Forecasting. In Proceedings of the 2018 IEEE International Conference on Big Data (Big Data), Seattle, WA, USA, 10–13 December 2018; pp. 4148–4155. [Google Scholar]
- Li, X.; Yang, L.; Xue, F.; Zhou, H. Time series prediction of stock price using deep belief networks with intrinsic plasticity. In Proceedings of the 2017 29th Chinese Control and Decision Conference (CCDC), Chongqing, China, 28–30 May 2017; pp. 1237–1242. [Google Scholar]
- Zhang, J.; Teng, Y.-F.; Chen, W. Support vector regression with modified firefly algorithm for stock price forecasting. Appl. Intell. 2018, 49, 1658–1674. [Google Scholar] [CrossRef]
- Zheng, J.; Fu, X.; Zhang, G. Research on exchange rate forecasting based on deep belief network. Neural Comput. Appl. 2017, 31, 573–582. [Google Scholar] [CrossRef]
- Hushani, P. Using Autoregressive Modelling and Machine Learning for Stock Market Prediction and Trading. In Third International Congress on Information and Communication Technology; Springer: Singapore, 2018; pp. 767–774. [Google Scholar] [CrossRef]
- Nguyen, D.H.D.; Tran, L.P.; Nguyen, V. Predicting Stock Prices Using Dynamic LSTM Models. Int. Conf. Appl. Inform. 2019, 6, 199–212. [Google Scholar] [CrossRef]
- Zhang, L.; Zhang, L.; Teng, W.; Chen, Y. Based on Information Fusion Technique with Data Mining in the Application of Finance Early-Warning. Procedia Comput. Sci. 2013, 17, 695–703. [Google Scholar] [CrossRef] [Green Version]
- Cakra, Y.E.; Trisedya, B.D. Stock price prediction using linear regression based on sentiment analysis. In Proceedings of the 2015 International Conference on Advanced Computer Science and Information Systems (ICACSIS), Depok, Indonesia, 10–11 October 2015; pp. 147–154. [Google Scholar]
- Bhuriya, D.; Kaushal, G.; Sharma, A.; Singh, U. Stock market predication using a linear regression. In Proceedings of the 2017 International conference of Electronics, Communication and Aerospace Technology (ICECA), Coimbatore, India, 20–22 April 2017; pp. 510–513. [Google Scholar]
- Gururaj, V.; Shriya, V.R.; Ashwini, K. Stock market prediction using linear regression and support vector machines. Int. J. Appl. Eng. Res. 2019, 14, 1931–1934. [Google Scholar]
- Enke, D.; Grauer, M.; Mehdiyev, N. Stock market prediction with Multiple Regression, Fuzzy type-2 clustering and neural networks. Procedia Comput. Sci. 2011, 6, 201–206. [Google Scholar] [CrossRef] [Green Version]
- Kamley, S.; Jaloree, S.; Thakur, R. Multiple Regression: A Data Mining Approach for Predicting the Stock Market Trends Based on Open, Close and High Price of The Month. Int. J. Comput. Sci. Eng. Inf. Technol. Res. 2013, 3, 173–180. [Google Scholar]
- Yuan, J.; Luo, Y. Test on the Validity of Futures Market’s High Frequency Volume and Price on Forecast. In Proceedings of the 2014 International Conference on Management of e-Commerce and e-Government, Shanghai, China, 31 October–2 November 2014; pp. 28–32. [Google Scholar]
- Imran, K. Prediction of stock performance by using logistic regression model: Evidence from Pakistan Stock Exchange (PSX). AJER 2018, 8, 247–258. [Google Scholar] [CrossRef]
- Meesad, P.; Rasel, R.I. Predicting stock market price using support vector regression. In Proceedings of the 2013 International Conference on Informatics, Electronics and Vision (ICIEV), Dhaka, Bangladesh, 17–18 May 2013. [Google Scholar]
- Siew, H.L.; Nordin, M.J. Regression techniques for the prediction of stock price trend. In Proceedings of the 2012 International Conference on Statistics in Science, Business and Engineering (ICSSBE), Langkawi, Malaysia, 10–12 September 2012; pp. 99–103. [Google Scholar]
- Ananthi, M.; Vijayakumar, K. Stock market analysis using candlestick regression and market trend prediction (CKRM). J. Ambient. Intell. Humaniz. Comput. 2020, 12, 4819–4826. [Google Scholar] [CrossRef]
- Cheng, C.; Xu, W.; Wang, J. A Comparison of Ensemble Methods in Financial Market Prediction. In Proceedings of the 2012 Fifth International Joint Conference on Computational Sciences and Optimization, Harbin, China, 23–26 June 2012; pp. 755–759. [Google Scholar]
- Bisoi, R.; Dash, P. A hybrid evolutionary dynamic neural network for stock market trend analysis and prediction using unscented Kalman filter. Appl. Soft Comput. 2014, 19, 41–56. [Google Scholar] [CrossRef]
- Nair, B.B.; Mohandas, V.P.; Nayanar, N.; Teja, E.S.R.; Vigneshwari, S.; Teja, K.V.N.S. A Stock Trading Recommender System Based on Temporal Association Rule Mining. SAGE Open 2015, 5, 2158244015579941. [Google Scholar] [CrossRef]
- Hu, H.; Tang, L.; Zhang, S.; Wang, H. Predicting the direction of stock markets using optimized neural networks with Google Trends. Neurocomputing 2018, 285, 188–195. [Google Scholar] [CrossRef]
- Rather, A.M. A Hybrid Intelligent Method of Predicting Stock Returns. Adv. Artif. Neural Syst. 2014, 2014, 1–7. [Google Scholar] [CrossRef]
- Kalaivaani, P.C.D.; Thangarajan, R. Enhancing the Classification Accuracy in Sentiment Analysis with Computational Intelligence Using Joint Sentiment Topic Detection with MEDLDA. Intell. Autom. Soft Comput. 2020, 26, 71–79. [Google Scholar] [CrossRef]
- Hossin, M.; Sulaiman, M.N. A Review on Evaluation Metrics for Data Classification Evaluations. Int. J. Data Min. Knowl. Manag. Process. 2015, 5, 1–11. [Google Scholar] [CrossRef]
- Huang, J.; Ling, C. Using AUC and accuracy in evaluating learning algorithms. IEEE Trans. Knowl. Data Eng. 2005, 17, 299–310. [Google Scholar] [CrossRef] [Green Version]
- de Oliveira, F.A.; Nobre, C.N.; Zárate, L.E. Applying Artificial Neural Networks to prediction of stock price and improvement of the directional prediction index—Case study of PETR4, Petrobras, Brazil. Expert Syst. Appl. 2013, 40, 7596–7606. [Google Scholar] [CrossRef]
- Khan, W.; Ghazanfar, M.A.; Azam, M.A.; Karami, A.; Aloubi, K.H.; Alfakeeh, A.S. Stock market prediction using machine learning classifiers and social media, news. J. Ambient. Intell. Humaniz. Comput. 2020, 1–24. [Google Scholar] [CrossRef]
- Bergmeir, C.; Hyndman, R.; Koo, B. A note on the validity of cross-validation for evaluating autoregressive time series prediction. Comput. Stat. Data Anal. 2018, 120, 70–83. [Google Scholar] [CrossRef]
- Ghiassi, M.; Saidane, H.; Zimbra, D. A dynamic artificial neural network model for forecasting time series events. Int. J. Forecast. 2005, 21, 341–362. [Google Scholar] [CrossRef]
- Binkowski, M.; Marti, G.; Donnat, P. Autoregressive convolutional neural networks for asynchronous time series. In Proceedings of the 35th International Conference on Machine Learning, Stockholm, Sweden, 10–15 July 2018; Volume 2, pp. 933–945. [Google Scholar]
- Baek, Y.; Kim, H.Y. ModAugNet: A new forecasting framework for stock market index value with an overfitting prevention LSTM module and a prediction LSTM module. Expert Syst. Appl. 2018, 113, 457–480. [Google Scholar] [CrossRef]
- Zheng, H.; Zhou, Z.; Chen, J. RLSTM: A New Framework of Stock Prediction by Using Random Noise for Overfitting Prevention. Comput. Intell. Neurosci. 2021, 2021, 8865816. [Google Scholar] [CrossRef]
- Robles-Granda, P.D.; Belik, I.V. A Comparison of Machine Learning Classifiers Applied to Financial Datasets. In Proceedings of the World Congress on Engineering and Computer Science 2010, San Francisco, CA, USA, 20–22 October 2010. [Google Scholar]
- Popper, N. Knight Capital Says Trading Glitch Cost It $440 Million—The New York Times. Available online: https://dealbook.nytimes.com/2012/08/02/knight-capital-says-trading-mishap-cost-it-440-million/ (accessed on 20 July 2020).
- Phillips, M. Nasdaq: Here’s Our Timeline of the Flash Crash. Wall Str. J. 2010. Available online: https://www.wsj.com/articles/BL-MB-21942 (accessed on 30 May 2021).
- Gul, S.; Khan, M.T.; Saif, N.; Rehman, S.U.; Roohullah, S. Stock Market Reaction to Political Events (Evidence from Pakistan). J. Econ. Sustain. Dev. 2013, 4, 165–175. [Google Scholar]
- Suriani, N.S.; Hussain, A.; Zulkifley, M.A. Sudden Event Recognition: A Survey. Sensors 2013, 13, 9966–9998. [Google Scholar] [CrossRef] [PubMed] [Green Version]
- Huang, S.Y.B.; Lee, C.-J.; Lee, S.-C. Toward a Unified Theory of Customer Continuance Model for Financial Technology Chatbots. Sensors 2021, 21, 5687. [Google Scholar] [CrossRef] [PubMed]
- Ferrara, E.; Varol, O.; Davis, C.; Menczer, F.; Flammini, A. The rise of social bots. Commun. ACM 2016, 59, 96–104. [Google Scholar] [CrossRef] [Green Version]
- Kalyanaraman, V.; Kazi, S.; Tondulkar, R.; Oswal, S. Sentiment Analysis on News Articles for Stocks. In Proceedings of the 2014 8th Asia Modelling Symposium, Taipei, Taiwan, 23–25 October 2014; pp. 10–15. [Google Scholar]
- Seethalakshmi, R. Analysis of Stock Market Predictor Variables using Linear Regression Analysis. Int. J. Pure Appl. Math. 2020, 119, 369–378. [Google Scholar]


Publisher’s Note: MDPI stays neutral with regard to jurisdictional claims in published maps and institutional affiliations. |
© 2021 by the authors. Licensee MDPI, Basel, Switzerland. This article is an open access article distributed under the terms and conditions of the Creative Commons Attribution (CC BY) license (https://creativecommons.org/licenses/by/4.0/).
Share and Cite
Rouf, N.; Malik, M.B.; Arif, T.; Sharma, S.; Singh, S.; Aich, S.; Kim, H.-C. Stock Market Prediction Using Machine Learning Techniques: A Decade Survey on Methodologies, Recent Developments, and Future Directions. Electronics 2021, 10, 2717. https://0-doi-org.brum.beds.ac.uk/10.3390/electronics10212717
Rouf N, Malik MB, Arif T, Sharma S, Singh S, Aich S, Kim H-C. Stock Market Prediction Using Machine Learning Techniques: A Decade Survey on Methodologies, Recent Developments, and Future Directions. Electronics. 2021; 10(21):2717. https://0-doi-org.brum.beds.ac.uk/10.3390/electronics10212717
Chicago/Turabian StyleRouf, Nusrat, Majid Bashir Malik, Tasleem Arif, Sparsh Sharma, Saurabh Singh, Satyabrata Aich, and Hee-Cheol Kim. 2021. "Stock Market Prediction Using Machine Learning Techniques: A Decade Survey on Methodologies, Recent Developments, and Future Directions" Electronics 10, no. 21: 2717. https://0-doi-org.brum.beds.ac.uk/10.3390/electronics10212717