
O2O: An Underwater VLC Approach in Baltic and North Sea
by
 , and
, and
Mohammad Furqan Ali
1 ,
,
Tharindu Dilshan Ponnimbaduge Perera
2 and
and
Dushantha Nalin K. Jayakody
1,2,3,*
1
School of Computer Science and Robotics, National Research Tomsk Polytechnic University, 634034 Tomsk, Russia
2
Center for Telecommunication Research, School of Postgraduate Studies & Research, Sri Lanka Technological Campus, Padukka 10500, Sri Lanka
3
Centro de Investigaçä em Tecnologias—Autónoma TechLab, Universidade Autónoma de Lisboa, 1169-023 Lisboa, Portugal
*
Author to whom correspondence should be addressed.
Electronics 2022, 11(3), 321; https://0-doi-org.brum.beds.ac.uk/10.3390/electronics11030321
Submission received: 16 December 2021
/
Revised: 7 January 2022
/
Accepted: 8 January 2022
/
Published: 20 January 2022
(This article belongs to the Special Issue Advances in Radio, Visible Light Communications, and Fiber Optics)
Abstract
:Recently, underwater visible light communication (UVLC) has become a potential wireless carrier candidate in the acrimonious mingled ocean straits. The combined strait of the North and Baltic ocean is a harsh and strongly turbid aqueous zone that contributes signal fading at a large scale. Due to this, we are proposing a UVLC system within the Baltic–North ocean mingled water under strong turbulence channel conditions. In this study, the Gamma–Gamma distribution is used to model UVLC link under an OOK modulation scheme. Subsequently, the reason for the unavailability of the latest North–Baltic oceanographic data within this bayou, we investigate the BER and outage probability performance of the proposed system within the mingled strait for the whole year during 1996s. Throughout, this work, the performance is obtained individually in both of the oceans and then compared with the heterogeneous state. It is noteworthy that the analytical work has been considered of the following distinct physio-chemical properties and the data provided for each ocean. Additionally, the simulation results are verified the analytical work of the proposed system model.
1. Introduction
The massive water reservoir oceans are the source of life on Earth and contribute the most significant role in the environment and ecological systems. Numerous categories of water sources are classified according to water quality and geographical availability. Most of the oceans are highly turbid and harsh in comparison with rivers, lakes, dams, and other small-scale shallow water mediums. The deep seas and oceans are very far-fetched to envisage and critically challenging to explore due to low temperature, low pressure, and limited light extents transparency. Nevertheless, in nature, the two different water medium meet, but do not mix due to distinctive physio-chemical properties of waters such as salinity, kinematic viscosity, density, and thermal conductivity, etc. [1]. The water physio-chemical properties are considered the main cause of underwater optical turbulence as signal fading in [2,3]. The strong turbulence zone underwater could be found in the form of layers where the two different water mediums mishmash. The Baltic and North oceans mingle in the Jutland Peninsula near Skagen, which is the northernmost town in Denmark, as depicted in Figure 1. Nevertheless, the sea clash separates both of the oceans. These water reservoirs are widely used for shipping, and transportation of goods delivered within the European Union (EU) [4]. From a scientific point of view, the North ocean was found to be boisterous, stormy, and darkish-colored. On the contrary, the Baltic sea has clear water and seems calm compared to the North ocean. The clash of the Baltic and North oceans is a mysterious puzzle and attracts attention among scientists. Due to the high mobility of transportation, the necessity is to develop the most reliable communication system for continuous real-time monitoring of military and underwater human activities.
In recent years, the demand for underwater wireless communication (UWC) is raised for oceanographic data collection and further analysis to support naval tactical operations, natural disaster prevention, coastal securities, and long range communication. Therefore, the UWC system in heterogeneous water types is challenging to deploy. Traditional acoustic communication has been widely used for long-range signaling in underwater environments. However, acoustic communication extensively suffers due to low bandwidth, low propagation speed, and high latency. Additionally, the electromagnetic (EM) waves propagate over limited ranges in underwater mediums. Consequently, the visible light communication (VLC) has recognized a potential wireless carrier technology for improving quality of services (QoS), and connectivity amongst network nodes. In order to increase the communication capacity and transmission data rate, an integration of spatial modulation (SM) with space-time block codes (STBCs) scheme is proposed as in [5]. In [5], the authors have proposed the Alamouti STBC-SM approach to an arbitrary number of active light-emitting diodes (LEDs) under the M-ary pulse amplitude modulation (PAM) scheme. Another study is also summarized and used Alamouti-type space-time coding (STC) to improve the demodulation performance of an image sensor communication (ISC) using a rotary LED transmitter [6]. Most recently, plenty of applications are enabled and connected with VLC networks. For instance, an impressive approach is proposed as a wheeled mobile robot using visible light with a camera and an array of LEDs as in [7]. Alternatively, VLC has become a potential wireless carrier candidate rather than the acoustic and EM (in terms of RF) waves [8]. Underwater visible light communications (UVLC) fulfilled the requirement of desired data rate and bandwidth over the moderated ranges in existing research. However, plenty of VLC systems are investigated for underwater signaling [9,10]. Apart from that, most of the existing works are proposed over long ranges to fulfill the desired communication in terms of high data rate with low latency. Due to this, hybrid communication scenarios are widely introduced for multiple underwater applications [11,12]. In our previous work [8], we investigated and compared the two different system models as non-ocean-to-ocean (O2) scenarios such as UVLC/RF and UVLC/FSO for the purpose of underwater exploration and observation of marine lives.The main causes of signal fading underwater are the optical signal absorption, scattering, color division organic materials (CDOM), and strong turbulence due to suspended particles and random phenomena of water currents. The suspended particles exist in the channel, contribute turbulence, and the physical properties of water such as temperature, pressure, and salinity lead to the refraction index, leads to the scintillation index [2]. The sum of the total optical absorption and scattering contributes the signal attenuation, while the randomness of water molecules is responsible for turbulence.
In order to characterize the optical signal fading within a strong turbulence channel, the Gamma–Gamma (GG) distribution fading model is proposed as in [3,8,14]. Besides, the proposed fading model is a unified framework for the existing VLC channel model under weak turbulence conditions, including log-normal distribution [15] and Weibull distribution [16] models as special cases. Later in this study, a unified probability distribution function (PDF) and cumulative distribution function (CDF) are derived for the VLC link over GG-distribution fading to obtain the BER and outage performance of the proposed system.
Motivated by this study and summarizing the above mentioned facts, we are investigating the average bit error rate (ABER) and outage probability performance of the proposed system model. This work has presented the performance of a UVLC link in ocean-to-ocean meeting environments within the framework of highly critical channel conditions. However, to the best of our knowledge, there is no performance evaluation investigated within the isolated Baltic–North oceans in the existing literature. Besides, heterodyne detection, and intensity modulation/direct detection (IM/DD) techniques are also considered for signal modulation within the strong turbulence channel conditions. Heterodyne detection is an information signal extraction methodology for encoded modulation phase, frequency, or both of the electromagnetic radiation in the wavelength band of the optical signal. Additionally, in the literature, it has been proposed as an alternative detection approach which is more conveniently deployable for turbulence environmental effects [17,18]. and intensity modulation/direct detection (IM/DD) techniques are also considered for signal modulation within the strong turbulence channel conditions. Therefore, throughout this study, we investigate the performance based on the experimental data that has been taken during the whole year 1996s. Due to the unavailability of current practical data in North–Baltic oceans, we are using the data available in F. Janseen et al. [1]. As a benchmark, our investigated system model and performances are applicable for the current scenarios of mingled waters all around the world. Throughout this study, the following contributions are summarized as follows:
- The system model is developed to support the human underwater exploration activities, especially for coastal securities and goods transportation within EU based North and Baltic water reservoirs;
- The performance of the proposed system subjects to the generalized GG distribution fading is analyzed within the mingled Baltic–Northern Ocean trait for the first time to the best of the authors’ knowledge. Additionally, the performance of the system is analyzed based on the experimental data in both of the oceans as in [1];
- We investigate the UVLC system performance under strong channel conditions in the Baltic–North ocean for the direct connectivity and real-time monitoring of floating vehicles, observation of the marine life, etc. In addition to that, the derived PDF, CDF, and closed-form expressions for the end-to-end outage performance and BER under IM/DD technique as on-off-keying (OOK) modulation scheme are investigated;
- The system model is designed as a horizontal VLC link for signal transmission within moderate to strong turbulence channel conditions during the whole year. Additionally, the main contribution of this research is the performance of transceivers at different depths below the water surface. We calculate the large scale and small scale parameters separately according to the available temperature, salinity, and depth parameters in both of the oceans;
- Optical signal absorption and scattering are the main cause of attenuation in harsh water channel conditions and suspended particles. Due to this, the absorption and scattering effects are included in this work. The typical values of the extinction coefficient are used to obtain the system performances. Therefore, our proposed system model is applicable to deploy in different water types.
The remainder of the paper is organized as follows. The proposed UVLC system model is widely discussed in Section 2. The channel conditions have a significant impact in this study to observe BER performance and modeled individually in Section 3. Furthermore, the outage performance of the system under strong channel is formulated in Section 4. The numerical results and simulation work on the basis of experimental data are concluded for the accuracy of the investigated system in Section 5. Finally, Section 6 concludes the whole presented work.
2. System Model
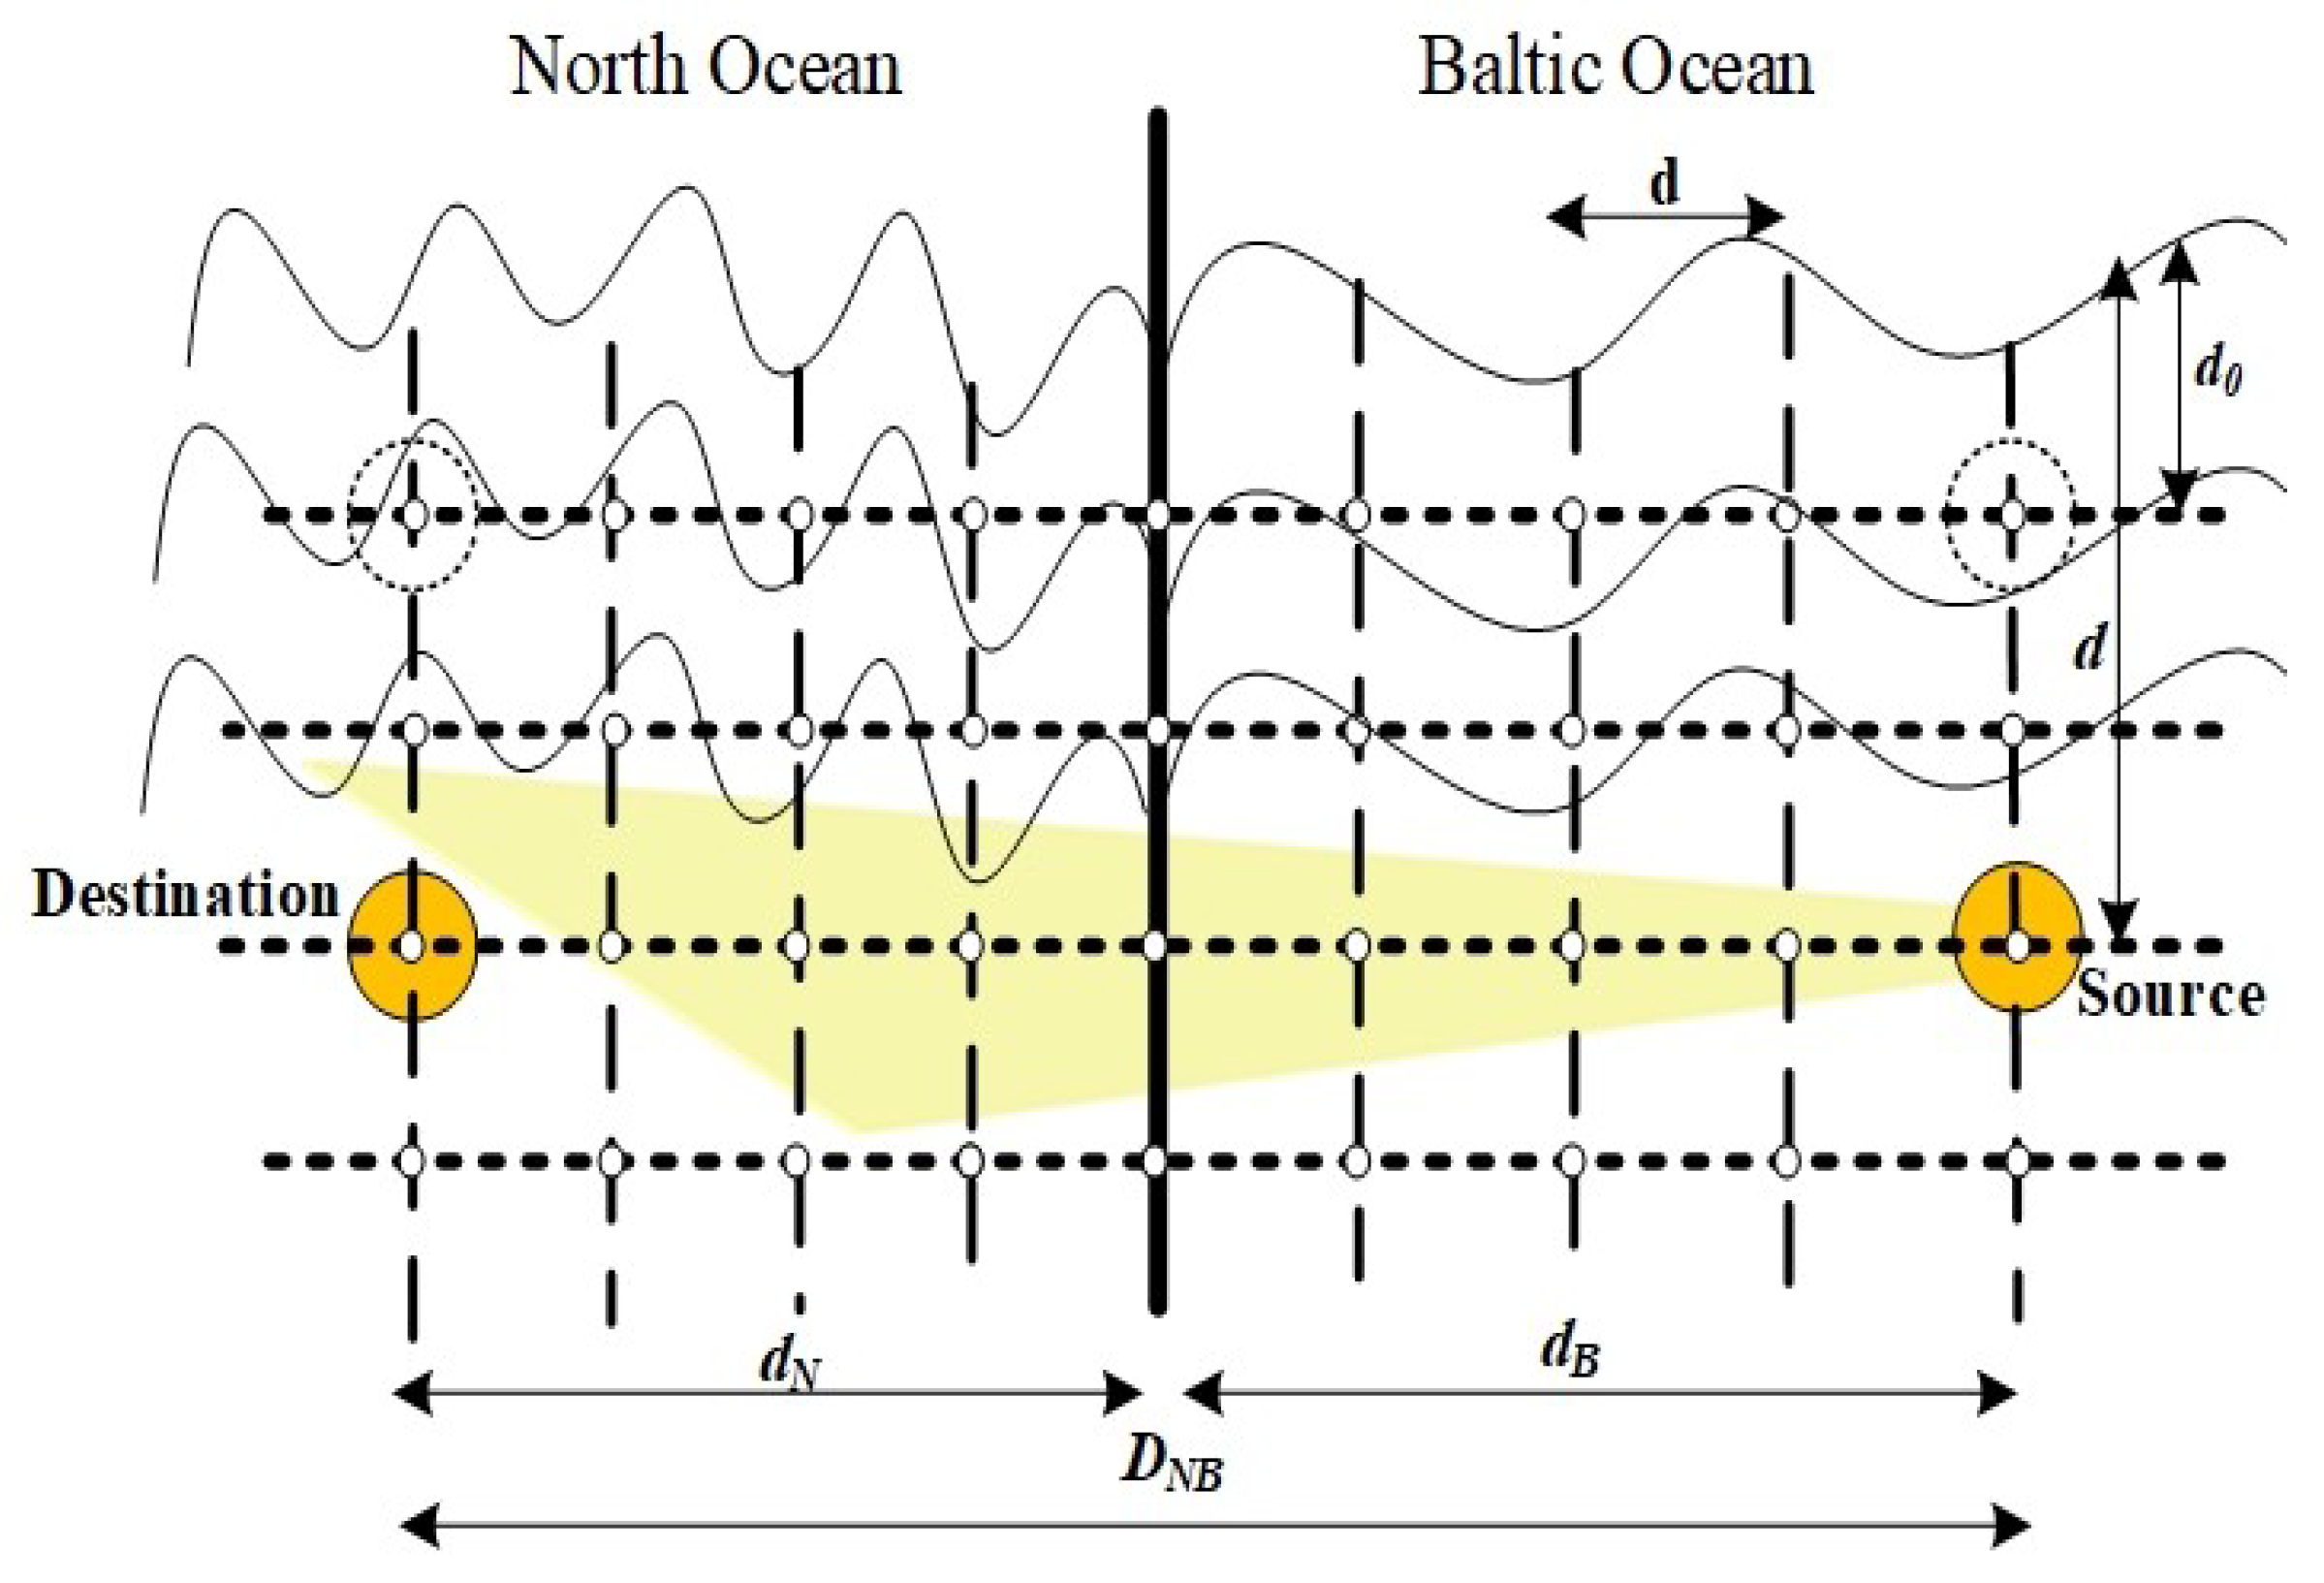
In this proposed system model, we consider the transceivers as a source node (s) that transmits the optical signal from the Baltic sea towards the North ocean-based destination (d) within strong channel conditions depicted in Figure 2. It is assumed that the communication system is modeled under IM/DD technique through the OOK modulation scheme. In the proposed system model the signal propagation depends on the physical parameters of the experimental setup, such as electrical to optical conversion efficiency and photo-detector responsivity of photo-diode at the receiver end. Therefore, the received signals at the destination are given as,
where I and are the received signal light intensity and ambient light intensity of the VLC link, respectively. Additionally, x is defined the information transmission symbol along with the AWGN noise n with zero mean and variance. It is noteworthy that the interference from can be effectively filtered by the optical filters. Moreover, optical-to-electrical conversion efficiency can be written as follows [19],
where , q, , and h are denoted as the quantum efficiency of the photo-detector, electron charge, the signal wavelength, and Planck’s constant. Furthermore, the bit interval under the OOK modulation scheme and is denoted the light speed. The instantaneous electrical SNR according to [14] could be defined as . Meanwhile, the average SNR () is stated as . Taking for the normalization of I as , then, the average SNR could be written as .
In this work, the VLC link is impaired by the turbulence phenomena in two independent water channel mediums. It is also considered, the optical irradiance beams I is impaired by attenuation coefficient , which is deterministic in nature and depends on the extinction coefficient along with the distance between communication nodes. The extinction coefficient c() is the sum of total absorption coefficient () and scattering coefficient (). The typical values of (), () and c() are mentioned in Table V [20]. On the other hand, the atmospheric turbulence random variable affects the optical beam which is denoted by . The combined normalized attenuation channel fading coefficient for the VLC link is formulated as .
3. The Channel Condition Model
The attenuation coefficient depends on the line of sight distance between the transceivers and the extinction coefficient . Moreover, depends on the water medium with corresponding ocean water N and B. The notations are denoted as the North and Baltic ocean parameters. In this study, we consider both of the water mediums as clear ocean waters for the simulation. Therefore, for both oceans follows Beer Lambert’s law as,
In this work, a GG probability distribution function is used to model turbulence channel fading for the communication link. It is noteworthy that the GG fading model is used to moderate-to-strong turbulence channel conditions. The expression for probability density function (PDF) of turbulence channel condition is given as [21],
where is the GG function and is denoted as the modified Bessel function of the second kind, and are the large and small scale eddies variances, respectively. The parameters and particles are modeled as (5) and (6) on the given practical values at different temperature salinity, and depth as in [22]. In UVLC link, we consider turbulence fading under spherical wave model, therefore the large and small scale factors formulated as follows ([23] Equation (47)),
In (5) and (6), is represented the scintillation index and known as the Rytov variance. However, the Rytov variance is calculated (Equation (22) in [2]) as follows,
where, in above expression (7) the wave number , link distance , magnitude of the spatial frequency , and spectrum spectrum model are defined, respectively. Additionally, , , , are represented as normalized distance variable, Kolmogorov micro-scale length, and constants with relative strength of temperature and salinity , and eddy diffusivity ratio . Furthermore, the parameters = , = are dependent on temperature and salinity Prandtl numbers, while = is used in (7), respectively. Throughout the expression in (7), the large and small scale parameters are calculated for the given temperature and salinity as in [1], and further used in the investigated BER, and outage probability of closed form expressions as (18) and (21).
For the two different water mediums, the PDF of turbulence conditions are defined as follows with [24],
In (8), we have , and along with the argument . Further, replacing the average SNR and implying the changes of variable method, the PDF of (8) can be written as,
In the more convenient comparative study for isolated water medium, there is some mathematical modification in (9). We can formulate (10) for a single layer (SL), which can be written as,
To obtain the CDF of (9) by integrating the PDF expression as = . We utilize the properties of Wolfram Mathmatica (Equation 07.34.21.0084.01 in [25]), and we obtained (11) as follows,
where z, , and can be written as,
Similarly, the CDF of (10) could be written as for single layer,
Analysis of Average BER Calculation
The error probability under OOK modulation scheme is defined as follows: [26],
In (13), replacing the value of SNR, and further utilizing the properties of Wolfram Mathematica (Equation 06.27.26.0006.01 in [25]), the modified equation can be written as,
For ABER performance calculation of the whole system under consideration IM/DD technique, the ABER for expression is written as,
Furthermore, replacing the values from (8) and (14) into (15), we obtained (16) as
where can be given as
To solve the expression, we utilize the properties of the G-Meijer function (Equation 07.34.21.0013.01 in [25]) to get the average BER of the whole system. We get the average BER expression of the communication link between the Baltic–Northern ocean by (18). Furthermore, for the homogeneous water medium, the ABER expression for single layer could be written as
4. Outage Performance of the System
Generally, the outage probability defines as the probability in which the instantaneous SNR () falls below the expected threshold SNR (). To obtain the outage performance of the proposed system the transmitted should be below the threshold value of the communication link as follows,
5. Numerical Results
In this section, we are presenting the analytical and simulation results. The performance metrics of the proposed system are obtained with the GG distribution under strong system configurations and channel fading. In this work, we have taken the experimental data for the whole year during 1996s in Baltic and North ocean meeting waters. It is noteworthy that the practical data has been taken up to 20 m vertical depth and 400 m horizontally in both of the oceans as proposed in [1]. In order to do that, we used practical data, such as temperature, salinity, and depth to calculate the and particles for each ocean. Additionally, we are considered the clear water in both of the oceans. Due to this, we have taken the value for extinction coefficient as , and the distance apart transceivers m. Meanwhile, the electrical to optical responsivity and photo-detector efficiency has taken. The receiver aperture area of the receiver photo-detector is taken as cm with the vertical distance from the water surface of setup m. The outage performances of the system model are observed with varying different vertical distances. The expressions in (17), (18), (20) and (21) are used to obtain the BER and outage probability performances for single and two layers of water in the whole work. The and particles on varying temperature, salinity, and depth are utilized to support the expected performance metrics in this study.
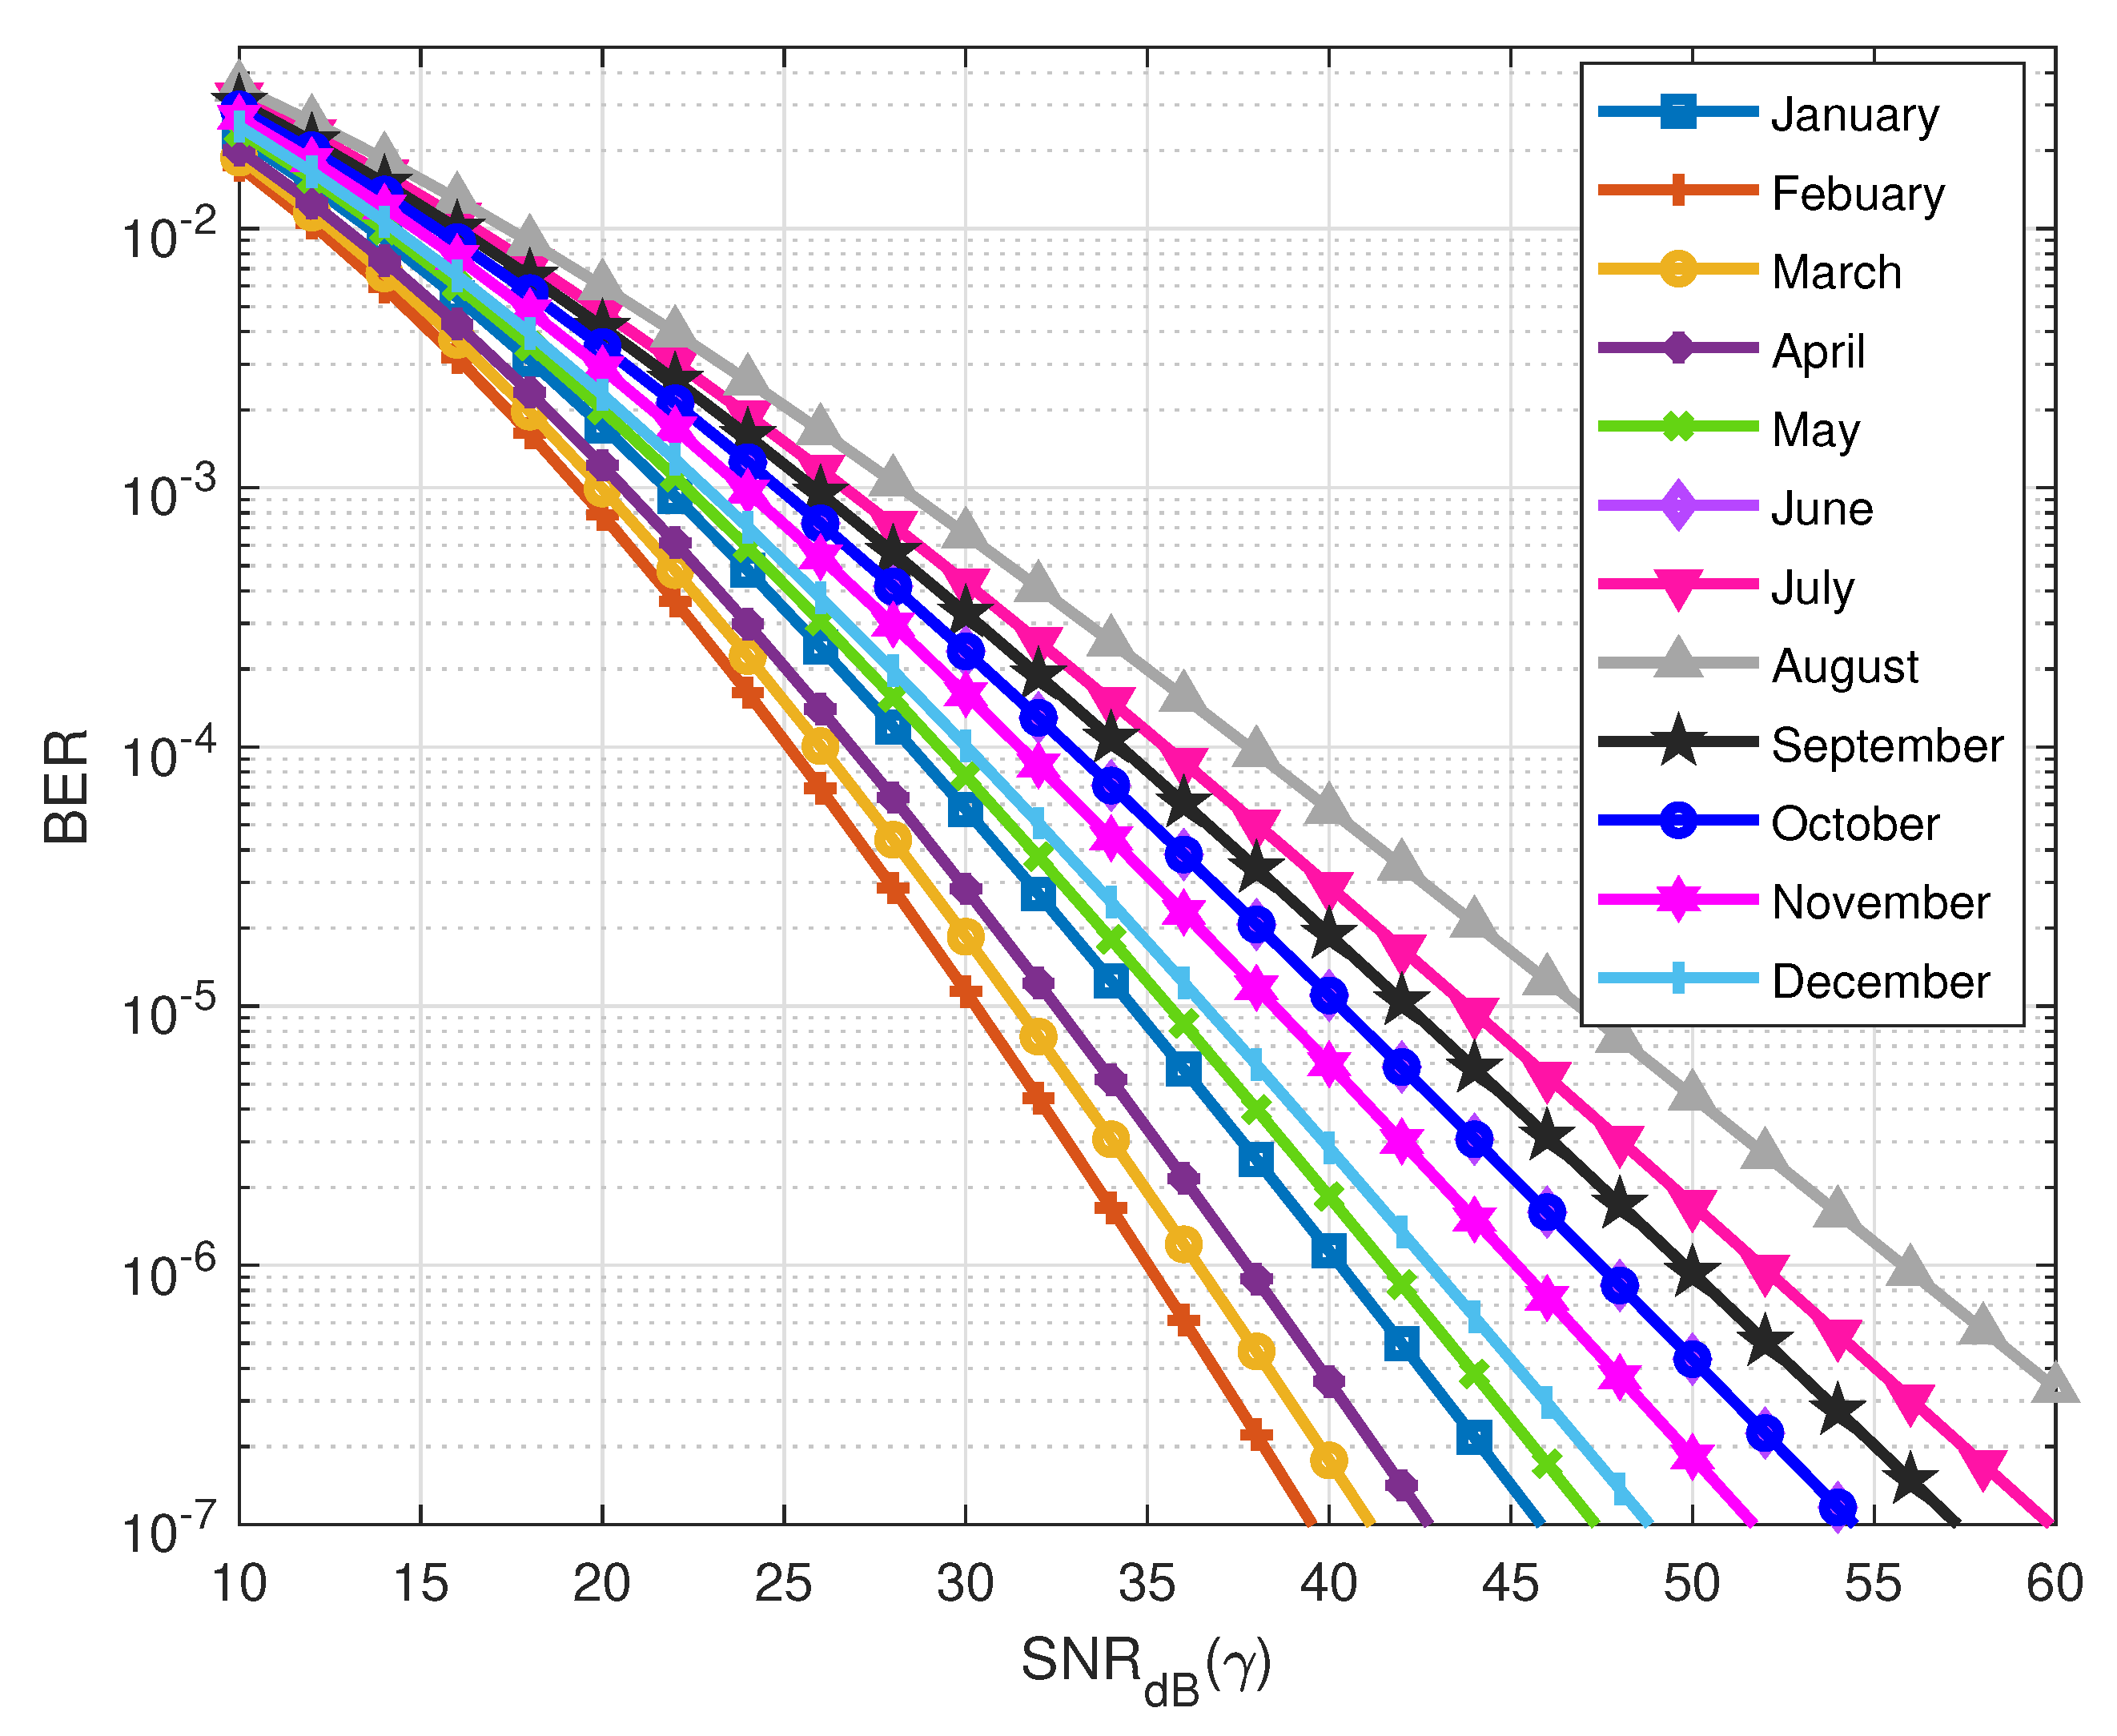
In Figure 3, we observe the BER performance monthly basis of the proposed system in the North ocean during the whole year 1996s by using (17). It is clearly depicted as superior BER performance in the beginning of the year. While the best performance is obtained at the temperature ( °C) and salinity ( PSU) in February as compared with the other month’s environmental conditions. Following the same approach as in the related existing work [14], the large and small scale parameters are chosen to validate the specified fading model. On the basis of corresponding temperature and salinity, the parameters and have been taken. The performances are poorer incoming months of the year cause the temperature rising up and salinity decrease proportionally [27]. The poorest performance is depicted in August as the highest temperature and varying salinity. The system performance instantly improves when the temperature tends to rise up in February and March. The BER curves are showing superior performance in the first quarter of the year in low SNR conditions.
Similarly, the BER performance has been depicted in Baltic ocean by utilizing the investigating expression (17) in Figure 4. The performance is following the same pattern as in the North ocean on varying water physio-chemical properties depicted in Figure 3. It is clearly observed that the BER performances of the proposed system in the Baltic ocean are superior than the North ocean due to the nature of water. It is because of the less turbulent water medium and the temperature quite higher than the North ocean. It is noted that the performances are simulated by considering the clear ocean waters in both of the oceans. In Figure 4, it is also observed that the best performances during the first quarter of the year in low SNR conditions as compared with the North ocean. The best BER performance of the Baltic ocean is depicted during February at 24 dB while in the North ocean at 39 dB. The corresponding temperature and salinity parameters Baltic sea in February are ( °C) and ( PSU). On the basis of the related temperature and salinity, the large and small scale factors have been taken as and , respectively. If targeting average BER , the worst performance is at dB in the Baltic ocean depicts during July, which is worst than the North ocean during August at 56 dB.
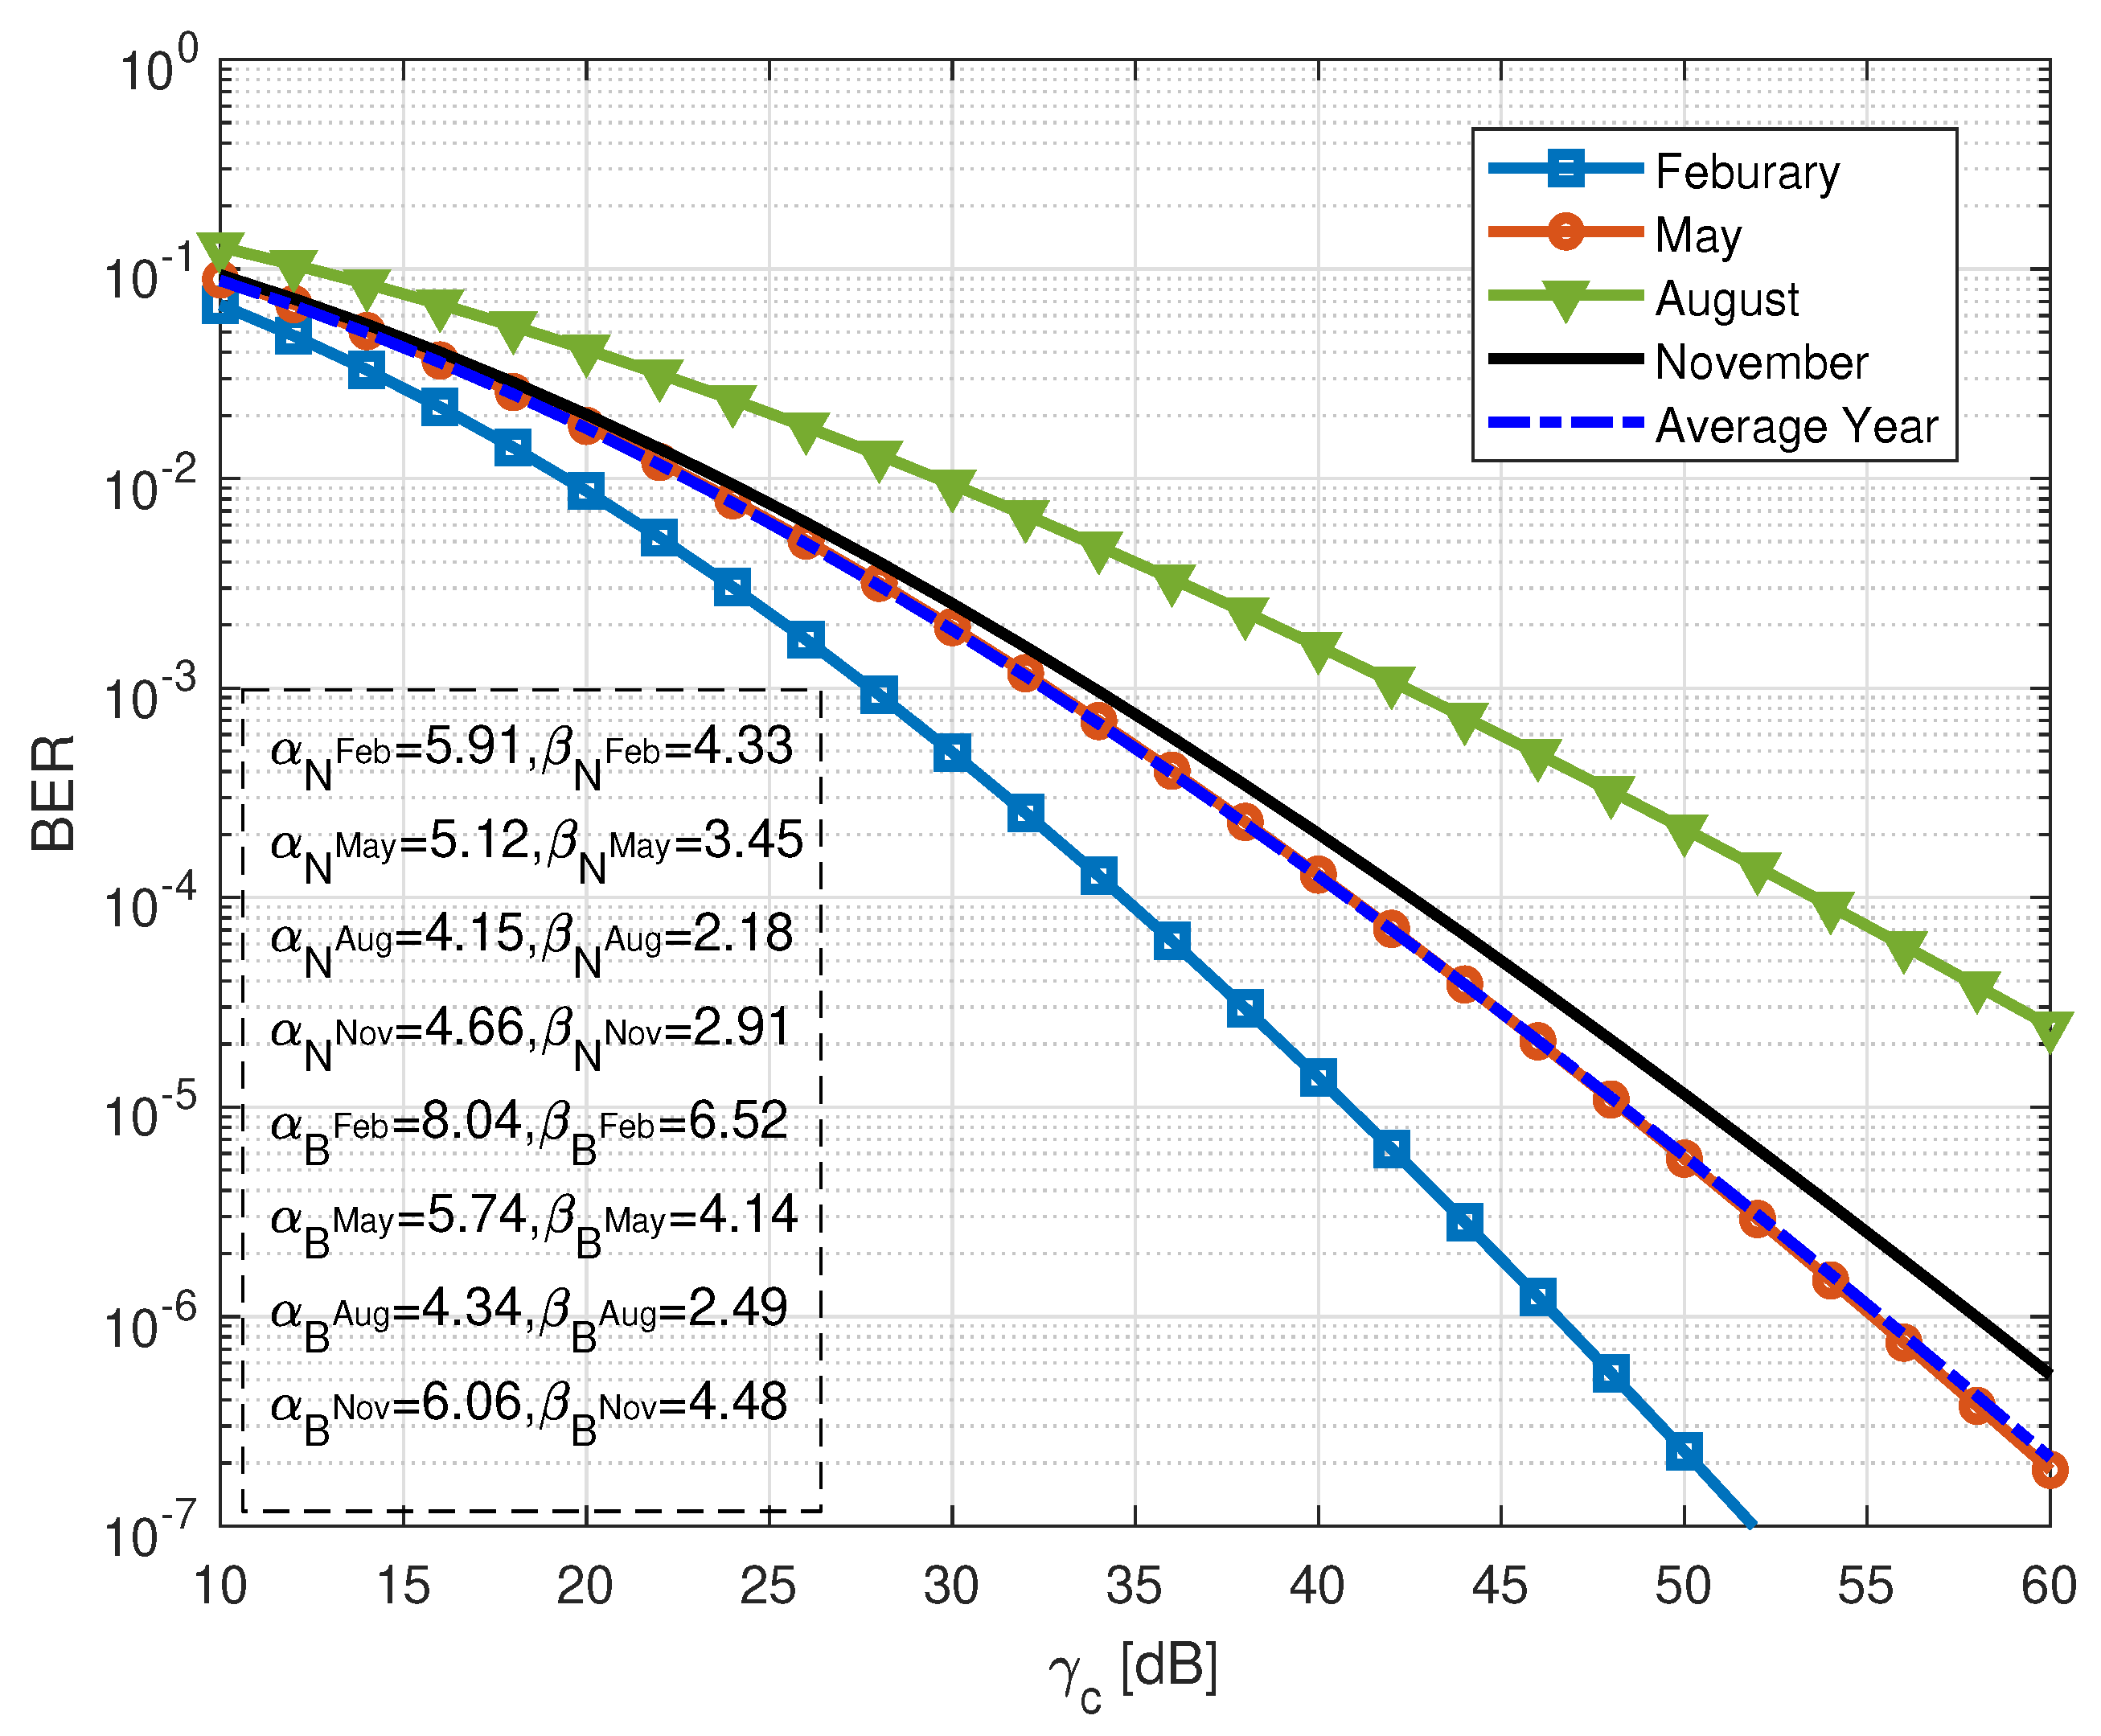
Due to the observation of BER performance in both of the oceans separately. In Figure 5, the BER performances is obtained in the mingled waters of the ocean as per the given data by utilizing the closed-form expression in (18). According to the Figure 3 and Figure 4, the best performances are observed in the first quarter of the year. Due to this, we sub-divided the year into four consecutive quarters for comparison BER performance observation in mingled water mediums. The values of system parameters in an individual ocean, such as and for each month were chosen to validate the specified fading model as () (), () (), () (), () (), and () (), () (), () (), () (), respectively. In Figure 5, it has shown that the best BER performance of the proposed system in mingled water is obtained during February within the low SNR conditions rather than other intervals of the year. The BER performance in November is much higher than in August because of the changing temperature and salinity. The BER performance of the system is obtained in May, which is properly matched the performance of average temperature and salinity of the whole year. It means the average BER could be observed during May at 55 dB SNR value when targeting BER.
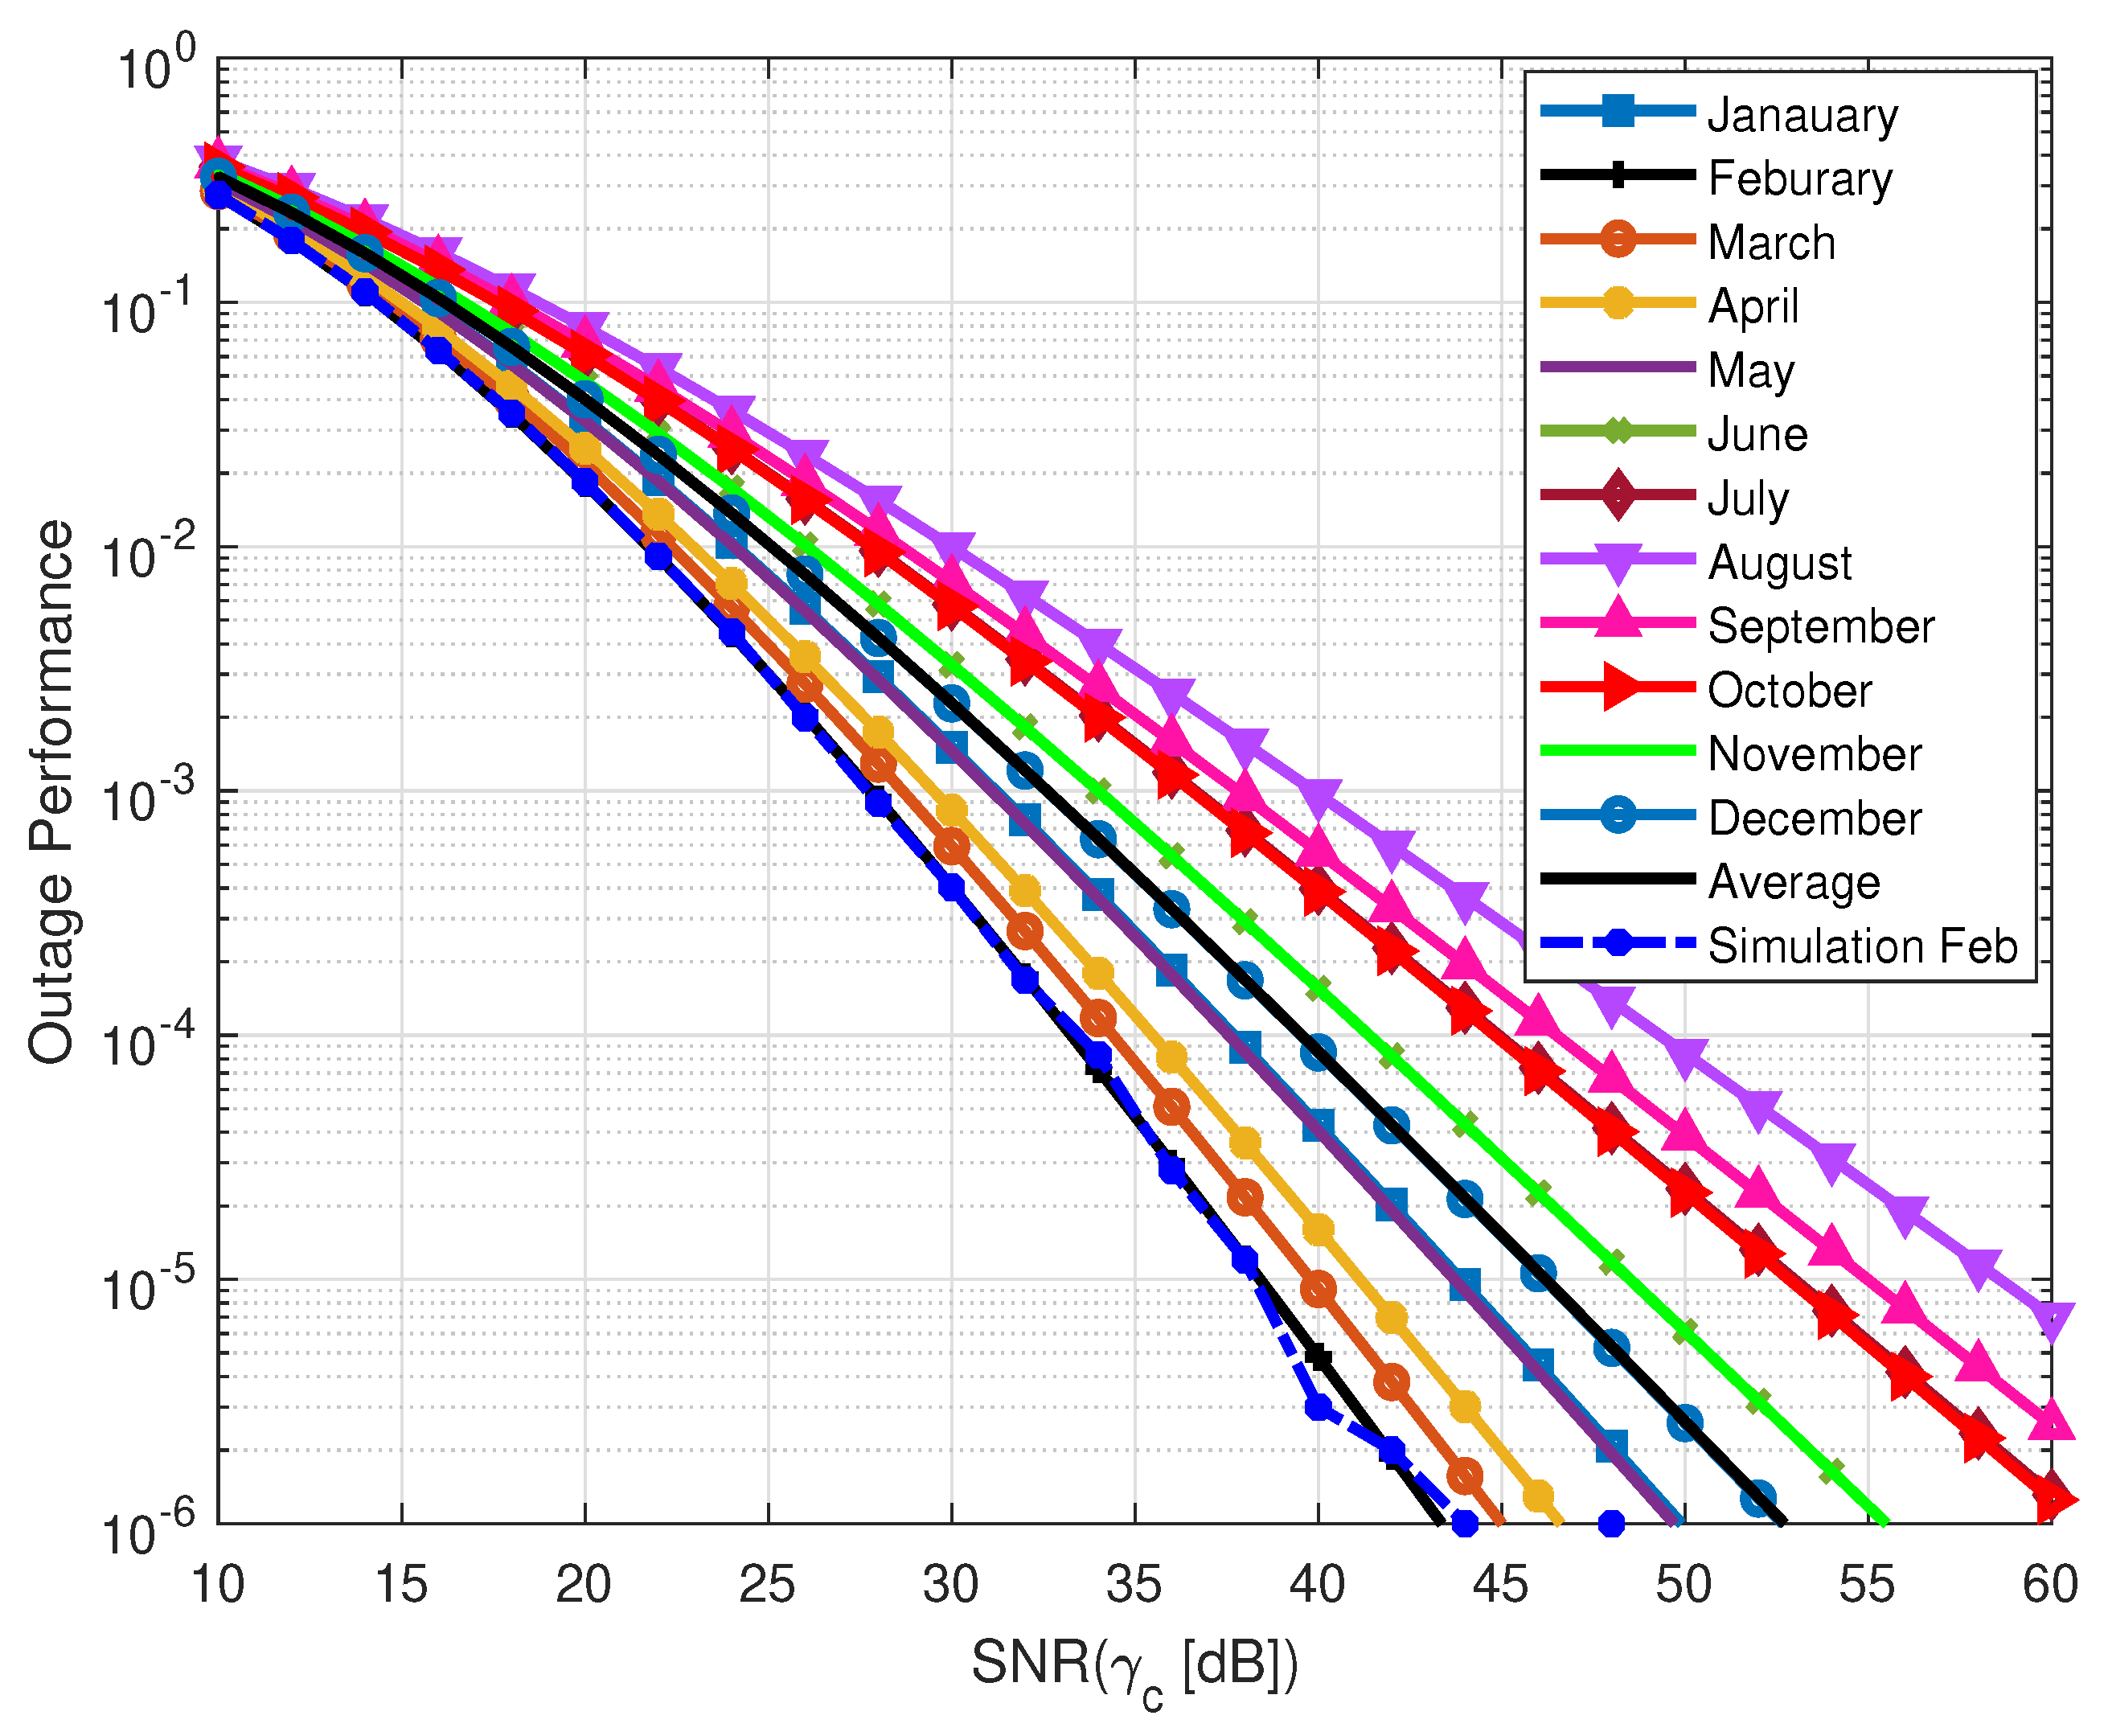
In Figure 6, the outage probability of the system for the whole year in the North sea is depicted by using the expression (20). As, in Figure 6, the best outage performance of the system can be observed in the beginning of the year, it can be concluded that the experimental simulated results provide a perfect match with their analytical counterparts. Besides, the approximated outage probability at low SNRs matches with its simulated counterpart in low SNRs regime with utilizing the expression in (20). The simulated outage performance is also properly matched with the analytical outage performance stating the efficiency of the proposed system model. In the North sea, the average performance for the whole year is poorer than the first half of the year.
Furthermore, following the same pattern in Figure 7, the outage performance has been observed in Baltic sea by using the expression (20). In the Baltic ocean, the superior performance is depicted during January and December cause of the nature of the ocean water and currents. As the Baltic ocean considers a quiet water medium rather than the North ocean, one of the reasons it has less turbulent and the performances are higher than the North ocean. The average outage performance is obtained during May in the Baltic sea, whether in the month of June in the North ocean. As compared with the poorest performance in July in the Baltic sea while in August in the North ocean. The simulation result is properly matching with the analytical curve in January for the accuracy of the proposed system model. The better outage performances of the system in the Baltic sea are obtained during December to March in low SNR conditions, while North ocean in February to April.
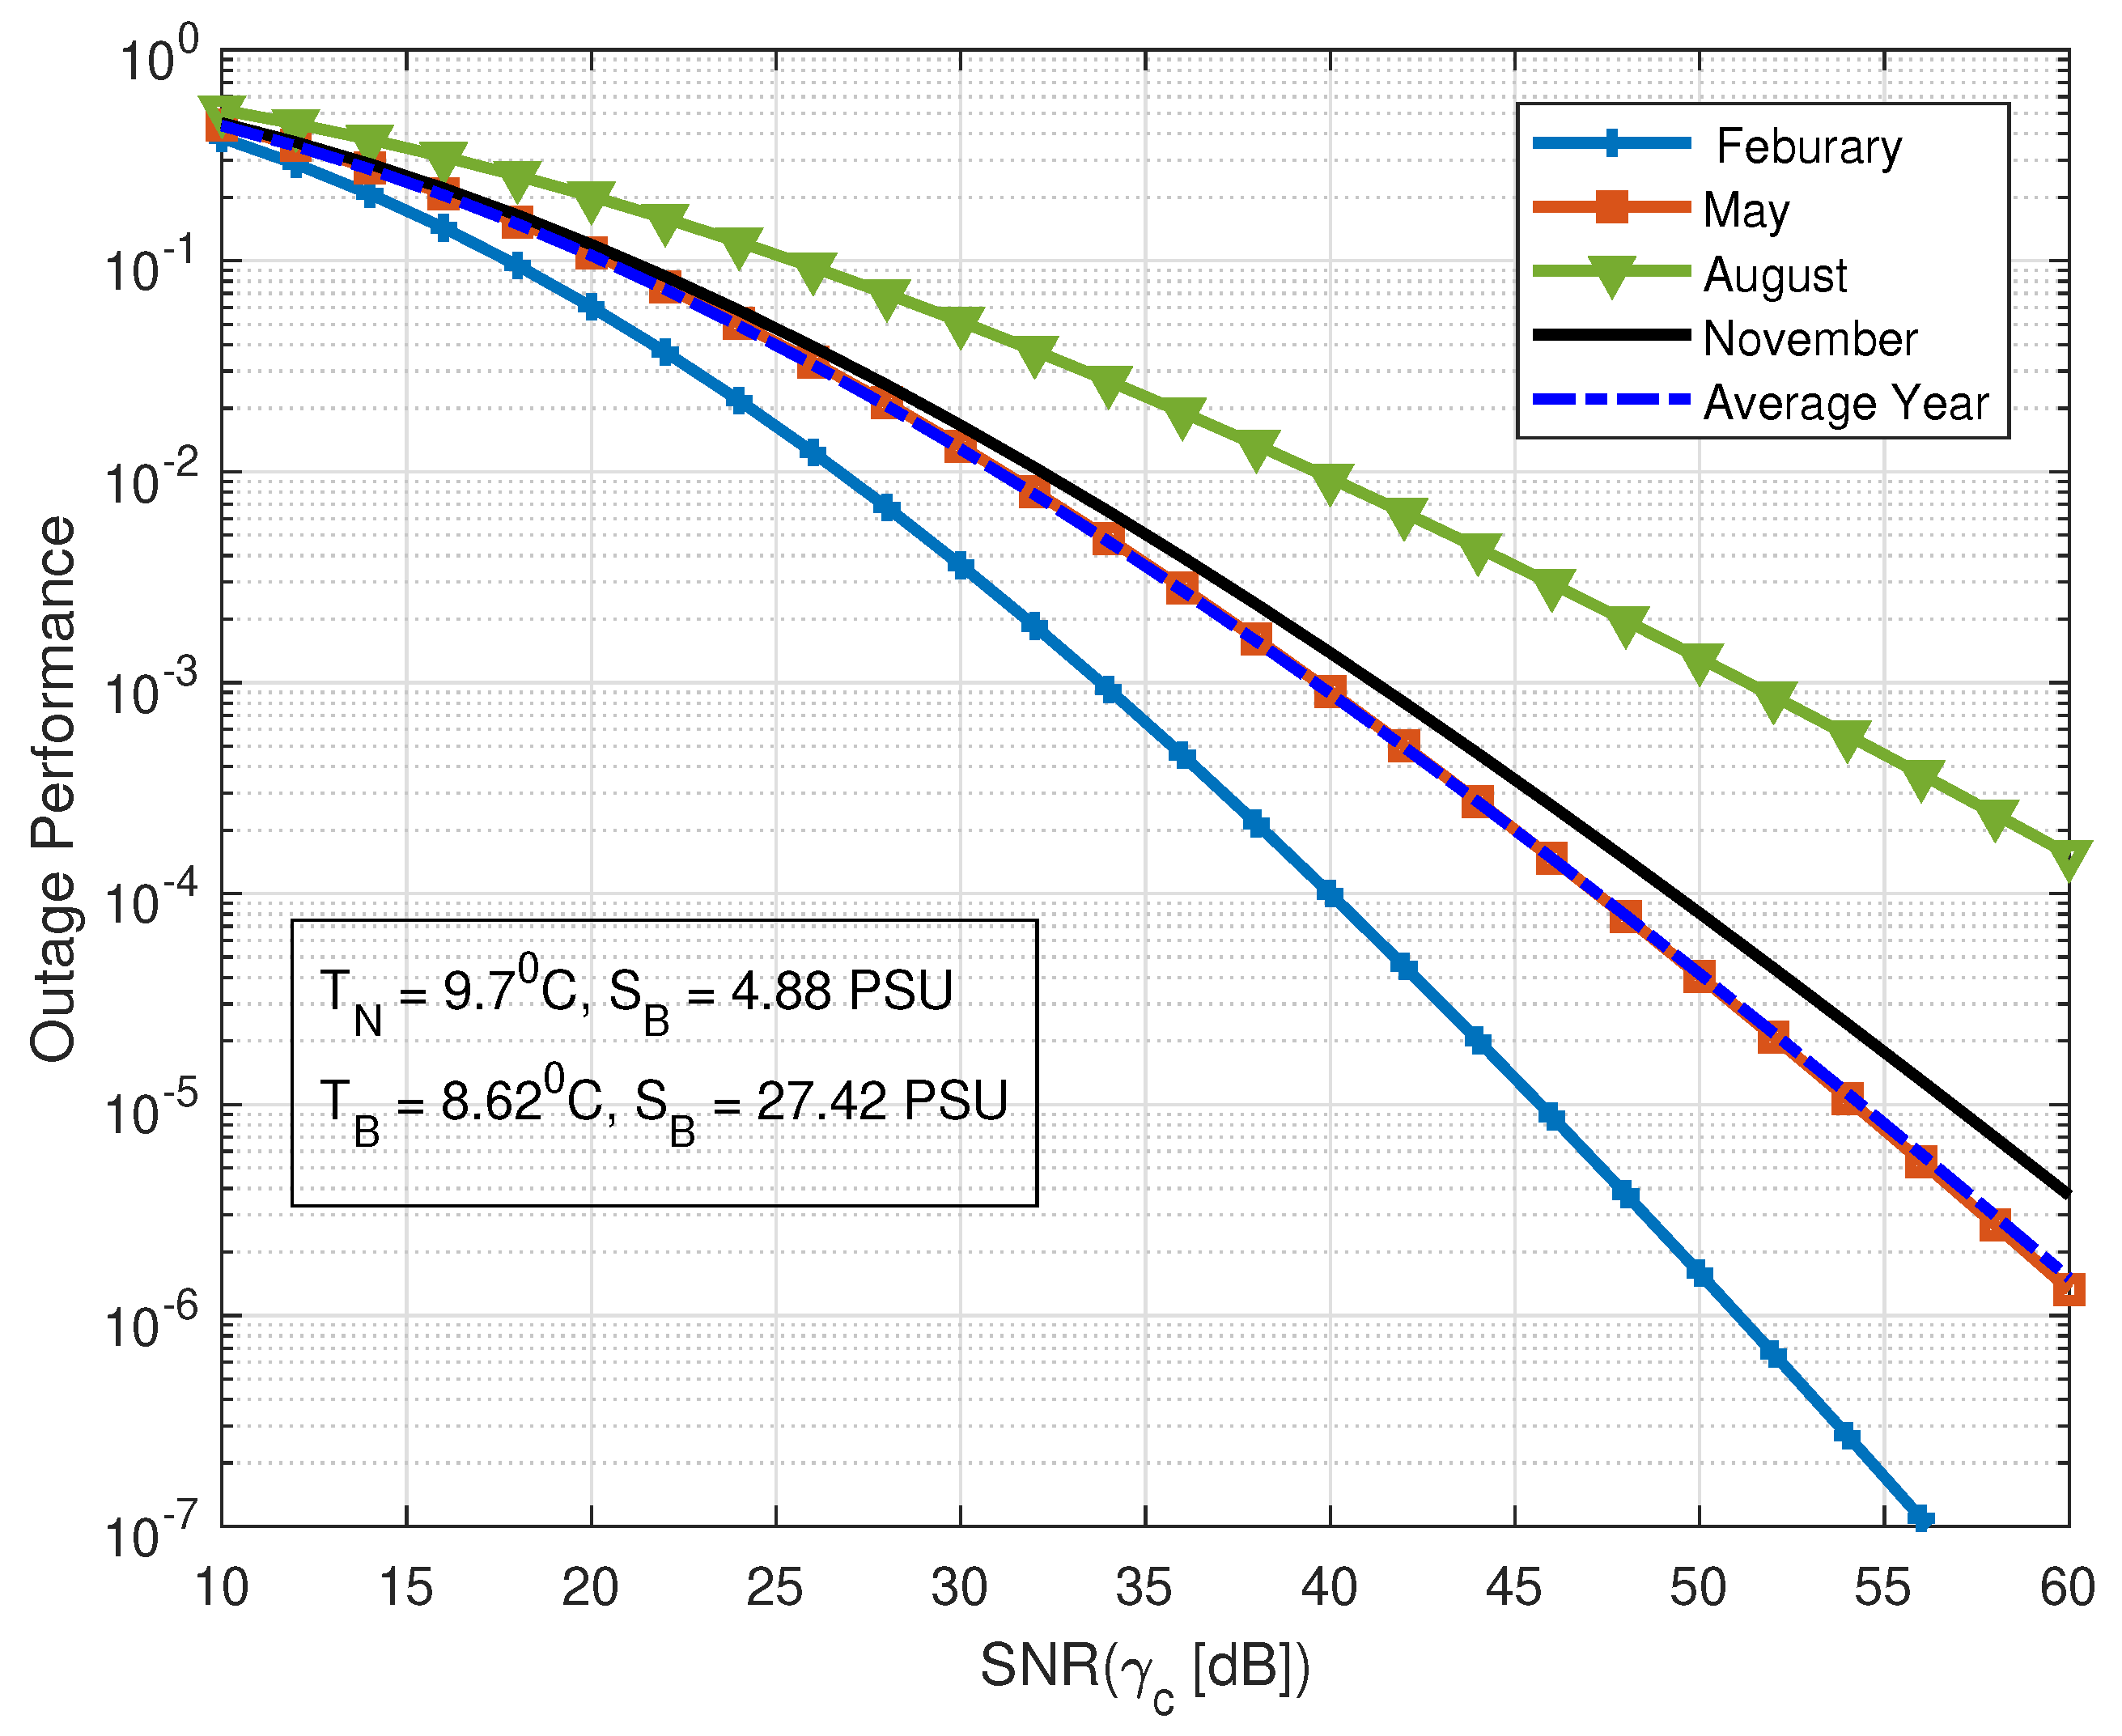
The quarterly outage performance of the proposed system model under strong channel conditions following GG distribution in mingled water has been depicted in Figure 8 by utilizing the investigated closed-form expression in (21). The superior outage performance is observed in February while the average performance is in May. The system performance in mingled water is obtained as poorest in August. However, the performance in November is quite near to the average performance for the year. The comparative performance is obtained in Figure 8, within the different duration of the corresponding year. Due to this, the and particles have been calculated differently. The average year performance is depicted based on average temperature and salinity for each ocean as ( °C and PSU) and ( °C and PSU), respectively. Furthermore, the outage probability performance deteriorates as the atmospheric turbulence conditions become severe. The threshold SNR ( dB) is used to achieve the outage performance of the system.
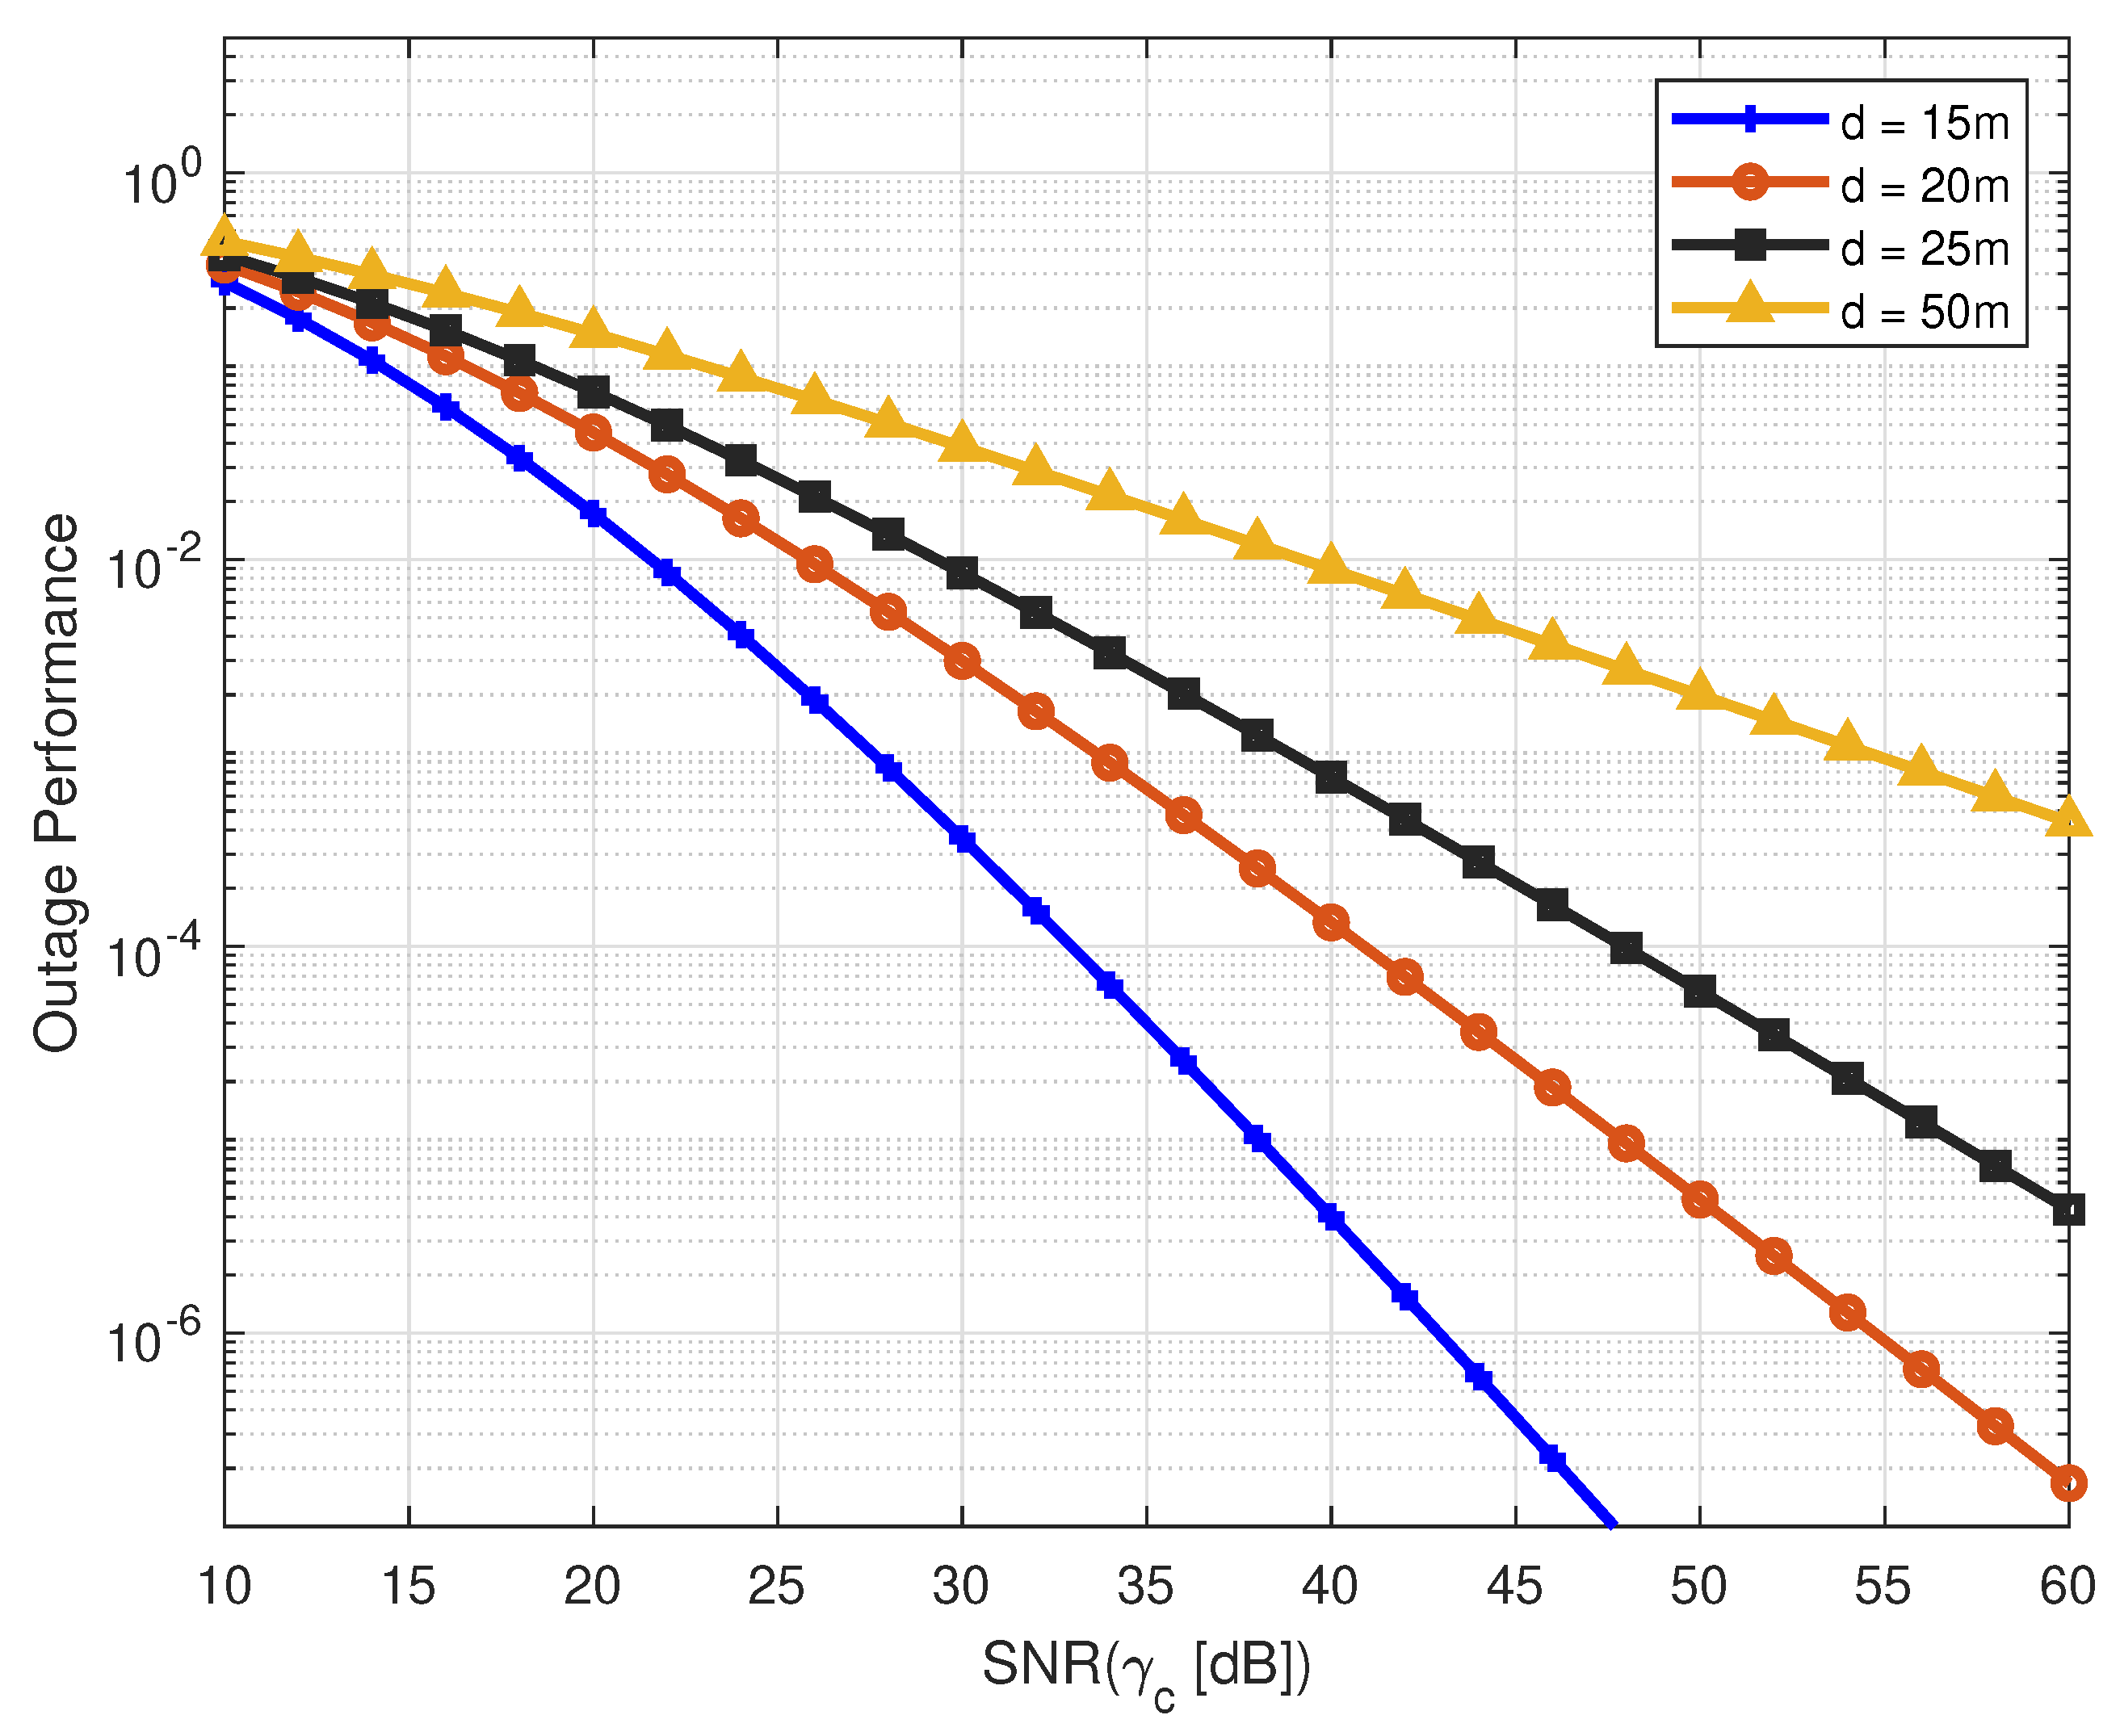
The outage performance is more significant of the proposed system model in the North ocean, due to varying vertical depth using (20) as depicted by Figure 9. The large and small scale , parameters are calculated as per the temperature and salinity conditions of the oceans, while the attenuation coefficient has deterministic values as discussed in section III. In the North ocean, the best outage performance is observed at 15 m in high SNR conditions ( dB) rather than the limiting vertical distance at 50 m. If targeting , at 20 m and 25 m, the performance can be achieved at 41 dB and 48 dB SNR values, respectively. This is because of the decreasing temperature and increasing salinity, pressure, and density. It means that by increasing the vertical distance underwater, the performance of the system is simultaneously reduced.
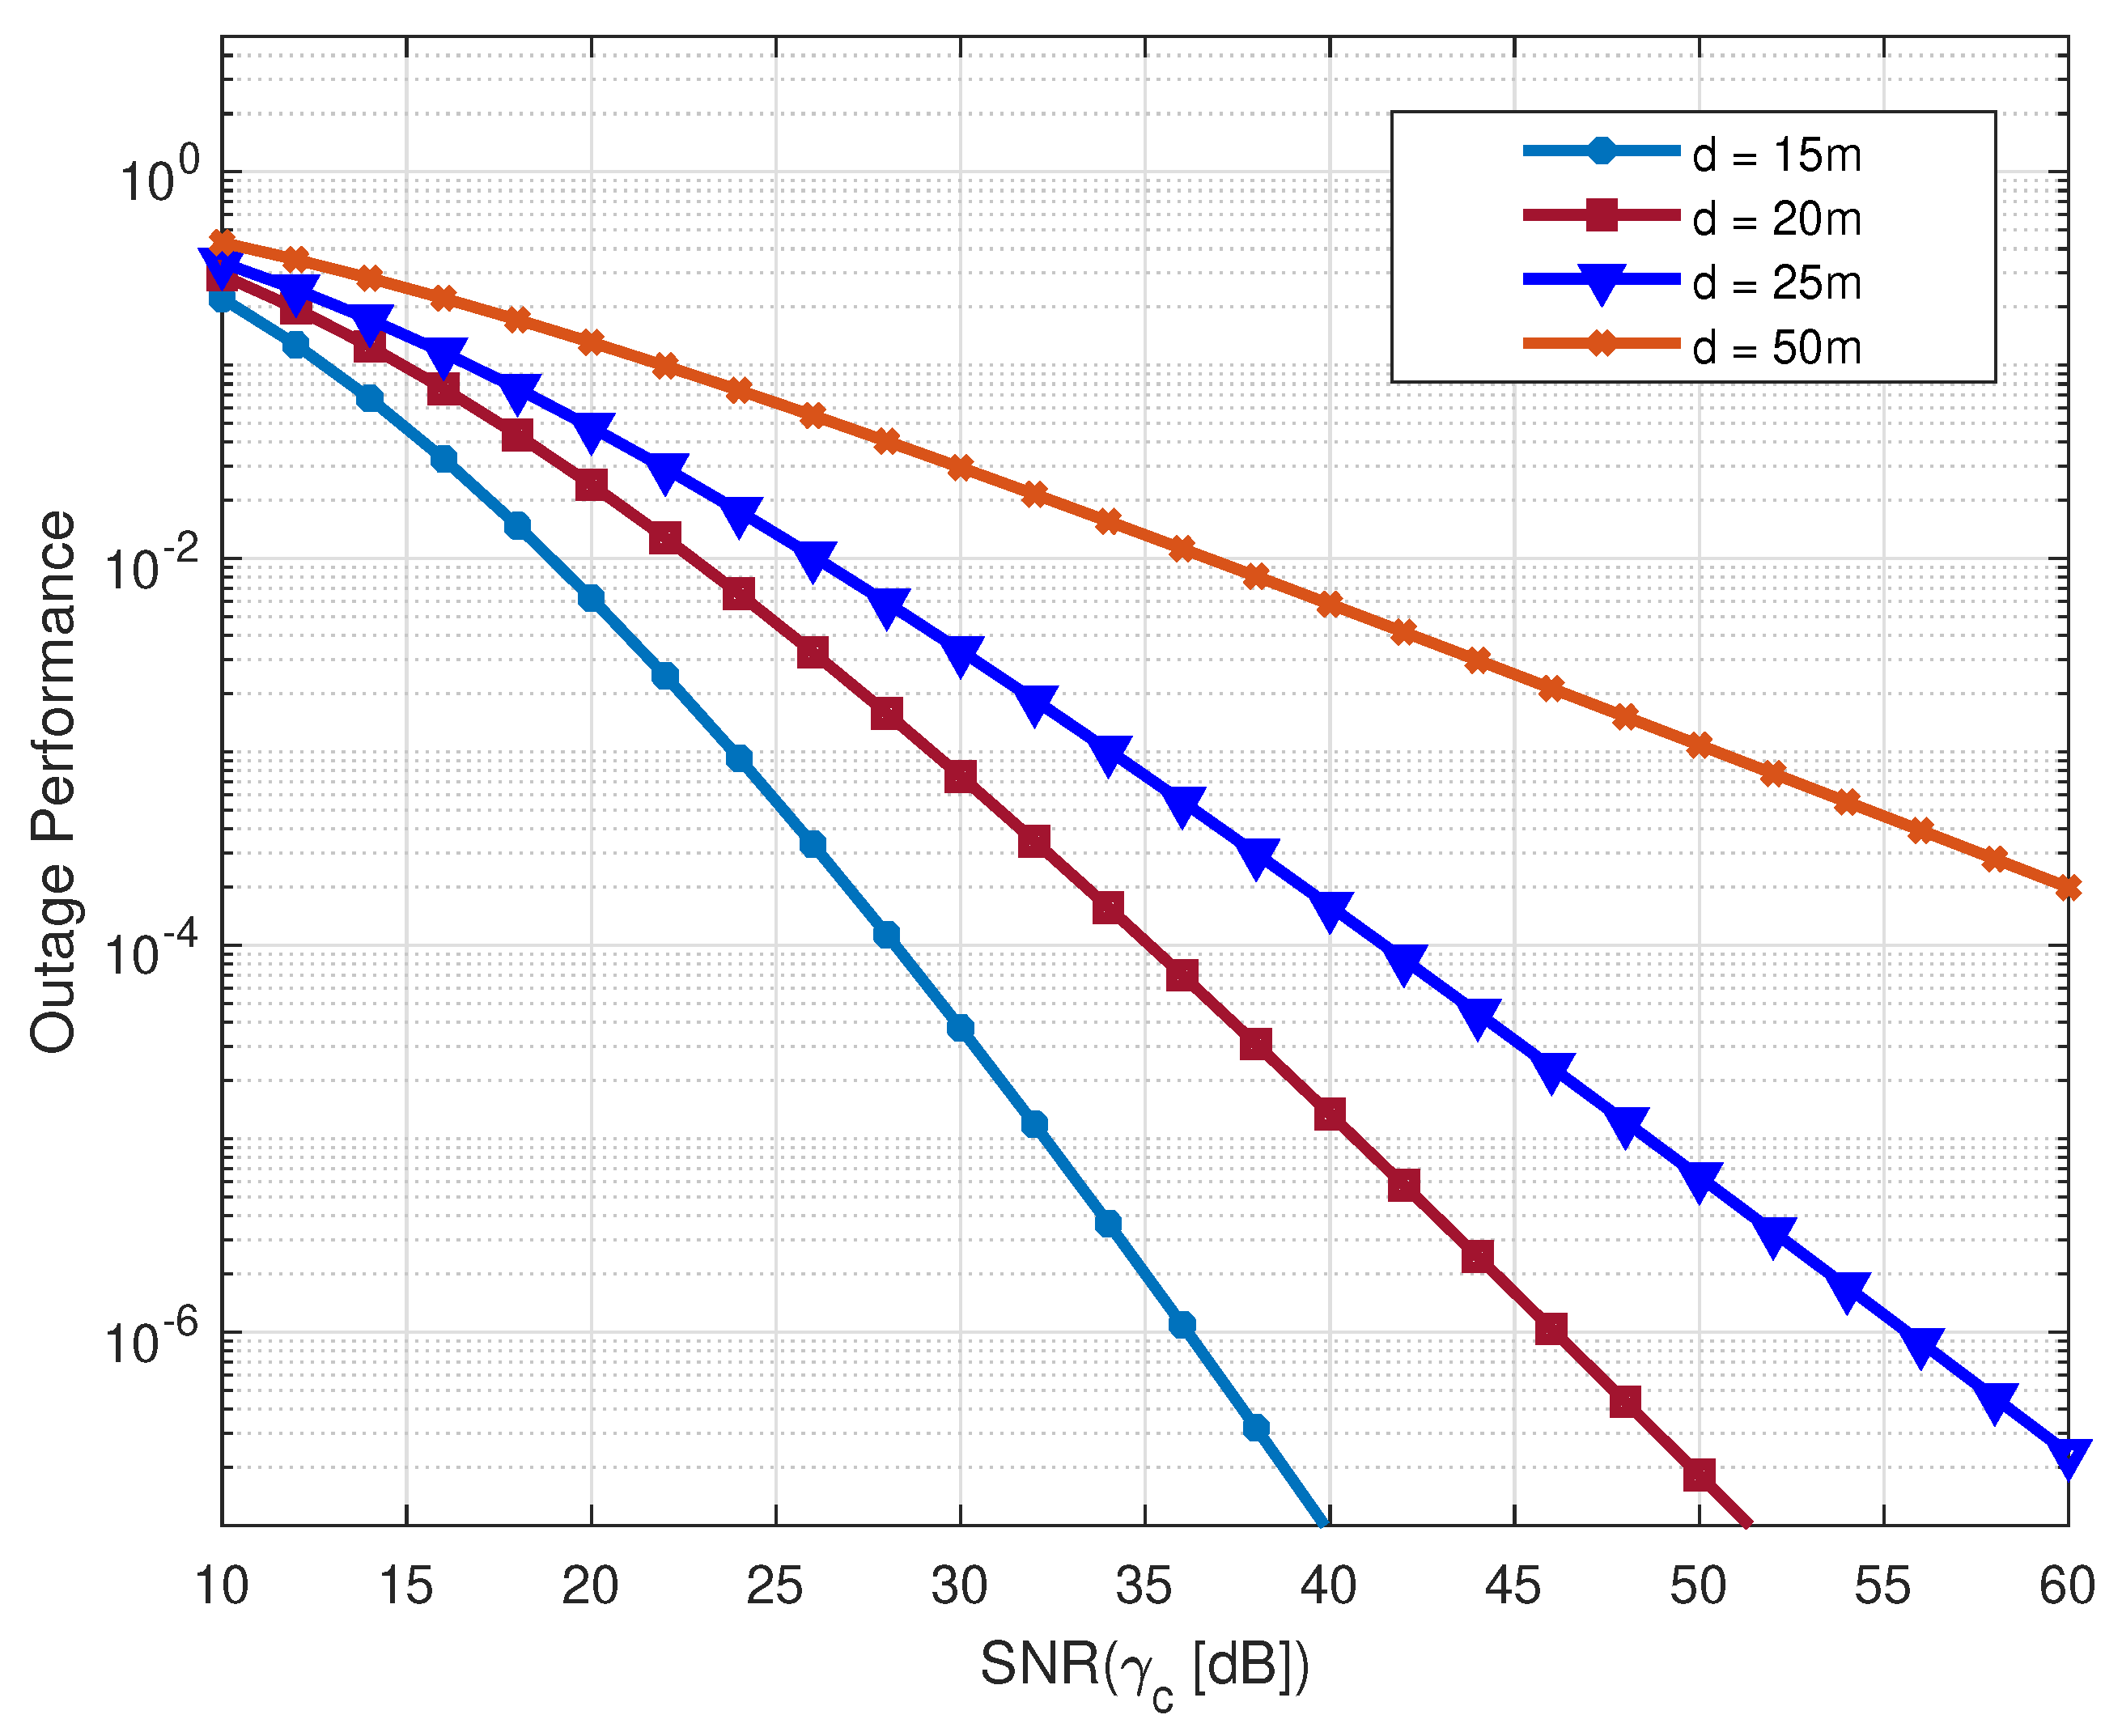
Similarly, In Baltic sea observation of outage performance is obtained by Figure 10 on varying vertical distances by unitizing expression as (20). The superior performance in the Baltic sea could be depicted at 15 m, for SNR channel conditions at 39 dB. If targeting outage performance at 20 m, it is achieved at 36 dB in the Baltic sea. Still, the poorest performance can be observed in both of the oceans at the maximum vertical distance at 50 m. As compared with the North ocean the superior performance is obtained in the Baltic ocean in low SNR conditions as 15 m and 20 m, respectively.
The outage performance of the whole system within the both of oceans could be observed in Figure 11 using closed form expression as (21). The results are obtained when the experimental setup is situated on varying vertical distances underwater. If targeting , the better outage performance is depicted at 15 m in high SNR (41 dB) conditions as compared with an individual North ocean and Baltic sea as and 27, respectively. It is higher than both individual oceans because the water meets and the water mingles along with the heat transfer. The performance is reducing on increasing depth. It is obvious that on increasing distance in oceans the density and salinity also increase and water conditions harsh. The apparent optical properties influence the optical signal propagation. The worst performance can be depicted at 50 m in both of the water mediums individually and mingled water cause the physiochemical properties of water mediums.
6. Conclusions
In this work, we proposed a VLC link in the Baltic–North ocean meeting scenario, which is the main attraction of human interests, widely used for goods transportation in the EU for commercial purposes. The necessity to explore the mingled strait and explore both of the ocean. Due to this, we investigated the BER and outage probability performance of the communication system in highly turbid channel conditions. The performances are obtained of the proposed system model on the basis of the practical data provided during 1996s. This study provides an extensive research gateway for further work in ocean-to-ocean, river-to-ocean meeting, and mixing water scenarios. It is concluded that this research provides a new paradigm in the Baltic–North ocean mingled water for reliable communication.
Author Contributions
M.F.A. has done the mathematical methodology for the proposed system model along with the result comparison, T.D.P.P. is used the MATLAB sofware tool to obtain the simulation results. D.N.K.J. is proposed the system within the two oceans and provided the data source for the research. All authors have read and agreed to the published version of the manuscript.
Funding
This work is funded by the CEU-Cooperativa de Ensino Universitário, Portugal, in part, by the Russian Foundation for Basic Research grant No. 20-37-90078 and by the the framework of Competitiveness Enhancement Program of the National Research Tomsk Polytechnic University, Russia.
Institutional Review Board Statement
The study was conducted according to the guidelines of the Declaration of approved by the Institutional Review Board of National Research Tomsk Polytechnic University, Russia.
Informed Consent Statement
Informed consent was obtained from all subjects involved in the study.
Data Availability Statement
The data has been taken from existing literature within the Baltic and North oceans during 1996s. The corresponding work is cited already the manuscript. https://0-link-springer-com.brum.beds.ac.uk/article/10.1007/BF02933676 (accessed on 15 December 2021).
Acknowledgments
This work is funded by the CEU-Cooperativa de Ensino Universitário, Portugal, in part, by the Russian Foundation for Basic Research grant No. 20-37-90078 and by the the framework of Competitiveness Enhancement Program of the National Research Tomsk Polytechnic University, Russia.
Conflicts of Interest
The authors declare no conflict of interest.
References
- Janssen, F.; Schrum, C.; Backhaus, J.O. A climatological data set of temperature and salinity for the Baltic Sea and the North Sea. Deutsche Hydrografische Zeitschrift 1999, 51, 5–245. [Google Scholar] [CrossRef]
- Elamassie, M.; Uysal, M.; Baykal, Y.; Abdallah, M.; Qaraqe, K. Effect of eddy diffusivity ratio on underwater optical scintillation index. JOSA A 2017, 34, 1969–1973. [Google Scholar] [CrossRef] [PubMed]
- Ali, M.F.; Perera, T.D.P.; Sergeevich, V.S.; Irfan, S.A.; Viktorovna, U.E.; Zhang, W.; Camponogara, Â.; Jayakody, D.N.K. Selection Relay Based RF-VLC Underwater Communication System. In Machine Learning, Deep Learning and Computational Intelligence for Wireless Communication; Springer: Singapore, 2021; pp. 177–192. [Google Scholar]
- StudyCorgi. The Baltic and Northern Seas Meeting Phenomenon. Available online: https://studycorgi.com/the-baltic-and-northern-seas-meeting-phenomenon/ (accessed on 30 October 2021).
- Naser, S.; Bariah, L.; Muhaidat, S.; Al-Qutayri, M.; Uysal, M.; Sofotasios, P.C. Space-Time Block Coded Spatial Modulation for Indoor Visible Light Communications. IEEE Photonics J. 2021, 14, 1–11. [Google Scholar] [CrossRef]
- Tang, Z.; Arai, S.; Yamazato, T. Simplified Alamouti-type Space-Time Coding for Image Sensor Communication Using Rotary LED Transmitter. IEEE Photonics J. 2021, 14, 1–7. [Google Scholar] [CrossRef]
- Tsunoda, M.; Premachandra, C. Remote Control of a Wheeled Robot by Visible Light for Support in Infectious Disease Hospitals. IEEE Access 2021, 9, 124165–124175. [Google Scholar] [CrossRef]
- Ali, M.F.; Jayakody, D.N.K.; Ribeiro, M.V. A Hybrid UVLC-RF and Optical Cooperative Relay Communication System. In Proceedings of the 2021 10th International Conference on Information and Automation for Sustainability (ICIAfS), Negambo, Sri Lanka, 11–13 August 2021; pp. 13–18. [Google Scholar]
- Shen, C.; Ma, C.; Li, D.; Hu, J.; Li, G.; Zou, P.; Zhang, J.; Li, Z.; Chi, N. High-speed visible laser light communication: Devices, systems and applications. In Broadband Access Communication Technologies XV; International Society for Optics and Photonics, SPIE OPTO: Bellingham, WA, USA, 2021; Volume 11711, p. 1171109. [Google Scholar]
- Božanić, M.; Sinha, S. Visible Light Communications for 6G. In Mobile Communication Networks: 5G and a Vision of 6G; Springer: Singapore, 2021; pp. 155–188. [Google Scholar]
- Mohsan, S.A.H.; Amjad, H. A comprehensive survey on hybrid wireless networks: Practical considerations, challenges, applications and research directions. Opt. Quantum Electron. 2021, 53, 1–56. [Google Scholar] [CrossRef]
- Lian, Z.; Zheng, Y.; Gong, X.; Ni, X.; Kou, L.; Gao, J.; Meng, Y.; Feng, X. Design of Communication System of Underwater Hybrid Voice Communication System. In Proceedings of the 2021 IEEE International Conference on Electronic Technology, Communication and Information (ICETCI), Changchun, China, 27–29 August 2021; pp. 325–329. [Google Scholar]
- Misachi, J. North Sea. Available online: https://www.worldatlas.com/seas/north-sea.html (accessed on 30 October 2021).
- Elamassie, M.; Uysal, M. Vertical Underwater VLC Links over Cascaded Gamma-Gamma Turbulence Channels with Pointing Errors. In Proceedings of the 2019 IEEE International Black Sea Conference on Communications and Networking (BlackSeaCom), Sochi, Russia, 3–6 June 2019; pp. 1–5. [Google Scholar]
- Elamassie, M.; Uysal, M. Performance characterization of vertical underwater VLC links in the presence of turbulence. In Proceedings of the 2018 11th International Symposium on Communication Systems, Networks & Digital Signal Processing (CSNDSP), Budapest, Hungary, 18–20 July 2018; pp. 1–6. [Google Scholar]
- Sharifzadeh, M.; Ahmadirad, M. Performance analysis of underwater wireless optical communication systems over a wide range of optical turbulence. Opt. Commun. 2018, 427, 609–616. [Google Scholar] [CrossRef]
- Zedini, E.; Oubei, H.M.; Kammoun, A.; Hamdi, M.; Ooi, B.S.; Alouini, M.S. Unified statistical channel model for turbulence-induced fading in underwater wireless optical communication systems. IEEE Trans. Commun. 2019, 67, 2893–2907. [Google Scholar] [CrossRef] [Green Version]
- Xiang, Y.; Wang, Y.; Ruan, X.; Zuo, Z.; Guo, Y. Improving the discretely modulated underwater continuous-variable quantum key distribution with heralded hybrid linear amplifier. Phys. Scr. 2021, 96, 065103. [Google Scholar] [CrossRef]
- Zhu, X.; Kahn, J.M. Free-space optical communication through atmospheric turbulence channels. IEEE Trans. Commun. 2002, 50, 1293–1300. [Google Scholar]
- Ali, M.F.; Jayakody, D.N.K.; Chursin, Y.A.; Affes, S.; Dmitry, S. Recent Advances and Future Directions on Underwater Wireless Communications. Arch. Comput. Methods Eng. 2020, 27, 1379–1412. [Google Scholar] [CrossRef]
- Gappmair, W. Further results on the capacity of free-space optical channels in turbulent atmosphere. IET Commun. 2011, 5, 1262–1267. [Google Scholar] [CrossRef]
- McDougall, T.J.; Barker, P.M. Getting started with TEOS-10 and the Gibbs Seawater (GSW) oceanographic toolbox. SCOR/IAPSO WG 2011, 127, 1–28. [Google Scholar]
- Andrews, L.C.; Phillips, R.L. Laser Beam Propagation through Random Media; SPIE Press: Bellingham, WA, USA, 2005. [Google Scholar]
- Elamassie, M.; Sait, S.M.; Uysal, M. Underwater Visible Light Communications in Cascaded Gamma-Gamma Turbulence. In Proceedings of the 2018 IEEE Globecom Workshops (GC Wkshps), Abu Dhabi, United Arab Emirates, 9–13 December 2018; pp. 1–6. [Google Scholar]
- Mathmetica, W. Generalized G-Meijer Function. 2020. Available online: https://functions.wolfram.com (accessed on 25 October 2021).
- Ghassemlooy, Z.; Popoola, W.; Rajbhandari, S. Optical Wireless Communications: System and Channel Modelling with Matlab®; CRC Press: Boca Raton, FL, USA, 2019. [Google Scholar]
- Stanford University. Lecture 3: Temperature, Salinity, Density and Ocean Circulation. Available online: http://ocean.stanford.edu/courses/bomc/chem/lecture_03.pdf (accessed on 25 October 2021).
Figure 1.
The North-Baltic ocean meeting scenario near to Skegen in Denmark [13], (All copyright issues are persevered by Valnet Inc. Adapted with permission from Editor in chief © 2022 worldatlas.com, accessed on 15 December 2021).
Figure 1.
The North-Baltic ocean meeting scenario near to Skegen in Denmark [13], (All copyright issues are persevered by Valnet Inc. Adapted with permission from Editor in chief © 2022 worldatlas.com, accessed on 15 December 2021).

Figure 2.
The proposed UVLC system model, where a source in Baltic sea propagates the signal through optical beam towards to the receiver based in North ocean. The investigate communication scenario is considered in strong channel conditions.
Figure 2.
The proposed UVLC system model, where a source in Baltic sea propagates the signal through optical beam towards to the receiver based in North ocean. The investigate communication scenario is considered in strong channel conditions.

Figure 3.
The observation of BER performance for whole year in North ocean. The performances are simulated on monthly basis average temperature, conductivity in the year 1996s.
Figure 3.
The observation of BER performance for whole year in North ocean. The performances are simulated on monthly basis average temperature, conductivity in the year 1996s.

Figure 4.
The observation of BER performance for whole year in Baltic sea. The performances are simulated on monthly basis average temperature, conductivity in the year 1996s.
Figure 4.
The observation of BER performance for whole year in Baltic sea. The performances are simulated on monthly basis average temperature, conductivity in the year 1996s.

Figure 5.
The combined observation of BER performance in both of the oceans through out the year quarterly. Where the maximum and lowest BER performance are depicted in Feb and August within the critical temperature and salinity, respectively.
Figure 5.
The combined observation of BER performance in both of the oceans through out the year quarterly. Where the maximum and lowest BER performance are depicted in Feb and August within the critical temperature and salinity, respectively.

Figure 6.
The observation of outage performance for whole year depicted in North Sea. The simulated outage performance included as in February. The outage performance is simulated based on the experimental data provided though the year.
Figure 6.
The observation of outage performance for whole year depicted in North Sea. The simulated outage performance included as in February. The outage performance is simulated based on the experimental data provided though the year.

Figure 7.
The observation of outage performance for whole year depicted in Baltic Sea. The simulated outage performance included as in February. The outage performance is simulated based on the experimental data provided though the year.
Figure 7.
The observation of outage performance for whole year depicted in Baltic Sea. The simulated outage performance included as in February. The outage performance is simulated based on the experimental data provided though the year.

Figure 8.
The outage performance of the system is depicted at the particular vertical distance of the communication setup in North ocean. The highest and minimum outage performances are depicted on different water conditions.
Figure 8.
The outage performance of the system is depicted at the particular vertical distance of the communication setup in North ocean. The highest and minimum outage performances are depicted on different water conditions.

Figure 9.
The outage performance of the system is depicted at the particular vertical distance of the communication setup in North ocean. The highest and minimum outage performances are depicted in different water conditions.
Figure 9.
The outage performance of the system is depicted at the particular vertical distance of the communication setup in North ocean. The highest and minimum outage performances are depicted in different water conditions.

Figure 10.
The outage performance of the system is depicted at the particular vertical distance of the communication setup in Baltic ocean. The highest and minimum outage performances are depicted in different water conditions.
Figure 10.
The outage performance of the system is depicted at the particular vertical distance of the communication setup in Baltic ocean. The highest and minimum outage performances are depicted in different water conditions.

Figure 11.
The combined outage performance of the system is depicted at the particular vertical distance of the communication setup in both of the oceans. The highest and minimum outage performances are depicted on different water conditions.
Figure 11.
The combined outage performance of the system is depicted at the particular vertical distance of the communication setup in both of the oceans. The highest and minimum outage performances are depicted on different water conditions.

Publisher’s Note: MDPI stays neutral with regard to jurisdictional claims in published maps and institutional affiliations. |
© 2022 by the authors. Licensee MDPI, Basel, Switzerland. This article is an open access article distributed under the terms and conditions of the Creative Commons Attribution (CC BY) license (https://creativecommons.org/licenses/by/4.0/).
Share and Cite
MDPI and ACS Style
Ali, M.F.; Ponnimbaduge Perera, T.D.; K. Jayakody, D.N. O2O: An Underwater VLC Approach in Baltic and North Sea. Electronics 2022, 11, 321. https://0-doi-org.brum.beds.ac.uk/10.3390/electronics11030321
AMA Style
Ali MF, Ponnimbaduge Perera TD, K. Jayakody DN. O2O: An Underwater VLC Approach in Baltic and North Sea. Electronics. 2022; 11(3):321. https://0-doi-org.brum.beds.ac.uk/10.3390/electronics11030321
Chicago/Turabian StyleAli, Mohammad Furqan, Tharindu Dilshan Ponnimbaduge Perera, and Dushantha Nalin K. Jayakody. 2022. "O2O: An Underwater VLC Approach in Baltic and North Sea" Electronics 11, no. 3: 321. https://0-doi-org.brum.beds.ac.uk/10.3390/electronics11030321
Note that from the first issue of 2016, this journal uses article numbers instead of page numbers. See further details here.