Article

Robust 24 Hours ahead Forecast in a Microgrid: A Real Case Study

by
Alfredo Nespoli
1,*,†,
Marco Mussetta
1,†,
Emanuele Ogliari
1,†,
Sonia Leva
1,†,
Luis Fernández-Ramírez
2 and
Pablo García-Triviño
2
1
Department of Energy, Politecnico di Milano, 20156 Milano, Italy
2
Department of Electrical Engineering, Higher Polytechnic School of Algeciras, University of Cadiz, 11202 Algeciras (Cádiz), Spain
*
Author to whom correspondence should be addressed.
These authors contributed equally to this work.
Submission received: 24 October 2019 / Revised: 18 November 2019 / Accepted: 20 November 2019 / Published: 1 December 2019
(This article belongs to the Special Issue Emerging Technologies for Photovoltaic Solar Energy)

Abstract

:
Forecasting the power production from renewable energy sources (RESs) has become fundamental in microgrid applications to optimize scheduling and dispatching of the available assets. In this article, a methodology to provide the 24 h ahead Photovoltaic (PV) power forecast based on a Physical Hybrid Artificial Neural Network (PHANN) for microgrids is presented. The goal of this paper is to provide a robust methodology to forecast 24 h in advance the PV power production in a microgrid, addressing the specific criticalities of this environment. The proposed approach has to validate measured data properly, through an effective algorithm and further refine the power forecast when newer data are available. The procedure is fully implemented in a facility of the Multi-Good Microgrid Laboratory (MG L a b 2 ) of the Politecnico di Milano, Milan, Italy, where new Energy Management Systems (EMSs) are studied. Reported results validate the proposed approach as a robust and accurate procedure for microgrid applications.

1. Introduction

The power uncertainty exhibited by many Renewable Energy Sources (RES) as PV and wind represents a huge challenge for the stability, security, and reliability of integrated electricity systems [1]. PV power fluctuations depend on two factors: the first one is deterministic due to Earth’s revolution around the Sun, while the second is stochastic and depends on atmospheric conditions as cloud cover, dust, pollution, or local shadows on PV modules [2]. In this frame, forecasting power production from RES can greatly help the management and the operation of modern energy systems as, for example, microgrids.
Solar forecasting methodologies are mainly classified into three categories [3]: physical, statistical, and hybrid methods. As for physical methods, data such as temperature, pressure, humidity, and cloud cover are used as the input of a model describing the behavior of the component, through analytical equations. Statistical methods, on the other hand, require historical data of solar irradiance and power production to infer trends. They are further divided into two categories: Artificial Intelligence (AI) based and regression methods [4,5]. Seasonality analysis, Auto Regressive Integrated Moving Average (ARIMA), multiple regressions, and exponential smoothing are examples of the latter [6], while AI paradigms include fuzzy inference systems, genetic algorithm, Artificial Neural Networks (ANNs), etc. Finally, hybrid methods are a combination of two or more forecasting techniques [7]. The idea behind hybrid models is to overcome the deficiencies of the individual models while emphasizing their strengths.
Many approaches and methods have been developed to predict the power injection in the grid by a PV plant with reference to the day ahead, the 24 h ahead, and some hours ahead [8]. Short term PV power prediction based on weather forecast can be obtained by means of simple rule based or fuzzy logic algorithms: for instance, in [9], a fuzzy logic model was presented for short term PV forecasting using the measured solar irradiance data; in [10], a model employing fuzzy logic was proposed to forecast global solar energy using the dew-point as the main variable among many other meteorological parameters for different sky-conditions. In [11], a hybrid forecasting algorithm was proposed, based on ANN and fuzzy logic pre-processing, in order to increase forecast accuracy. In particular, the robustness of the ANN approach for day ahead PV forecasting was also assessed in [12]. In [13], a hybrid ANN model for the PV power forecasting exploiting clear-sky models and ANN ensembles, based on day ahead weather forecast, was validated on a real PV plant as a robust and accurate procedure.
The accuracy of the prediction is currently very good, and the error is quite similar to the one of weather prediction [14]. Moreover, as already mentioned and demonstrated in [15], a machine learning technique is natively able to update with time, after an updated training on recently measured data.
Among the aforementioned methods, it was proven that ANN based hybrid methods provide the best solution in terms of the accuracy of prediction [16]. The main drawbacks deriving from the implementation of those techniques is the need for accurate historical measurements, which have to be previously analyzed and validated to be used in the forecasting process.
Load and RES forecasting in microgrids opens new challenges [17,18]. Microgrids, which can be independent systems or connected to the main grid, consist of a mix of generation (PV, wind, and traditional, controllable and uncontrollable), loads, different Energy Storage Systems (ESSs) such as batteries, fuel cells, flow cells, thermal storage, etc.
Advanced cost effective microgrid design and an optimal dispatch strategy have to be developed to reduce the dependence on costly and polluting traditional sources, to increase the use of RESs and reduce the needs of large storage systems and conventional backup generation, but at the same time to guarantee adequate electricity reliability and power quality [19]. A key issue in the identification of the optimal dispatch strategy provided by a central Energy Management System (EMS) [20] is the RES forecasting.
In addition to the aforementioned drawbacks, new problems arise in forecasting the PV power production in microgrid applications. Firstly, data processing and validation are extremely critical due to the need for working in a Reduction Power Point (RPP) during several hours of the day to follow the load profile properly. Secondly, when dealing with microgrid management, in order to guarantee the continuity of the service and plan and manage backup systems properly, long term forecasts are required (seven days ahead), which should be further refined when newer data are available, usually every day. Finally, as the EMS optimization process is computationally intensive, PV power prediction algorithms should be as effective as possible while not time consuming.
The goal of this paper is to provide a robust methodology to forecast 24 h in advance the PV power production in a microgrid environment. The issues related to the validation and management of real data through a fast and effective algorithm are addressed. Moreover, particular attention is paid to working conditions such as the microgrid operating state, the PV inverters’ working status, and the RPP tracking algorithm. The output of the forecasting procedure is then provided to the EMS to schedule the available assets optimally. This process was tested in a real microgrid showing good results in terms of availability and the continuity of the operation.

2. Microgrid 24 h ahead Forecast

In a microgrid, it is extremely important to have a reliable forecast of the available power sources and to schedule the programmed mix of power sources effectively in order to supply the expected energy demand. This process should be iteratively performed with different time horizons in order to ensure the maximum continuity of the operation. In this context, the 24 h ahead forecast is a key process. In order to accomplish the aforementioned task, several steps should be followed. The methodology applied here is fully summarized in the logic scheme of Figure 1, showing in a circular way different sub-tasks of the forecasting process at two times (i.e., Day i and Day i + 1 ). The process is divided into blocks, and each block accomplishes a specific task, while there is not a direct correspondence between a block and a physical component in the microgrid. In other words, there are no single components absolving the different tasks represented here.
The whole procedure is mainly divided into two different parts according to the tasks that are performed on consecutive days. On Day i:
(A)
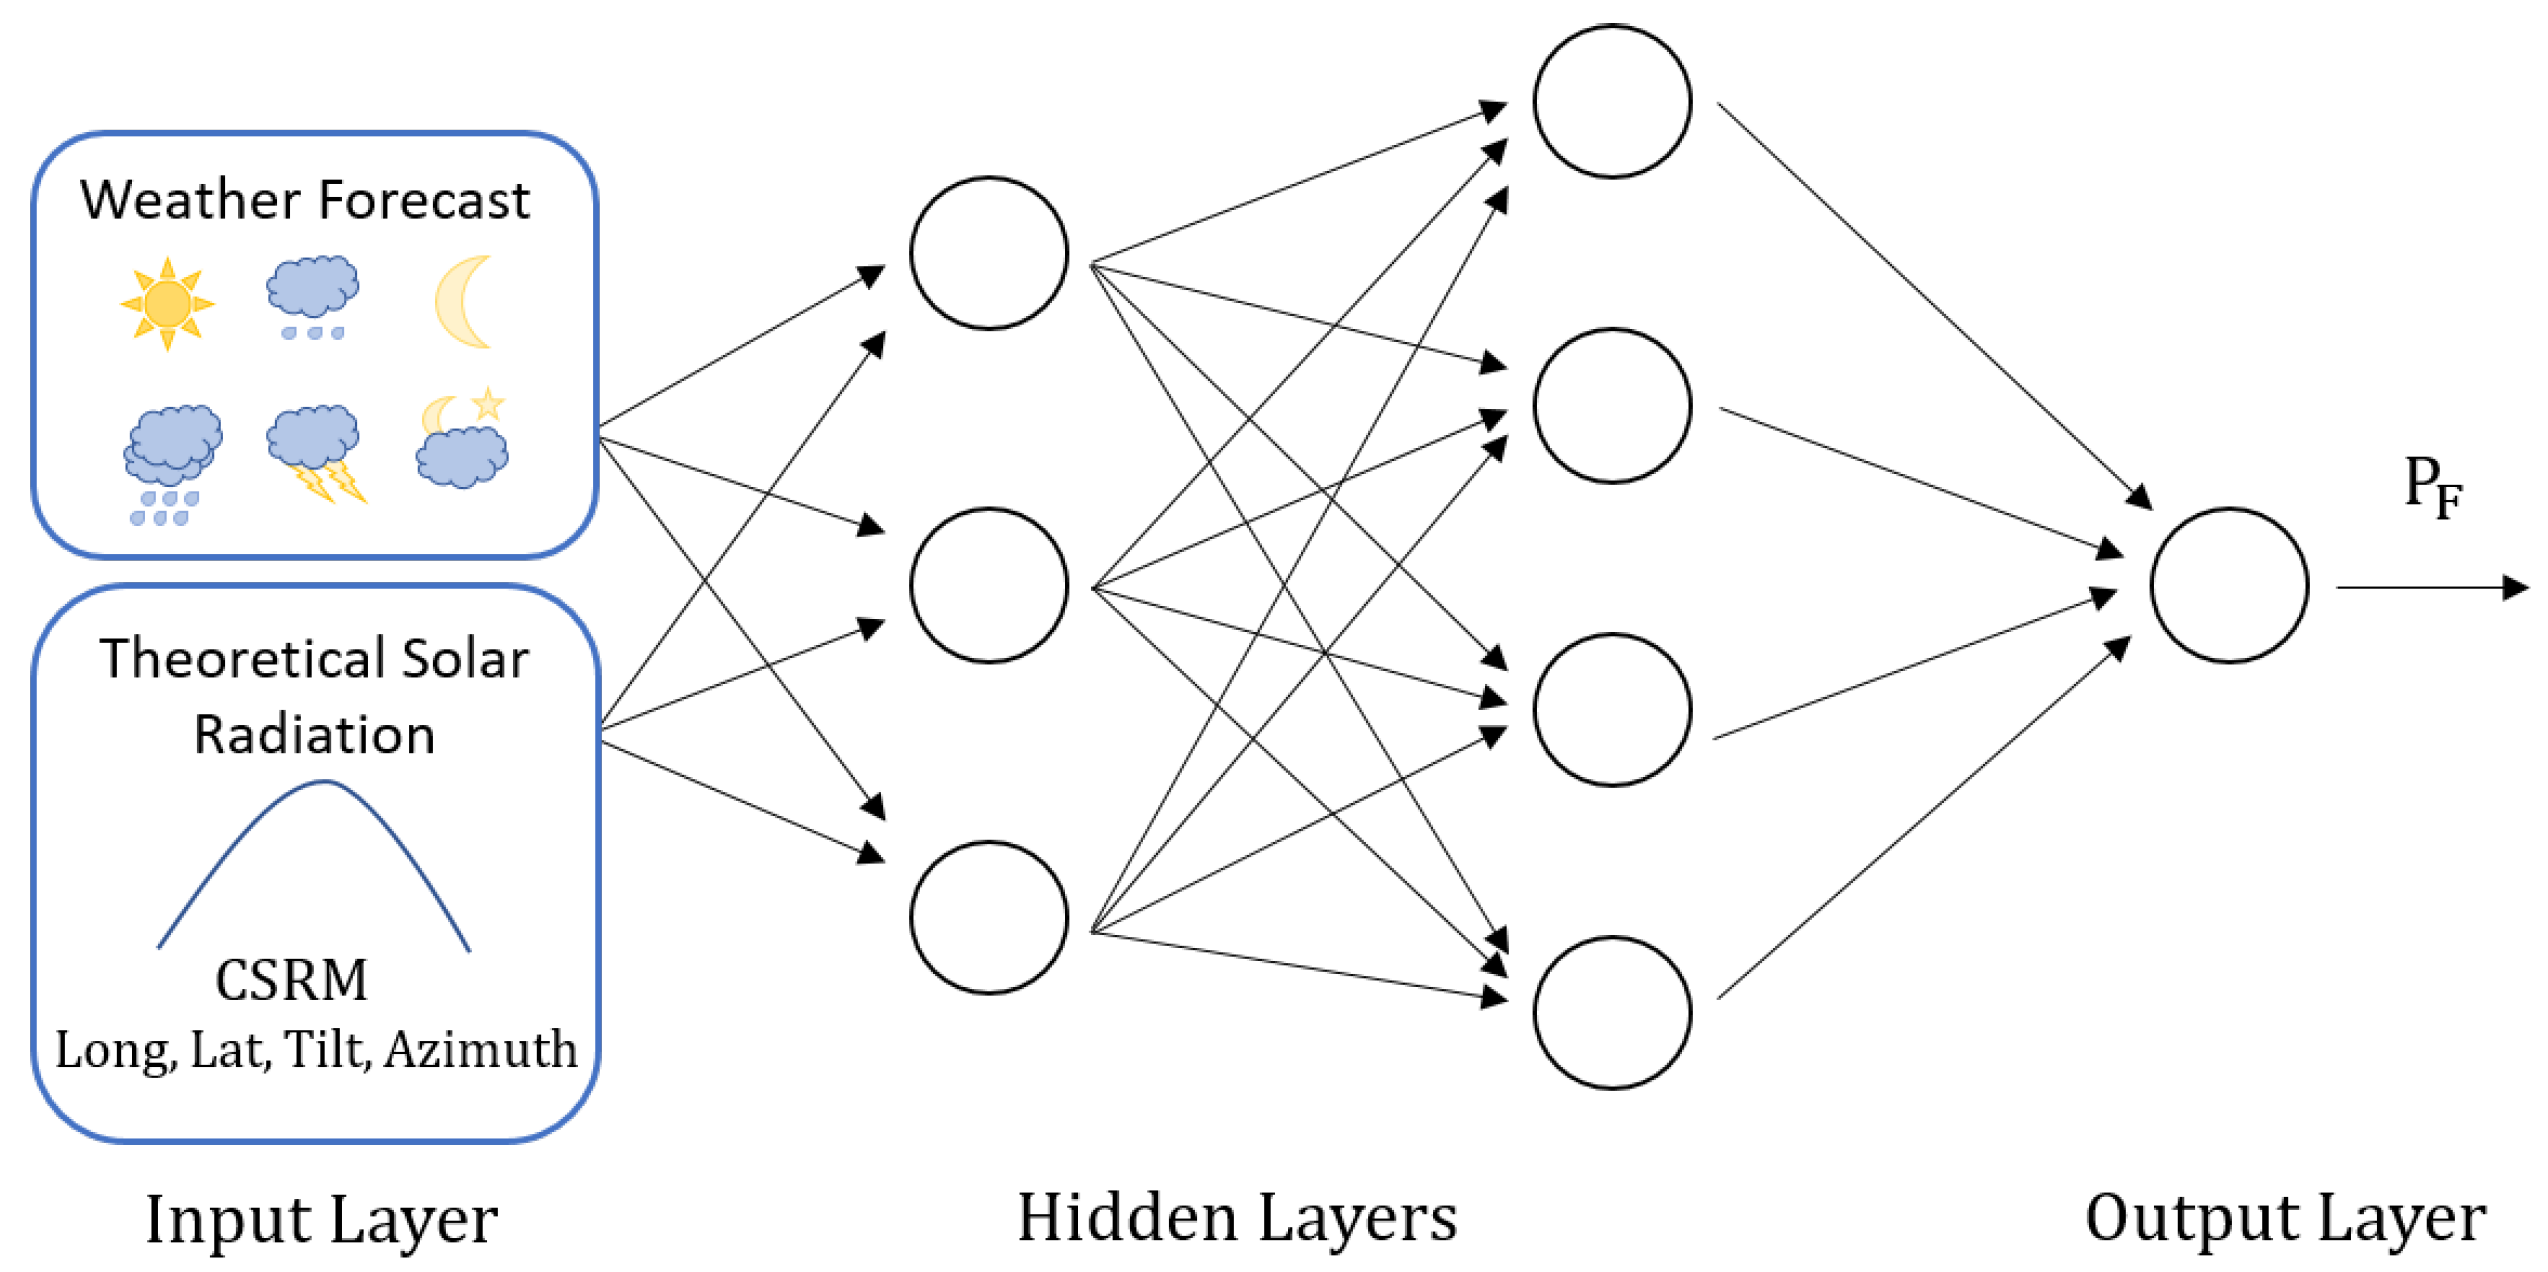
weather forecasts and Clear Sky Radiation Model (CSRM) for the next 24 h acquisition;
(B)
forecasting engine output and data post-processing.
Instead, on Day i + 1 , the following tasks should be performed:
(C)
microgrid data validation;
(D)
daily performance metrics’ calculation and historical dataset update.

2.1. Weather Forecasts and CSRM for the Next 24 h Acquisition

Among the required parameters in order to run the algorithm, which was previously described in [21] and improved in this work, the weather forecasts for the next 24 h should be acquired. For redundancy reasons, in order to guarantee the continuity of operation, it is better to acquire the weather forecasts for several days, avoiding a future transmission fault that could occur. In the present work, the weather hourly forecasts for the next seven days were collected. The following day, if available, newer data would overwrite the oldest.
A complete list of the weather parameters collected every day at 23:00 is given here:
  • T ( C): ambient temperature;
  • GHI (W/m 2 ): Global Horizontal Irradiation;
  • G P O A (W/m 2 ): irradiation on the plane of the array;
  • Ws (m/s): Wind speed;
  • Wd ( ): Wind direction;
  • P (hPa): ambient Pressure;
  • Prec (mm): rainfall;
  • C C (%): percentage of Cloud cover;
  • C T : Cloud type (low, mid, high).
The importance of providing the CSRM when forecasting the PV power production through AI algorithms was proven in [22]. In this work, the model fully described in [23] and the cited papers was implemented.

2.2. Forecasting Engine Output and Data Post-Processing

The methodology applied, based on a Physical Hybrid Artificial Neural Network (PHANN), was introduced and refined in works such as [24,25]. Its basic scheme is shown in Figure 2. The developed forecasting engine consisted of an ANN, which was trained with the historical weather forecasts collected, coupled with the solar radiation under clear-sky condition (CSRM), and an accurate output of the hourly profile expected by the PV plant was generated for the next seven days. After the output was generated, data had to be validated by a post-processing step consisting of checking the reliability of the output. Thus, meaningless values (i.e., negative or positive) of the output power by night should be made equal to zero.
The day after (i.e., Day i + 1 in the scheme of Figure 1), the actual measurements were recorded, allowing performing the following tasks.

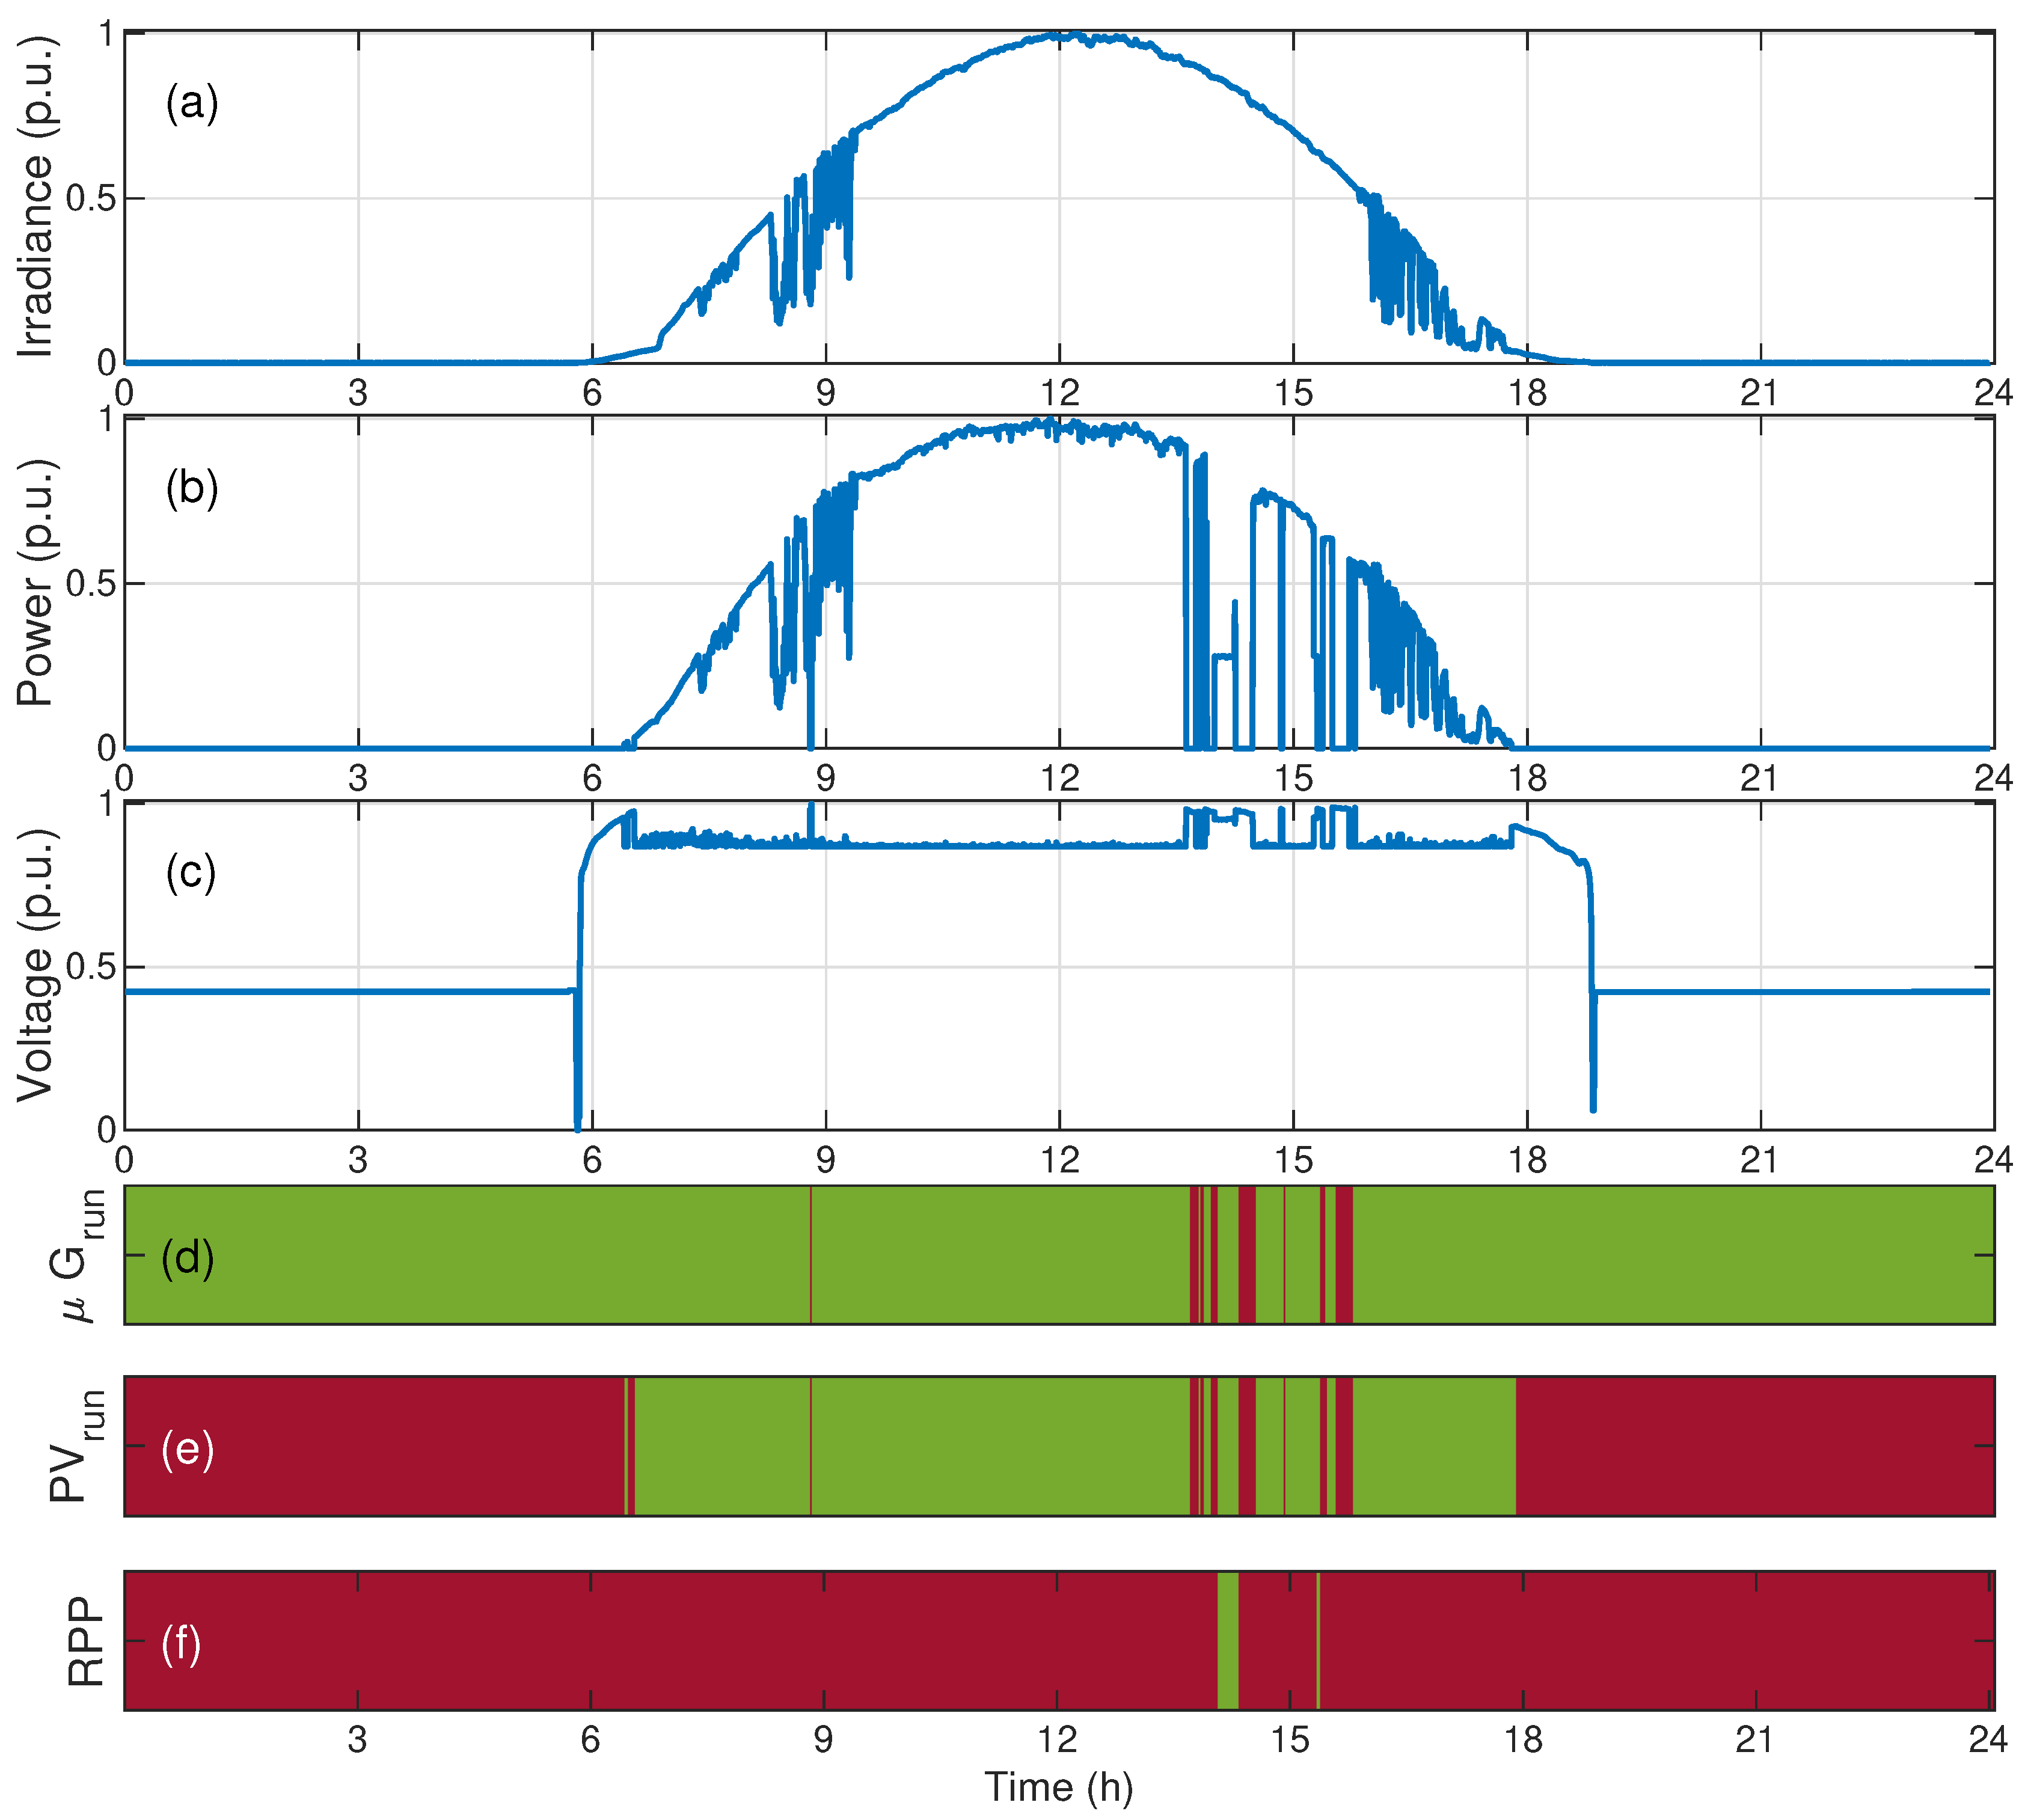
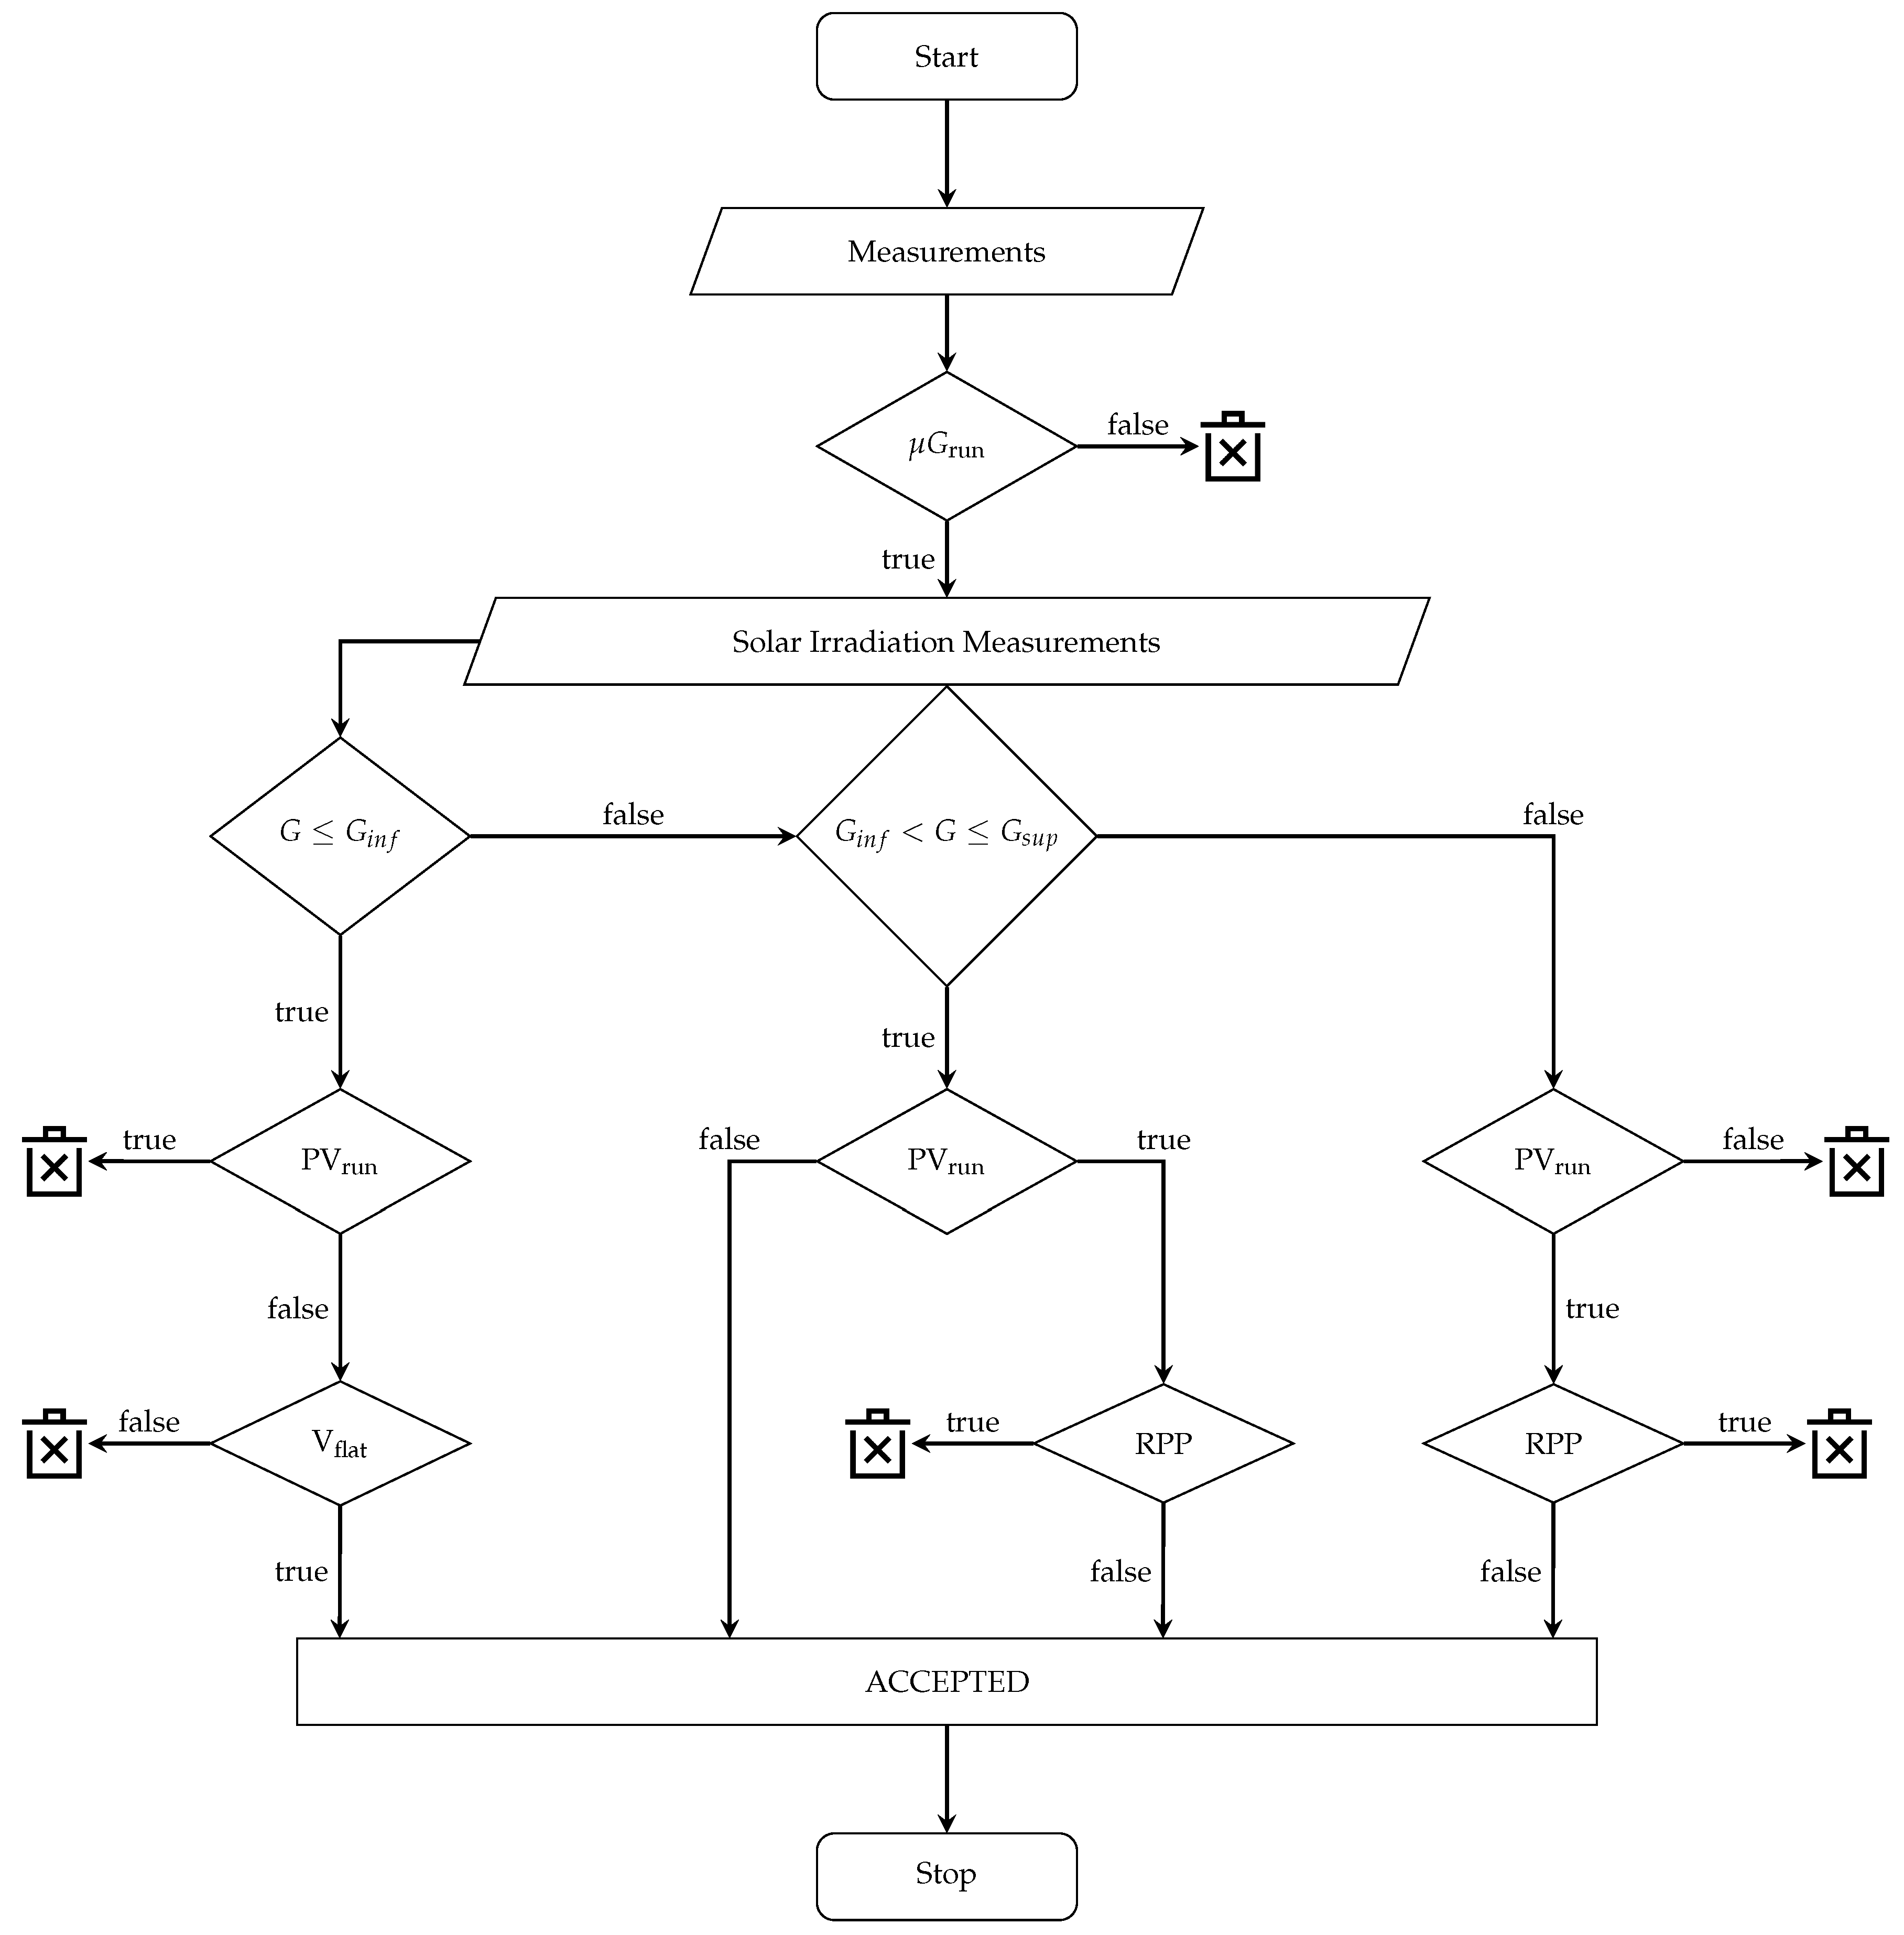
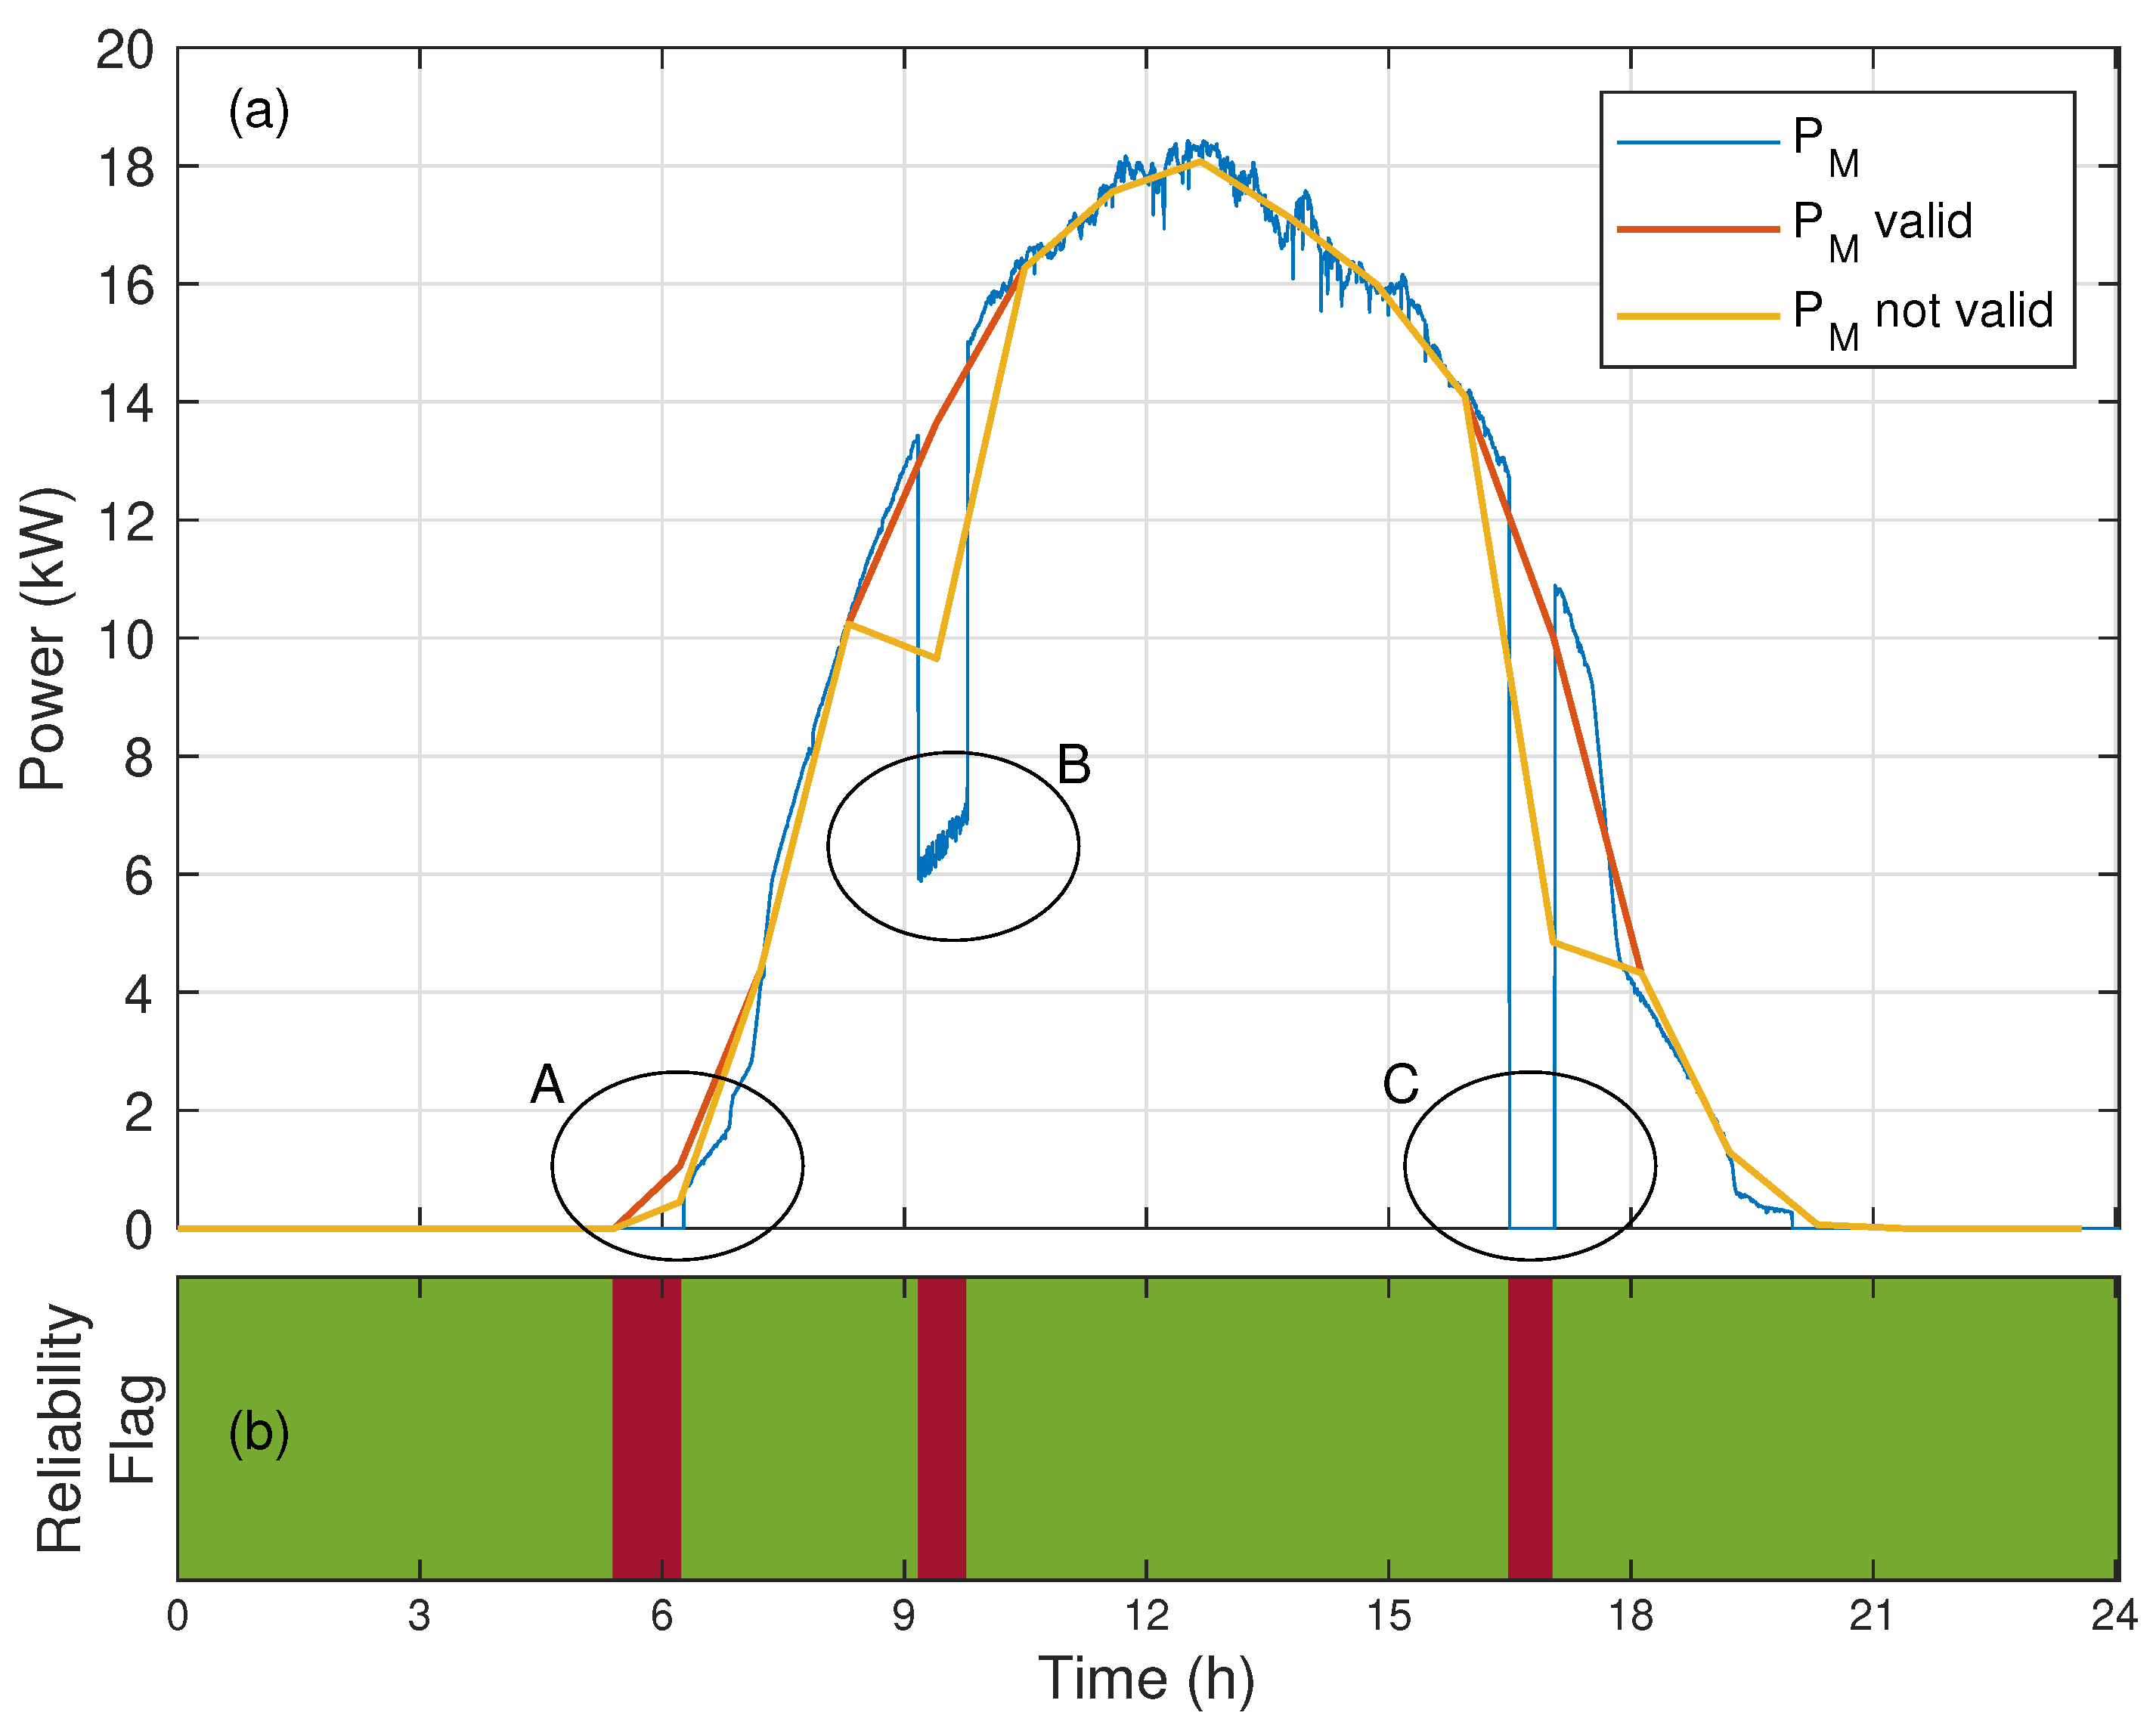
2.3. Microgrid Data Validation

The raw data had to be validated since their quality strongly affected the forecasting model output. One of the most critical aspects was to have an accurate and coherent dataset of historical measurements. In particular, the ANN needed to be trained with historical data, and their quality guaranteed a good learning capability, finally providing a stable and reliable output. Hence, data validation consisted of providing a criterion that should be enough strict in order to select the amount of data to be included in the training process and sufficiently relaxed in order not to lose valuable information according to the expected accuracy in the desired task.
When PV systems are integrated with microgrids, some peculiarities are observed. In fact, during some periods of the day, there is no need to produce as much power as is available; therefore, a cut-off of the generated power is needed, and the PV system is working in the so-called Reduction Power Point (RPP).
It is easy to understand that PV power output records relevant to those RPP periods cannot be included in the training dataset, as the ANN task is to forecast the PV power output corresponding to the expected weather conditions, discarding the overall power control. The RPP recorded data are not useful for this task and should be properly identified and excluded from the training process. For this reason, during the RPP periods, as many inverters as possible should work in Maximum Power Point Tracking (MPPT) in order to collect useful data for the training. Otherwise, the validation criterion would exclude many useful data.
Moreover, in order to infer the sub-PV fields’ peculiarities, an in-rotation RPP working logic among different inverters is preferred. In this way, the power forecast algorithm can be properly trained and run for each inverter with its specific dataset of historical measurements, keeping updated their peculiarities such as partial shadings, aging, and pollution. Besides, when PV systems are introduced in broader systems as microgrids, electrical variables are not able to tell the full story of the working status of the PV. For example, Figure 3 depicts the 20 s records in p.u. of solar radiation measured, DC power, voltage, operating state, and RPP in a single PV converter. It can be observed that the DC power production of the PV system followed a peculiar trend, which was not consistent with the recorded solar radiation, being equal to zero for several minutes in the afternoon. For this reason, the PV inverter working status (PV run ), the RPP, and the microgrid operating status ( μ G run ) were key parameters to be used in the validation.
For this reason, a new validation procedure to analyze and filter the recorded measurements from the microgrid properly was developed and is summarized in the flowchart of Figure 4. The flowchart is fully described below. Firstly, to ensure that the measurements were properly recorded and stored, the microgrid had to be working ( μ G run = true). Different control strategies were considered depending on the irradiation level. In order to switch on the PV inverter, it was required that a certain amount of power was produced by the PV, at least enough to cover its self-consumption. If this circumstance was not met, the inverter did not start, and the condition was tested after a predefined amount of time. Through irradiation measurements, it was possible to distinguish easily among night and daily hours and finally sunrise and sunset, when the previous procedure was expected to take place. The minimum amount of irradiance needed to run the system can be computed as follows:
G T = P T A · η
where P T is the minimum amount of power required to make the inverter work, A is the overall surface of the PV string, and η is the nominal module efficiency.
Since the obtained value for G T was just a rough estimation and the power condition was tested intermittently, a punctual value was not useful. Through a sensitivity analysis carried out on the available data, it was then possible to define three intervals as follows:
  • night: G 0.9 · G T = G i n f ;
  • sunrise and sunset: G i n f < G < 1.1 · G T = G s u p ;
  • day: G G s u p .
If the irradiation G is lower than G i n f , to be considered reliable, the inverter should be switched off (PV run = false) and the voltage profile should be flat (V flat = true).
When the irradiation is between G i n f and G s u p , the inverter is likely to be performing the aforementioned switching on procedure. For this reason, all the PV inverter statuses (PV run = true or no), but the RPP (RPP = false), are considered reliable.
Finally, if the irradiation is greater than G s u p , only those samples in which the inverter is working in the Maximum Power Point (MPP) (PV run = true and RPP = false) are kept.
All the accepted samples are used in the composition of the power produced on an hourly basis and later used for the PHANN training dataset, if two further controls are satisfied.
Once the measurements were filtered, a minimum number of samples had to be disposable to consider the average power produced representative of the hour. Following a sensitivity analysis, two thirds of the theoretically available measurements were needed. As previously stated, ANNs learn to infer trends from historical data. If the training dataset is composed of too many hourly samples with power equal to zero, there might be the possibility that the forecasts tend to underestimate the power production. For this reason, it is important to have approximately the same number of daily and night hourly samples.

2.4. Daily Performance Metrics’ Calculation and Historical Dataset Update

The power forecast computed on Day i had to be evaluated in view of the acquired power measurements. To solve the scope, error metrics were needed. The indicators applied here were fully described in [15], where a deep insight into the different features of those indicators was provided.
Finally, the last task to be performed on Day i + 1 consisted of updating the historical dataset used in the training and validation phase with the newest available data.

3. Case Study

In this section, the above mentioned procedure to provide the power forecast for the next 24 h is shown through a real case study. The test facility was located at Politecnico di Milano, Milan, Italy.

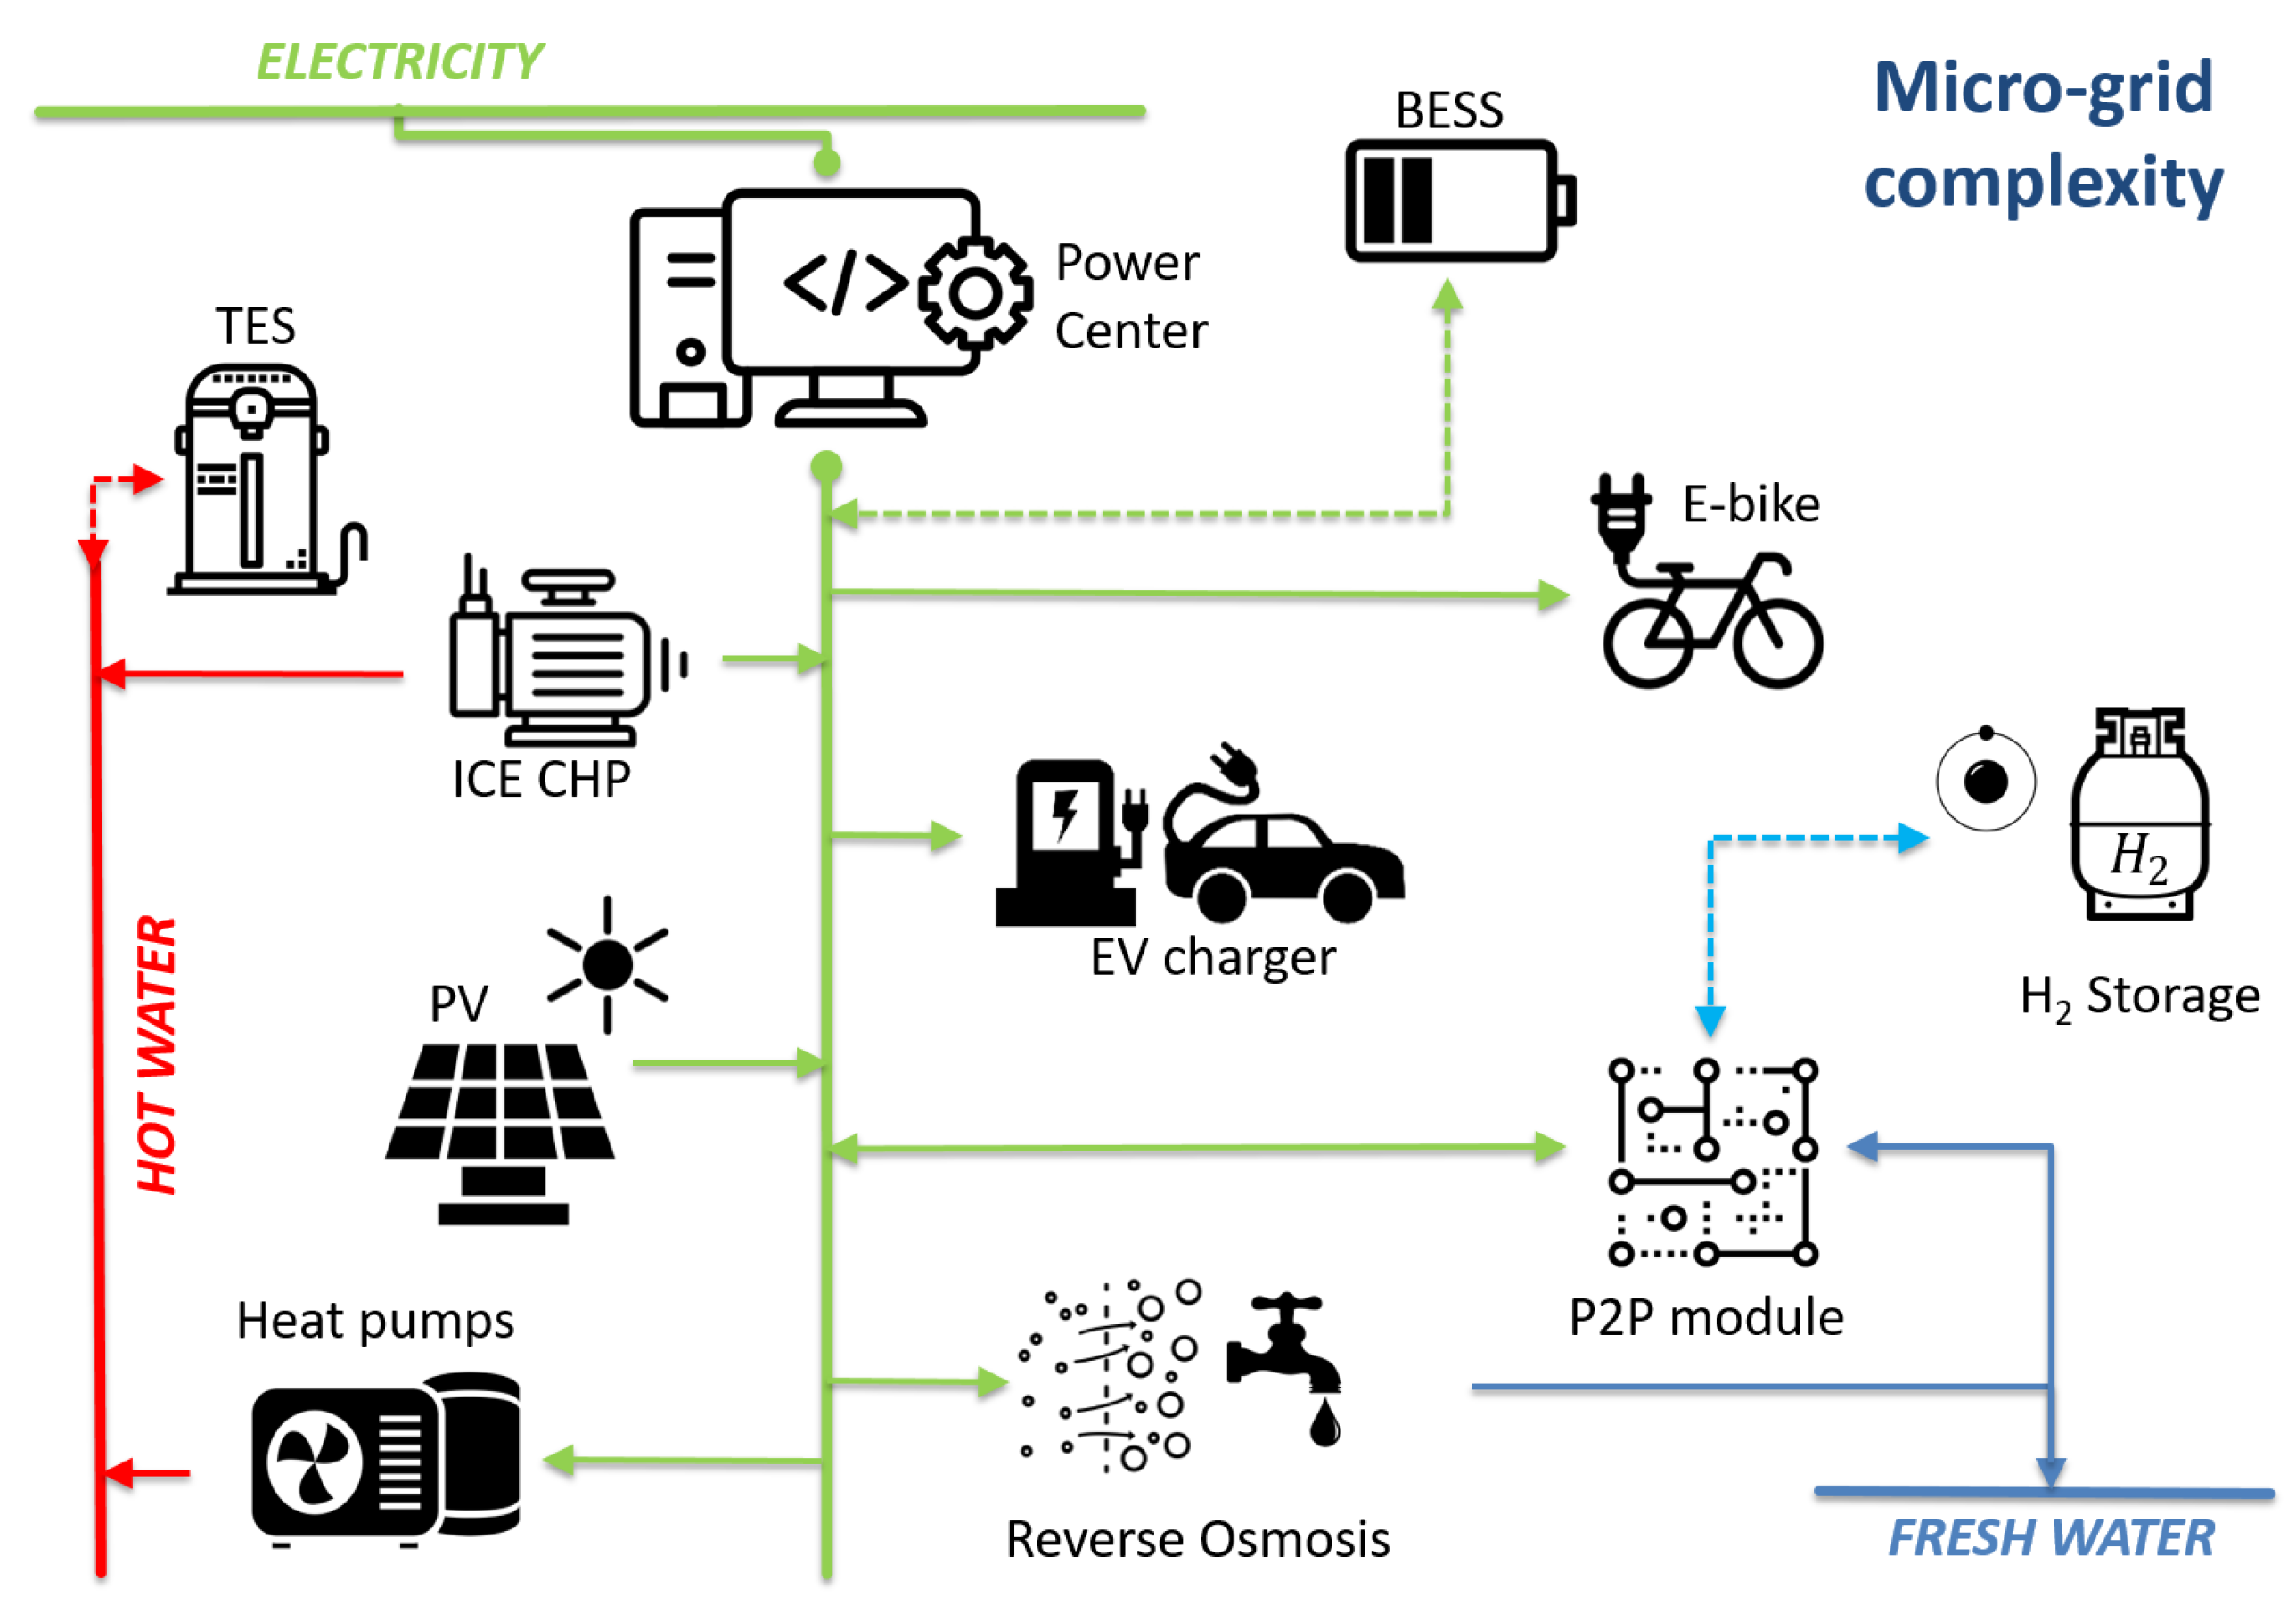
3.1. Microgrid Description

The Multi-Good MicroGrid laboratory (MG L a b 2 ) setup available in the Department of Energy, Politecnico di Milano, is a cutting edge microgrid integrating different distributed energy resources like solar, Combined Heat and Power (CHP), battery, and hydrogen storage and serving both electric and thermal load to power lighting, heating, desalination, electric vehicles, and electric bikes, as shown in Figure 5.
This microgrid facility is multi-good and multi-fluid, as shown in Table 1. It features the ability to be operated both in on-grid and off-grid modes. Additionally, it is flexible with multiple configurations (single/multi-node), including an AI implementation for optimal management.
The experimental microgrid facility interconnects the following systems and sub-systems:
  • three Power Centers (PCs), acting as the electricity hub;
  • dispatchable and non-dispatchable units for Heat, Power and Combined Heat and Power (CHP) generation:
    three PV fields of 24, 25, and 26 kW, respectively;
    a natural gas micro-CHP system (TOTEM) (electric power 25 kW, thermal power 25 kW);
  • three different storage systems:
    a thermal energy storage (TES) system (50 kWh)
    two lithium ion Battery Energy Storage Systems (BESS), 70 kWh each;
    a hydrogen Hybrid Energy Storage System (HyESS), 30 kWh storage coupled to a power-to-power system alkaline electrolyzer (25 kW) Proton-Exchange Membrane (PEM) fuel cell (25 kW);
  • several loads:
    an electric grid simulator, which acts as the virtual electricity user, as well as (if needed) a connection point with the electric grid: 100 kW;
    programmable electric loads, namely two heat pumps that are smart-grid ready (2 × 6 kW), a potable water producer (6 kW), and lights (5 kW);
    charging stations: two fast charging stations for electric vehicles (2 × 50 kW) and one for 10 electric bikes: (10 × 250 W).
The non-dispatchable units (PV modules) are located on the building roofs of the Department of Energy, Politecnico di Milano. In particular, this experimental microgrid is organized into three different Power Centers (PCs), each connected to the others, which work together. The main Power Center PC1 is composed by the PV systems, a storage system, a master controller, and the electric vehicle plugs. The two PV fields are composed by six strings of 13 modules each (the first), for a total of 78 modules, and by six strings of 12 modules each (the second), for a total of 72 modules. Three PV inverters are used for DC/AC conversion. A junction box can monitor the current of each string and the environmental and the PV modules’ temperatures.

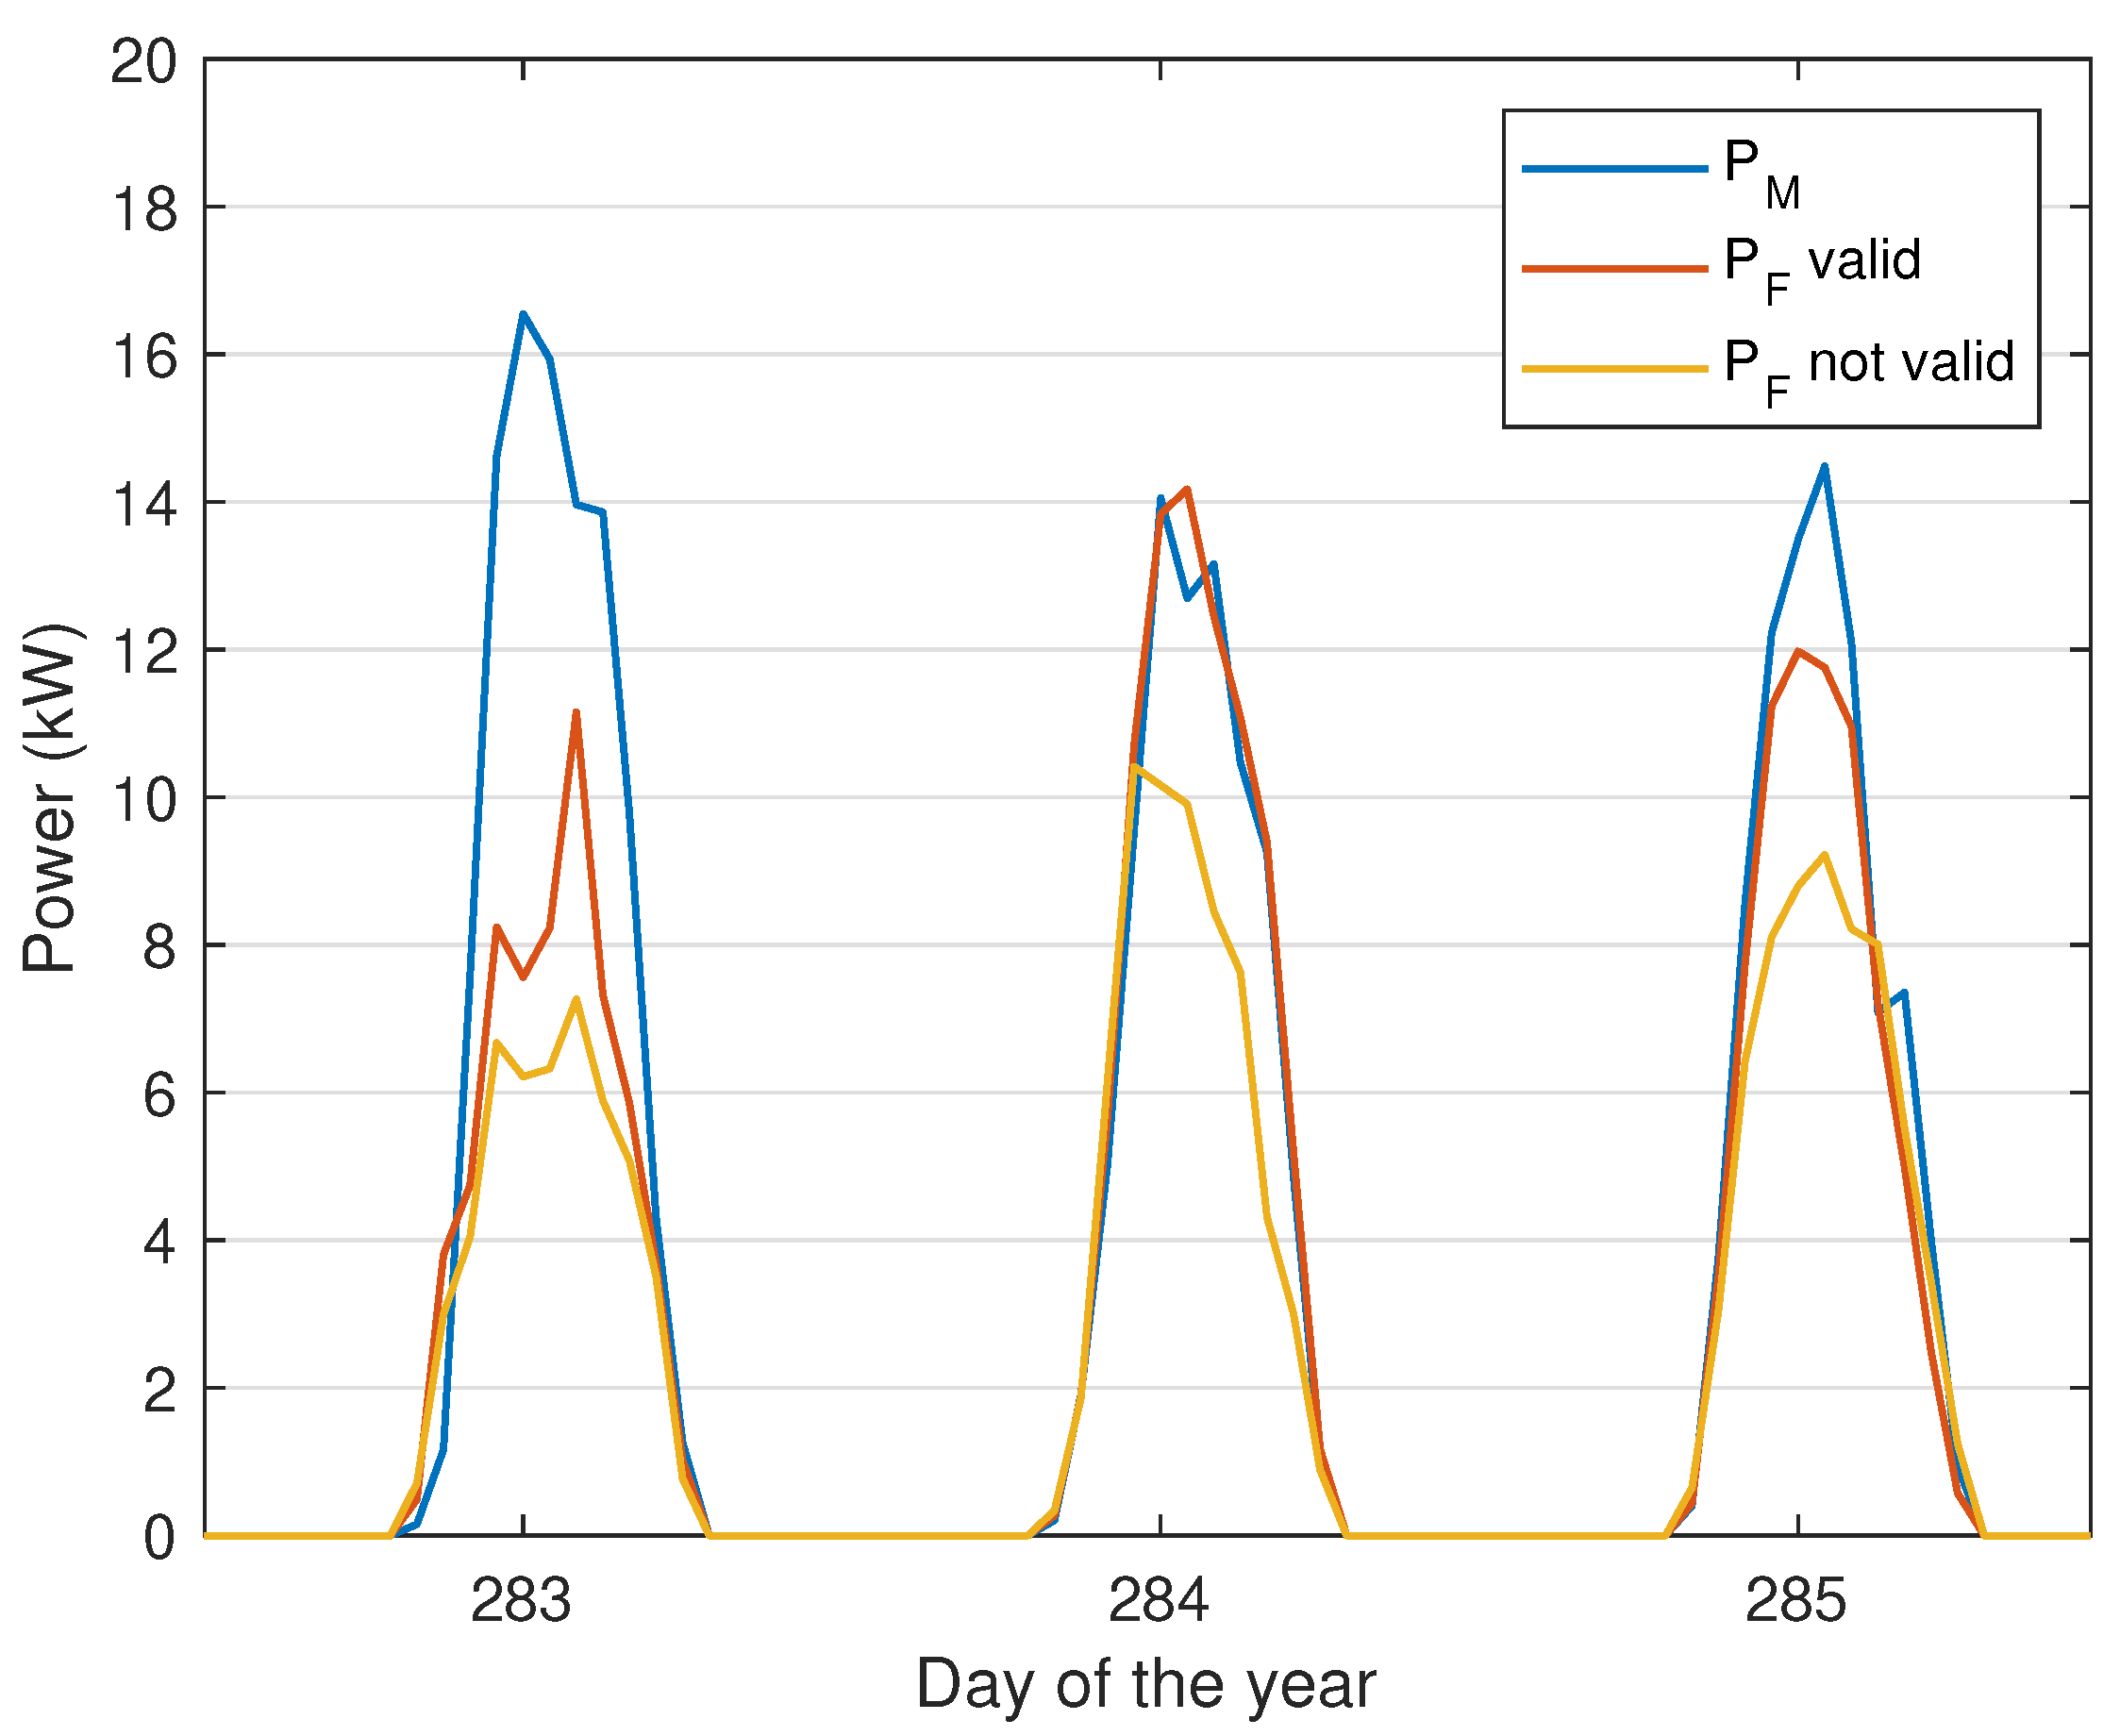
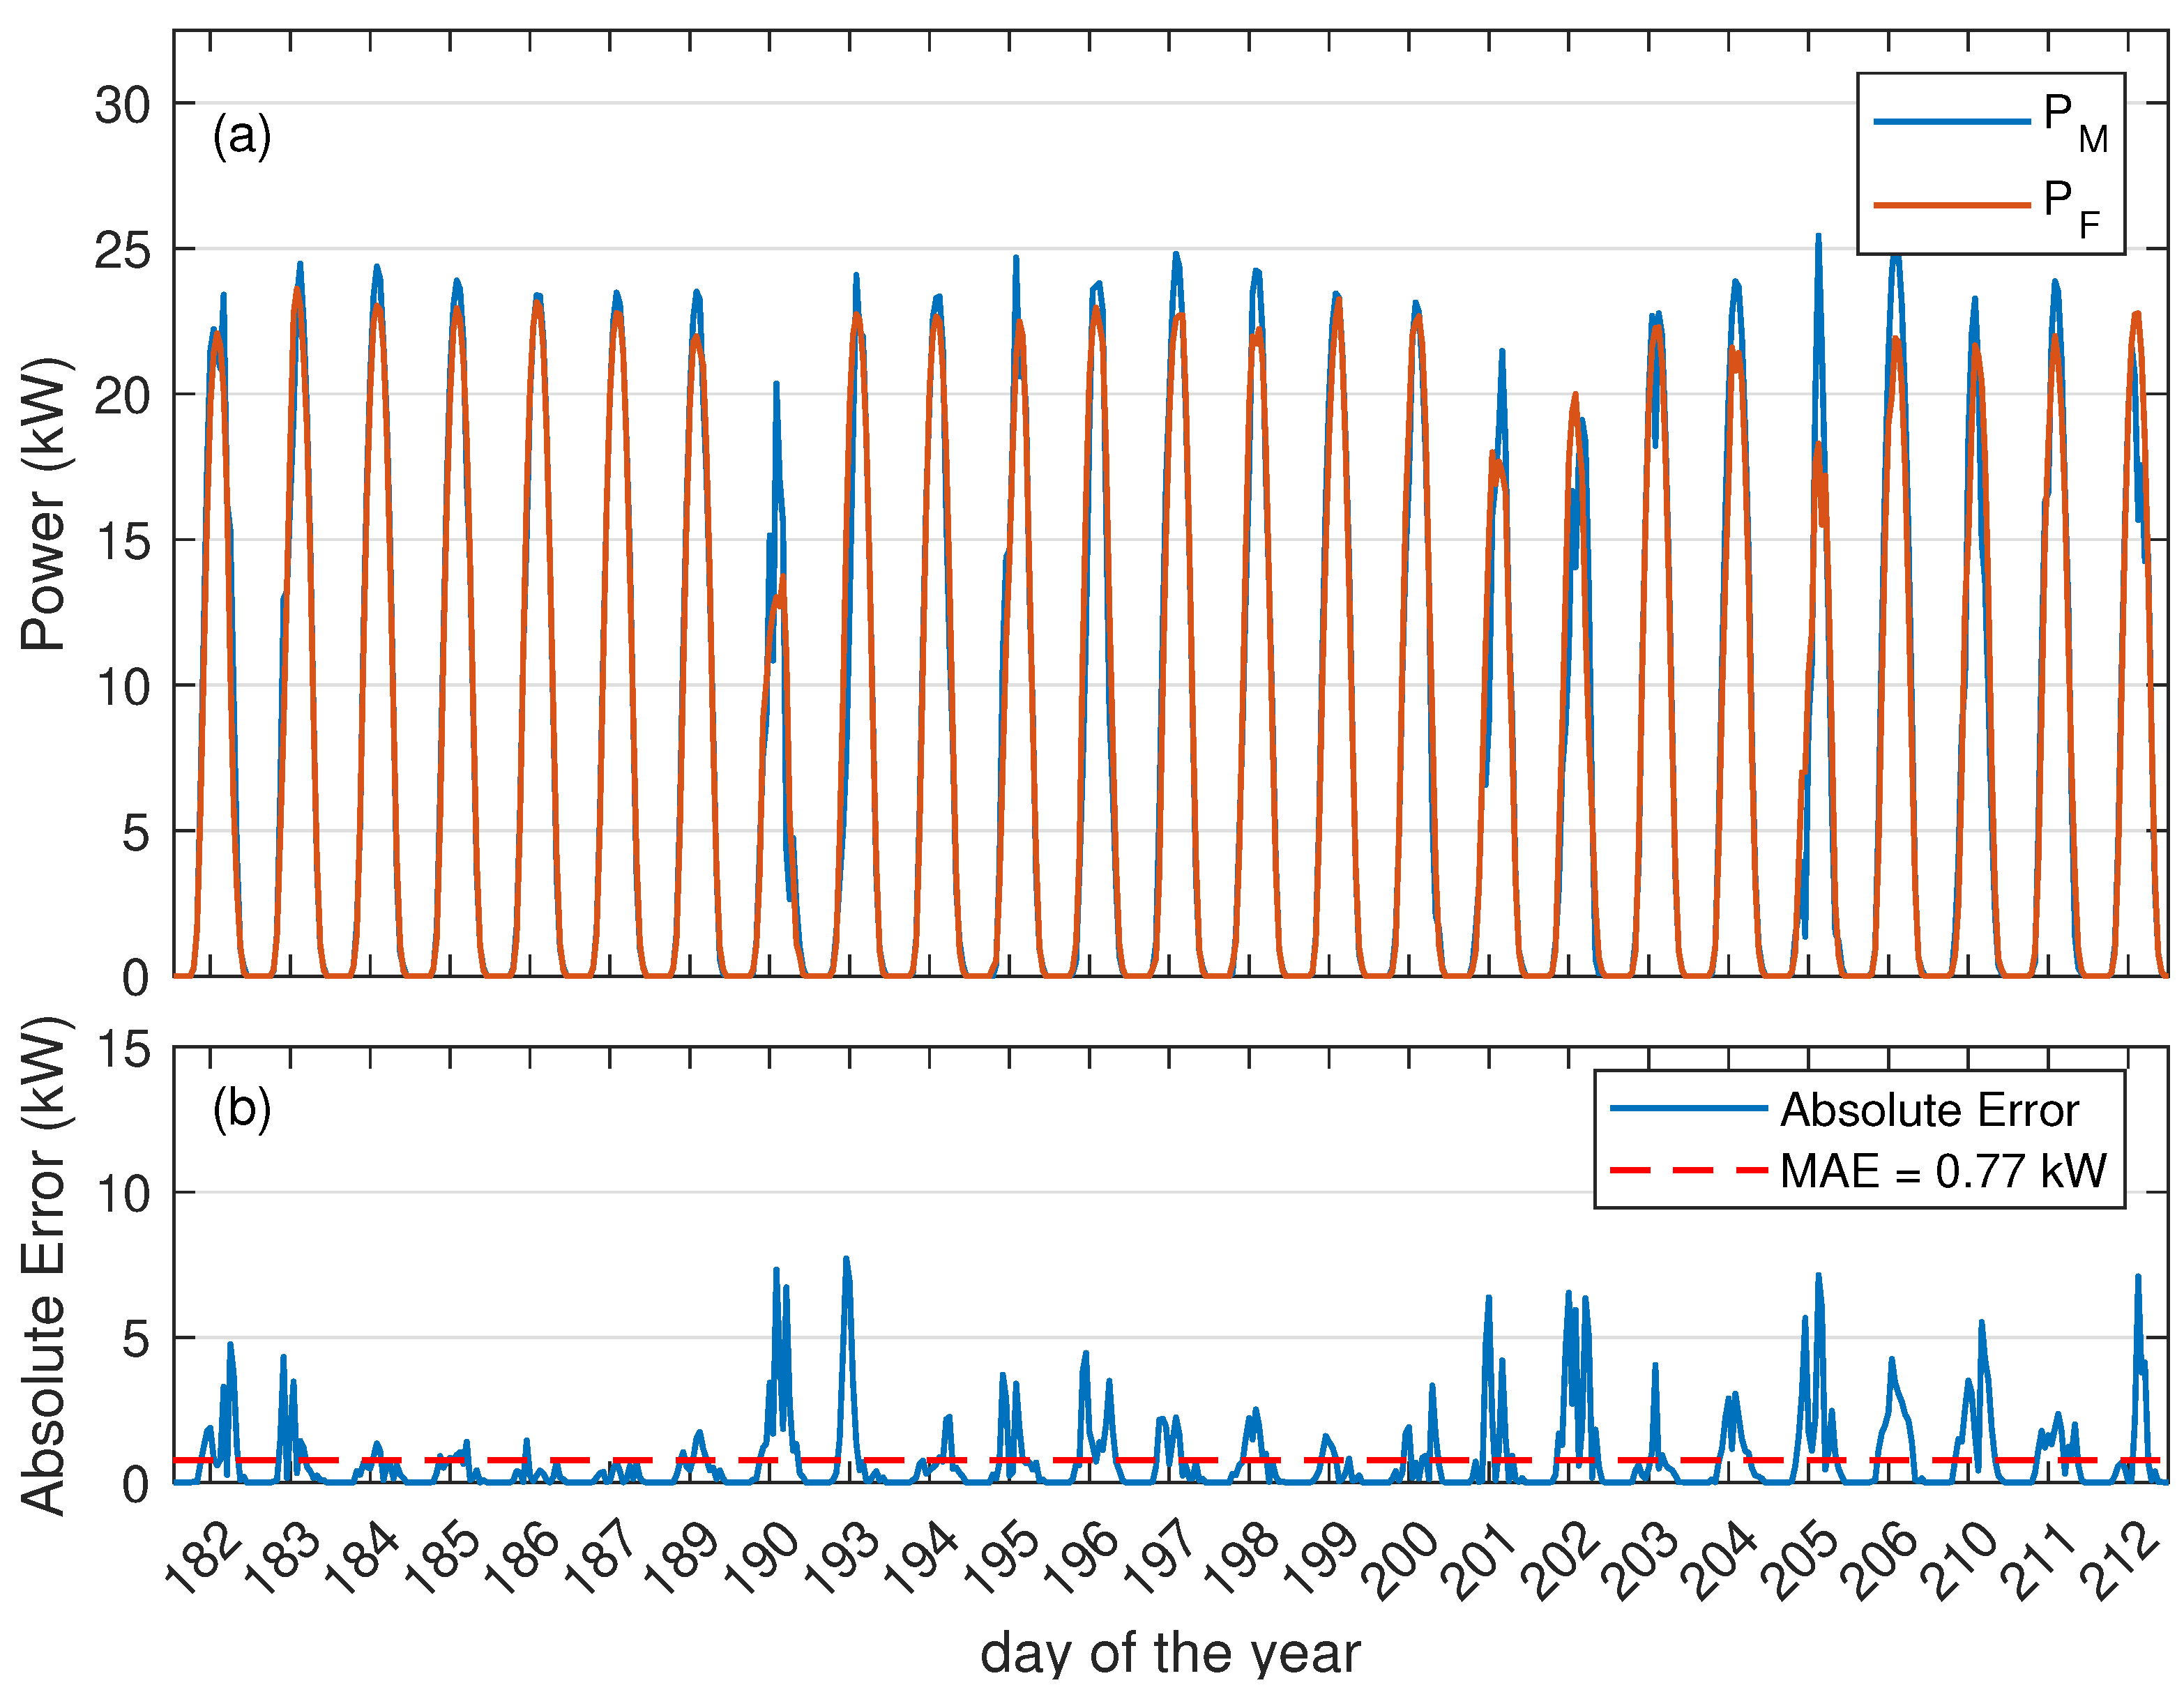
3.2. Application and Discussion

The automatic procedure described was performed iteratively every day at 23:00. The forecast power values were then provided to the EMS with the goal of scheduling the optimal MG operation plan of all the controlled assets. The optimal management strategy could then be evaluated by means of different indicators such as economic, technical, and environmental.
In Figure 6, the effects of the controls described in Section 2.3 are shown on the data collected from one PV field of the microgrid. Figure 6a presents in blue the power measured every 20 s for the whole day (P M ), while the hourly power averages computed validating the available data according to the proposed methodology (P F valid) or not (P F not valid) are shown in orange and yellow, respectively. On the other hand, Figure 6b, as with the previous, shows a flag stating whether the measured samples should be considered reliable or not, based on previous considerations (accepted samples in the flowchart). Three different critical situations are shown. The first one (A) occurred in the morning due to the inverters’ failures during the switching on procedure and resulted in power recordings equal to zero. The second one (B) represented an example of power production under RPP conditions, following the microgrid load demand. Finally, the third (C) was due to a disconnection of the PV from the grid. As can be seen from the yellow line, the consequent average was greatly affected by those occurrences, while the orange line was unaffected, following the actual power production (blue line), with great accuracy.
As previously stated, ANNs learn to infer trends from historical data. When the available data are not properly filtered, the ANN loses its ability to generalize trends. The averaged measured data were used in the composition of the dataset, which was later used in the training and validation of the PHANN.
Figure 7 shows the measured power and power forecasts for the microgrid. In particular, the blue line represents the measured power (P M ), while the orange and yellow lines show the power forecast provided by PHANN trained with validated (P F valid) and not validated (P F not valid) data, respectively.
As is clearly shown, the yellow line (P F not valid) greatly underestimated the power forecast in the central hours of the day, when the production peak was expected, but due to both RPP and faults, the power measurements were greatly affected. Quantitative information about the improvement derived from the implementation of the novel validation procedure is provided in Table 2, where the forecast error committed using the two datasets is reported for one month of forecasting. For example, the Enveloped-Mean Absolute Error (EMAE) was reduced from 35.12% to 24.57% with an overall improvement around 30%. Similar considerations can be drawn for every indicator reported in Table 2. Since for the recently proposed EMAE and OMAE [15], the availability of the results in the literature is limited, thus, for the sake of clarity, we chose to refer to indicators usually employed (NMAE, nRMSE, etc.), whose average values were generally better than those reported in the literature [14].
Since the EMS optimization algorithm was time consuming, the power forecast had to be performed in a short time. The average time required to compute all the described tasks was 46.6 s (when simulations were run on an Intel(R) i7-7700 CPU @3.60 GHz-64 GB).
Finally, in Figure 8, a representative output of the whole procedure is presented for July 2019. In Figure 8a, the measured power is depicted in blue (P M ) together with the power forecast computed by PHANN(P F ) in orange. Figure 8b shows in blue the Mean Absolute Error (MAE), while the red dashed line represents the average monthly MAE. Thanks to the novel validation procedure introduced in this work, the accuracy achieved for the power forecasts in the microgrid was very close to the grid connected application.

4. Conclusions

The scope of the paper was to provide a methodology aiming at computing the 24 h ahead PV power forecast specifically tailored for microgrid applications. A novel data validation procedure was developed to address the peculiarities such as the reduction power point functioning state and the service interruptions that may occur in microgrids’ operations. The proposed methodology was divided into sub-tasks that were singularly evaluated and discussed throughout the work. Moreover, the importance of filtering the available measurements to compose the historical dataset needed for the physical hybrid artificial neural network training was shown. The whole procedure was tested and discussed in detail through a real case study in the MG L a b 2 installed at the Department of Energy, Politecnico di Milano. The obtained results showed a great increase of the forecast performances thanks to the methodology exposed here. The error committed, evaluated in terms of NMAE, was reduced from 5.28% to 3.81% on a monthly basis.

Author Contributions

Conceptualization, A.N., M.M., E.O. and S.L.; methodology, A.N., M.M., E.O.; software, A.N., M.M., E.O.; validation, A.N.; formal analysis, A.N. and M.M.; investigation, A.N.; data curation, A.N.; original draft preparation, review and editing, A.N., M.M., E.O., S.L., L.F.-R. and P.G.-T.; supervision, S.L., L.F.-R. and P.G.-T. All of the authors approved the submitted manuscript. All the authors equally contributed to the writing of the paper.

Conflicts of Interest

The authors declare no conflict of interest.

References

  1. Boyle, G. Renewable Electricity and the Grid; Routledge: London, UK, 2007; pp. 143–150. ISBN 9781849772. [Google Scholar] [CrossRef]
  2. Antonanzas, J.; Osorio, N.; Escobar, R.; Urraca, R.; Martinez-de Pison, F.J.; Antonanzas-Torres, F. Review of photovoltaic power forecasting. Sol. Energy 2016, 136, 78–111. [Google Scholar] [CrossRef]
  3. Ulbricht, R.; Fischer, U.; Lehner, W.; Donker, H. First Steps Towards a Systematical Optimized Strategy for Solar Energy Supply Forecasting. In Proceedings of the ECML/PKDD 2013—1st International Workshop on Data Analytics for Renewable Energy Integration (DARE), Prague, Czech Republic, 23–27 September 2013; pp. 14–25. [Google Scholar]
  4. Li, J.; Ward, J.K.; Tong, J.; Collins, L.; Platt, G. Machine learning for solar irradiance forecasting of photovoltaic system. Renew. Energy 2016, 90, 542–553. [Google Scholar] [CrossRef]
  5. Malvoni, M.; De Giorgi, M.G.; Congedo, P.M. Photovoltaic power forecasting using statistical methods: Impact of weather data. IET Sci. Meas. Technol. 2014, 8, 90–97. [Google Scholar] [CrossRef]
  6. Box, G.; Jenkins, G.M.; Reinsel, G. Time Series Analysis: Forecasting & Control, 3rd ed.; John Wiley & Sons, Inc.: Hoboken, NJ, USA, 1994. [Google Scholar] [CrossRef]
  7. Yang, H.-T.; Huang, C.-M.; Huang, Y.-C.; Pai, Y.-S. A Weather-Based Hybrid Method for one-day Ahead Hourly Forecasting of PV Power Output. In Proceedings of the 2014 9th IEEE Conference on Industrial Electronics and Applications (ICIEA 2014), Hangzhou, China, 9–11 June 2014; Volume 5, pp. 526–531. [Google Scholar] [CrossRef]
  8. Zheng, D.; Semero, Y.K.; Zhang, J.; Wei, D. Short-term wind power prediction in microgrids using a hybrid approach integrating genetic algorithm, particle swarm optimization, and adaptive neuro-fuzzy inference systems. IEEJ Trans. Electr. Electron. Eng. 2018, 13, 1561–1567. [Google Scholar] [CrossRef]
  9. Chugh, A.; Chaudhary, P.; Rizwan, M. Fuzzy logic approach for short term solar energy forecasting. In Proceedings of the 12th IEEE International Conference Electronics, Energy, Environment, Communication, Computer, Control: (E3-C3) (INDICON 2015), New Delhi, India, 17–20 December 2015; pp. 1–6. [Google Scholar] [CrossRef]
  10. Perveen, G.; Rizwan, M.; Goel, N. Intelligent model for solar energy forecasting and its implementation for solar photovoltaic applications. J. Renew. Sustain. Energy 2018. [Google Scholar] [CrossRef]
  11. Sivaneasan, B.; Yu, C.Y.; Goh, K.P. Solar Forecasting using ANN with Fuzzy Logic Pre-processing. Energy Procedia 2017, 143, 727–732. [Google Scholar] [CrossRef]
  12. Huang, C.; Cao, L.; Peng, N.; Li, S.; Zhang, J.; Wang, L.; Xiong, L.; Wang, J.H. Day ahead forecasting of hourly photovoltaic power based on robust multilayer perception. Sustainability 2018, 10, 4863. [Google Scholar] [CrossRef]
  13. Massucco, S.; Mosaico, G.; Saviozzi, M.; Silvestro, F. A hybrid technique for day ahead pv generation forecasting using clear-sky models or ensemble of artificial neural networks according to a decision tree approach. Energies 2019, 12, 1298. [Google Scholar] [CrossRef]
  14. Nespoli, A.; Ogliari, E.; Leva, S.; Pavan, A.M.; Mellit, A.; Lughi, V.; Dolara, A. Day ahead photovoltaic forecasting: A comparison of the most effective techniques. Energies 2019, 12, 1621. [Google Scholar] [CrossRef]
  15. Leva, S.; Mussetta, M.; Ogliari, E. PV module fault diagnosis based on micro-converters and day ahead forecast. IEEE Trans. Ind. Electron. 2018, 66, 3928–3937. [Google Scholar] [CrossRef]
  16. Dolara, A.; Grimaccia, F.; Leva, S.; Mussetta, M.; Ogliari, E. A physical hybrid artificial neural network for short term forecasting of PV plant power output. Energies 2015, 8, 1138–1153. [Google Scholar] [CrossRef]
  17. Dutta, S.; Li, Y.; Venkataraman, A.; Costa, L.M.; Jiang, T.; Plana, R.; Tordjman, P.; Choo, F.H.; Foo, C.F.; Puttgen, H.B. Load and Renewable Energy Forecasting for a Microgrid using Persistence Technique. Energy Procedia 2017, 143, 617–622. [Google Scholar] [CrossRef]
  18. El Hendouzi, A.; Bourouhou, A. Forecasting of PV power application to PV power penetration in a microgrid. In Proceedings of the 2016 International Conference on Electrical and Information Technologies (ICEIT 2016), Tangiers, Morocco, 4–7 May 2016; pp. 468–473. [Google Scholar] [CrossRef]
  19. Polimeni, S.; Moretti, L.; Manzolini, G.; Leva, S.; Meraldi, L.; Raboni, P. Numerical and experimental testing of predictive EMS algorithms for PV-BESS residential microgrid. In Proceedings of the 2019 IEEE Milan PowerTech, Milan, Italy, 23–27 June 2019; pp. 1–6. [Google Scholar] [CrossRef]
  20. Moretti, L.; Polimeni, S.; Meraldi, L.; Raboni, P.; Leva, S.; Manzolini, G. Assessing the impact of a two-layer predictive dispatch algorithm on design and operation of off-grid hybrid microgrids. Renew. Energy 2019, 143, 1439–1453. [Google Scholar] [CrossRef]
  21. Dolara, A.; Leva, S.; Mussetta, M.; Ogliari, E. PV hourly day ahead power forecasting in a micro grid context. In Proceedings of the EEEIC 2016—International Conference on Environment and Electrical Engineering, Florence, Italy, 6–8 June 2016; pp. 1–5. [Google Scholar] [CrossRef]
  22. Leva, S.; Dolara, A.; Grimaccia, F.; Mussetta, M.; Ogliari, E. Analysis and validation of 24 hours ahead neural network forecasting of photovoltaic output power. Math. Comput. Simul. 2017, 131, 88–100. [Google Scholar] [CrossRef]
  23. Bird, R.E.; Riordan, C. Simple Solar Spectral Model for Direct and Diffuse Irradiance on Horizontal and Tilted Planes at the Earth’s Surface for Cloudless Atmospheres. J. Clim. Appl. Meteorol. 1986, 25, 87–97. [Google Scholar] [CrossRef]
  24. Nespoli, A.; Ogliari, E.; Dolara, A.; Grimaccia, F.; Leva, S.; Mussetta, M. Validation of ANN Training Approaches for Day-Ahead Photovoltaic Forecasts. In Proceedings of the International Joint Conference on Neural Networks, Rio de Janeiro, Brazil, 8–13 July 2018; pp. 1–6. [Google Scholar] [CrossRef]
  25. Ogliari, E.; Dolara, A.; Manzolini, G.; Leva, S. Physical and hybrid methods comparison for the day ahead PV output power forecast. Renew. Energy 2017, 113, 11–21. [Google Scholar] [CrossRef]
Figure 1. Scheme of the forecasting process. CSRM, Clear Sky Radiation Model.
Electronics 08 01434 g001
Figure 2. Physical Hybrid Artificial Neural Network (PHANN) architecture designed to provide the output power forecast P F .
Electronics 08 01434 g002
Figure 3. Raw data for (a) irradiance, (b) DC power, (c) voltage, and the flags corresponding to the state of (d) the run of the microgrid μ G run , (e) PV converter PV run , and (f) the Reduction Power Point (RPP) algorithm. The flag values are true when green, false otherwise.
Electronics 08 01434 g003
Figure 4. Flowchart describing the sample validation process.
Electronics 08 01434 g004
Figure 5. Schematic diagram of the Multi-Good MicroGrid laboratory (MG L a b 2 ) principal units.
Electronics 08 01434 g005
Figure 6. (a) Measured power and the hourly average power computed according to the proposed validation process. The blue line represents the available power measurements. Power production hourly averages computed using all the available data (yellow line) and filtering the measurements according to the proposed methodology (orange line). (b) Acceptance criterion for the single power measurements. The flag value is true when green, false otherwise.
Electronics 08 01434 g006
Figure 7. Power forecast computed by the PHANN with respect to the measured power (blue line). PHANN’s training is either performed with a validated historical dataset (orange line) or with all the available data (yellow line).
Electronics 08 01434 g007
Figure 8. (a) Measured and forecast power together with (b) the absolute error committed and the MAE for the month of July 2019.
Electronics 08 01434 g008
Table 1. Microgrid overview.
ComponentsSize
Electric power generation100 kW
Thermal power generation45 kW
Potable water production1 m 3 /h
Electric storage150 kWh
Hydrogen storage30 kWh
Thermal storage50 kWh
Electric vehicles2
Electric bikes10
Table 2. Forecast improvements achieved by filtering measured data.
Non ValidatedValidated%
dtsdtsImprovement
NMAE5.283.8127.87
WMAE36.0725.7528.61
EMAE35.1224.5730.03
nRMSE16.4012.7722.17
OMAE19.7714.2527.92

