1. Introduction
In recent decades, shale gas has drawn great attention globally, especially with its successful development in North America [
1,
2,
3]. As a typical unconventional energy resource, shale gas transport mechanisms in organic shale nanopores display a number of unique characteristics; for example, the slippage effect, Knudsen diffusion, surface diffusion, and adsorption/desorption behaviors [
4,
5]. These unique transport mechanisms enhance the flow capability of shale gas and promote commercial production in shale gas reservoirs. Generally, Shale gas reservoir (SGR) is tight or ultratight formations, with pore sizes ranging from 1−200 nm [
6] and matrix intrinsic permeability from 10
−9–10
−3 mD [
7,
8]. The stress dependence of shale properties, for example, porosity and permeability, complicates the study even further [
9]. Thus, researching gas transport mechanisms in organic shale nanopores is a very complex and challenging task for petroleum engineers [
10,
11].
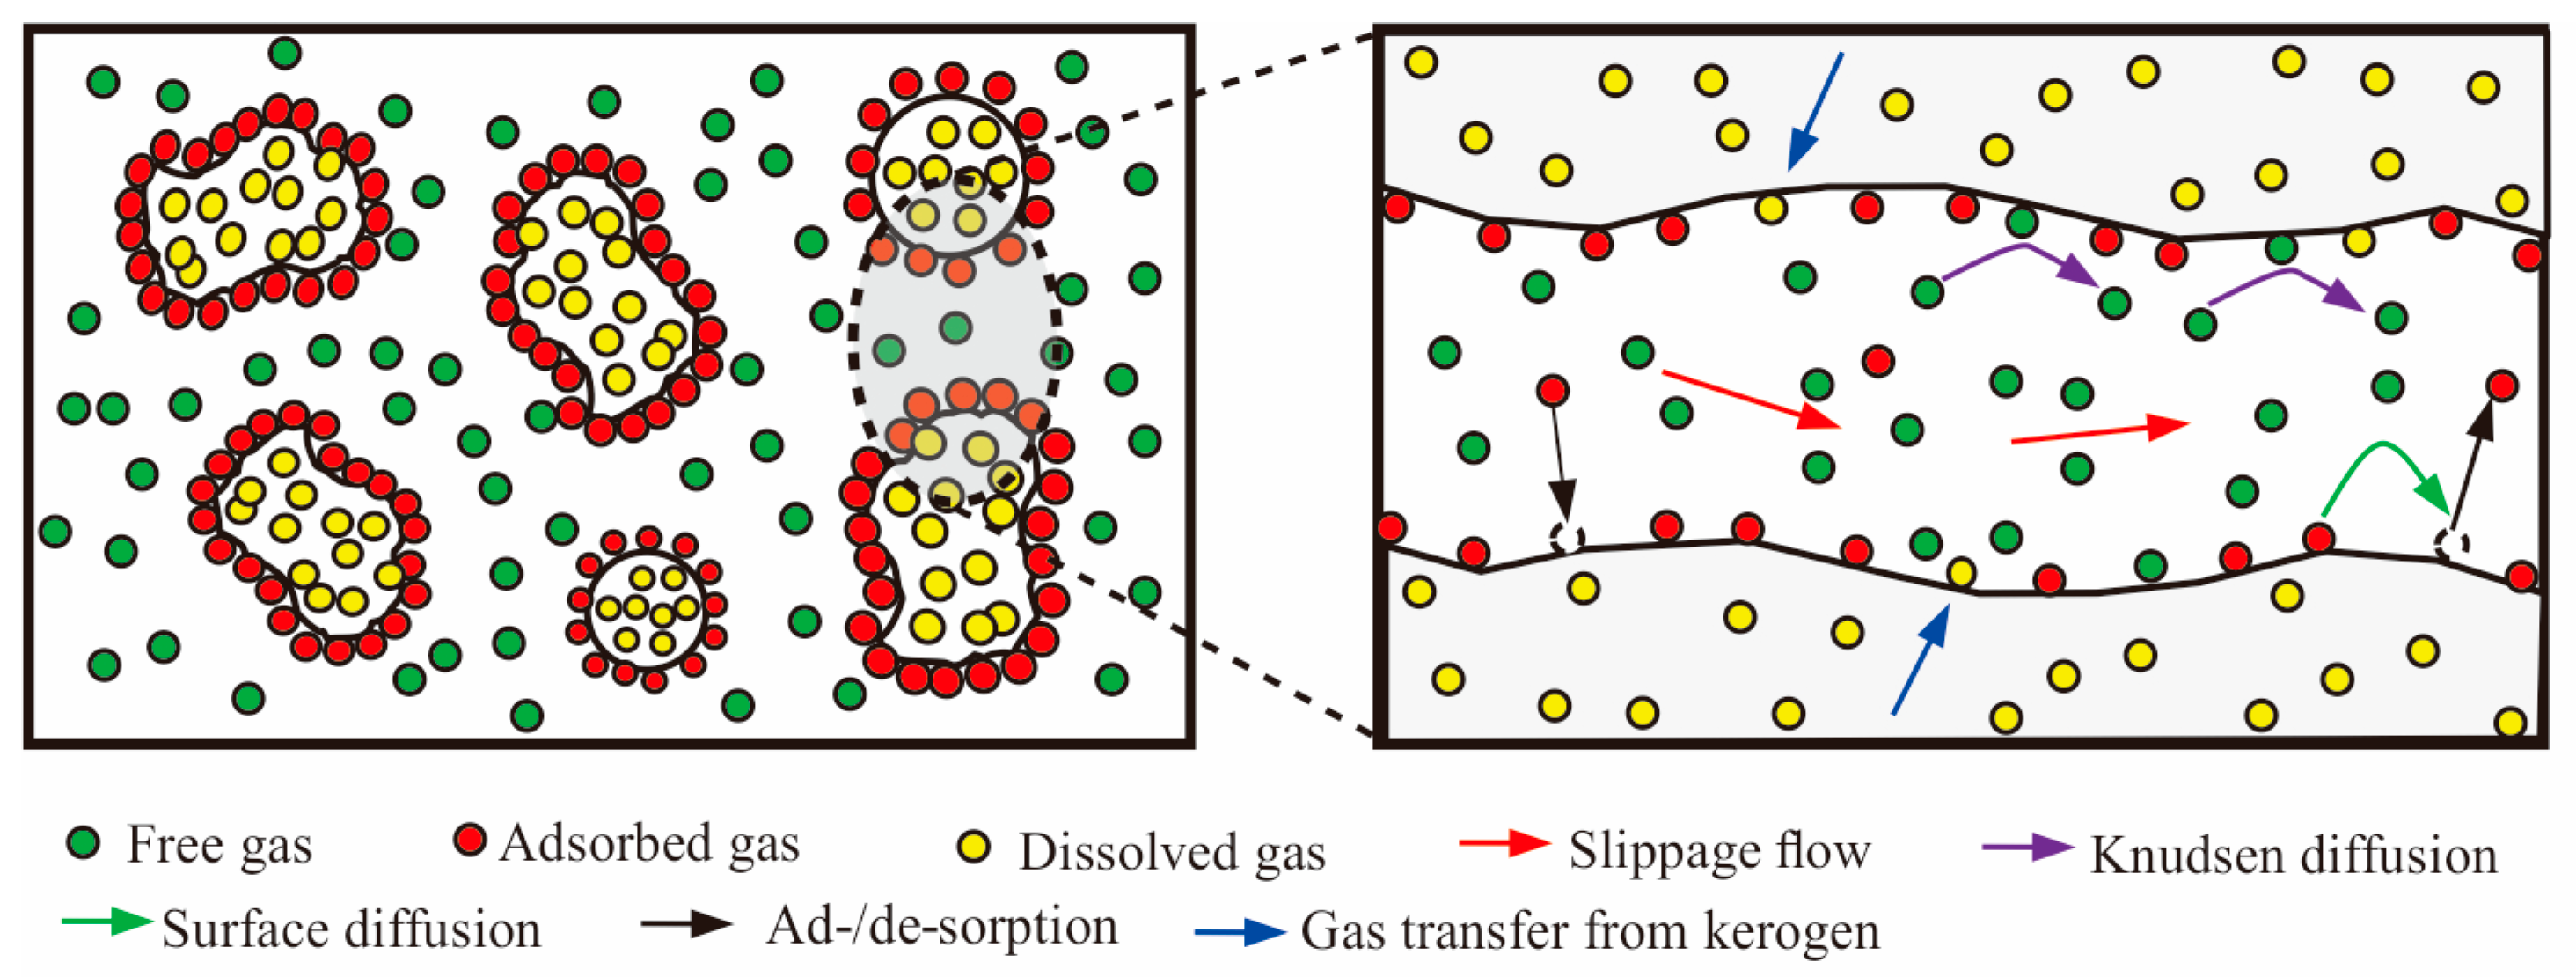
Gas adsorption is a special storage form in SGRs, which can account for up to 85% of the original gas in place due to the very large surface area of a shale formation [
4]. On one hand, adsorbed gas increases the recoverable shale gas reserves, because it will desorb from pore surfaces when pressure decreases [
12,
13,
14,
15]; on the other, adsorbed gas occupies a certain amount of flow paths and changes the effective hydraulic radius, which cannot be ignored for nanometer-scale transport studies [
10,
11]. Surface diffusion of adsorbed gas occurs under a chemical potential energy gradient in shale nanopores [
16] and facilitates shale gas production. Considering the high reservoir pressure and surface heterogeneity, a surface diffusion model of adsorbed gas in nanopores of SGRs was established and analyzed by Wu et al. [
17]. A new formulation of apparent permeability (AP) for gas transport in SGRs was proposed by Zhang et al. [
18], which took surface diffusion into account. Wang et al. [
19] established an AP model for gas transport in shale nanopores considering multiple effects, such as non-Darcy flow and surface diffusion.
Viscous flow and Knudsen diffusion of free gas are two important bulk phase gas transport mechanisms. Due to the breakdown of the continuum hypothesis in nanopores, the viscous seepage theory must be modified to satisfy slip boundaries. Klinkenberg [
20] devised an empirical formulation to account for the slippage effect, which linked slippage permeability to intrinsic permeability, average pressure, and an empirical parameter
bk. After that, much effort has been made to obtain this parameter
bk theoretically or empirically [
21,
22,
23,
24,
25,
26]. Basing their work on the dynamic slippage concept, Ertekin et al. [
23] established a new AP model considering the slippage effect. Skjetne and Auriault [
27] made a further study on the gas slippage flow phenomenon in porous media (PM) on the basis of the Navier–Stokes equation.
Another type of slip model is based on slip boundary conditions (BCs), including the first and second-order modifications. The Maxwell slip model [
28] is a first-order approximation from kinetic theory, based on which many other permeability models [
25,
26,
29] have been established for tight and shale gas reservoirs. Second-order slip velocity models have been successively proposed to improve calculation precision. Hisa et al. [
30] investigated molecular rarefaction effects through experiments and proposed a new slip BC that added a second-order term to the Maxwell model [
28]. Basing their work on high-order slip BCs and asymptotic analysis, Beskok and Karniadakis [
31] proposed another widely used second-order slip velocity model. Considering the location difference between slip surface and solid wall, Zhang et al. [
32] improved the Beskok–Karniadakis (BK) slip model by introducing a new parameter
γ to describe the distance between the slip surface and the solid wall. Niu et al. [
33] made a new second-order gas-permeability correlation for shale gas slip flow based on the study of Zhang et al. [
32]. In summary, slip velocity models can uniformly be expressed as:
where
uslip is the velocity at the slip surface;
λ is average mean free path of gas molecules; and
C1 and
C2 are two slip coefficients, the values of which are summarized in
Table 1.
The values of some parameters in those slip velocity models, for example, the tangential momentum accommodation coefficient
σv, can be very difficult to determine [
39,
40,
41]. Although that coefficient is defined as the percentage of molecules reflected diffusively from solid walls, its physical meaning is still not very straightforward. The value has to be obtained by experiments or molecular dynamics (MD), which are also not easy tasks [
41]. Besides, the slip velocity derived from those models may not be bounded, depending on specific situations [
39,
40], which may cause severe problems in numerical applications [
42]. Except for Zhang et al. [
32] and Niu et al. [
33], all the studies in
Table 1 ignored the distance between the slip surface and the solid wall. Meanwhile, in those studies, gas molecules through a slip surface are assumed to be comprised of molecules from solid wall and the surface
λ away from the solid wall, which account for the same percentage of 50% (that is,
nλ = nw = 0.5
ns). This assumption is also invalid when gas molecules are not uniformly distributed across the pipe section. The uneven molecule distribution, which can be attributed to the existence of gas molecular accumulation or adsorption near solid walls, has been proved by MD [
32,
33].
In those slip velocity models, the content of molecules diffusively reflected from solid walls is artificially assumed to be
σv, whereas (1 −
σv) is the ratio of molecules specularly reflected to incident molecules. However, in reality gas molecules do not rebound elastically from solid walls after colliding [
39,
40,
41,
43,
44,
45], due to the existence of attractive forces between gas and solid molecules. Gas molecules can be adsorbed on solid surfaces and then desorbed when the pressure decreases, causing an inelastic rebound. Therefore, a Langmuir slip BC more accurately describes the real slip phenomenon from the perspective of a physical meaning. Knudsen diffusion and surface diffusion are important gas transport mechanisms in shale nanopores. Although the Langmuir slip permeability (LSP) model for SGRs was first studied by Singh et al. [
41], the results are not very convenient to apply. Besides, Knudsen/surface diffusion, real gas effects, geomechanical effects, and thermodynamics phase changes were also not considered in their research. Song et al. [
46] pointed out that slippage flow, Knudsen diffusion, and surface diffusion were three gas transfer mechanisms in nanometer pores. However, the effects of slippage flow and Knudsen diffusion were broadly coupled together by the BK model [
31] in their research, which ignored gas accumulation near pore walls and failed to distinguish the relative intensity of slippage flow and Knudsen diffusion in different conditions. Besides, the surface diffusion model in their study did not consider the effects of PM properties.
In this paper, considering gas-solid interaction, the slip phenomenon is described by the Langmuir slip BC [
39,
40,
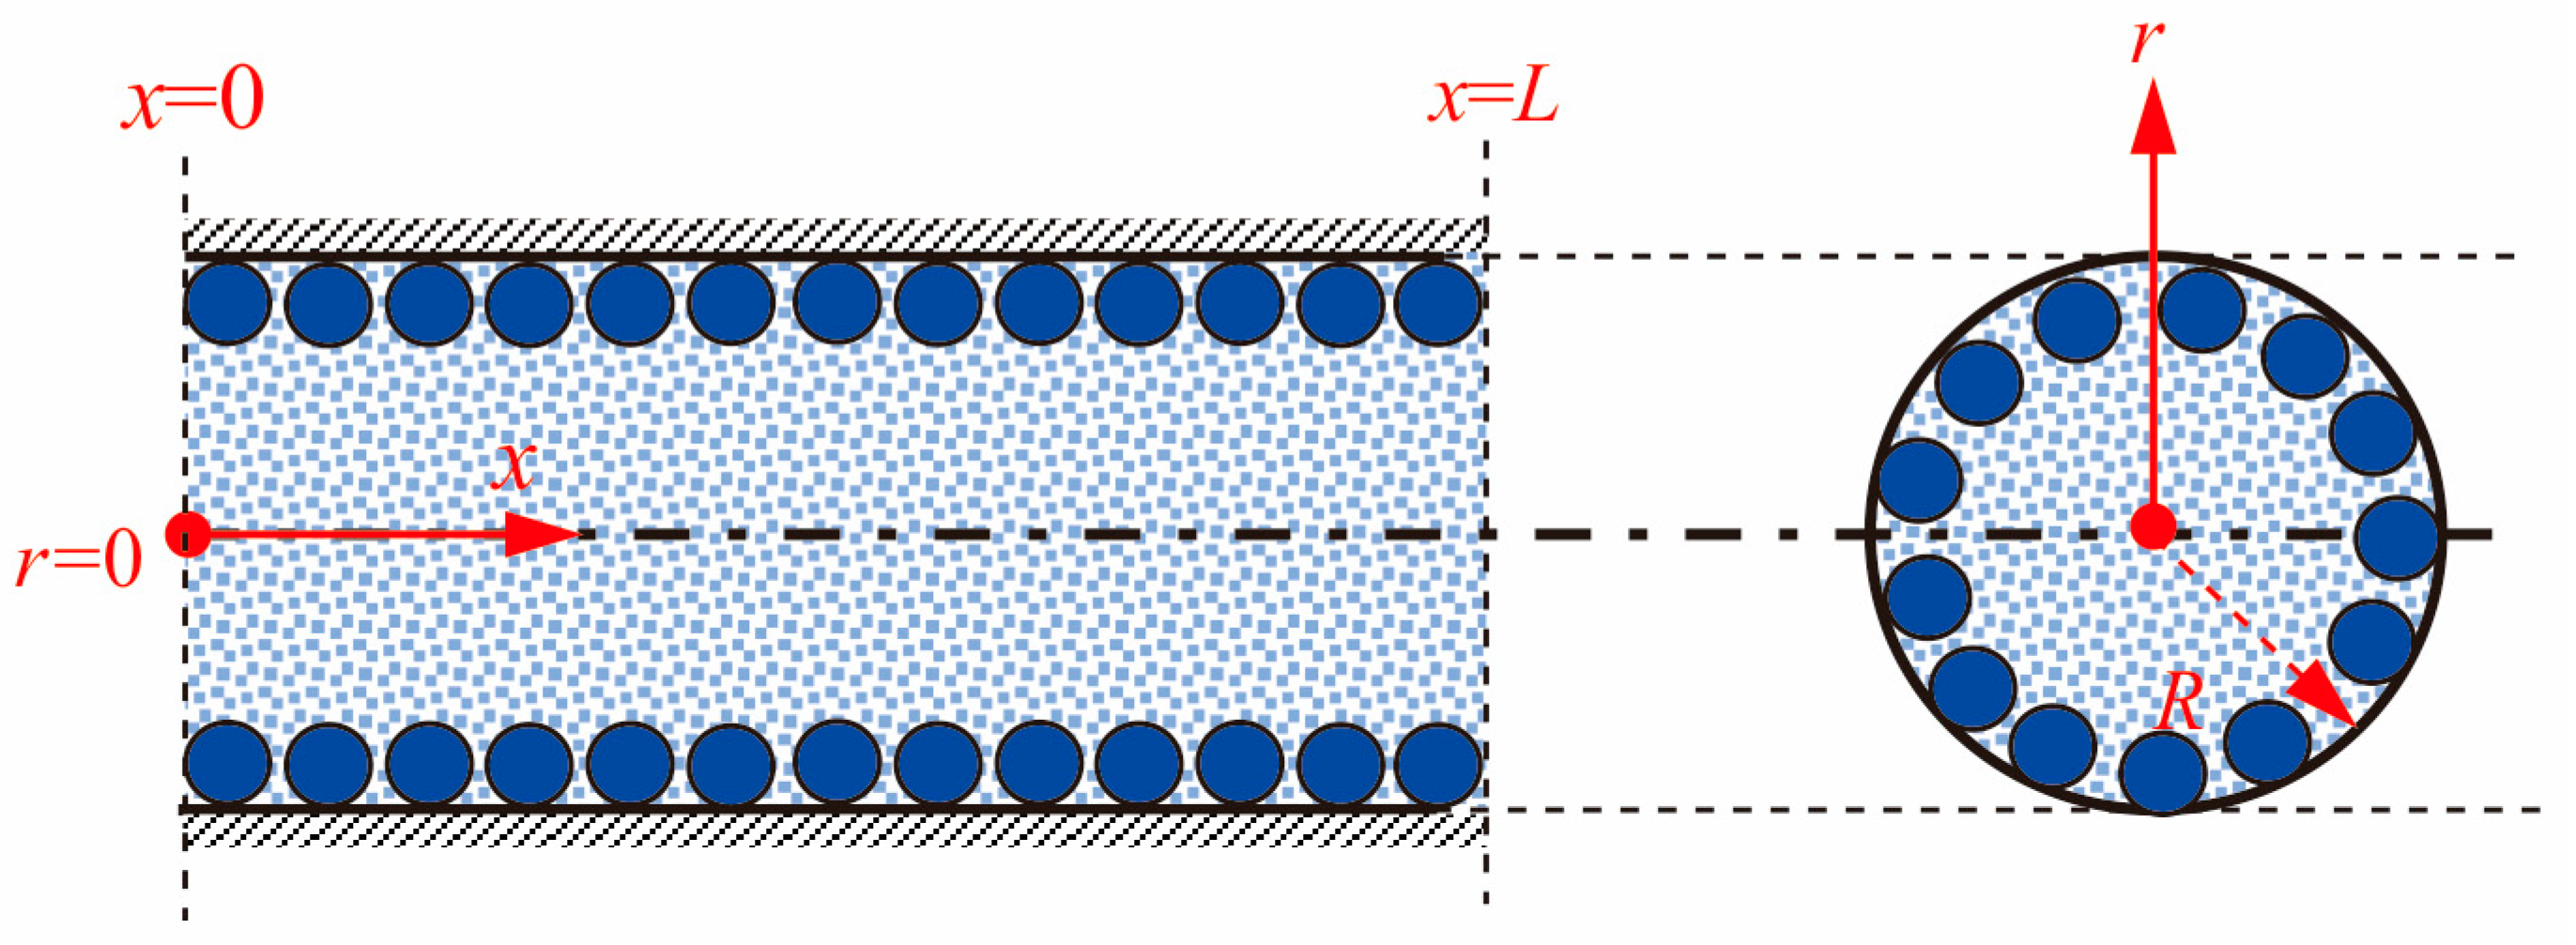
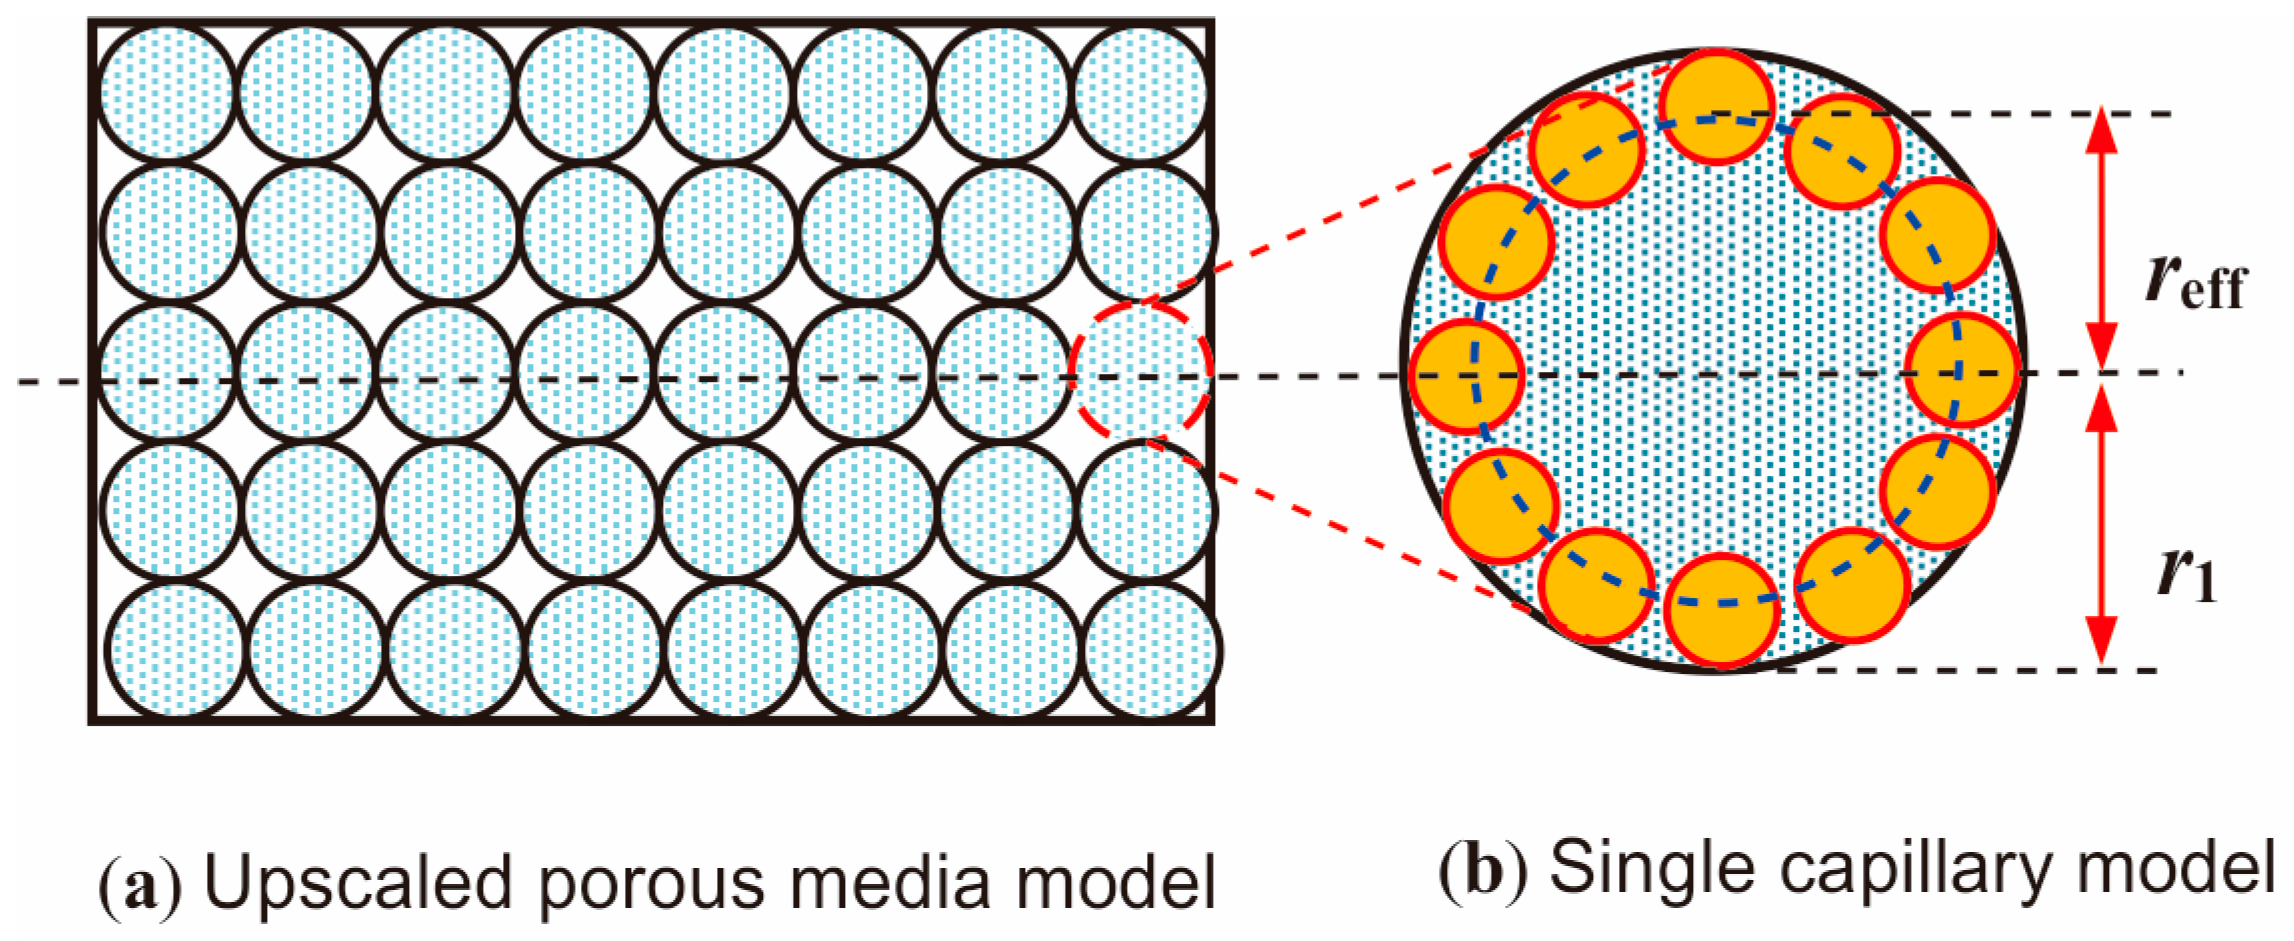
41], and a new slip model for bulk phase gas transport was established. Based our work on the LSP model, we also propose a new gas transport model coupling viscous flow, slippage effect, Knudsen diffusion, surface diffusion, and adsorption/desorption. Also taken into consideration were the real gas effect, stress dependence of physical properties, thermodynamics phase changes due to pore confinement, and dynamic adsorption layer thickness. The advantages of our LSP model over previous Maxwell-based ones are also illustrated. To make our gas transport model more applicable to practical situations, we re-expressed it in an AP form and upscaled it from a single capillary model to a porous media form, which coupled porosity and tortuosity into AP model and considered the effects of adsorbed gas volume on effective porosity.
3. Model Validation
Currently, the use of Langmuir velocity slip BC for gas transport studies in SGRs is relatively rare and new in the petroleum industry. Thus, the accuracy of our LSP model, bulk phase gas transport model, single capillary model, and UPM model are all validated in this section.
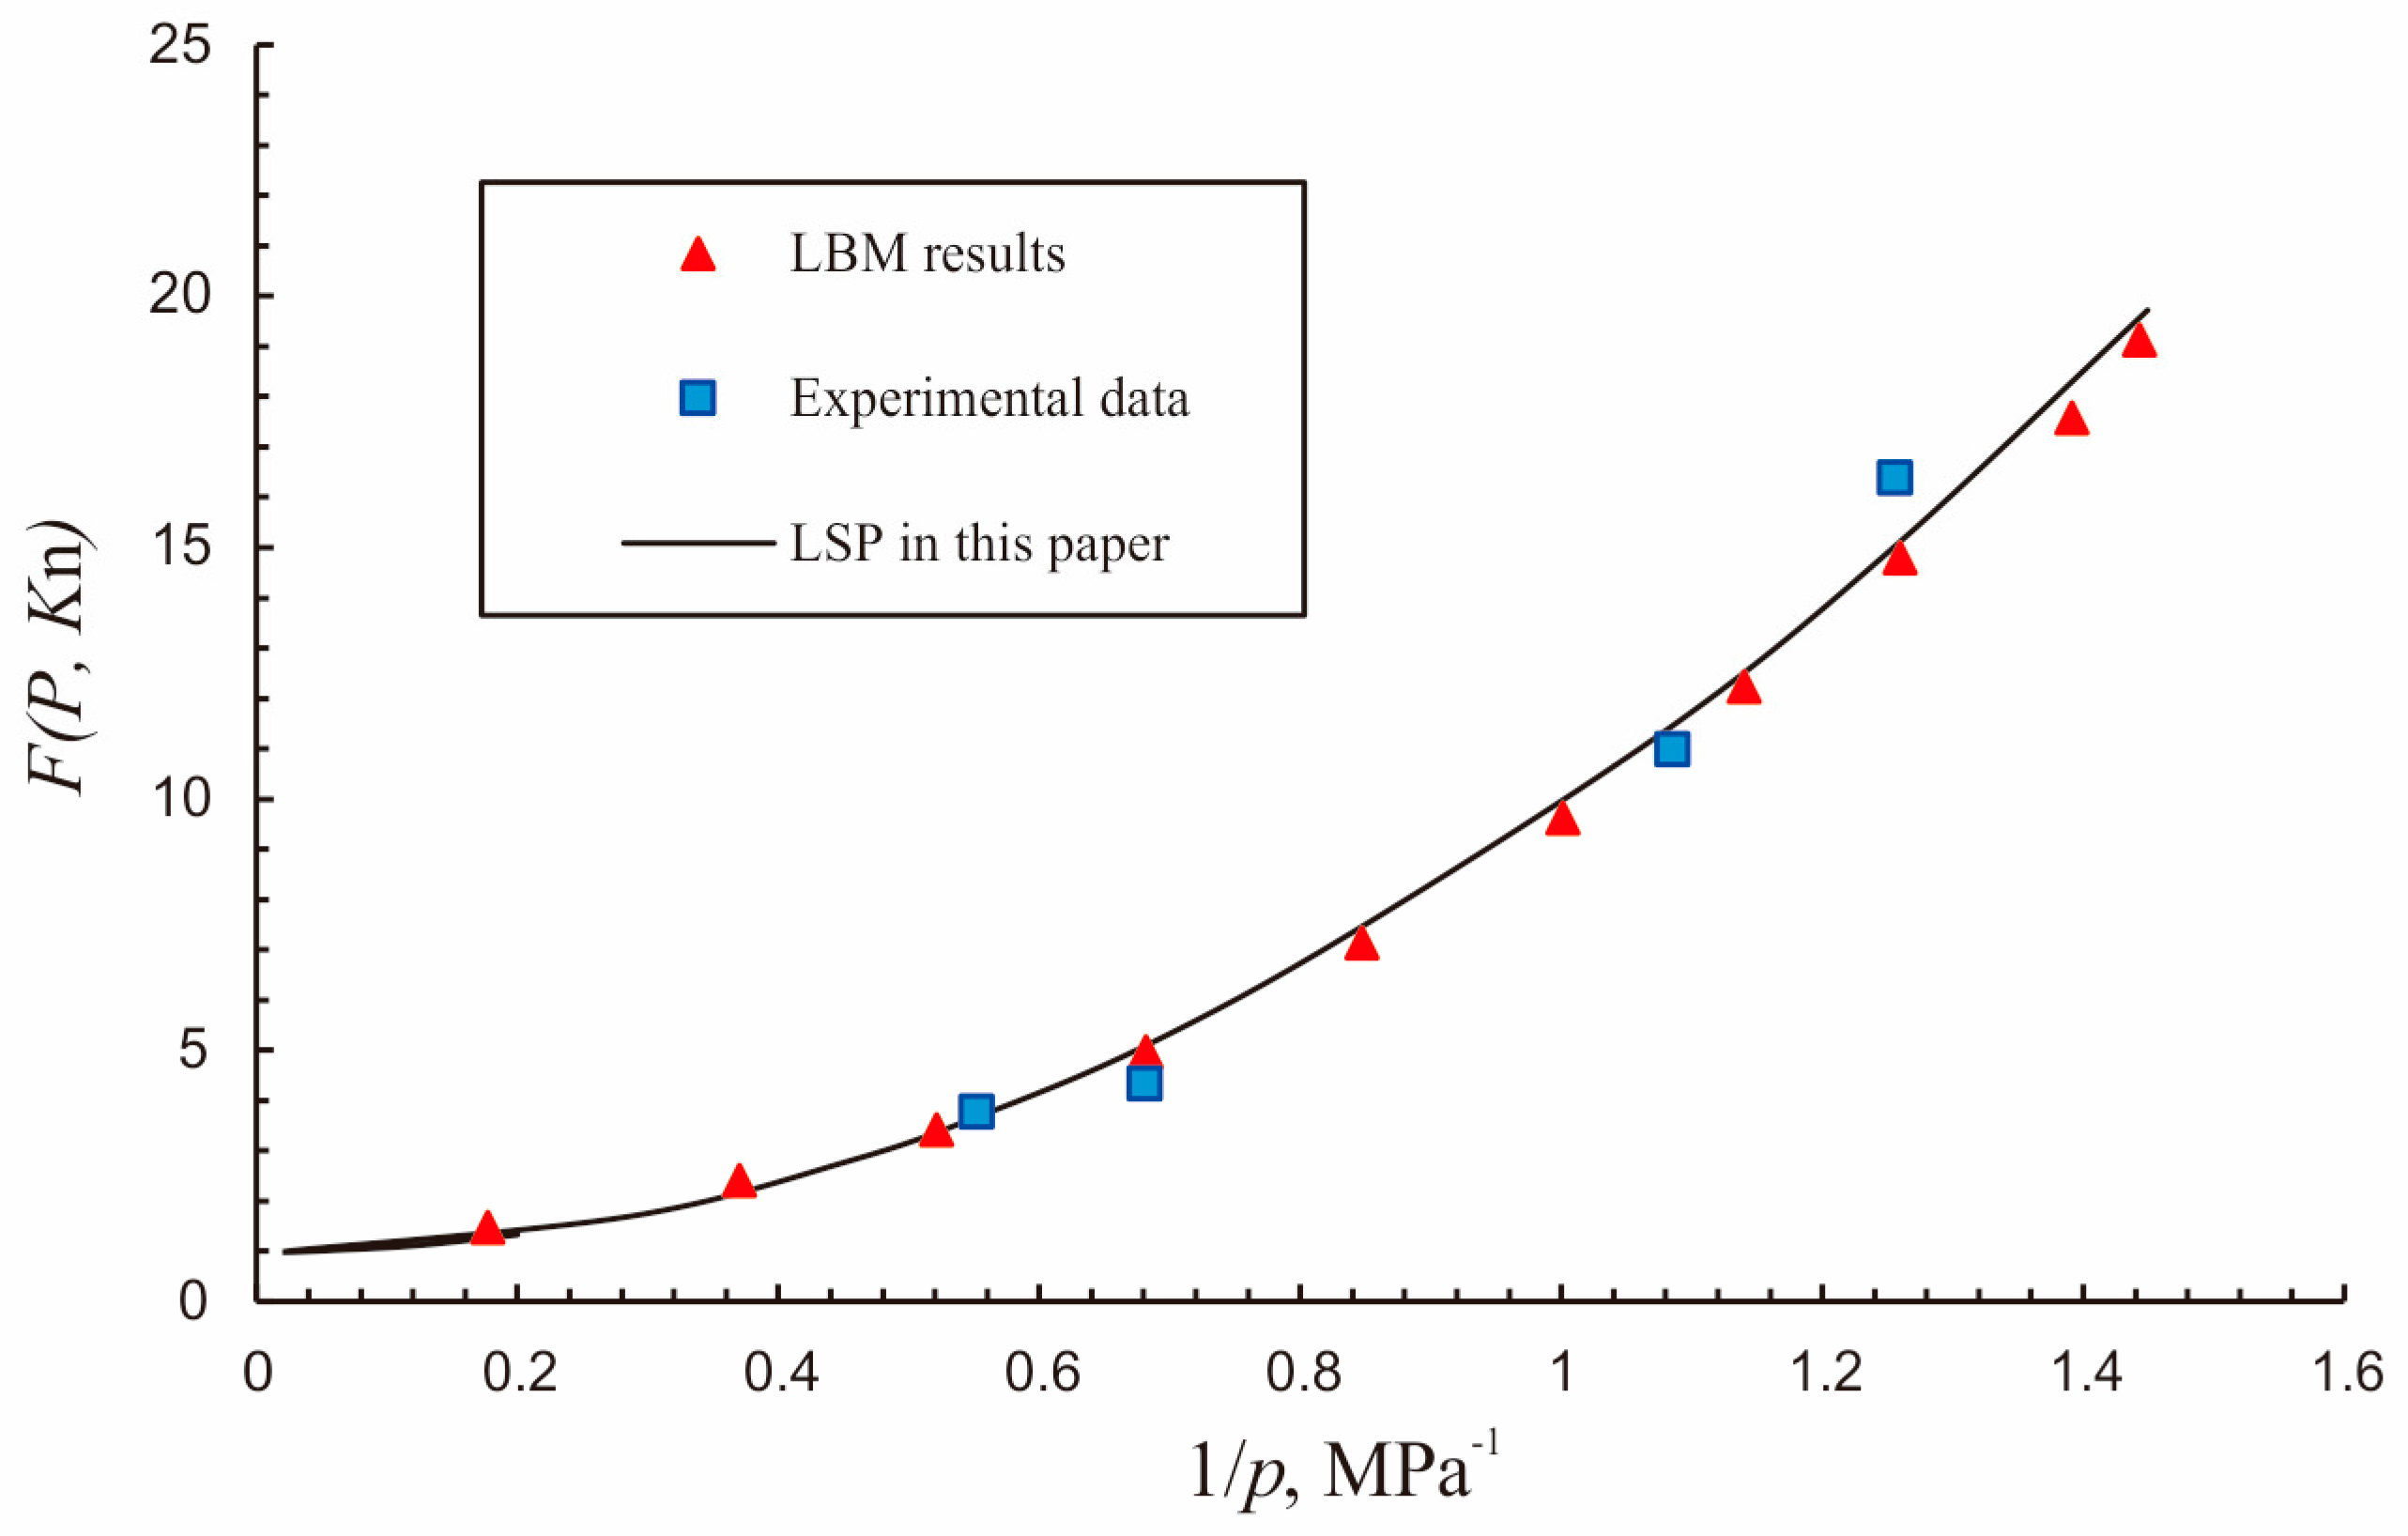
First, the experimental data and lattice Boltzmann method (LBM) simulation results from Fathi et al. [
69] are adopted in this section to validate our LSP model. The experimental data was collected from a routine gas uptake measurements using 5.68 mm size fragments. As can be seen from
Figure 4, the matching results from three different sources are reasonable, which can prove the accuracy of our LSP model. Corresponding fitting parameters are presented in
Table 4. Then, model comparison was done among first-order correlation [
28], second-order correlation [
30], corrected second-order correlation [
33], and our LSP model (defining
ω = 0.6,
pD = 1,
σv = 0.6, and
C = 0.55), as can be seen in
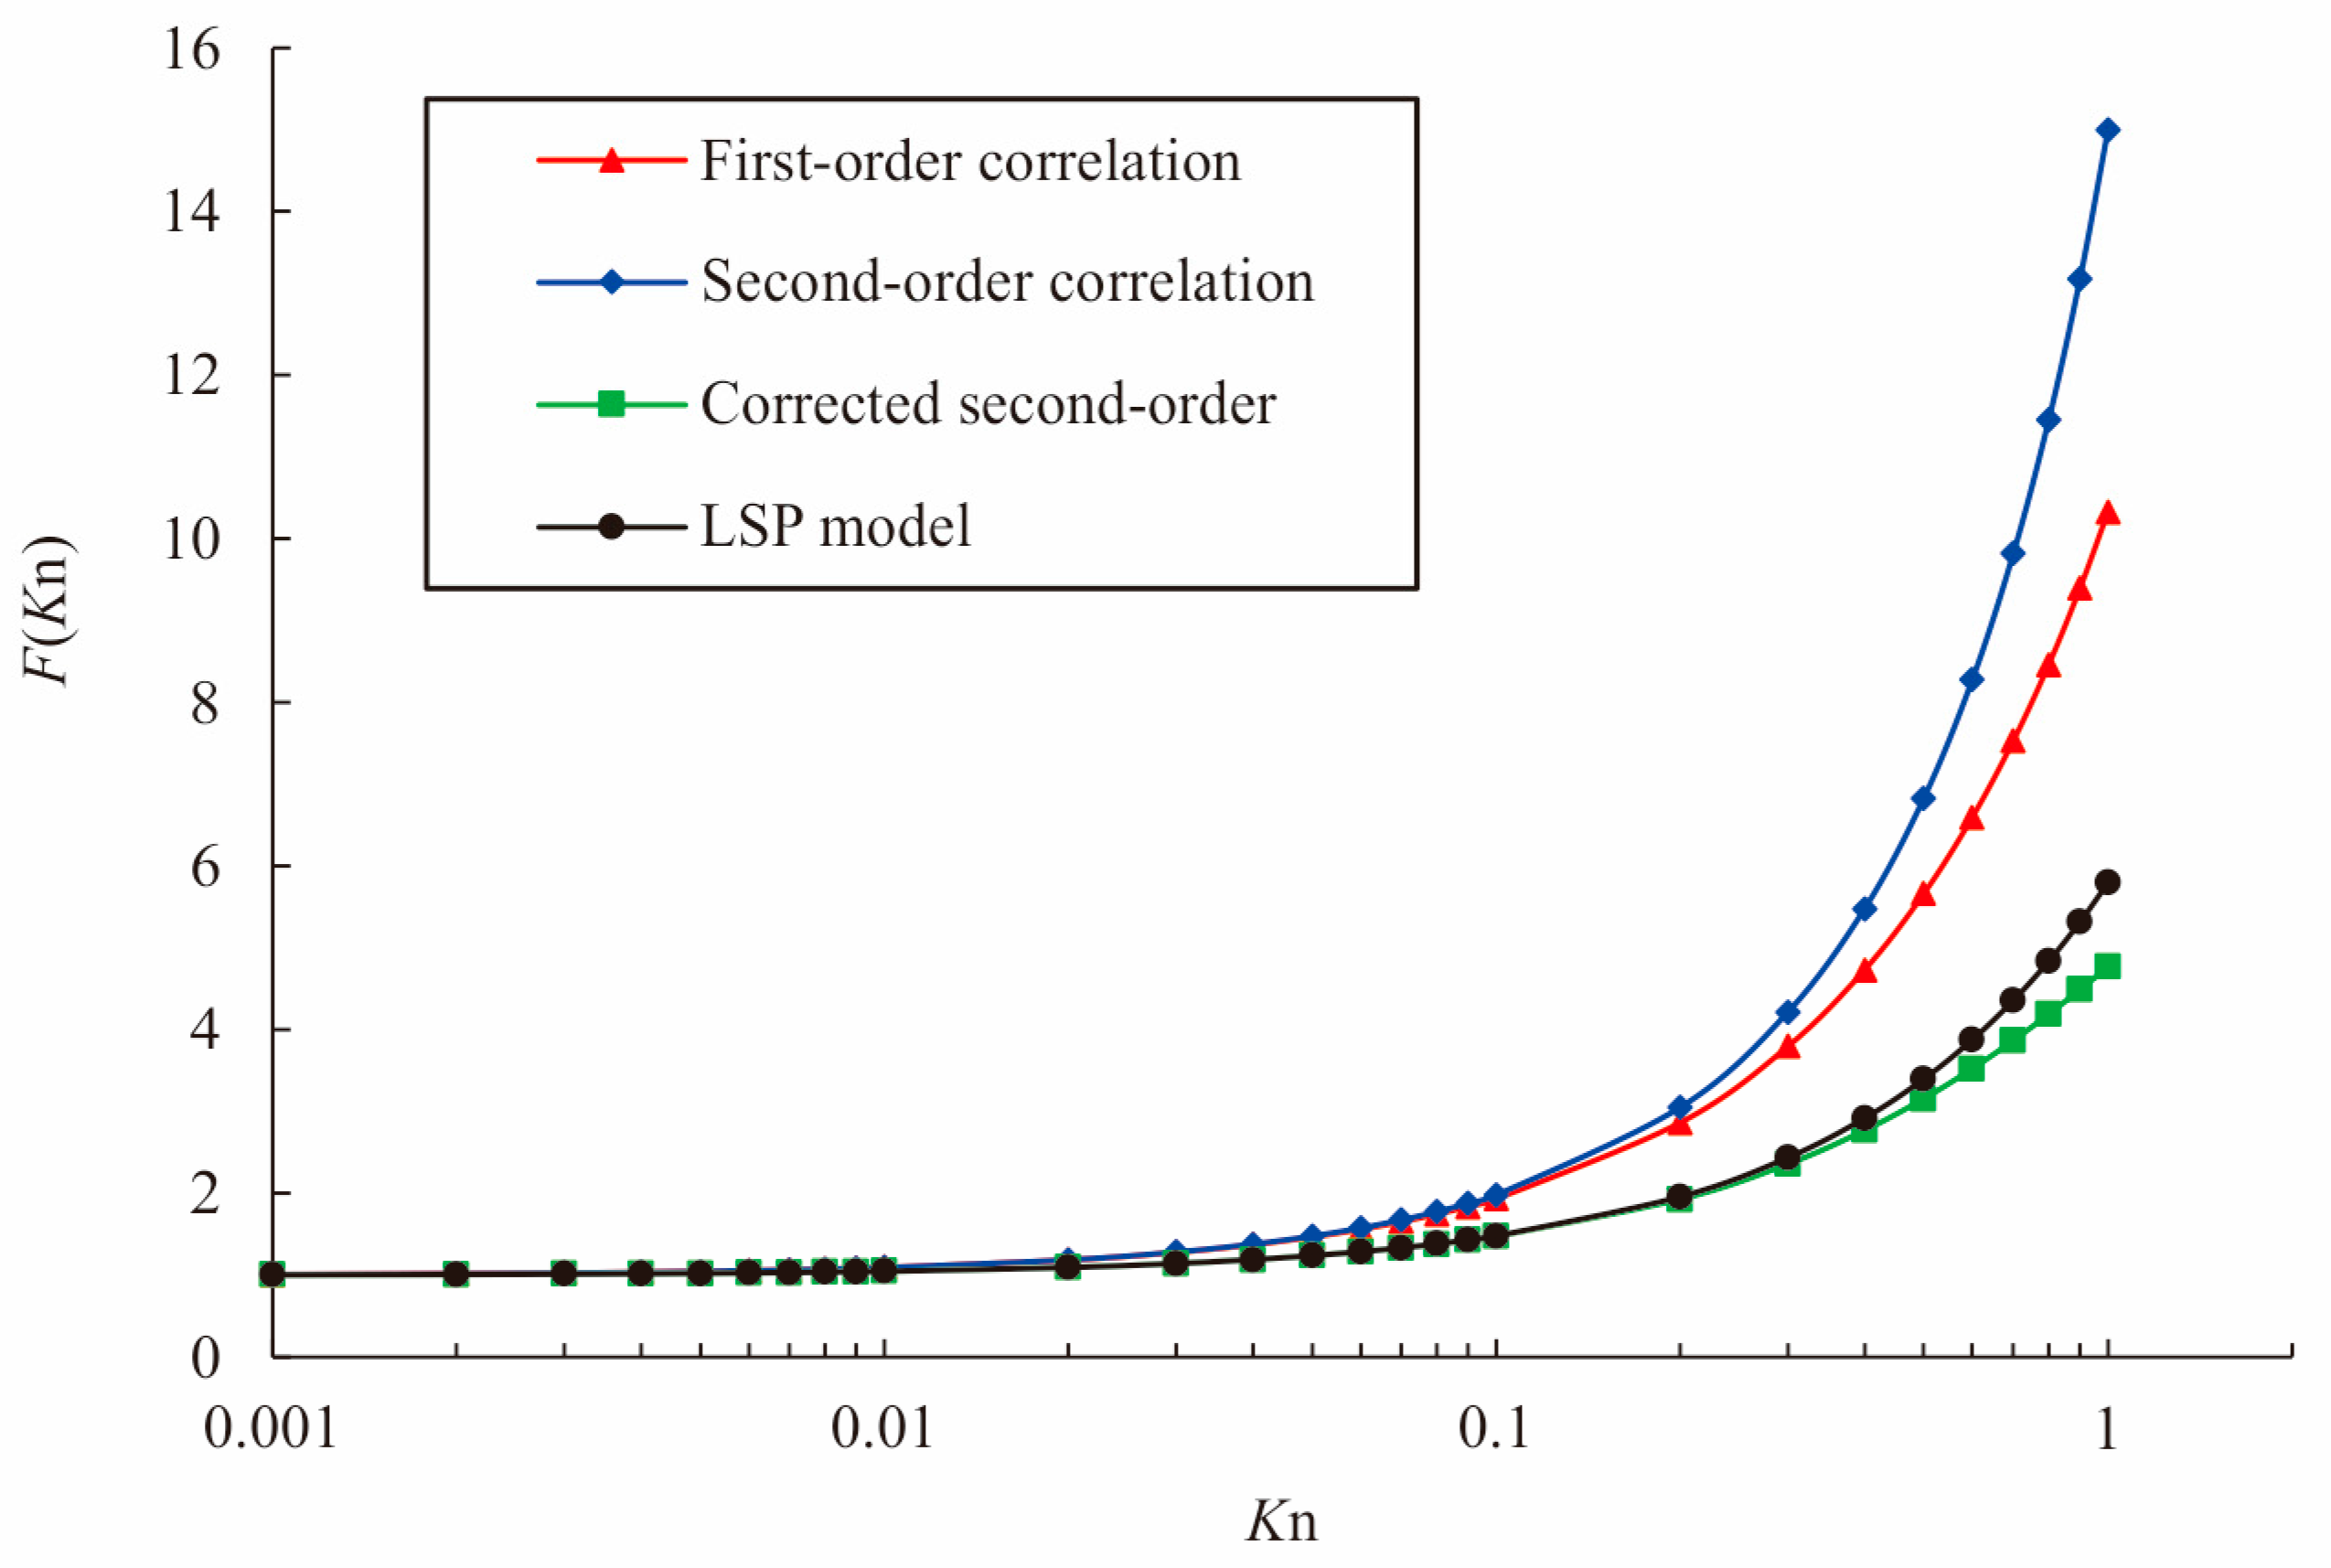
Figure 5. During the slip flow regime, the first and second-order correlation results are much higher than corrected second-order correlations and our LSP results, whereas corrected second-order correlation results overlap with the LSP results. This is because the first and second-order correlations assumed elastic gas—solid collisions and uniform distribution of gas molecules across the cross-section area of nanopores.
The corrected second-order correlation method considered the gas accumulation effects near solid surfaces according to MD, whereas our LSP model considered gas adsorption on solid surfaces for slip flow study. Gas accumulation and adsorption both narrow flow paths and hinder gas transport in small pores. The first- and second-order correlation methods ignored the hindering effect and may overestimate the slip permeability in formation evaluation.
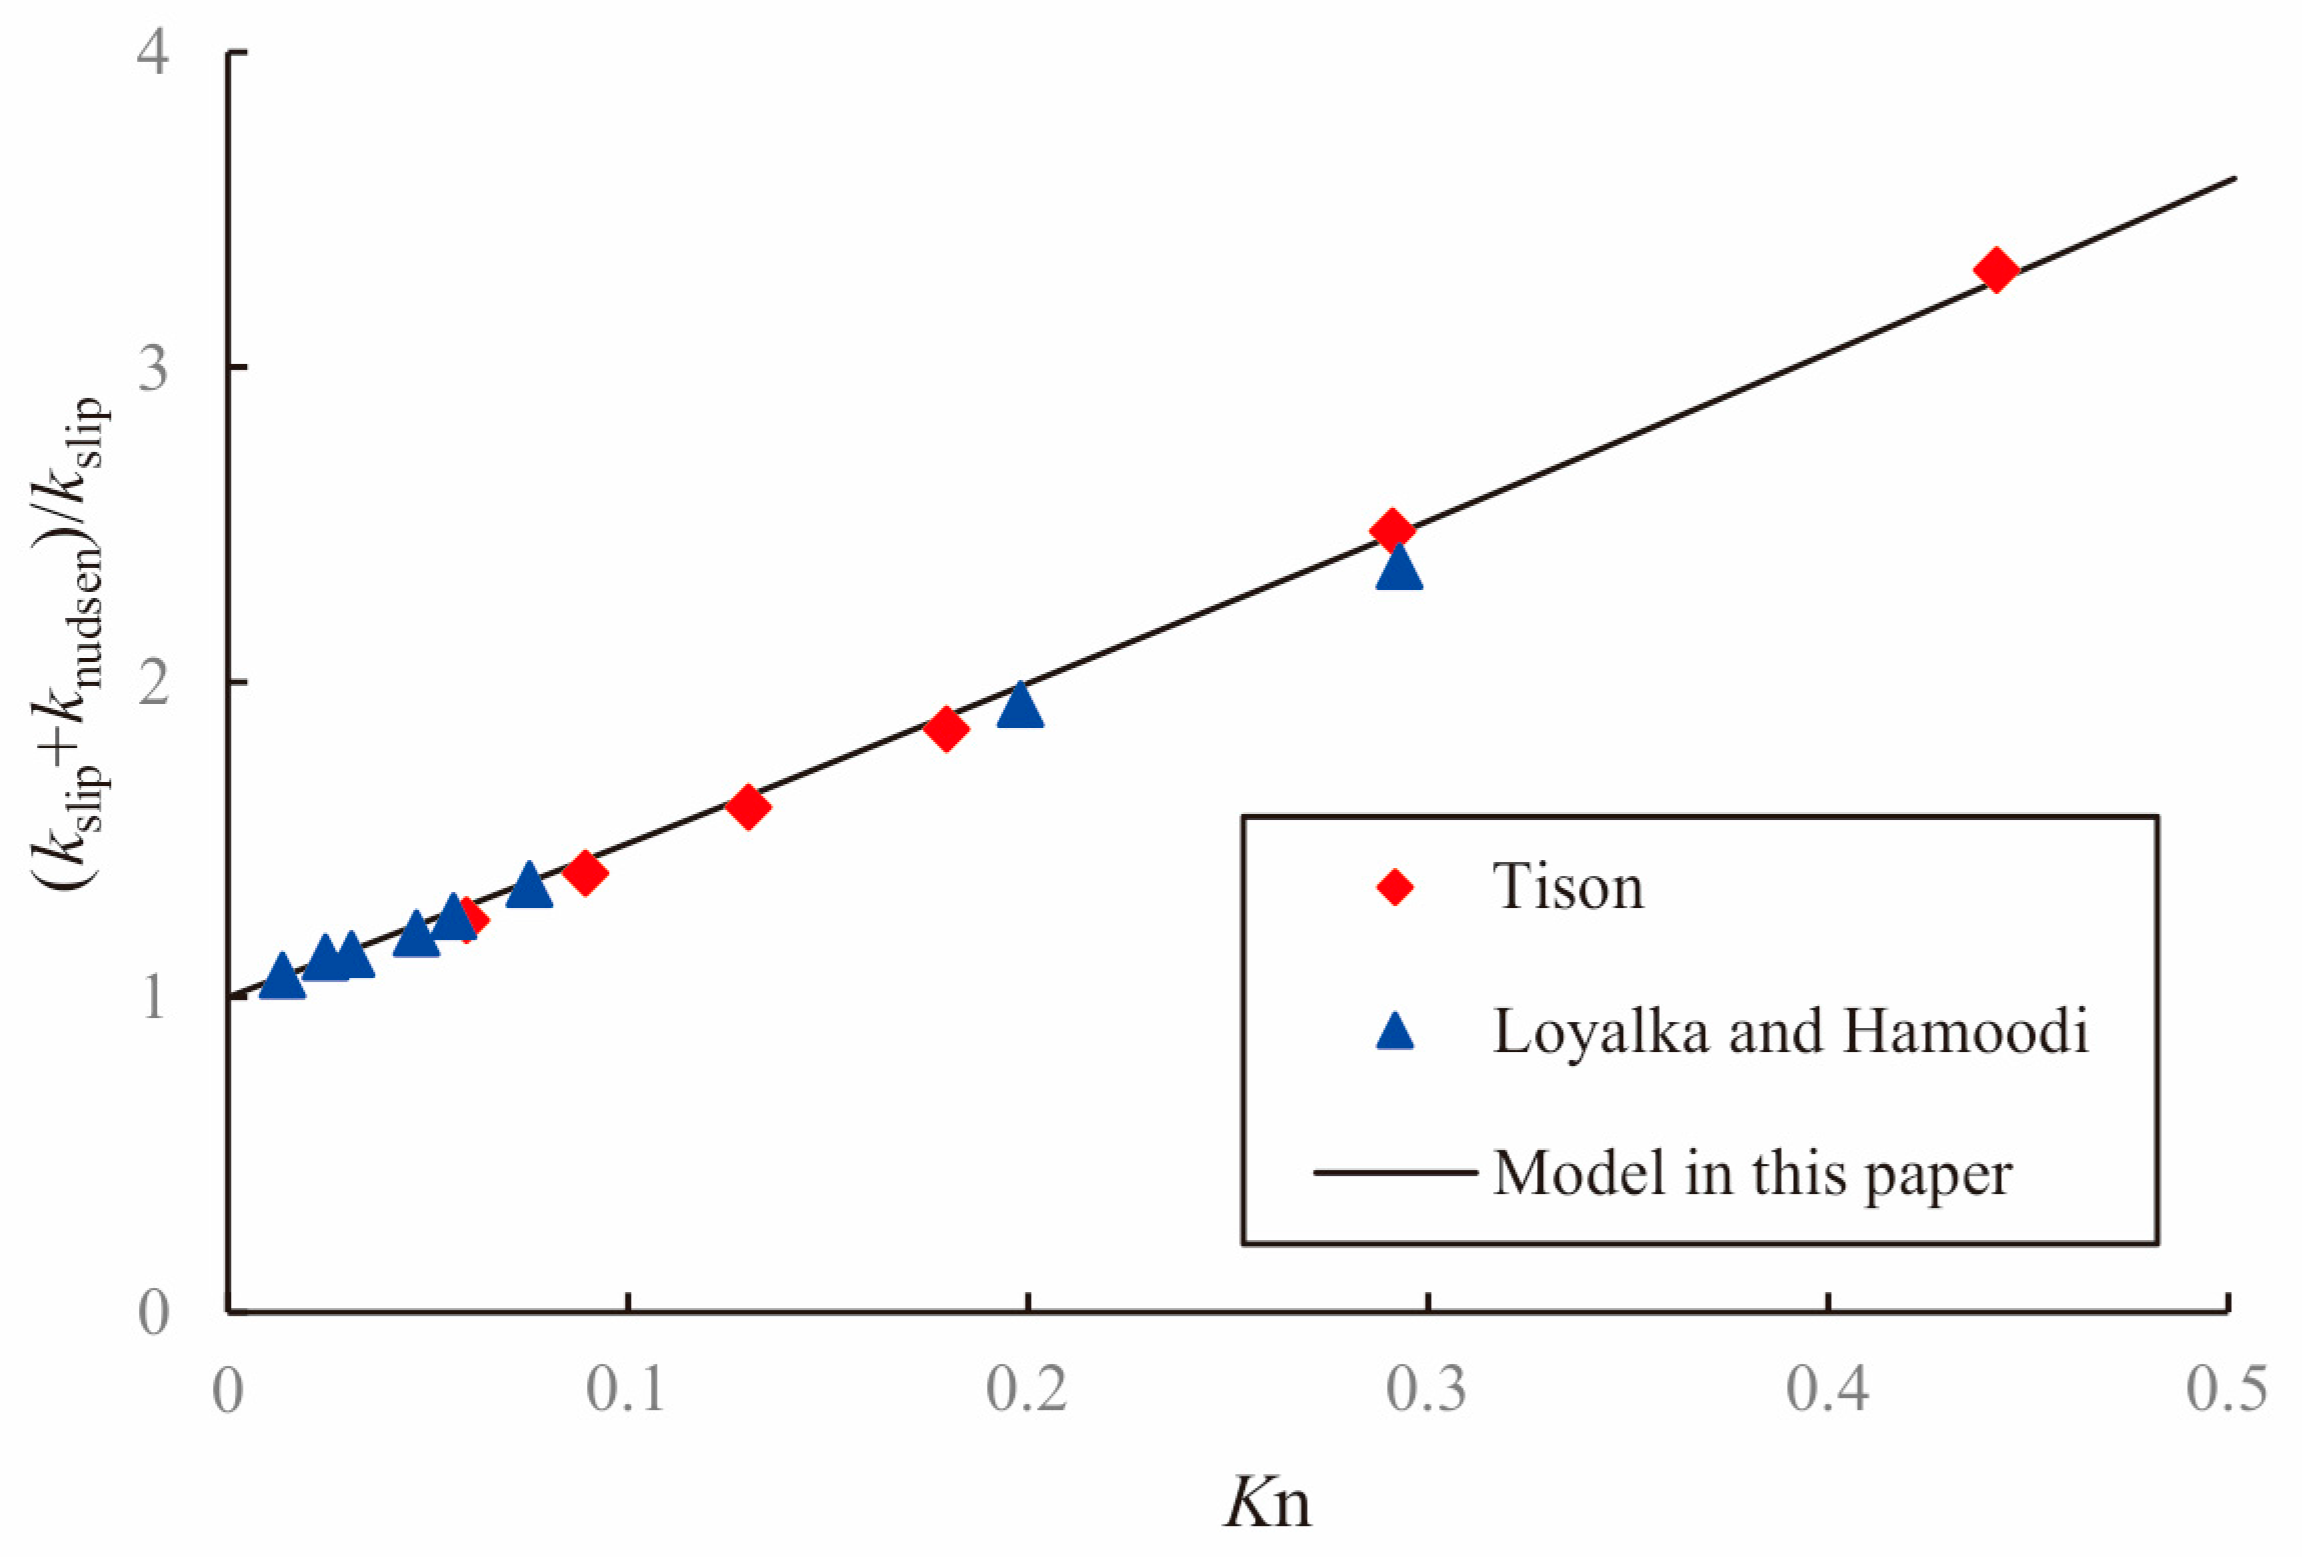
Then, to validate the bulk phase gas transport model, we compared the results from our model to those published data from linearized Boltzmann solutions [
70] and experimental data [
71]. Note that bulk phase gas is defined as that transported by slip viscous flow and Knudsen diffusion, and bulk phase permeability is defined as the sum of slip permeability
kslip and the equivalent Knudsen permeability
knudsen. As can be seen from
Figure 6, three different data sources adequately match with each other.
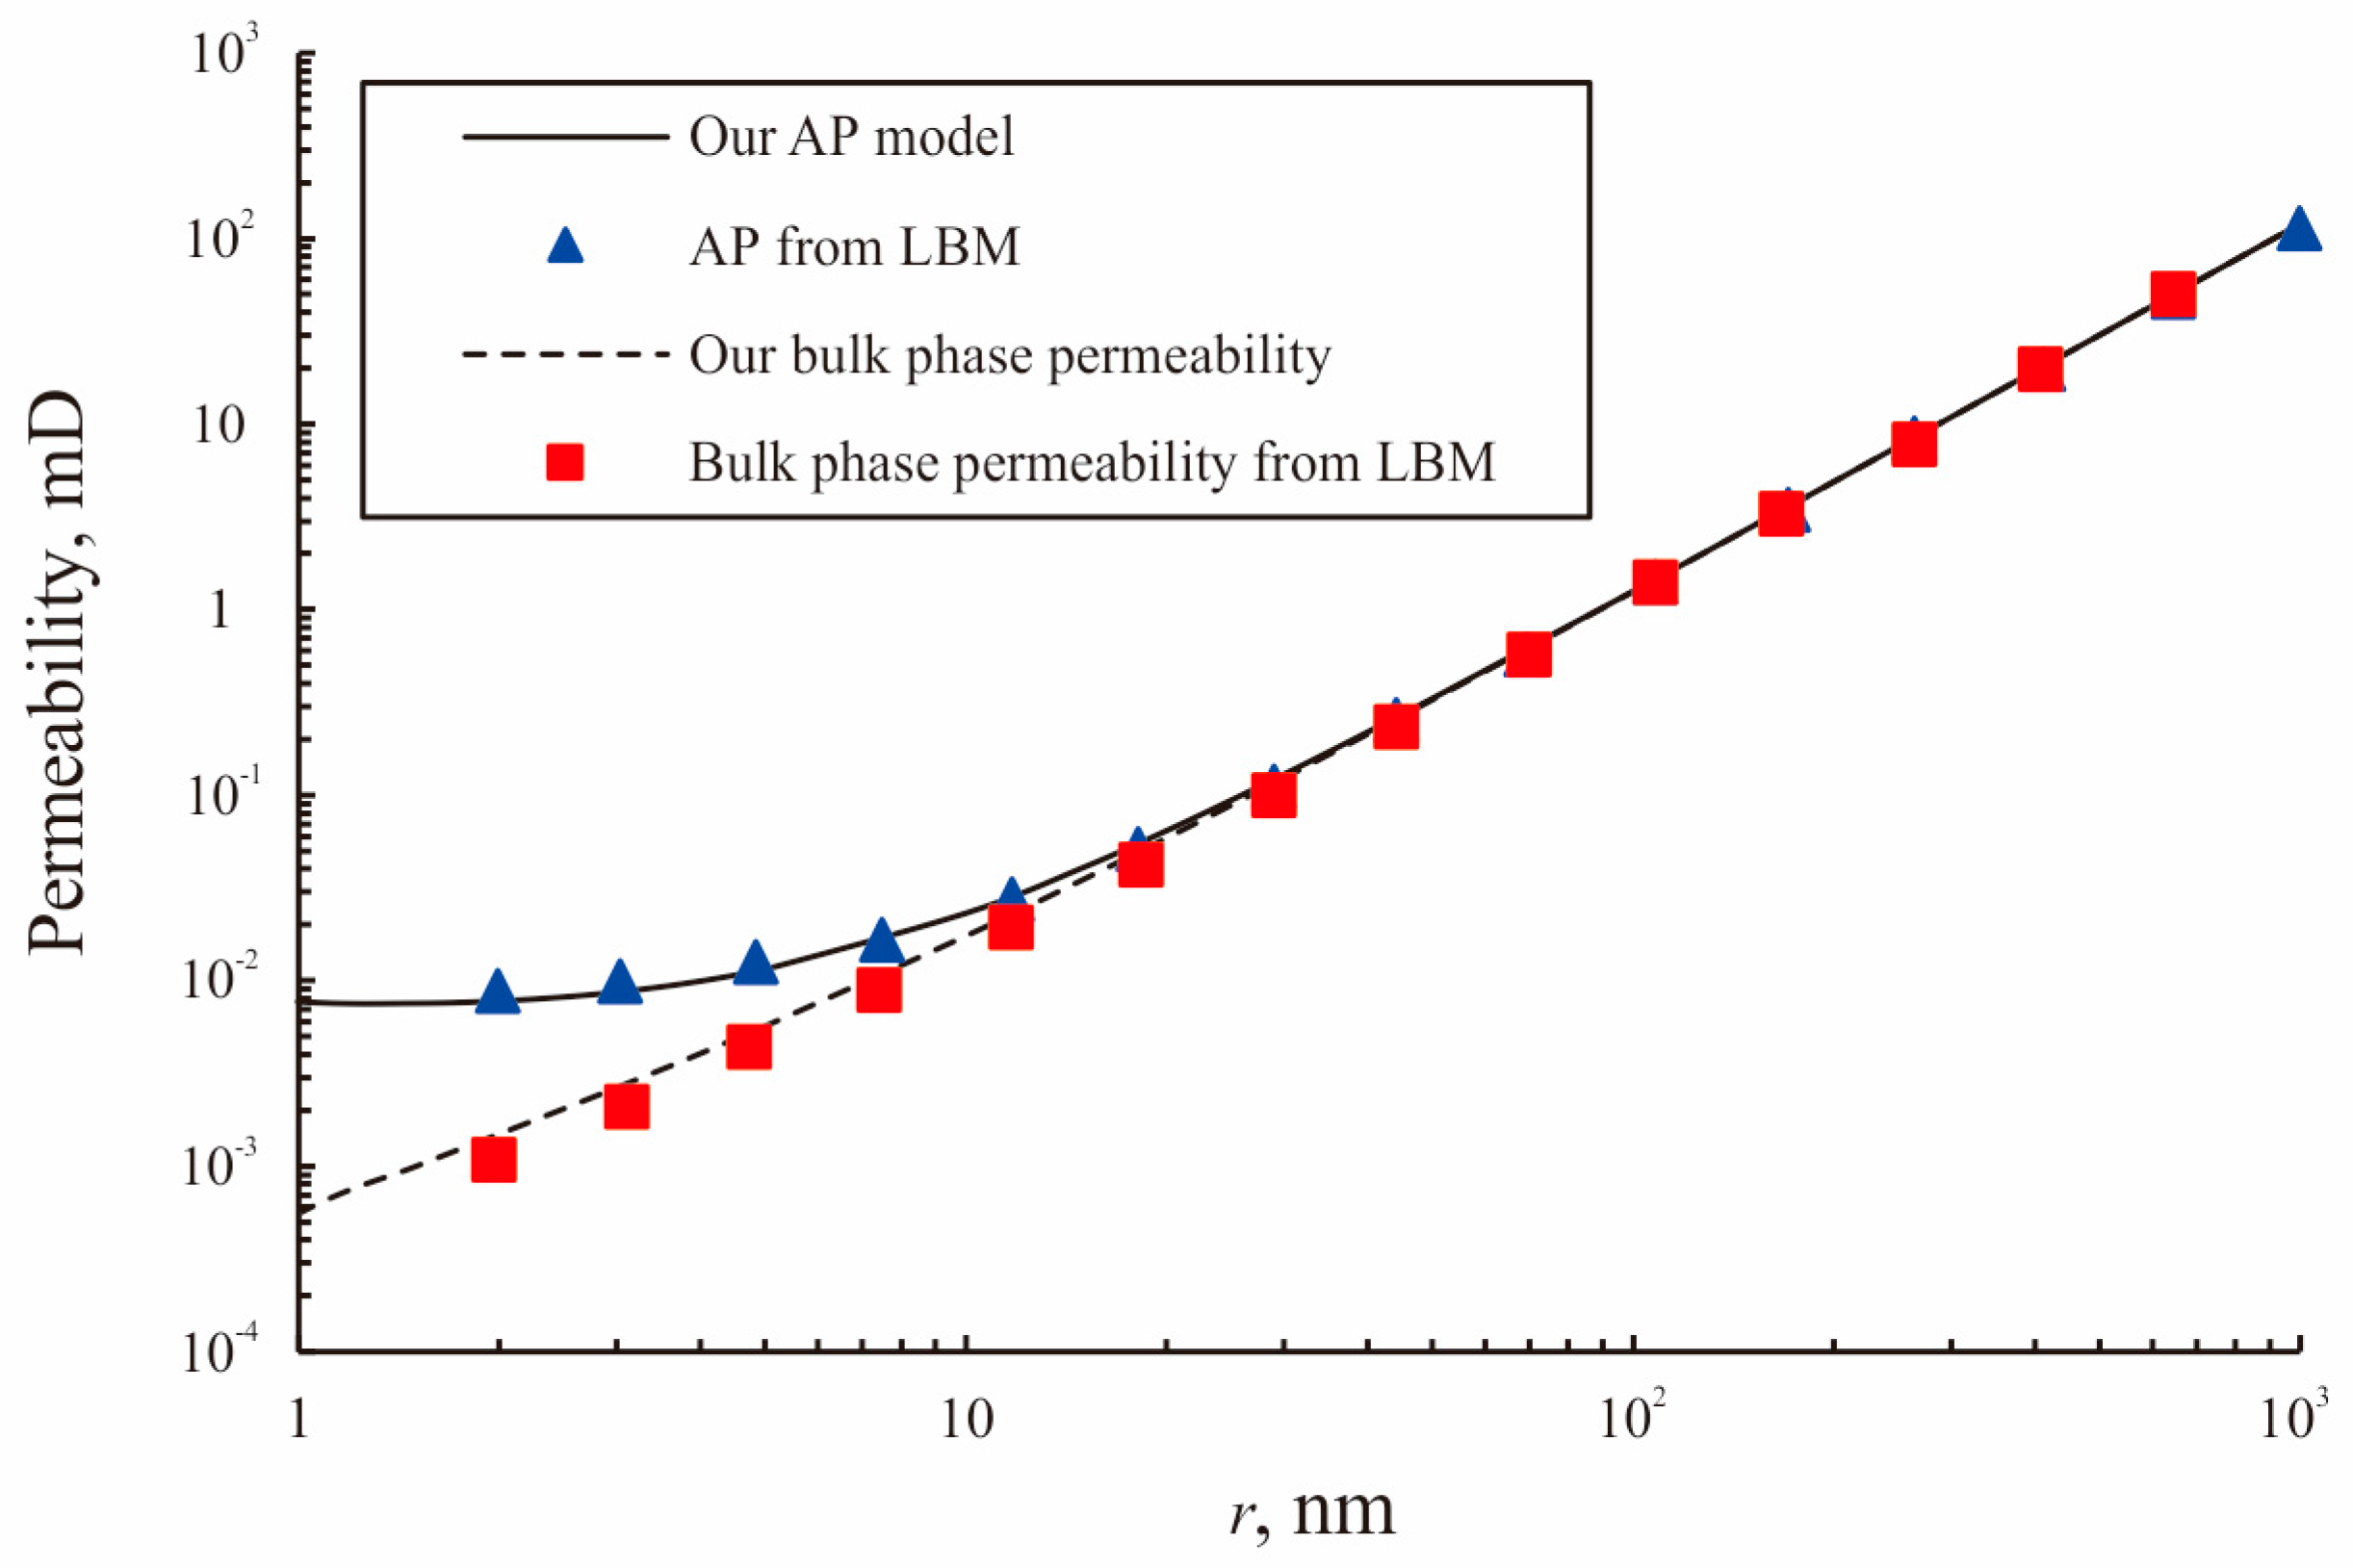
Further, the AP (considering bulk phase and adsorbed gas transporting) and bulk phase permeability (without considering surface diffusion) from our model (defining pore pressure
p = 2 MPa, formation temperature
T = 383 K,
ω = 0.2, reference pressure
pr = 0.1 MPa, pore stiffness parameter
m = 0.5, pore fractal dimension
Df = 2.6, and pore roughness
δ = 0.25) is compared with those from the generalized lattice Boltzmann model in Wang et al. [
72]. Clearly, both AP and bulk phase gas permeability match the Lattice Boltzmann method (LBM) results very well in different pore size conditions, as shown in
Figure 7. Surface diffusion plays an important role in small pores and throats, but it can be ignored when pore radius is larger than 20 nm in this condition.
Finally, model comparison was done for AP models to further validate the proposed model’s correctness. The calculated results from different models are shown in
Figure 8 (corresponding parameters used for comparison are presented in
Table 5). The model of Michel et al. [
73] describes only bulk phase gas transport and ignores adsorbed gas. Thus, the results are quite lower than those of other models and basically constant with pressure changes. Because both adsorbed gas and bulk phase gas are considered, the results from Xiong et al. [
64], Wasaki et al. [
9], and our UPM model display a similar changing trend; that is, an increase of
kapp/
kins as pressure decreases. However, our model results are similar to Xiong et al. [
64] at low pressures and tend to match those of Wasaki et al. [
9] as pressure increases. This is because inelastic gas–solid collisions, thermodynamic phase changes due to pore confinement, the dynamic hindering effect of adsorbed gas, real gas effects, and geomechanical effects are simultaneously considered in our model. Besides, Knudsen diffusion and the slippage effect were discussed separately in our model, whereas in the other two models they are treated by a modification function of Knudsen number
Kn. Furthermore, surface diffusion is influenced in real time by pressure and temperature in our model, whereas constant diffusion coefficients were chosen for whole production time in the other two models. All these factors led to the different decreasing trend of AP models in
Figure 8.
4. Results and Discussion
In this section, the parameters sensitivity analysis will be done in different conditions, including the influences of pore radius, pressure, temperature, effective stress, and other parameters on the flux of each fluid flow mechanism; that is, viscous flow, Knudsen diffusion, and surface diffusion. Corresponding parameters used in our model are listed in
Table 6.
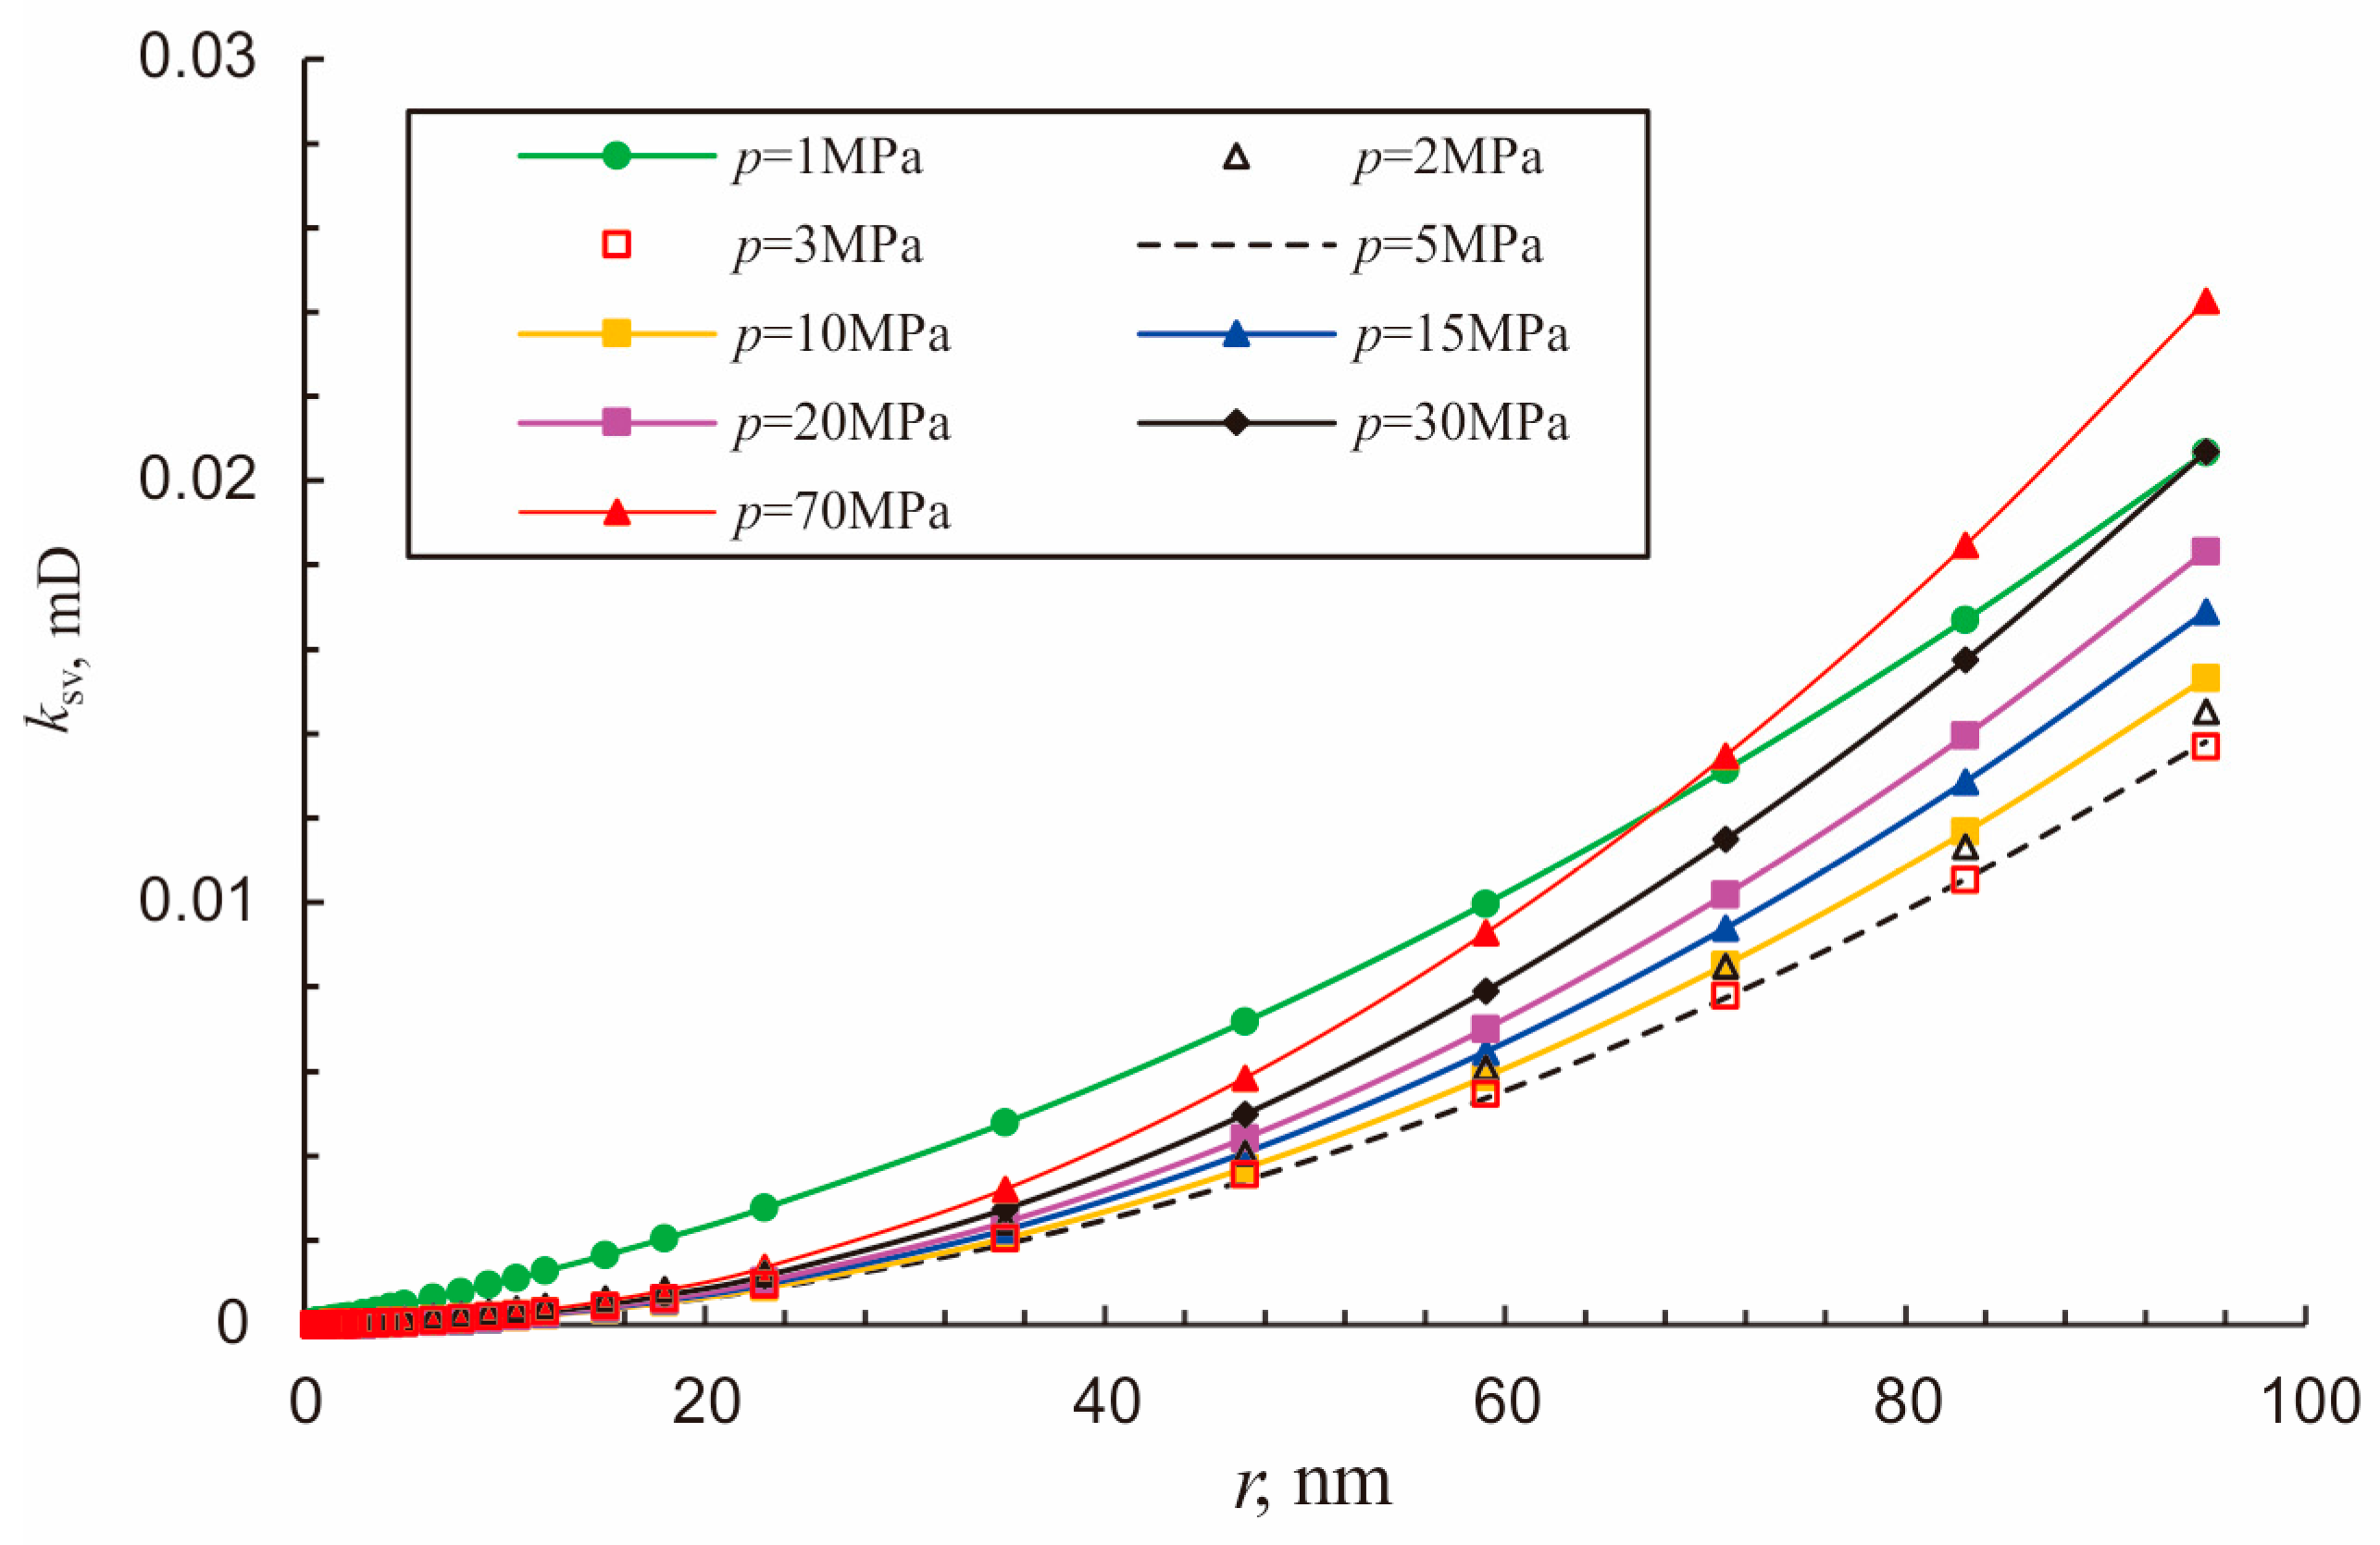
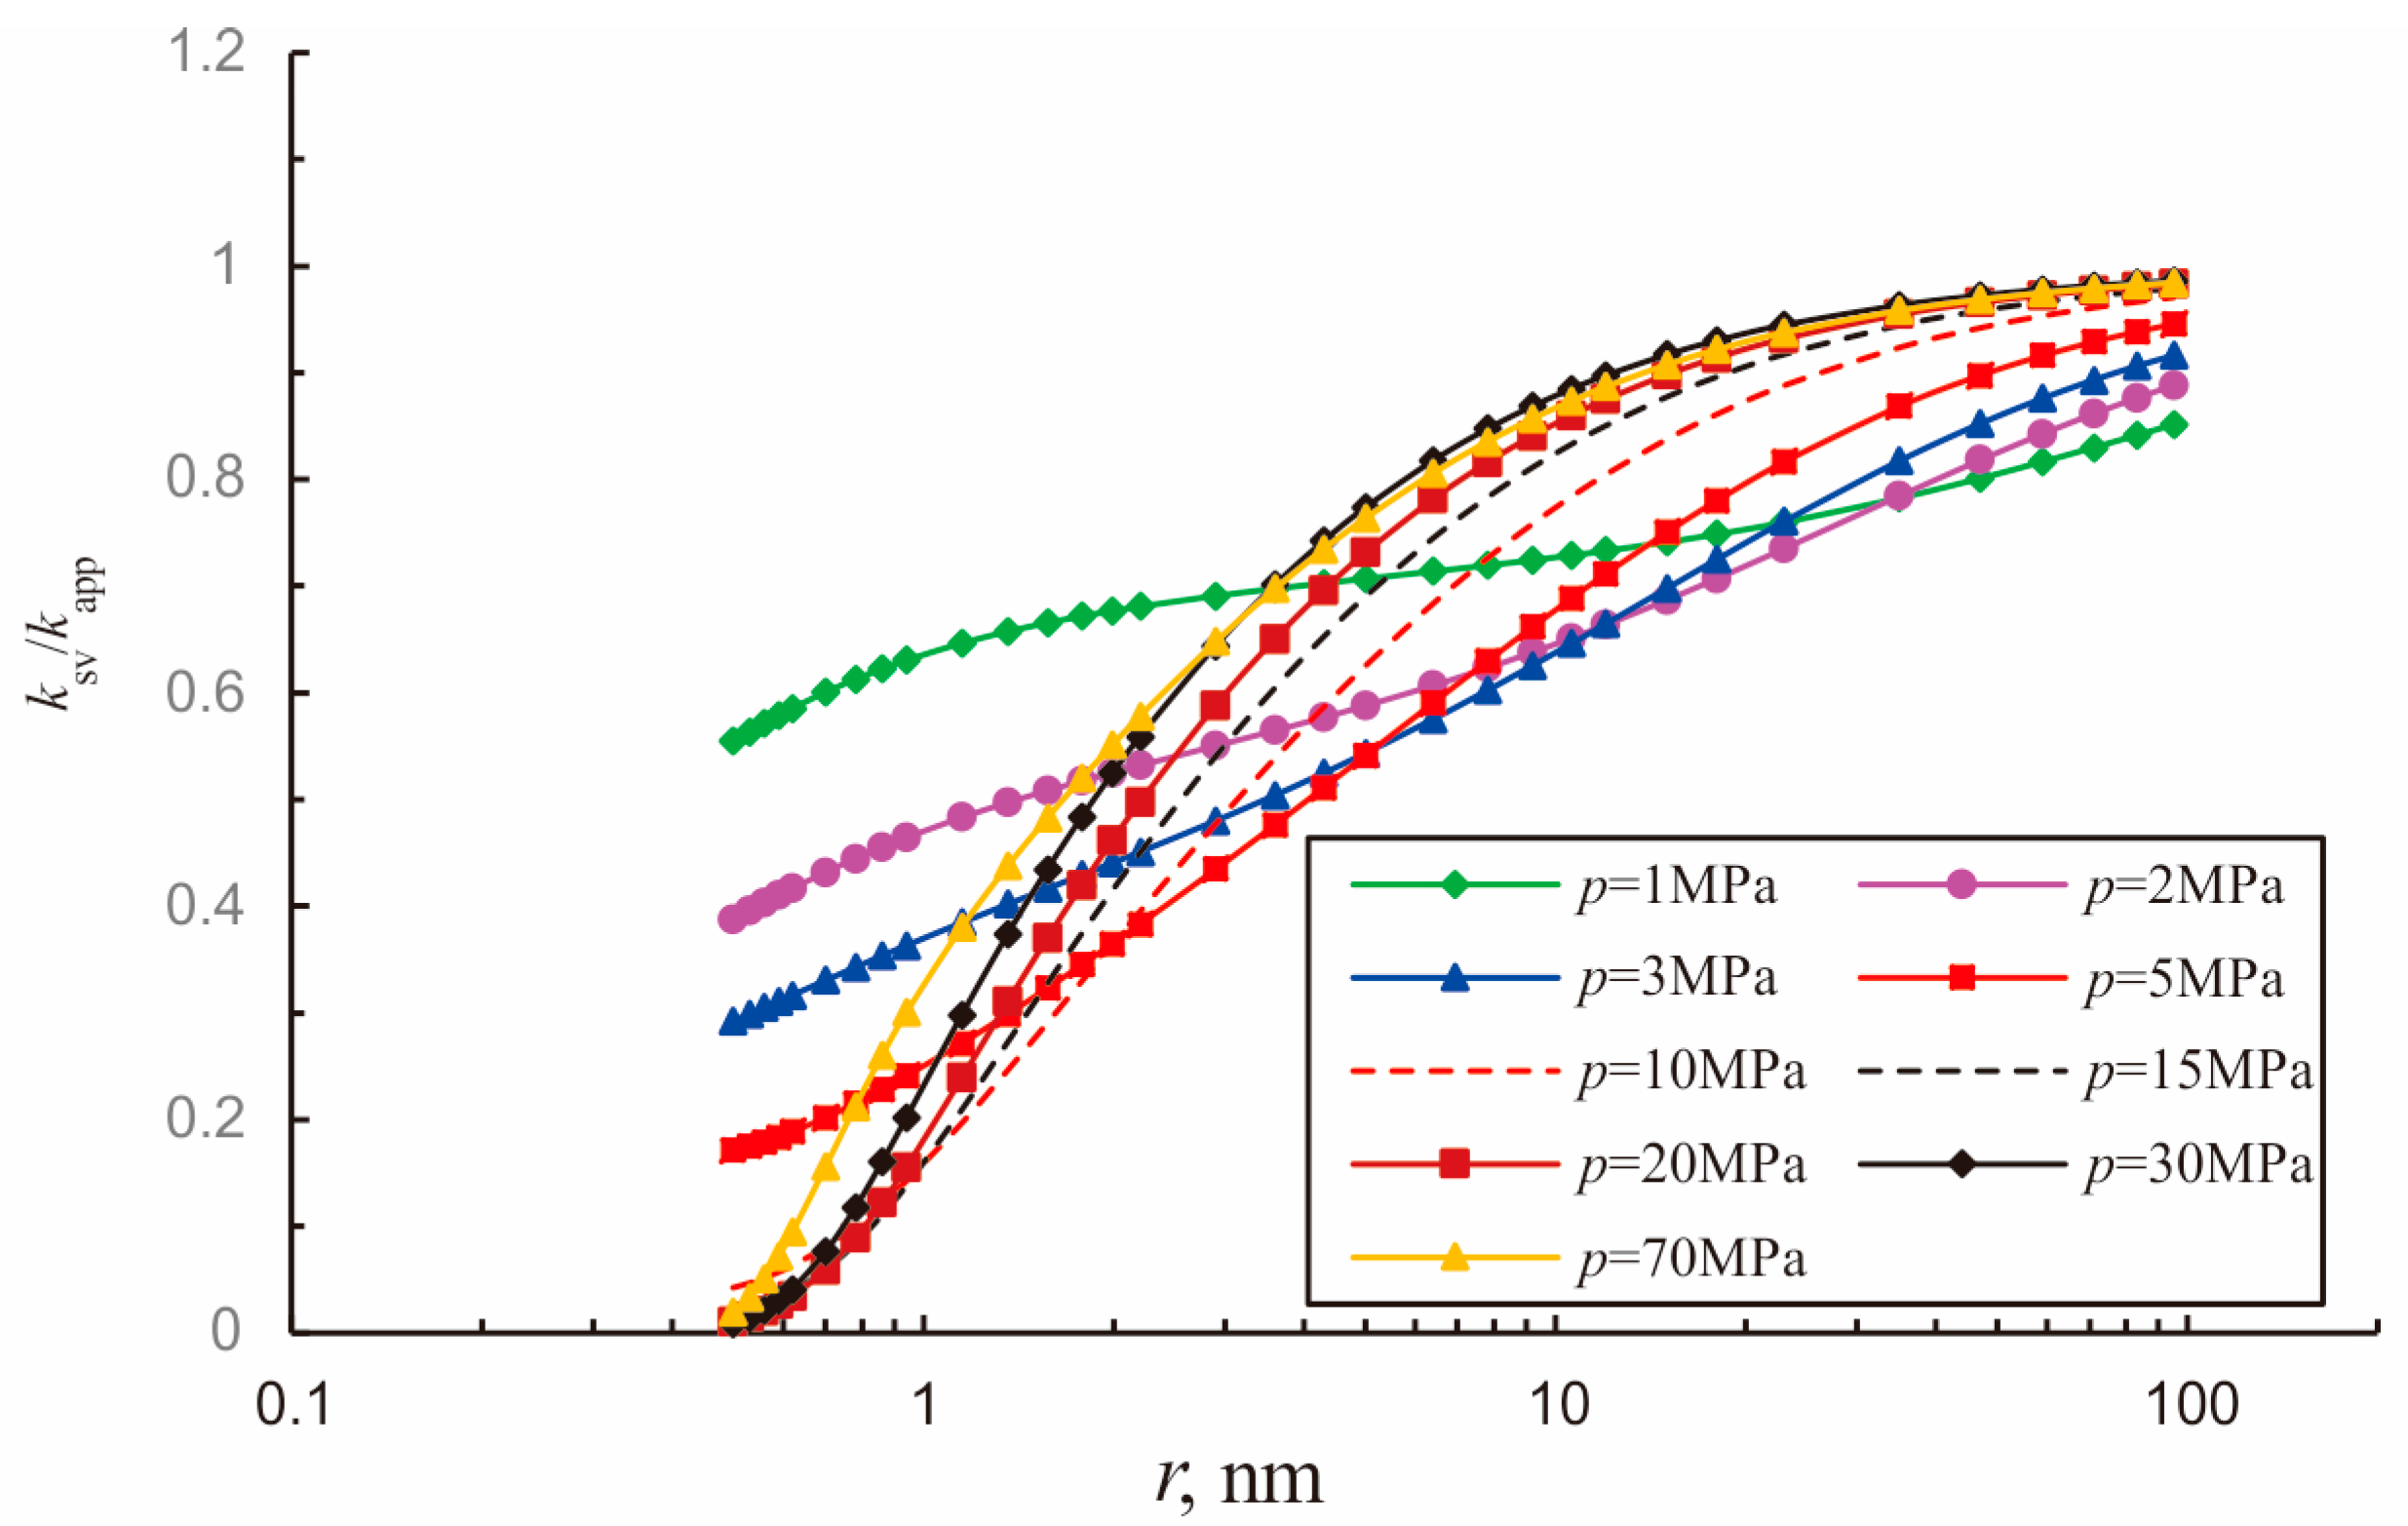
With an increase in pore radius, slip flow permeability (
Figure 9) as well as its contribution to total flux (
Figure 10) also increases. In large pores (
r > 20 nm) with pressures larger than 5 MPa, the effect of stress dependence is more obvious than that of the slippage effect. Thus, during the depressurization production, the slip permeability becomes less and less as effective stress increases. In small pores, the slippage effect dominates compared to stress dependence, and the slippage permeability increases as the pore pressure decreases. When the pore pressure is small enough, the permeability enhancement of the slippage effect is stronger than the permeability abatement of stress dependence in all pores, as shown in
Figure 9.
Figure 10 shows that the contribution of slip flow increases with an increase in pore radius, and the increasing trend is faster in high-pressure and small pore radius conditions. In small pores, low pressure condition has a larger contribution than high pressure, while high pressure has a bigger contribution than small pressure in large pores. The slip flow contribution increases as pressure increases in pores with radii larger than 30 nm, although it displays complex changing rules in pores with radii smaller than 10 nm.
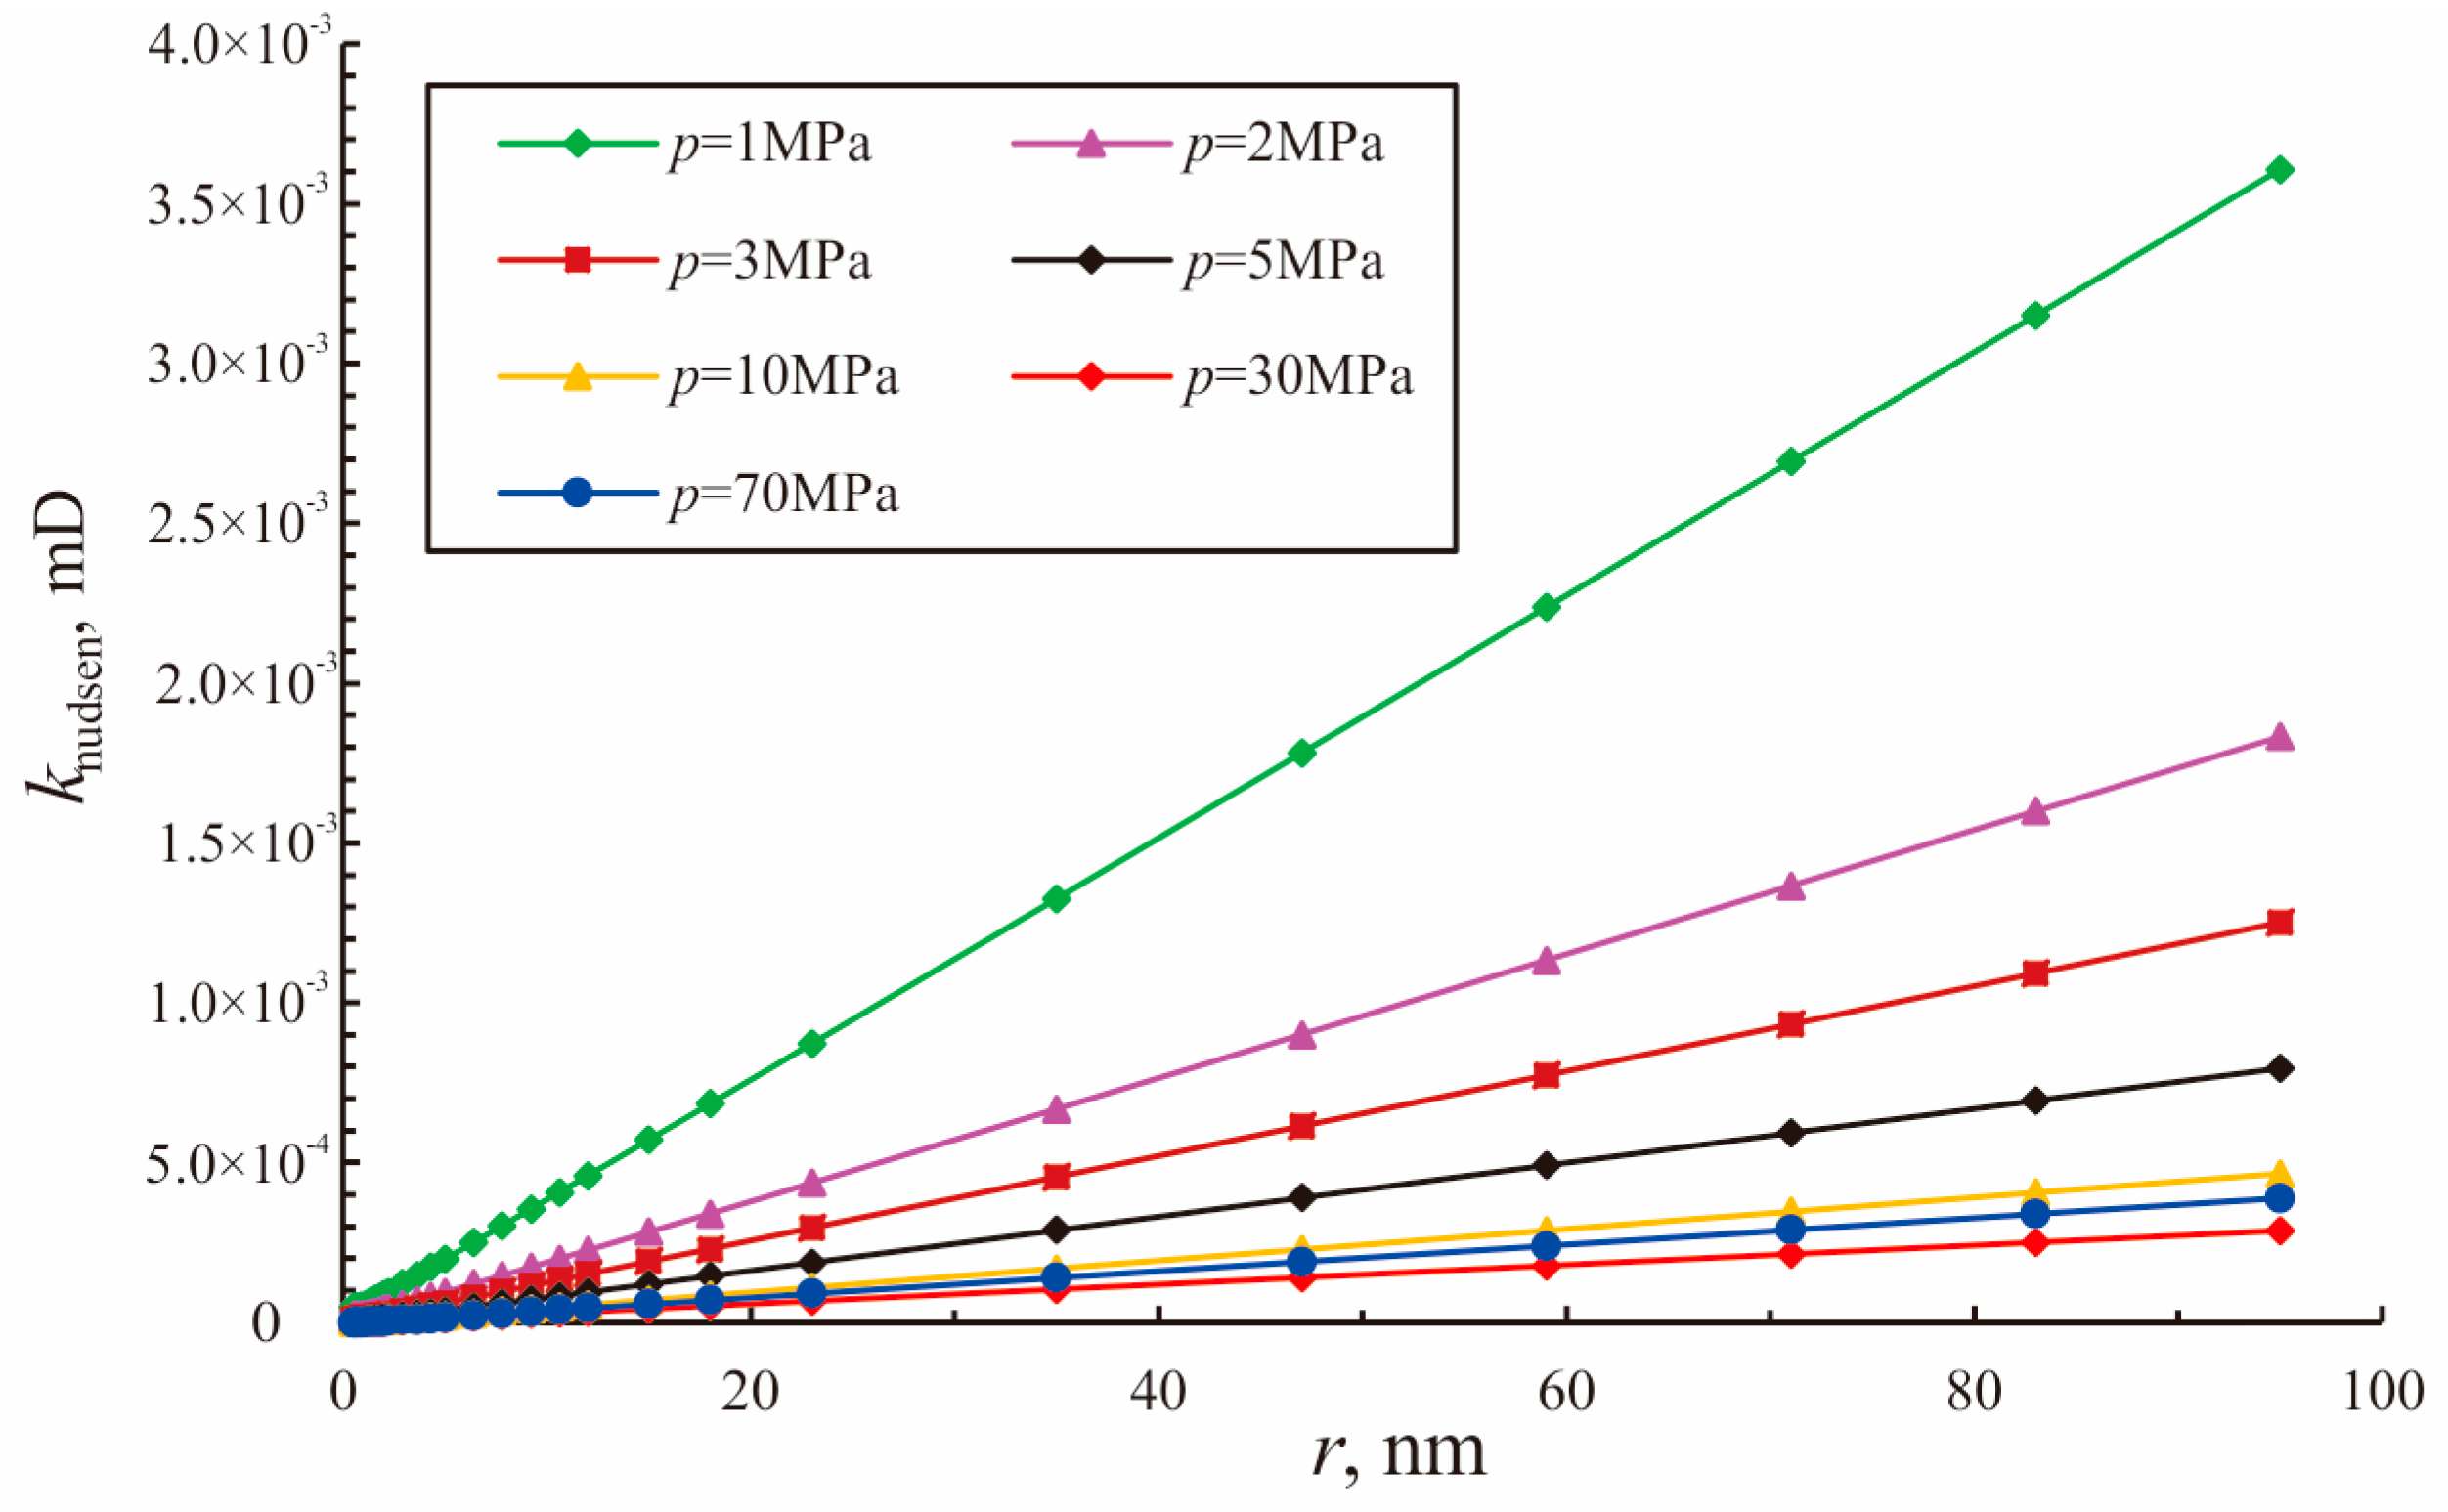
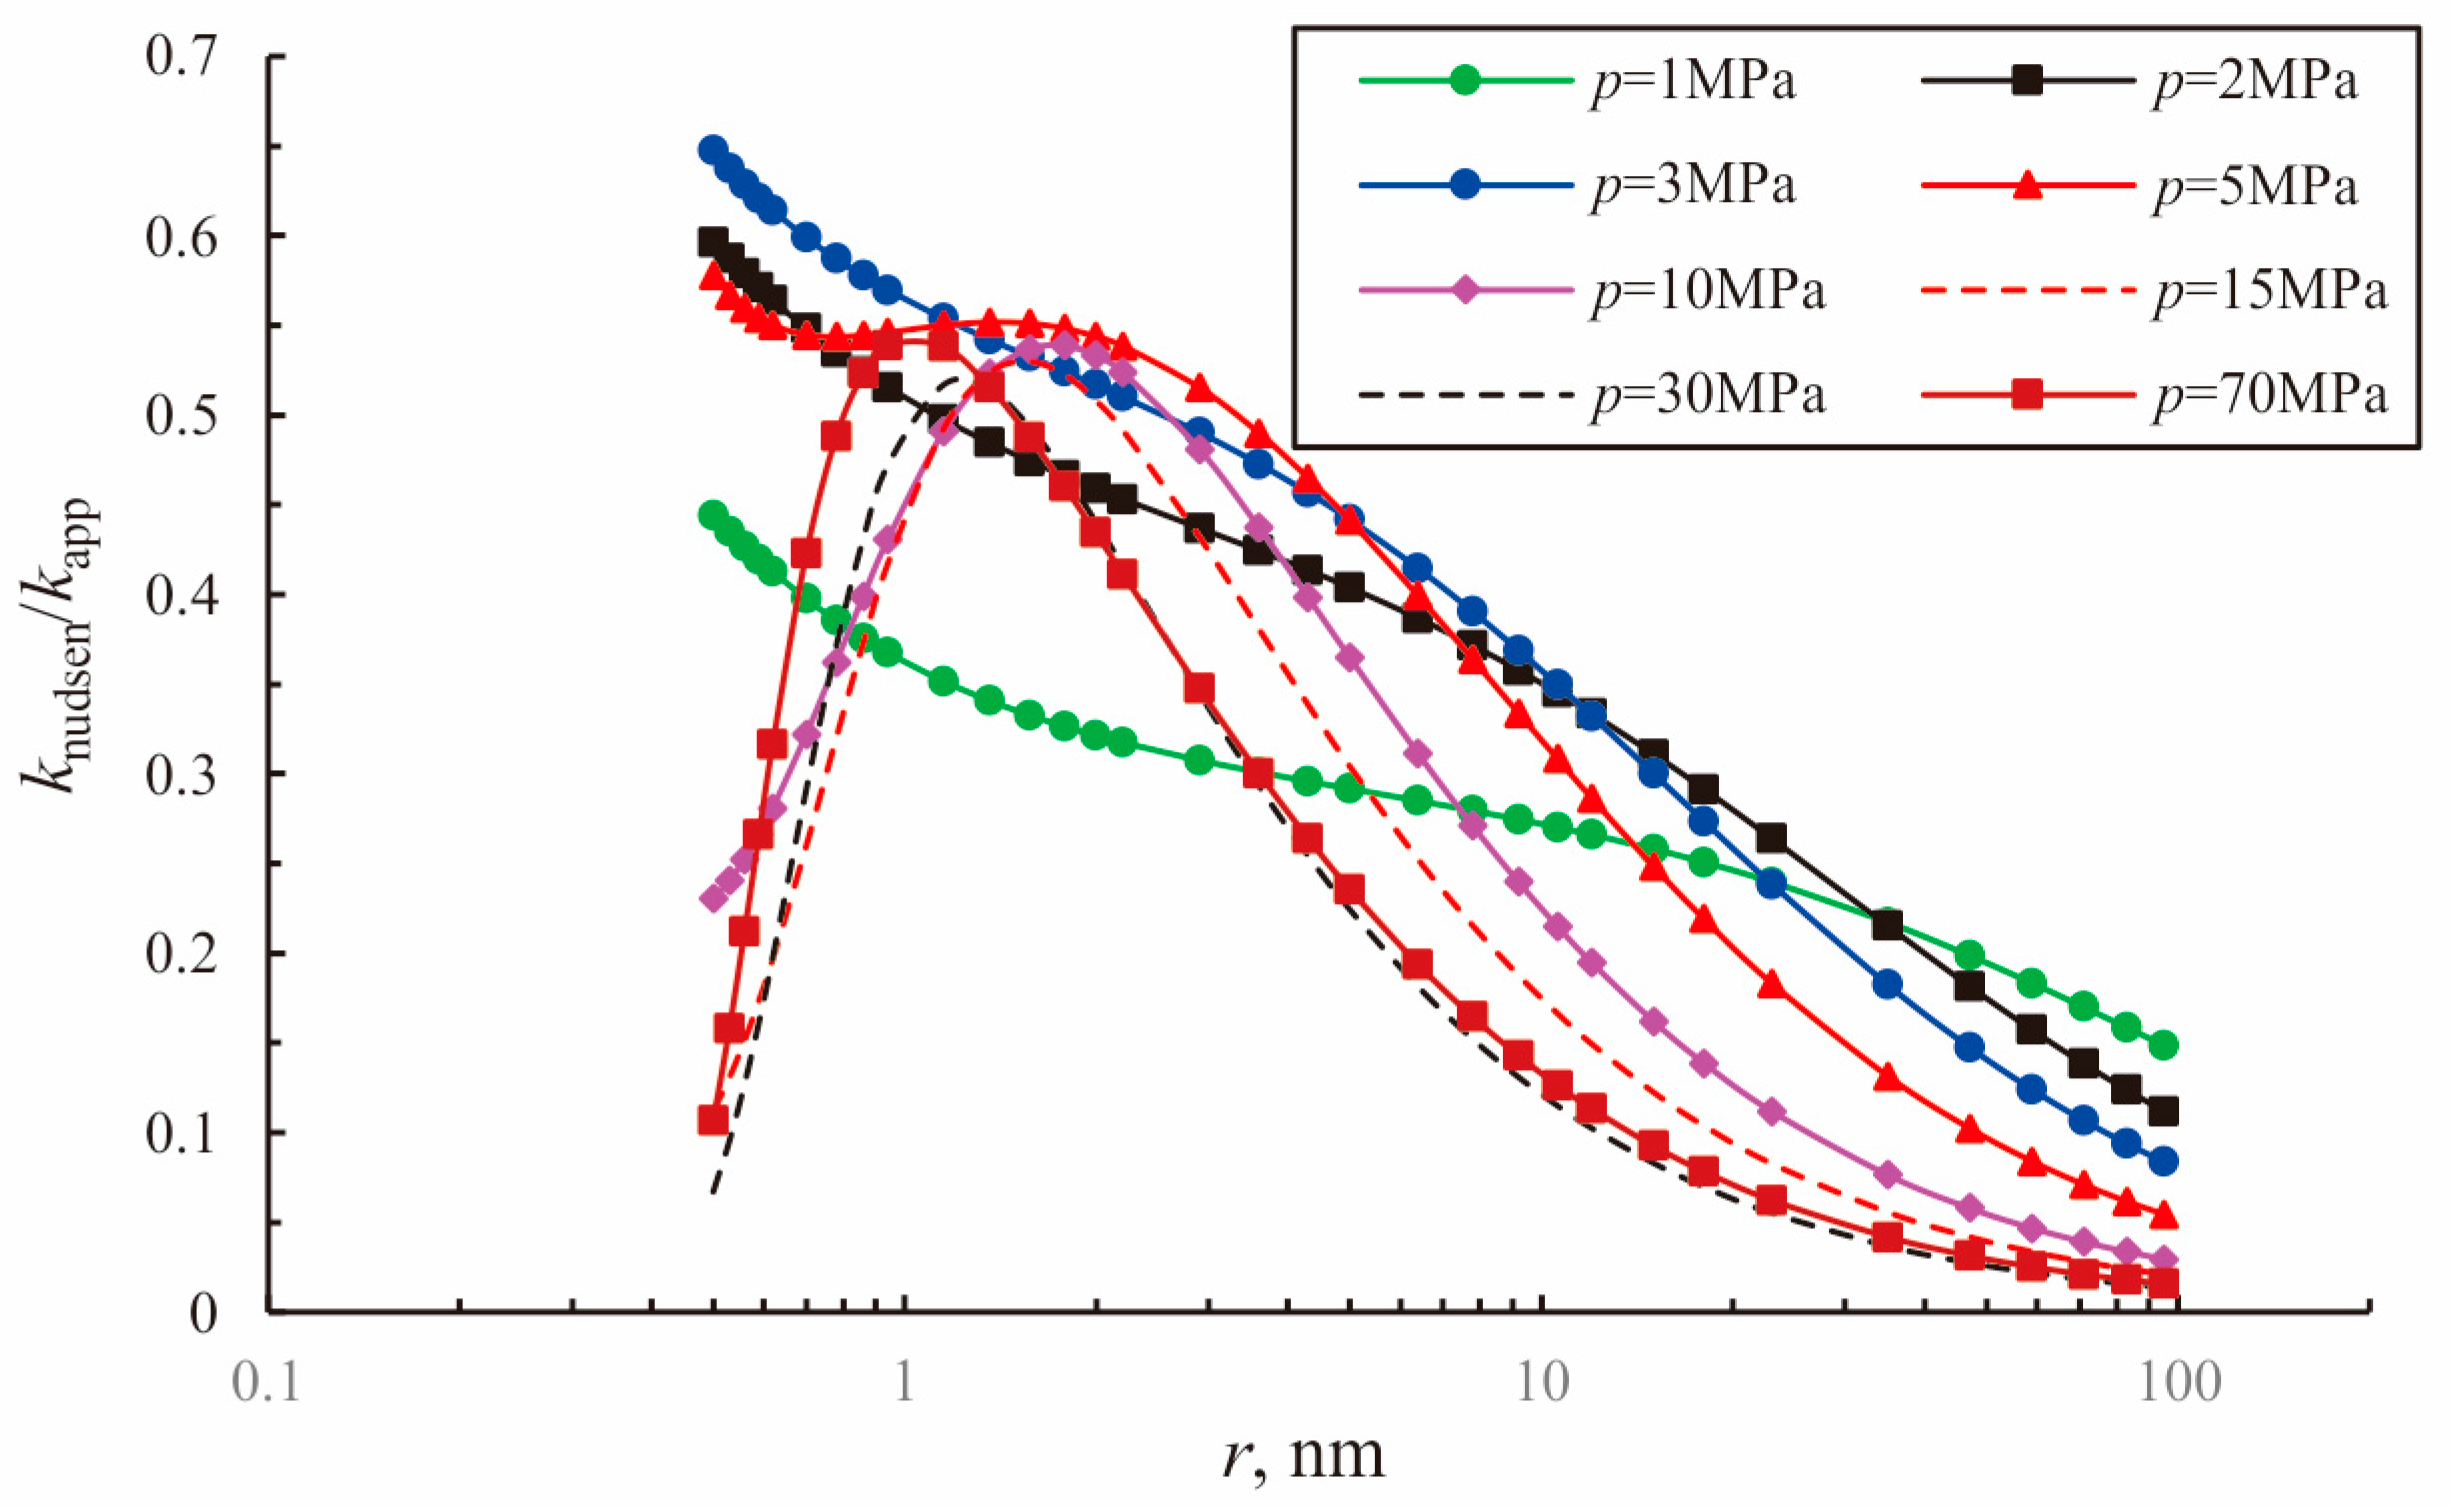
Knudsen diffusion becomes stronger with an increase in pore radius and a decrease in pressure (
Figure 11). This is because the equivalent permeability of Knudsen diffusion is influenced mainly by the Knudsen diffusion coefficient in a certain pressure and temperature condition. For a constant pore radius, Knudsen diffusion increases with the decrease in pore pressure. Although gas viscosity increased as pressure increases, Knudsen diffusion permeability
knudsen is more influenced by compressibility coefficient
cg, the two of which have a nearly inverse proportion relation. The contribution of Knudsen diffusion to total flux is very complex in small pores, as shown in
Figure 12. Generally, that contribution decreases with pore radius in low-pressure conditions (
p < 5 MPa), whereas it increases rapidly at first and slowly decreases later in high-pressure conditions (
p > 10 MPa).
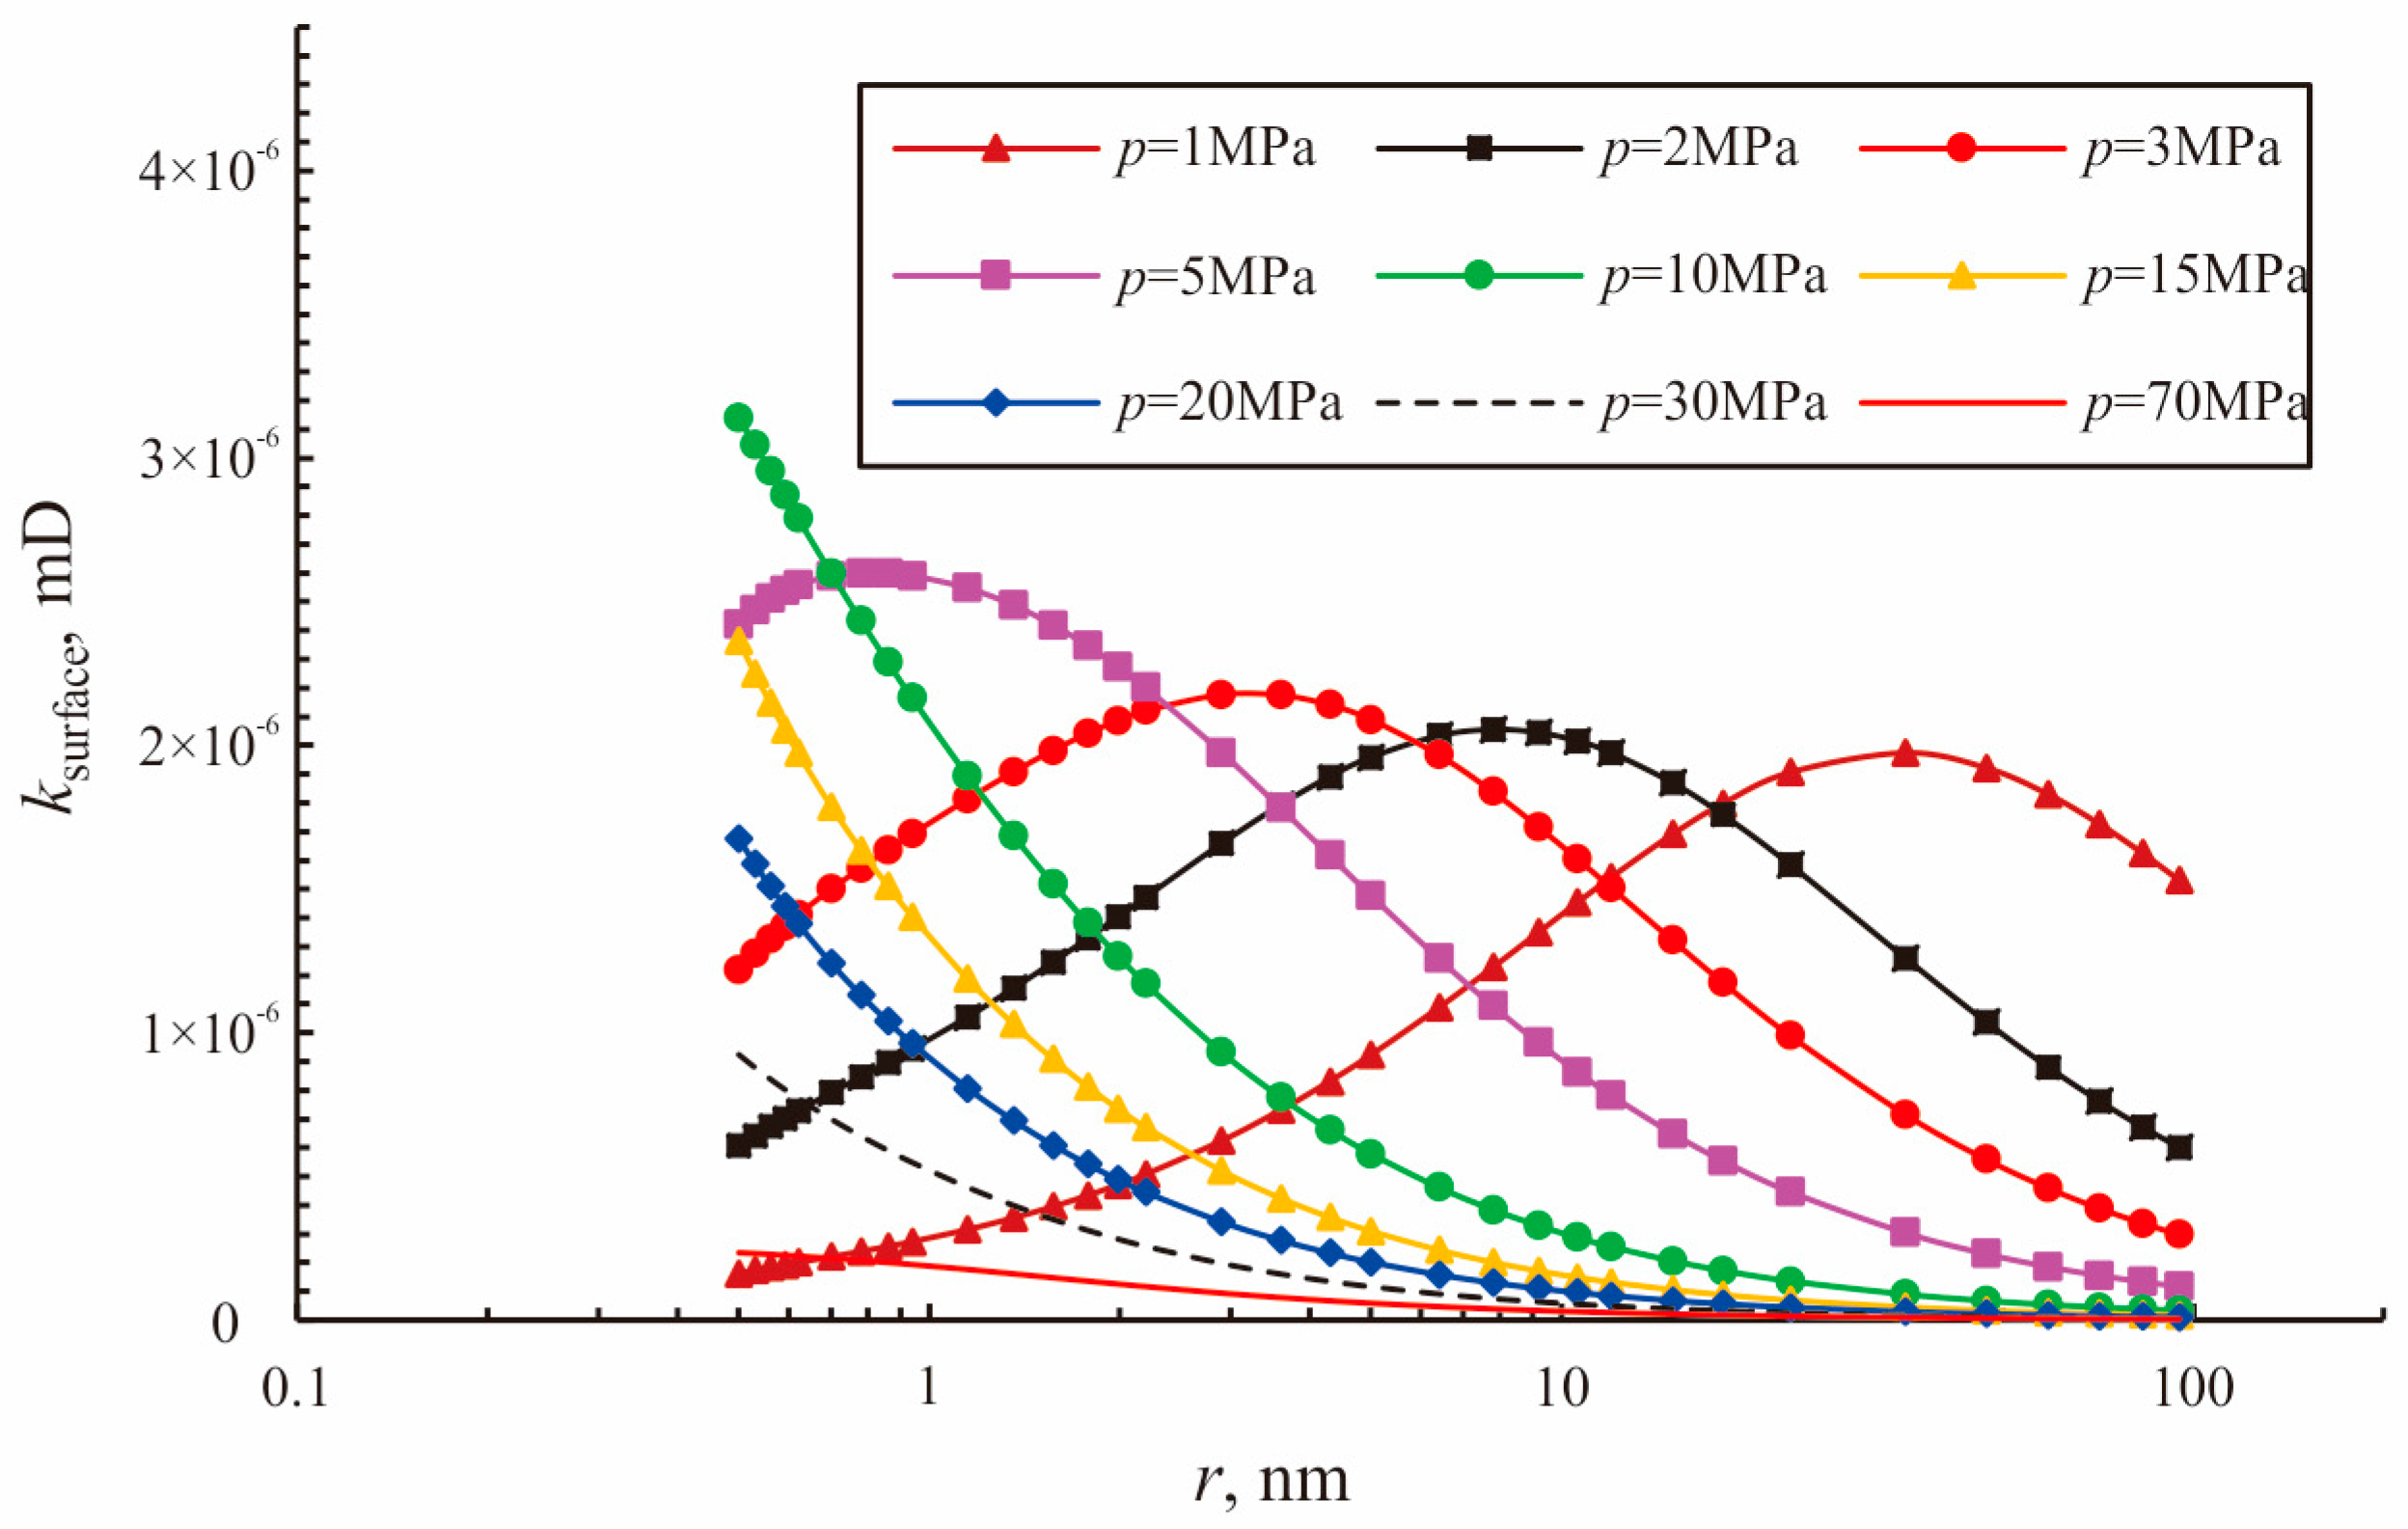
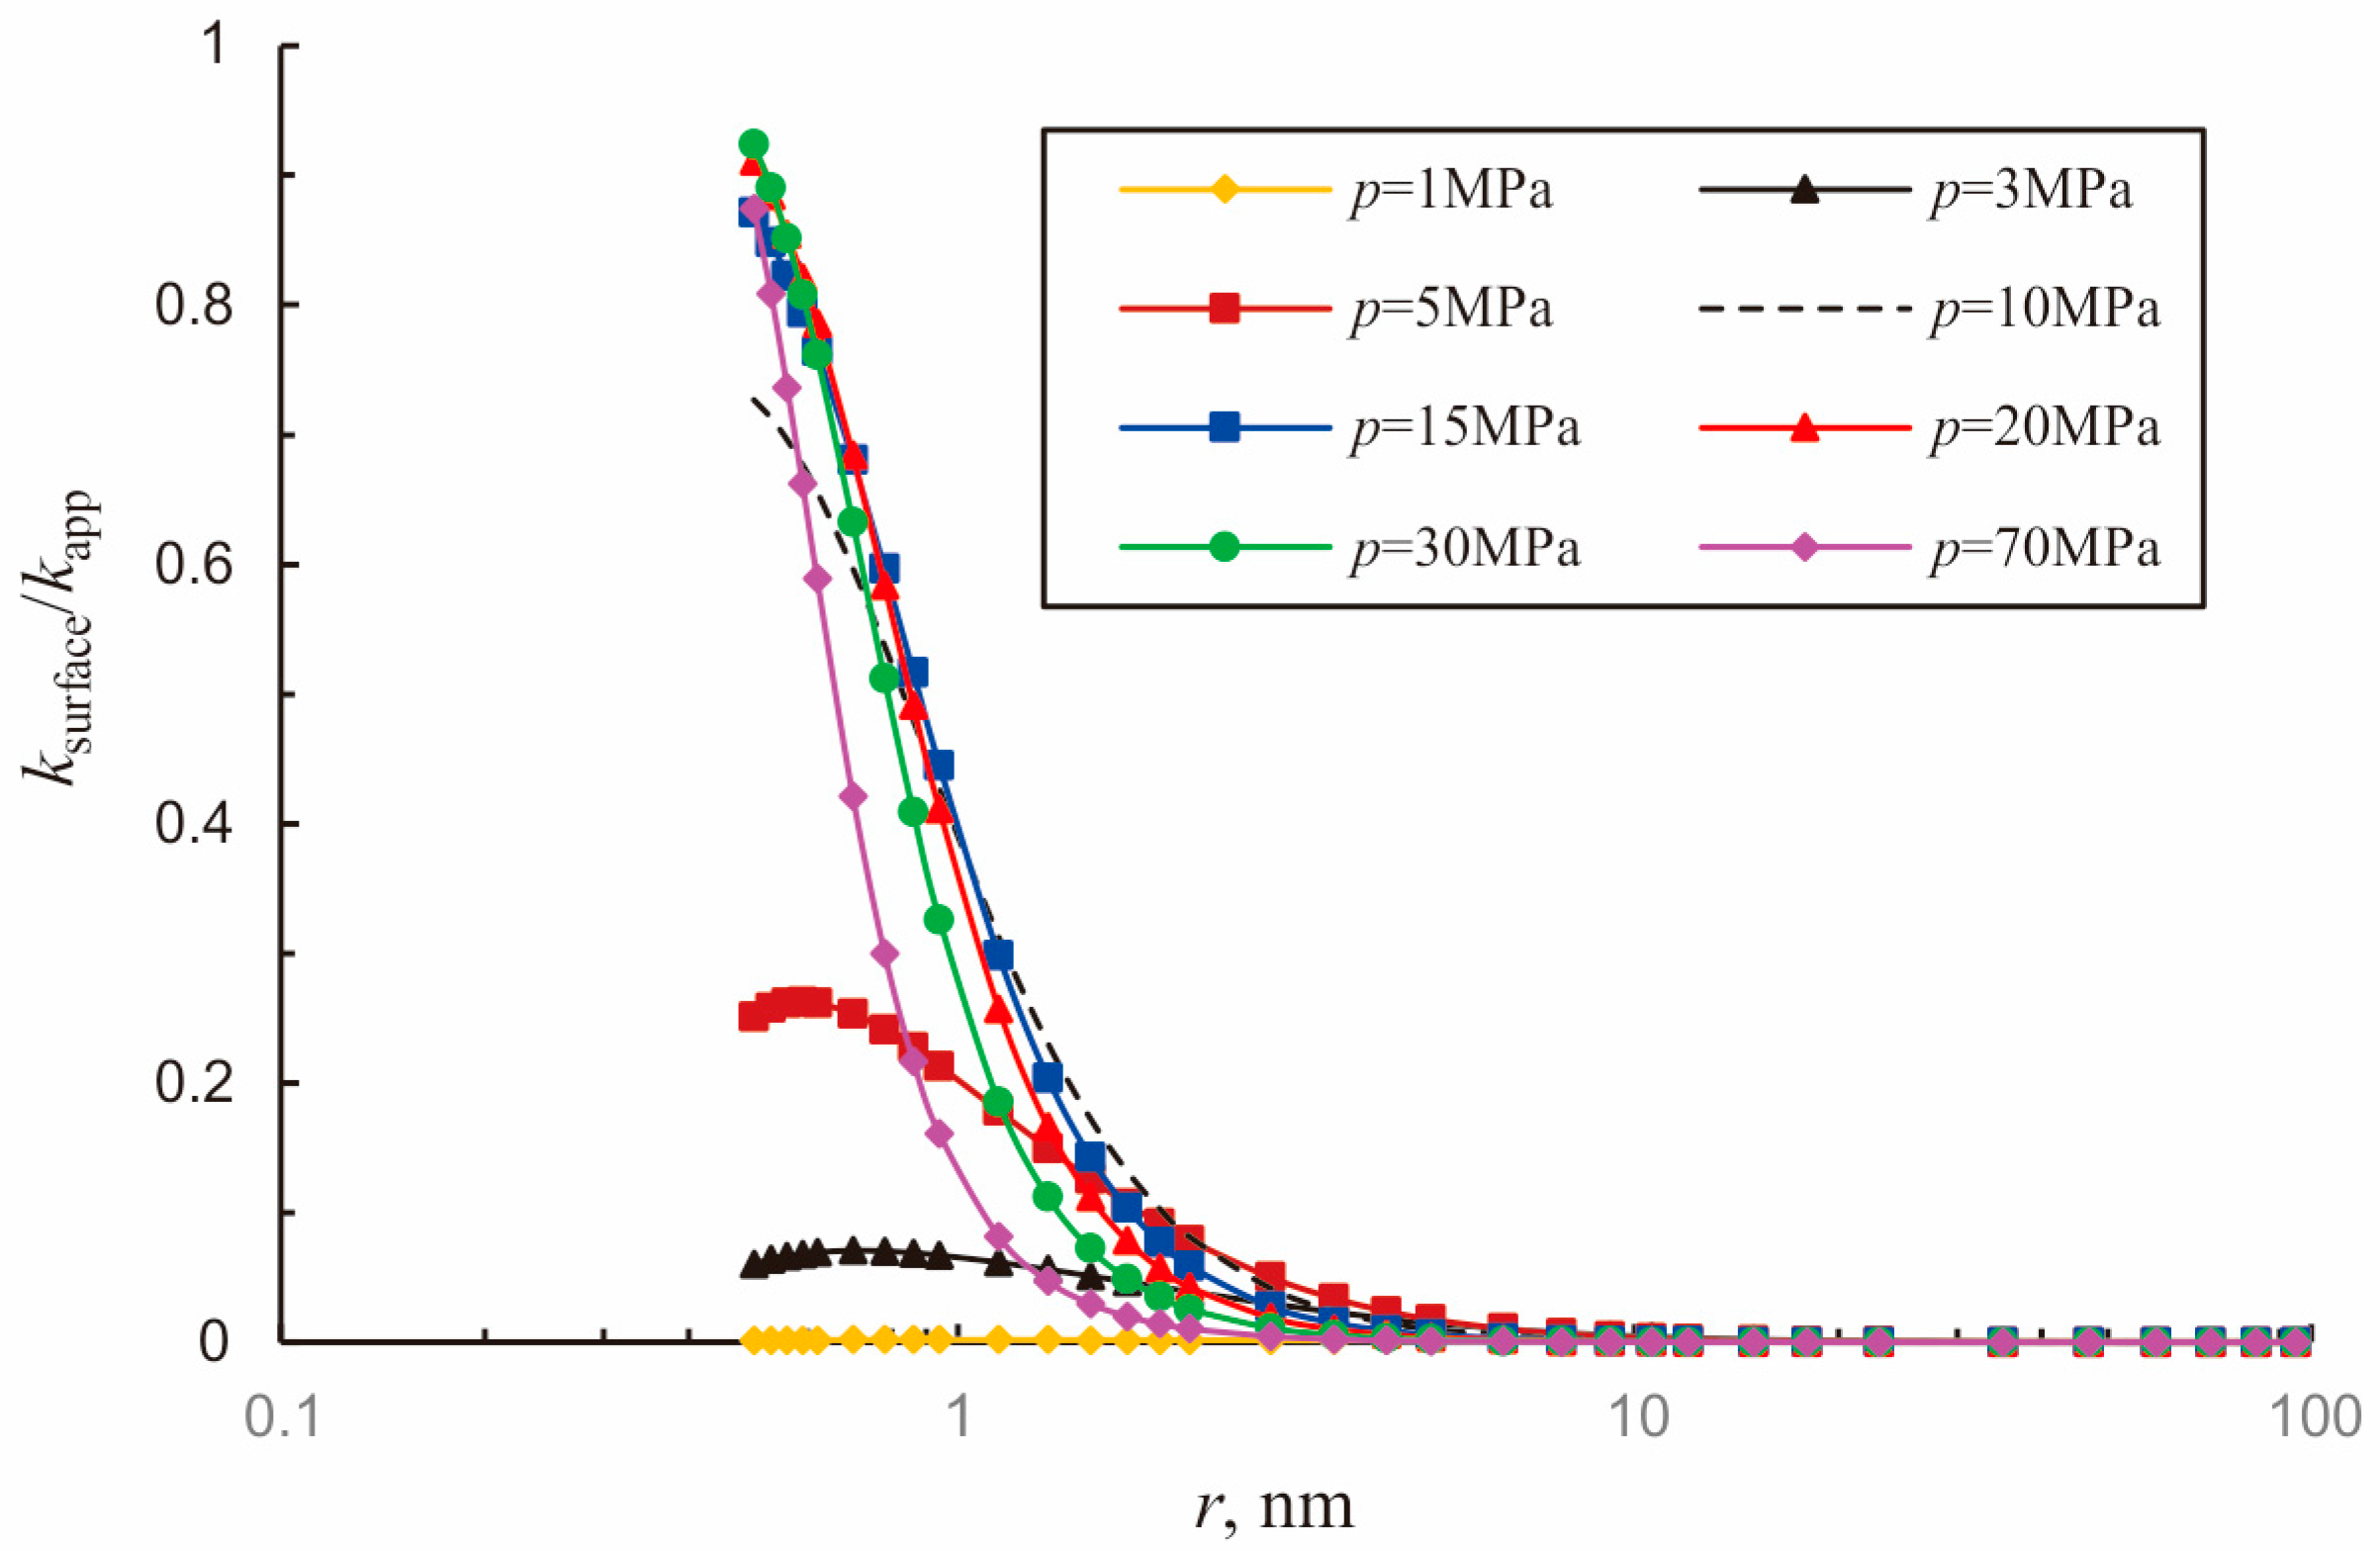
The change of surface diffusion with pore radius in high-pressure (
p > 10 MPa) conditions is quite different from that in low-pressure (
p < 5 MPa) conditions (
Figure 13). It increases at first and decreases later as pore radius increases in low-pressure conditions, whereas it has a persistent decrease under high pressure. Actually, the detailed changing trend of surface diffusion intensity is not important, because its contribution is quite limited in large pore radii (
r > 3 nm), no matter whether the value is low or high (
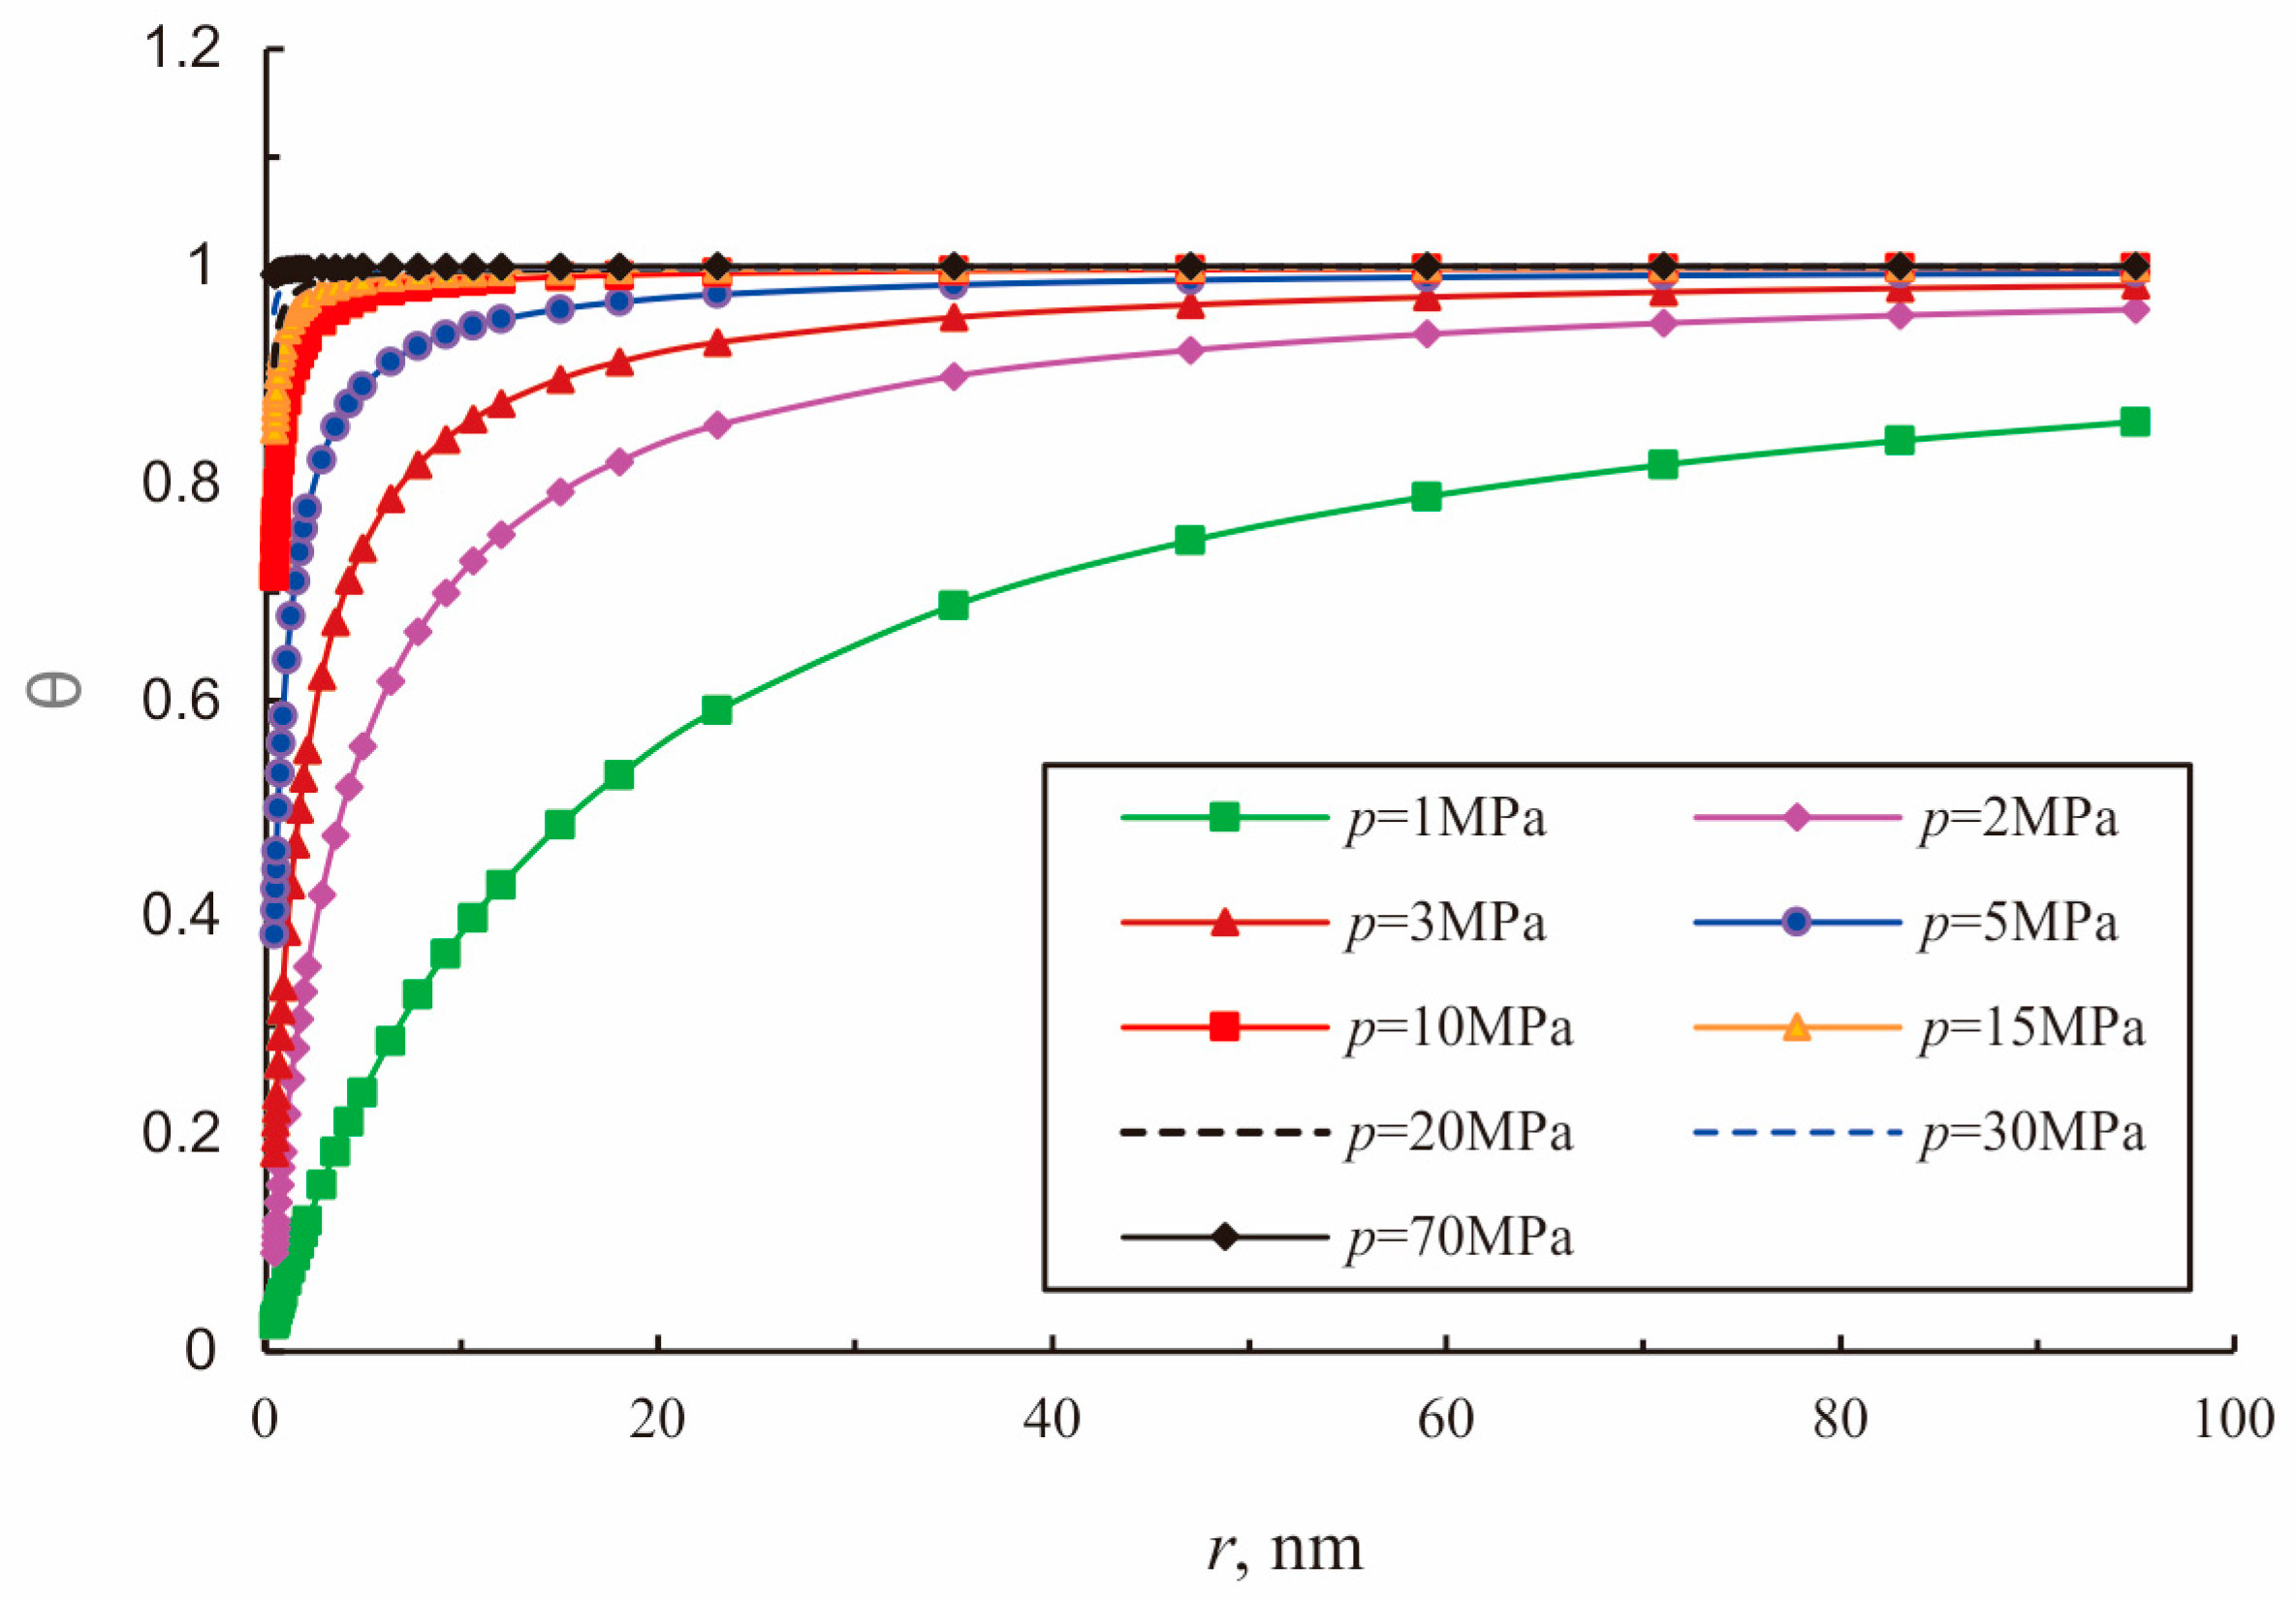
Figure 14). However, its contribution to total flux is prominent in small pores. This is because it is advantageous for the occurrence of surface diffusion in small pores, when the porosity of PM is a constant. Meanwhile, the contribution of surface diffusion can be ignored in low-pressure conditions, although pore radii are small enough for the occurrence of surface diffusion. This is because adsorbed gas concentration is a function of the gas coverage ratio, which is very small in low-pressure conditions (
Figure 15) and weakens the occurrence of surface diffusion.
Generally, non-Darcy flow mechanisms are dominant mainly in low-pressure and small pore radius conditions (
Figure 16). With an increase in pore radii, the influence of the non-Darcy flow weakens and the flow tends to be viscous flow only.
For gas flow in pores with radii greater than 0.7 nm, the non-Darcy flow becomes more and more obvious during depressurization production. However, in contrast with previous studies, for gas flow in pores with radii less than 0.7 nm, with pressure decreasing, the non-Darcy flow effect is stronger at first, and then weakens abruptly. This is because surface diffusion dominates the flow in small pores when the pressure is larger than 10 MPa, but plays only a slight role when the pressure is less than 10 MPa (
Figure 14).
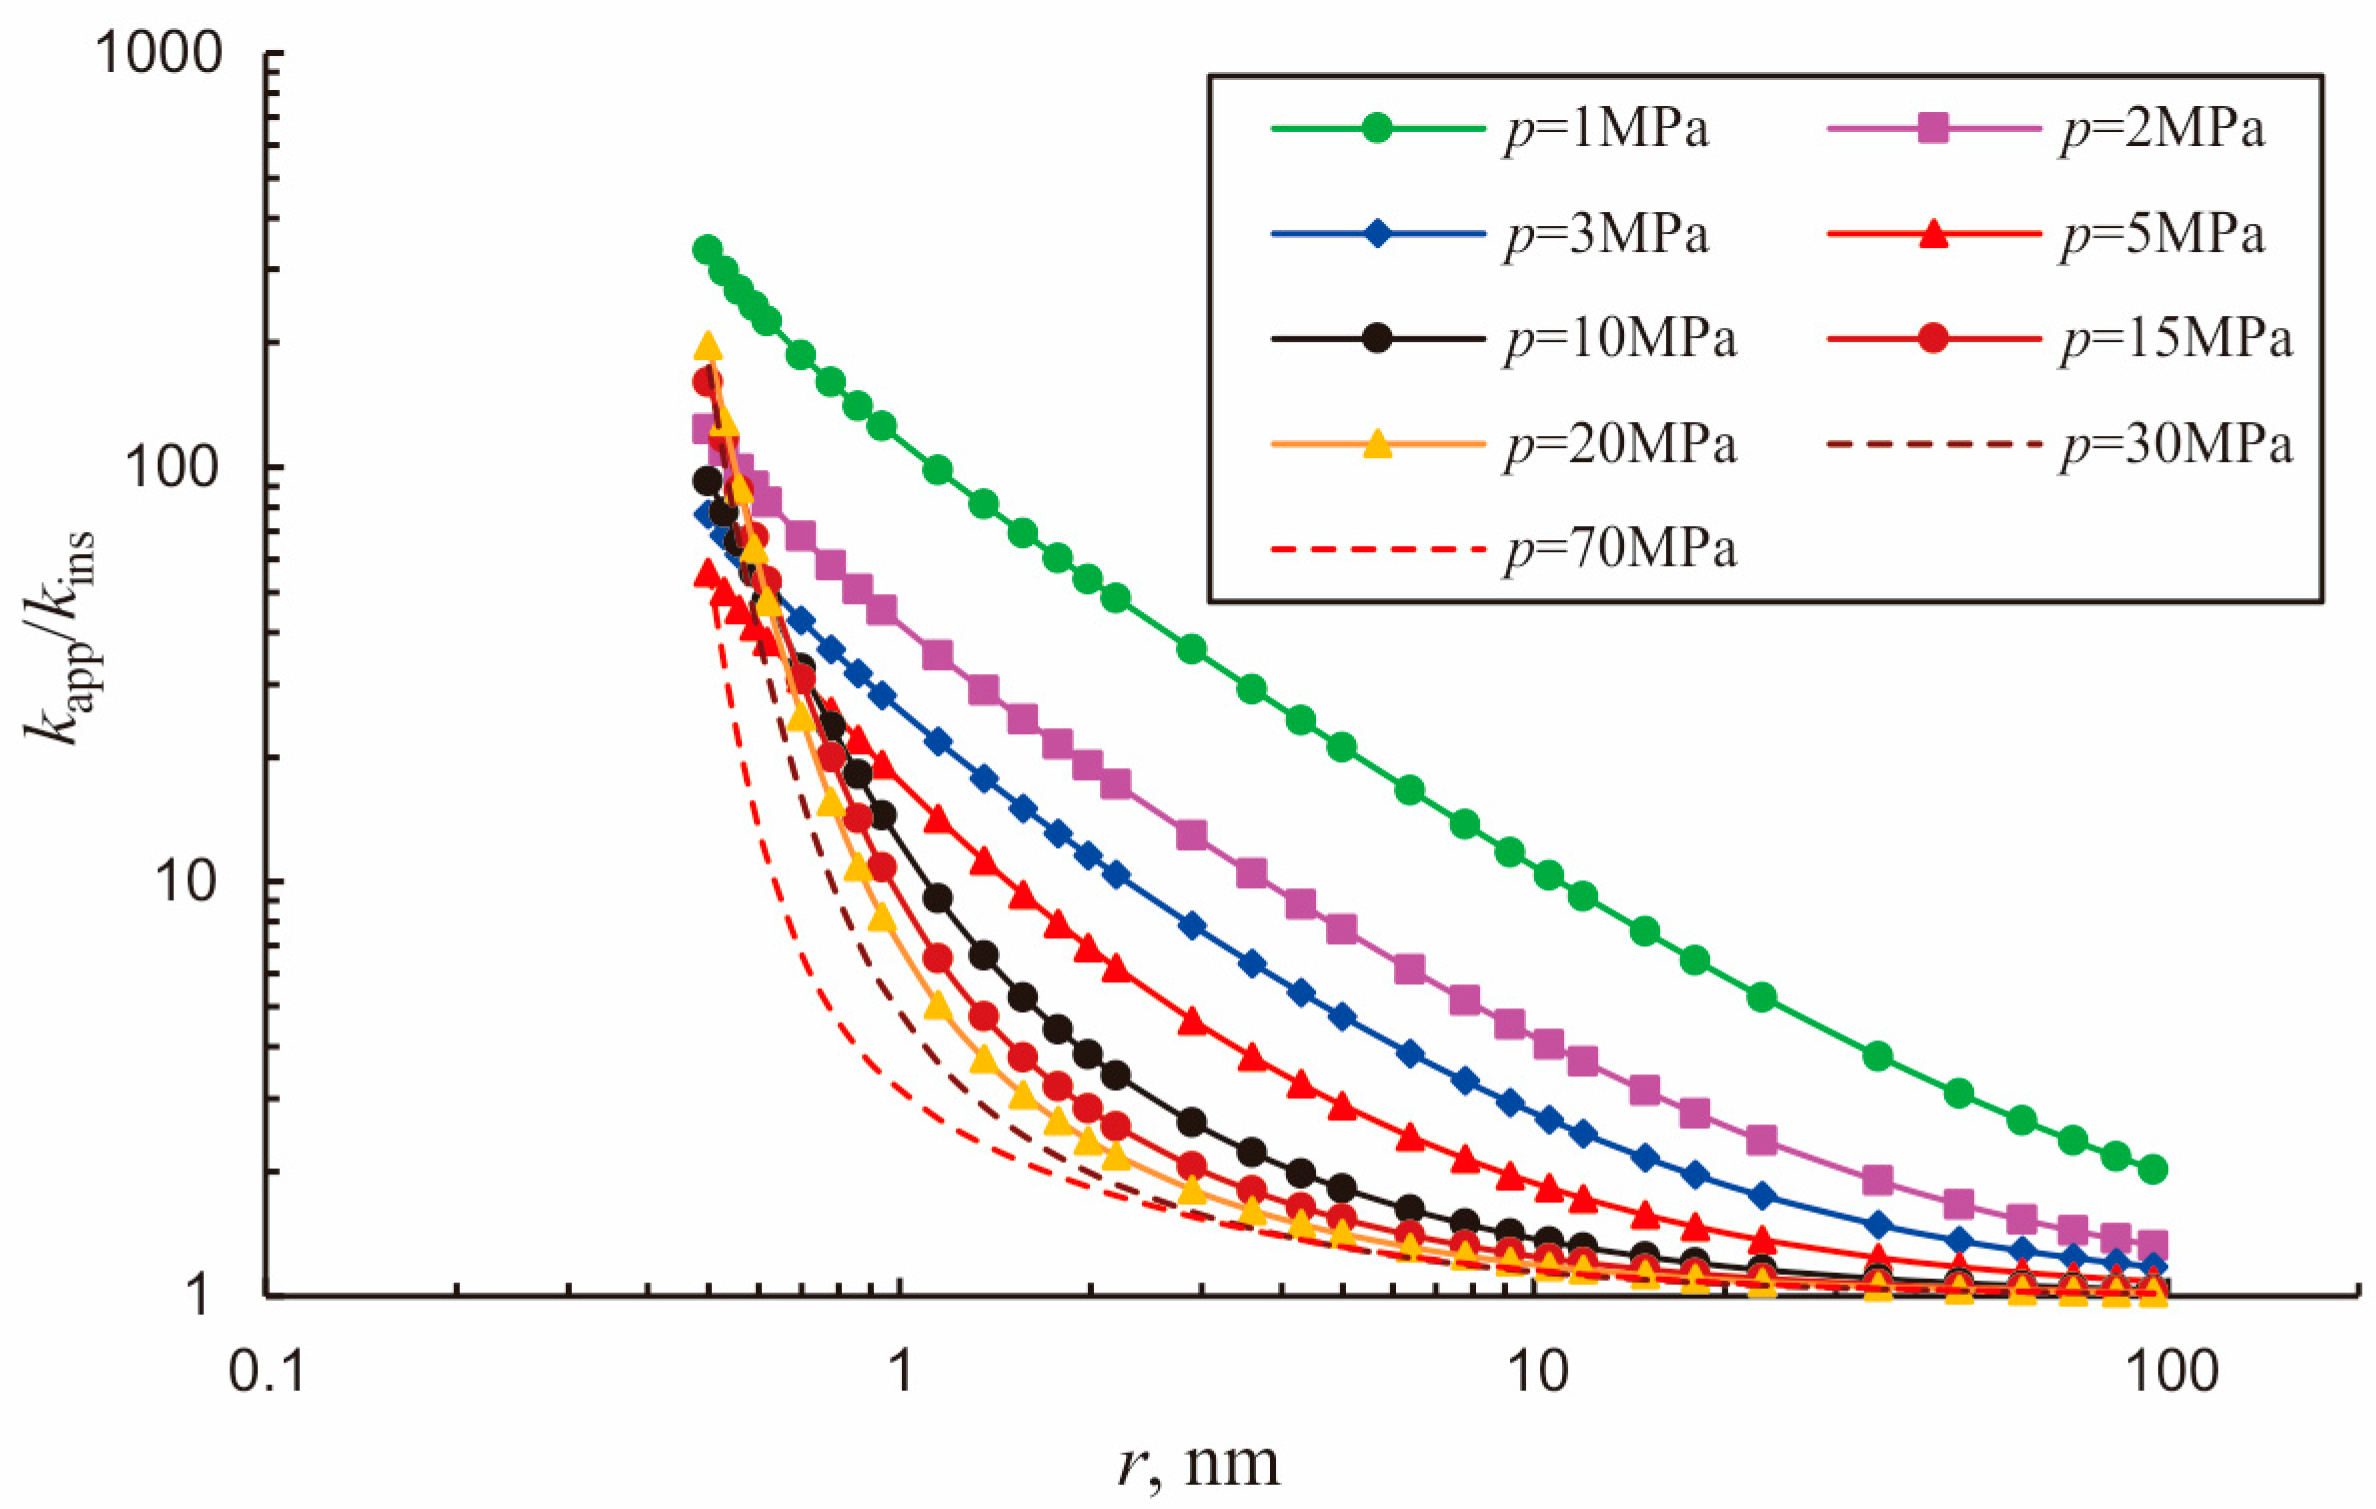
As shown in
Figure 17, the AP increases as pressure decreases in small pores, because the effect of the non-Darcy flow is stronger in low-pressure and small radius conditions. In large pores and throats, the AP is obviously influenced by both the non-Darcy flow effect and the geomechanical effect of stress dependence. The permeability decreases as pressure decreases at first due to stress sensitivity, and increases abruptly at low pressures, because the influence of the non-Darcy flow is more obvious than the geomechanical effects.


