Studies of Energy Consumption by a City Bus Powered by a Hybrid Energy Storage System in Variable Road Conditions


Department of Ship Automation, Gdynia Maritime University, Poland Morska St. 83, 81-225 Gdynia, Poland
Energies 2019, 12(5), 951; https://0-doi-org.brum.beds.ac.uk/10.3390/en12050951
Submission received: 1 February 2019
/
Revised: 28 February 2019
/
Accepted: 7 March 2019
/
Published: 12 March 2019
(This article belongs to the Section D: Energy Storage and Application)
Abstract
:This article analyzes various configurations of Hybrid Energy Storage Systems consisting of batteries only, combinations of batteries and supercapacitors, and supercapacitors only. For the presented configurations, mathematical models that were used in research in terms of energy consumption and carbon dioxide emissions were developed, employing a 12-m city bus as a test bed. The tests were carried out using standard test cycles for heavy vehicles as well as routes developed on the basis of actual road conditions. The obtained test results confirmed that the lowest energy consumption is characterized by the system supplied exclusively by batteries (855 Wh/km), followed by a hybrid system of a large battery with a small supercapacitor (941 Wh/km), a hybrid system with a large supercapacitor and a small battery pack (1087 Wh/km), and finally a system with a supercapacitor only (1091 Wh/km). In comparison with the conventional diesel power system (3967 Wh/km), the CO2 emission reductions ranged from 27% to 43%, depending on the source of electrical energy.
1. Introduction
The emerging weather anomalies around the world [1], being the result of climate change, are an impulse for decision-makers to limit the emission of toxic gases generated in the transport sector. One such action was the signing of the Katowice climate package in December 2018 obligating transport sectors to reduce carbon dioxide emissions [2,3,4]. At the same time, there is an emergence of legislation on exhaust emissions [5], which affects the prices of energy resources and electricity, and thus has an impact on the development of technology. One of the technologies with the largest pro-climate potential that currently can meet the stringent regulations regarding exhaust emissions in road transport is the technology associated with electric drive. The potential application of electric drive technology in urban transport allows the reduction of substances and noise emissions, which are harmful for the environment and human health, and which are generated in drive systems employing conventional internal combustion engines. Bearing in mind the above, it is reasonable to take up the subject of testing the energy consumption of electric buses with various propulsion system configurations and for different operating conditions. The considerations should include technological aspects related to the adopted configuration of the propulsion system in which, usually, the final element generating the torque is an electric motor. The choice of a particular propulsion system technology is also influenced by the climatic conditions in which the vehicle is operated, the vehicle’s loading condition, and the driver’s driving style.
The topic of using different technologies in urban electric buses was undertaken by many engineers. Initial research was related to the analysis of properties and the possibility of using mainly hybrid propulsion systems [6,7,8,9,10] in city buses using internal combustion engines in series [11] or parallel layouts [12] as well as hydraulic drive [13] and CNG powered systems [14]. With the introduction of increasingly restrictive emissions standards for road transport, technological solutions based on purely battery drive systems [15] and their variants using hybrid battery-capacitors systems [16,17,18,19], replaceable energy store systems [20,21] or range extenders [22] are sought. In addition to the mentioned technologies, research related to the use of photovoltaic panels [23] or hydrogen fuel cells [24,25] for city electric buses was conducted. Research was also carried out using several electric motors in the drive system of a bus [26,27]. A separate group of studies consisted of works aimed at the optimization of the electric drive system [28,29,30] through the appropriate control of its components [31,32,33,34,35] or cooperating charging infrastructures [36,37,38,39,40], including wireless charging systems [41,42]. A study [43] has proposed the use of energy-saving guidelines for the regulation of electric bus traffic by determining the minimum number of passengers and reducing the mass of batteries to a level that provides the necessary reserves of power.
An important aspect in the operation of electric vehicles is the possibility of using it in various climatic conditions. Studies on this issue were mainly related to the use of appropriate devices such as heat pumps [44,45], air conditioning systems, [46,47,48] and other systems [49] used to condition elements of the electric drive system, driver’s cab, and passenger compartment. The last group of publications offers analyses of the results obtained during the operation of urban electric buses under real conditions [50,51,52,53,54].
In this work, the author presents the results of simulation studies of an electric drive system for a city bus, with the possibility of powering it from one of four energy sources: a purely battery system, a battery system with a small package of supercapacitors (SUPCAP), a layout with a large package of supercapacitors and a small package of batteries, and a system with a large package of supercapacitors. The proposed types of energy storage including Hybrid Energy Storage System (HESS) can be used both in newly built electric buses as well as in existing electric buses, e.g., in trolleybuses. The application of energy storage in trolleybuses, which are powered from the traction network, increases their operability and grants them the autonomy of moving away from this network and operation in its vicinity.
The behavior of the mentioned energy storage systems in powering the electric drive system of a 12-meter city bus was analyzed in various standard test cycles (SORT 1, SORT 2, SORT 3, MBC, OCBC, UDDS-HD, BCDC), various road conditions related to changing speeds and road inclination variations (Gdynia-Flat, Gdynia-Hills), and different temperatures and passenger loading percentage conditions.
2. Energy Storage System Configuration
Contemporary configurations of the drive systems of city buses can take many forms. The most common are hybrid systems, which use different types of energy storage. One can meet solutions using batteries (BEV—Battery Electric Vehicle) or Hybrid Energy Storage Systems (HESS), which most often consists of various types of batteries or batteries coupled with supercapacitors. Generally, engineering efforts are aimed at limiting emissions of exhaust gases that are harmful to health and human life as well as urban architecture. They include nitrous oxides (NOx), sulfur oxides (SOx), carbon monoxide (CO), hydrocarbons (HC), methane (CH4), volatile non-methane organic compounds (NMVOC), and particulate matter (PM) and are accompanied with emissions of greenhouse gases of which carbon dioxide (CO2) is the most well-known.
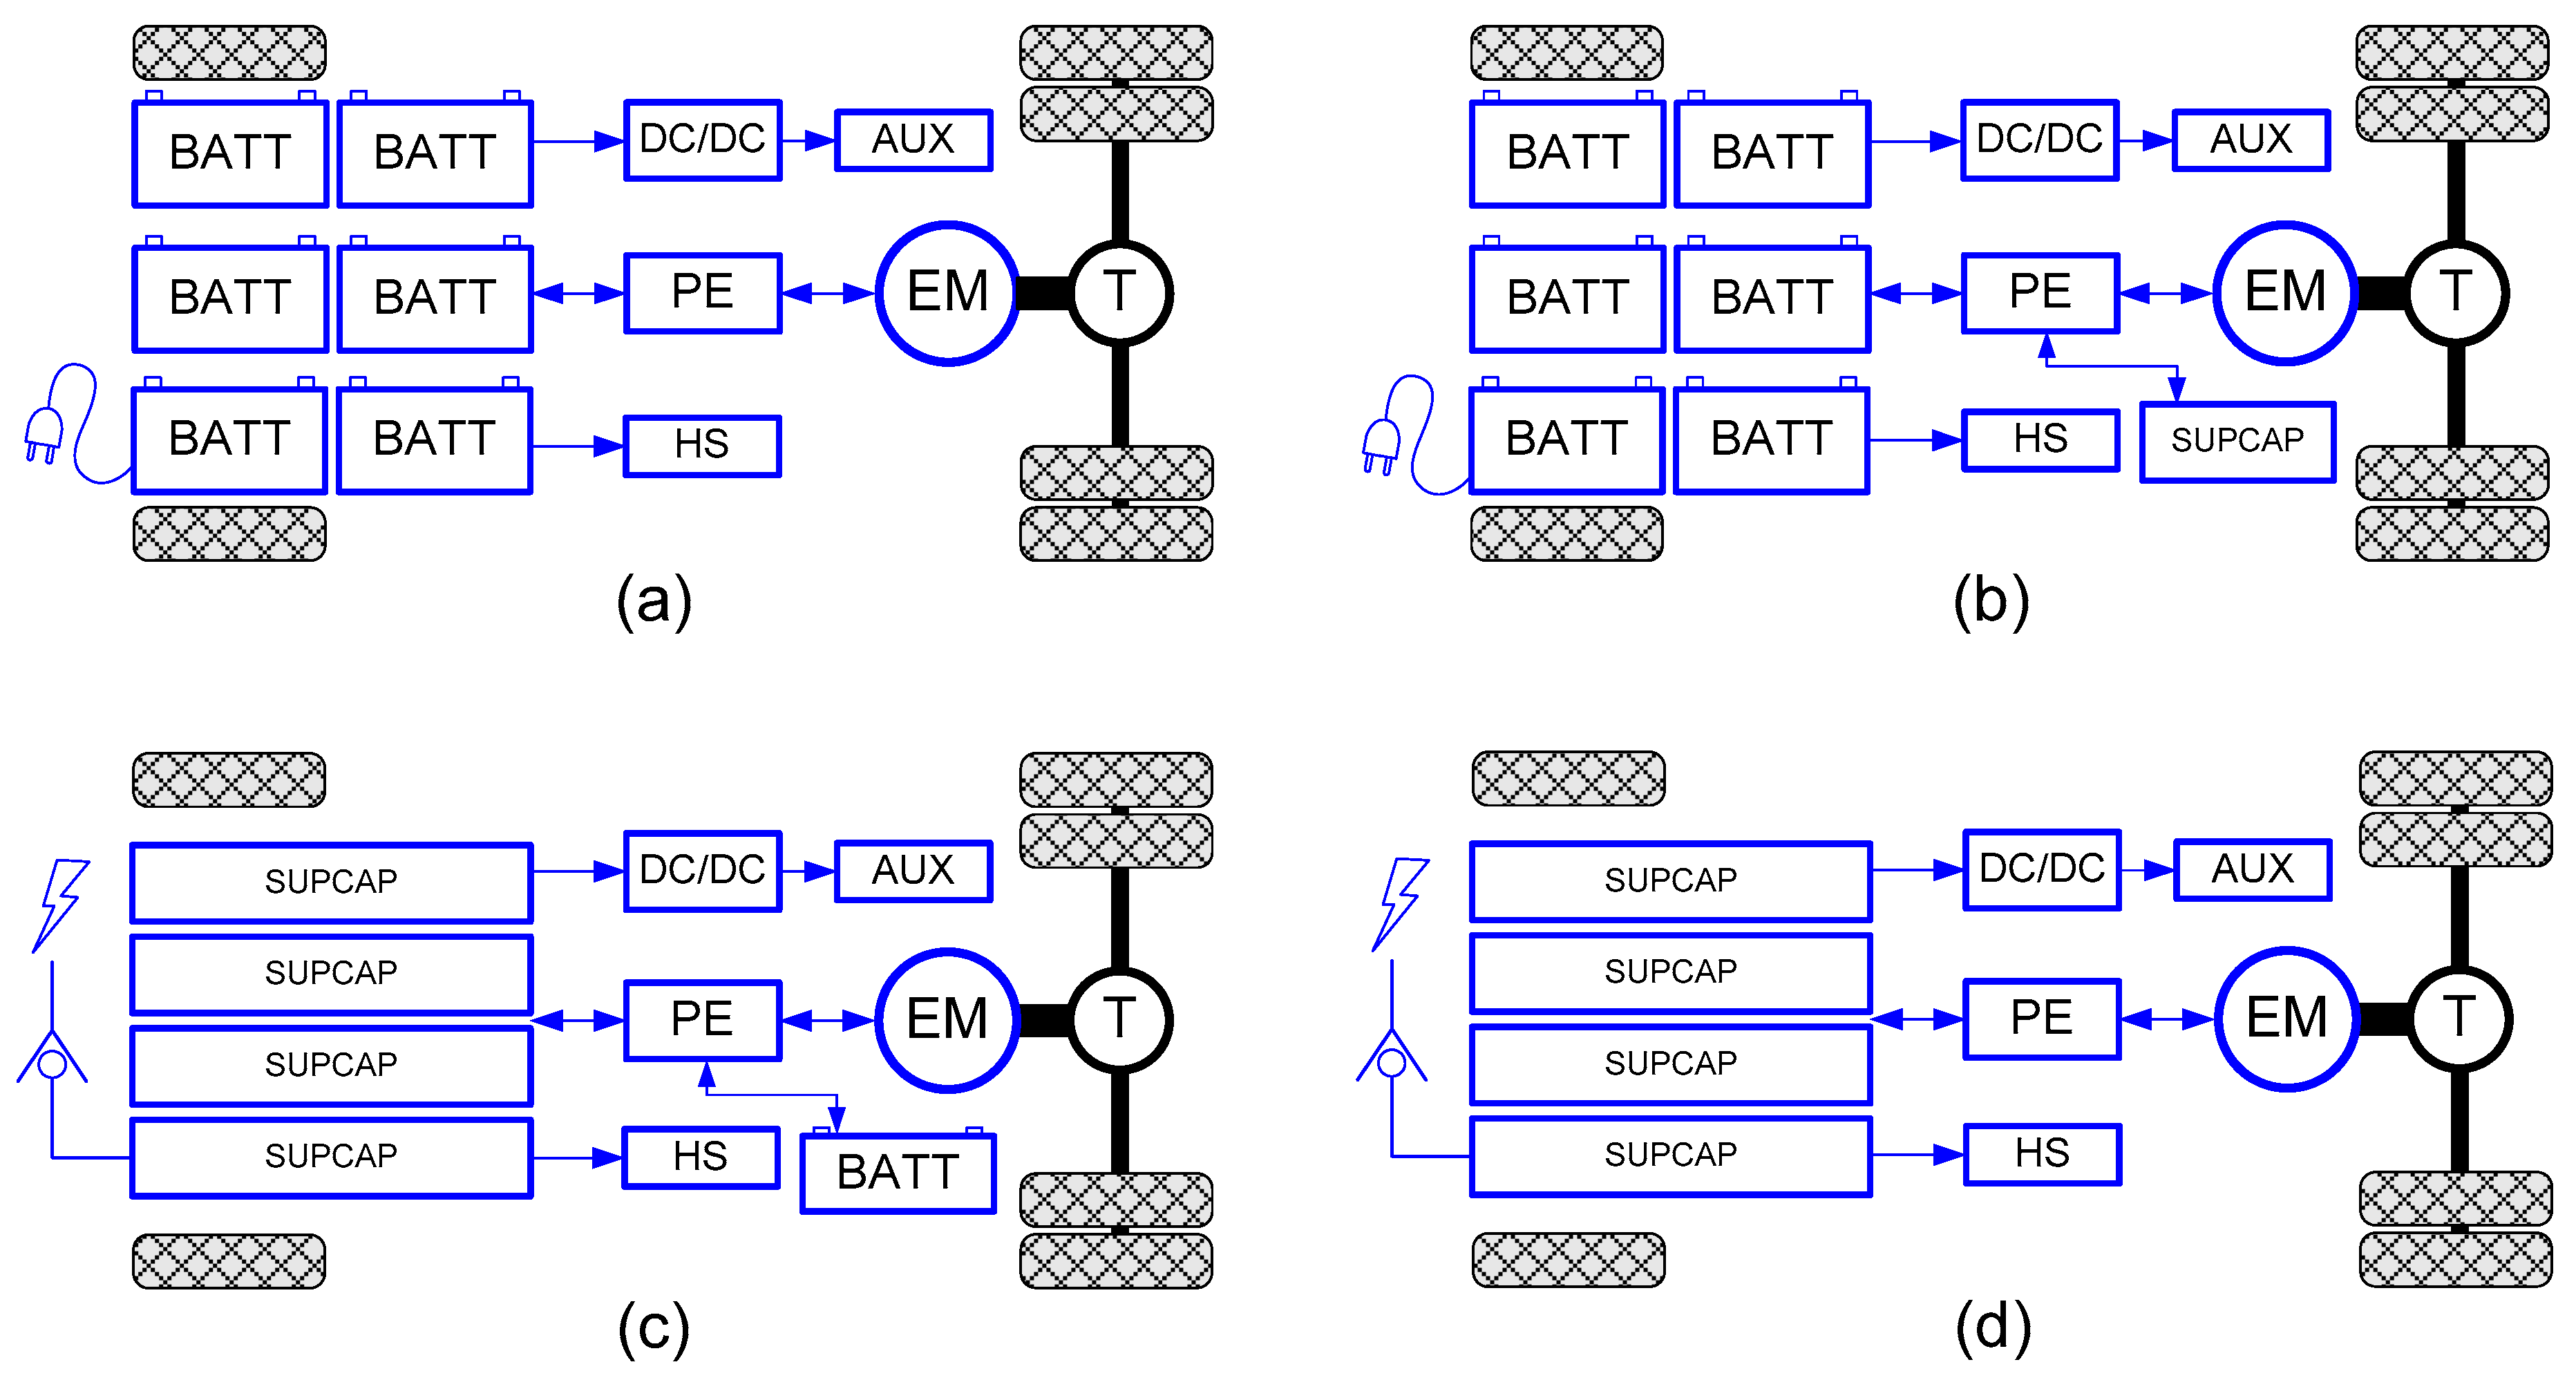
During the tests, four systems of electric energy storage, consisting of various configurations of battery packs and/or supercapacitors, were analyzed. Figure 1a presents the configuration of the propulsion system, which consists of a battery pack, an inverter controlling the operation of the electric traction motor, a drive transmission system, and a DC/DC converter powering the on-board and auxiliary devices. Figure 1b shows the configuration of the electric drive system, which was extended relative to the layout of Figure 1a by the addition of a small bank of supercapacitors. Figure 1c illustrates the configuration of an electric propulsion system similar to the one shown in Figure 1b but in reversed proportions: The battery pack is small, while the main role of electricity storage is done by a large supercapacitor pack. Finally, the fourth configuration is a system powered only from a large bank of supercapacitors.
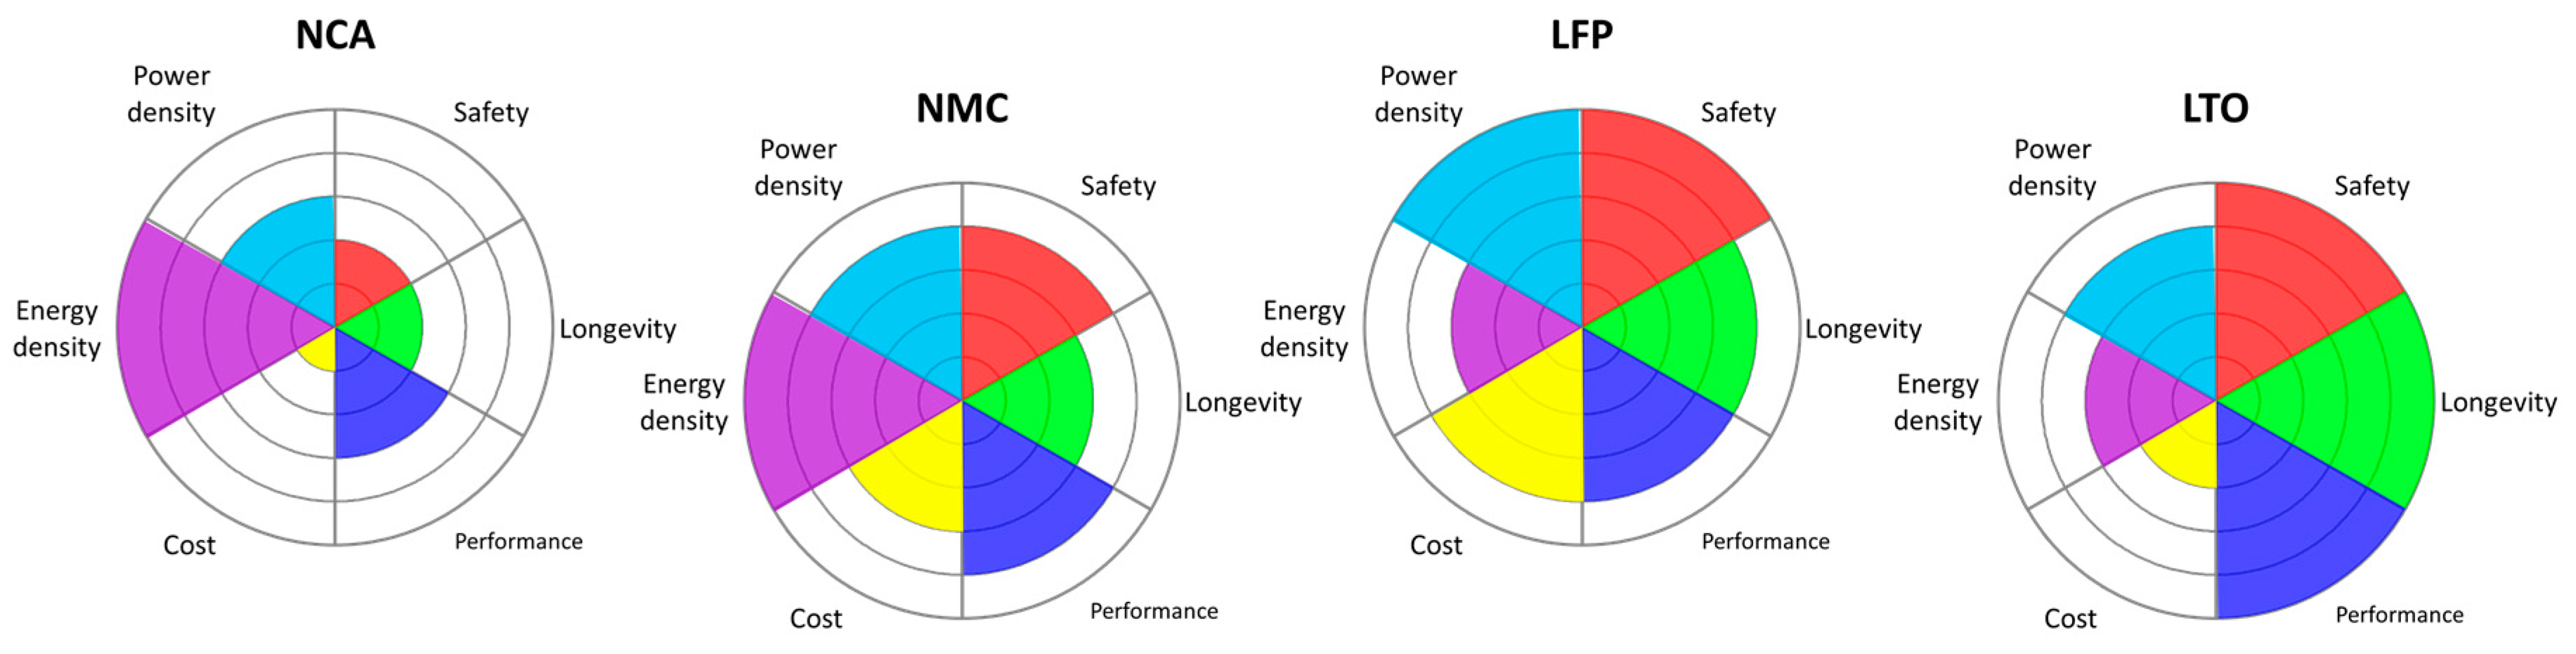
Currently, there are several types of lithium-ion batteries available on the market such as Lithium Cobalt Oxide (LiCoO2, abbreviation: LCO), Lithium Manganese Oxide (LiMn2O4, abbreviation: LMO), Lithium Nickel Manganese Cobalt Oxide (LiNiMnCoO2, abbreviation: NMC), and Lithium Nickel Cobalt Aluminum Oxide (LiNiCoAlO2, abbreviation: NCA). During the research [55], due to the best safety-related parameters and a large number of charging cycles, two types of batteries, Lithium Iron Phosphate (LiFePO4, abbreviation: LFP) and Lithium Titanate (Li4Ti5O12, abbreviation: LTO), which are considered for use in these types of propulsion systems, were modeled.
The choice of the battery technology from the ones mentioned above has its justification in their comparison, shown in Figure 2. Of the many types of batteries mentioned, only LFP and LTO batteries have the highest fire safety level and a high number of charge cycles, at a minimum level of 3000 cycles. In addition, in selecting a given type of energy storage for making up the HESS, it was assumed that the planned vehicle range will be about 100 km. The other criteria used in the design of energy store are the availability of space on-board the vehicle and the mass of a given type of battery, which has a direct impact on the possibility of limiting the space available to passengers. As a result, two hybrid energy stores were obtained: a large battery with a small supercapacitor with a mass ratio of 22%/78%, respectively, and a stored energy ratio of 1%/99%, respectively, as well as a hybrid system with large supercapacitors and a small battery pack with a mass ratio of 64%/36%, respectively, and the ratio of energy of 8%/92%, respectively.
An important element affecting the traction parameters achieved by the electric city bus is a thermal conditioning system, used both to maintain optimal temperatures in the cabin of the vehicle, where the passengers and driver reside, as well as to manage the temperatures achieved by the elements of the electric drive system. For the considered electric bus drive configurations (Figure 1), two variants of the heating system were analyzed. The first one uses a liquid heating system with electric heaters and conventional air conditioning, and the other uses a heat pump.
The choice of a particular configuration of the electric drive system should depend on factors affecting the parameters obtained by the vehicle, such as energy consumption and the achieved range. The most important factors affecting the design of the electric drive system of the bus in terms of a particular location where it will be operated include the length of the daily route, the difference in elevation on the route, the intensity of traffic on the route, hydrometeorological conditions (mainly air temperature), the number of passengers on board, the possibility of recharging the energy storage from fast chargers during operation, the availability of infrastructure in a given area, and the load for the local electric power grid. In addition to the above-mentioned factors affecting the amount of energy consumed by the vehicle, the design process of the electric drive system should also take into account the properties and parameters (efficiency) of the electric drive system components, the location of the individual elements affecting the working temperatures (roof, front, back, center) [56], the energy store charging current (fast, normal), the thresholds of discharge and charge of the energy storage, and the work schedule of the drive system (charging time, discharge time, idle periods).
3. Modeling
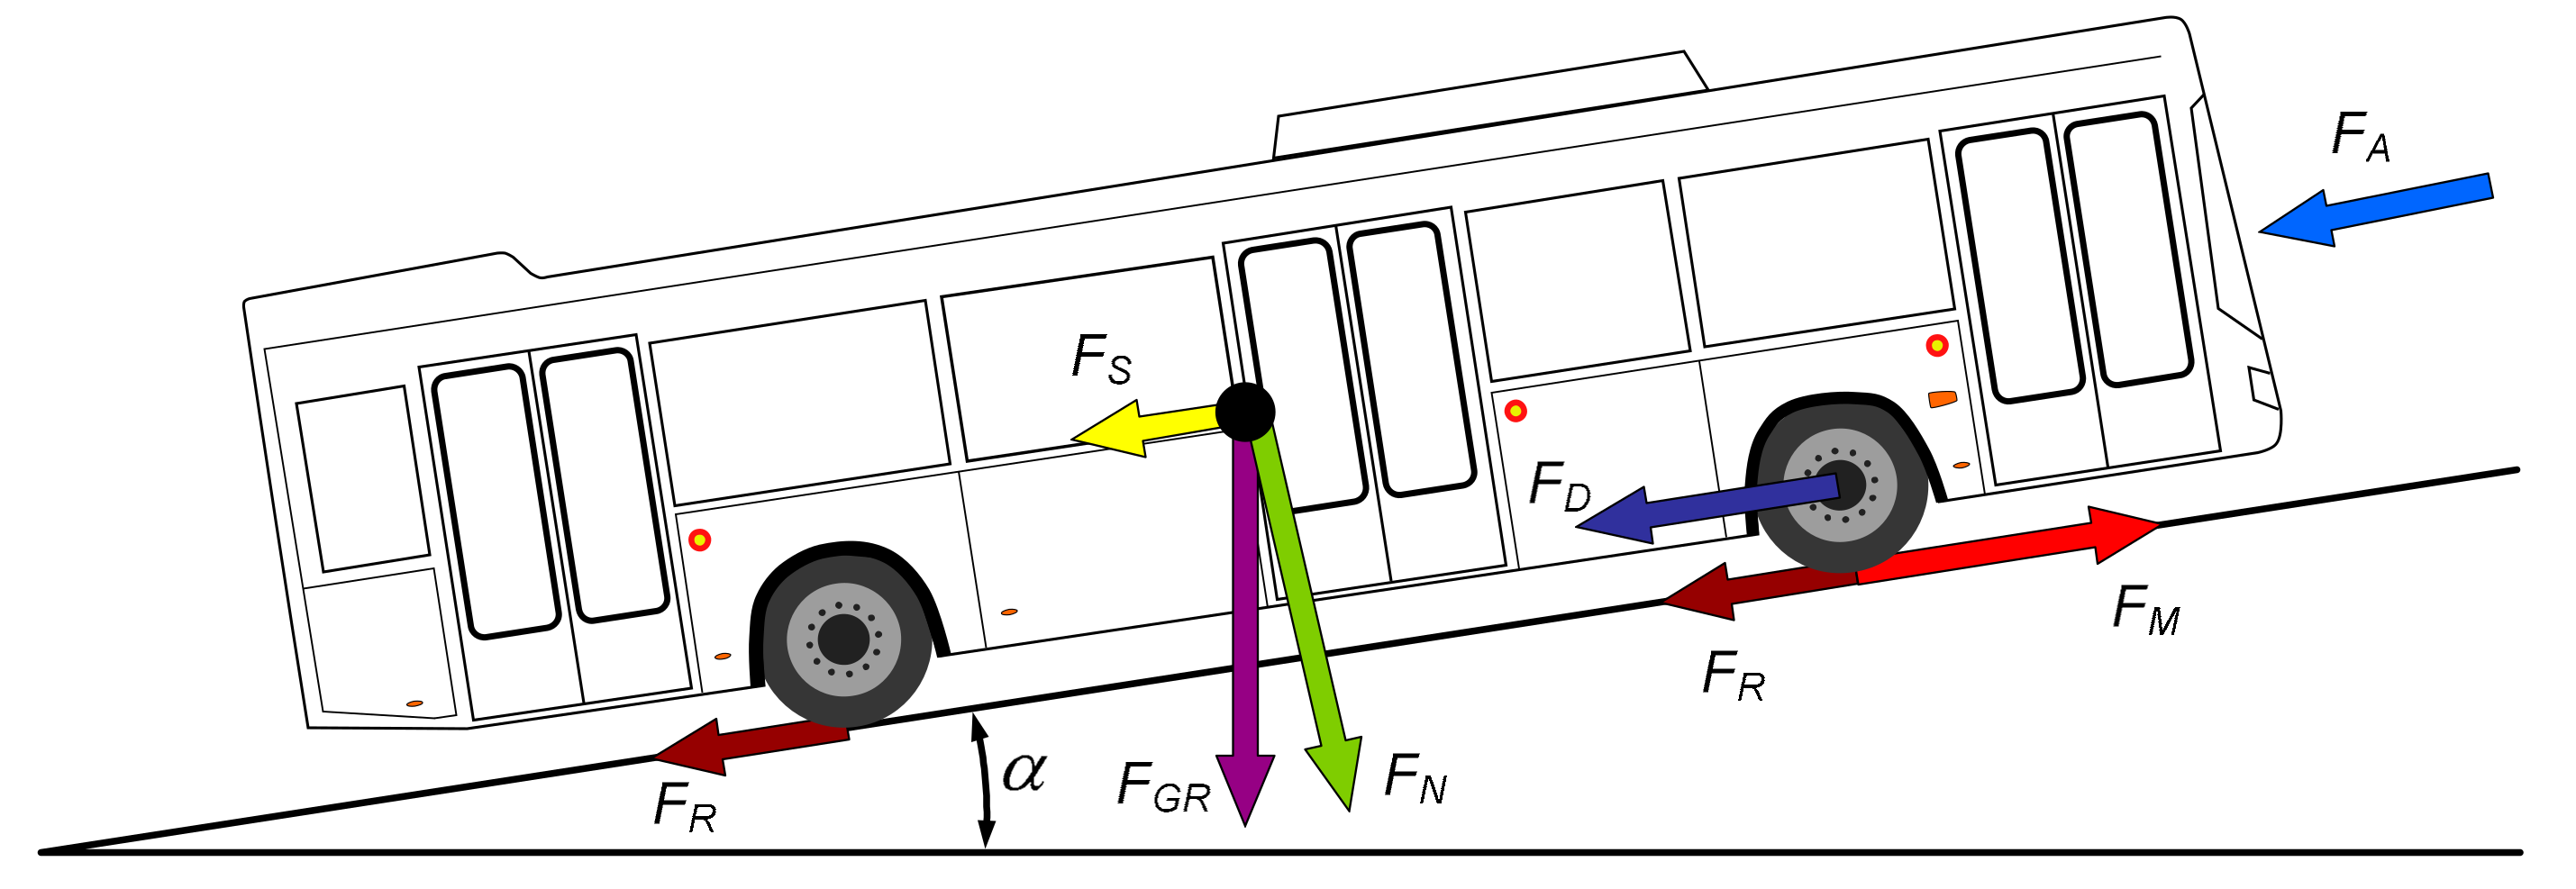
Figure 3 shows the forces acting on the bus body taken into account during modeling the movement resistances of the electric bus during operation [57].
In the simulation tests, the basic forces acting on the vehicle structure were used. These forces are related to the motion resistance caused by the vehicle aerodynamic resistance FA, which is mainly related to the geometric dimensions of the vehicle; the rolling resistance FR, which is dependent on tire parameters and the surface on which the vehicle moves; and the resistance related to the transmission of torque in the drive system FD. In addition to these, other forces must also be taken into account, i.e., those associated with the gravitational force FGR (vehicle weight); vehicle normal force acting on the ground FN; sliding force FS; force associated with vehicle inertia FIN, and the driving force FM generated by the vehicle’s drive system. For a moving bus, the sum of forces acting on its body may be described by means of the following:
The aerodynamic resistance of the bus can be determined from the following dependence:
where Cd is the electric bus drag coefficient (-); A is the frontal area of the electric bus (m2); ρ is the ambient air density (kg/m3); and v is the electric bus speed (m/s).
Rolling resistance can be determined on the basis of the following:
where m is the electric bus weight (kg); g is the standard gravity (m/s2); μR is the electric bus wheels rolling resistance coefficient (m); R is the electric bus wheel radius (m); α is the road inclination (deg); and is the acceleration of the electric bus (m/s2).
The sliding force of the vehicle was calculated based on the following:
Resistance associated with the inertia forces caused by acceleration and braking of the vehicle was determined based on the following:
The bus structure also has the forces associated with transmitting the torque to the wheels and the losses that are associated with it:
where is the torque at drive shafts at rated speed (Nm); is the average speed of wheel drive shafts (rad/s); and is the nominal rotational speed of wheel drive shafts (rad/s).
The drive torque generated by the electric motor is the source of the driving force FM transmitted by the differential and axle to the wheels of the vehicle:
where is the torque produced by the electric motor (Nm) and is the differential gear ratio (-).
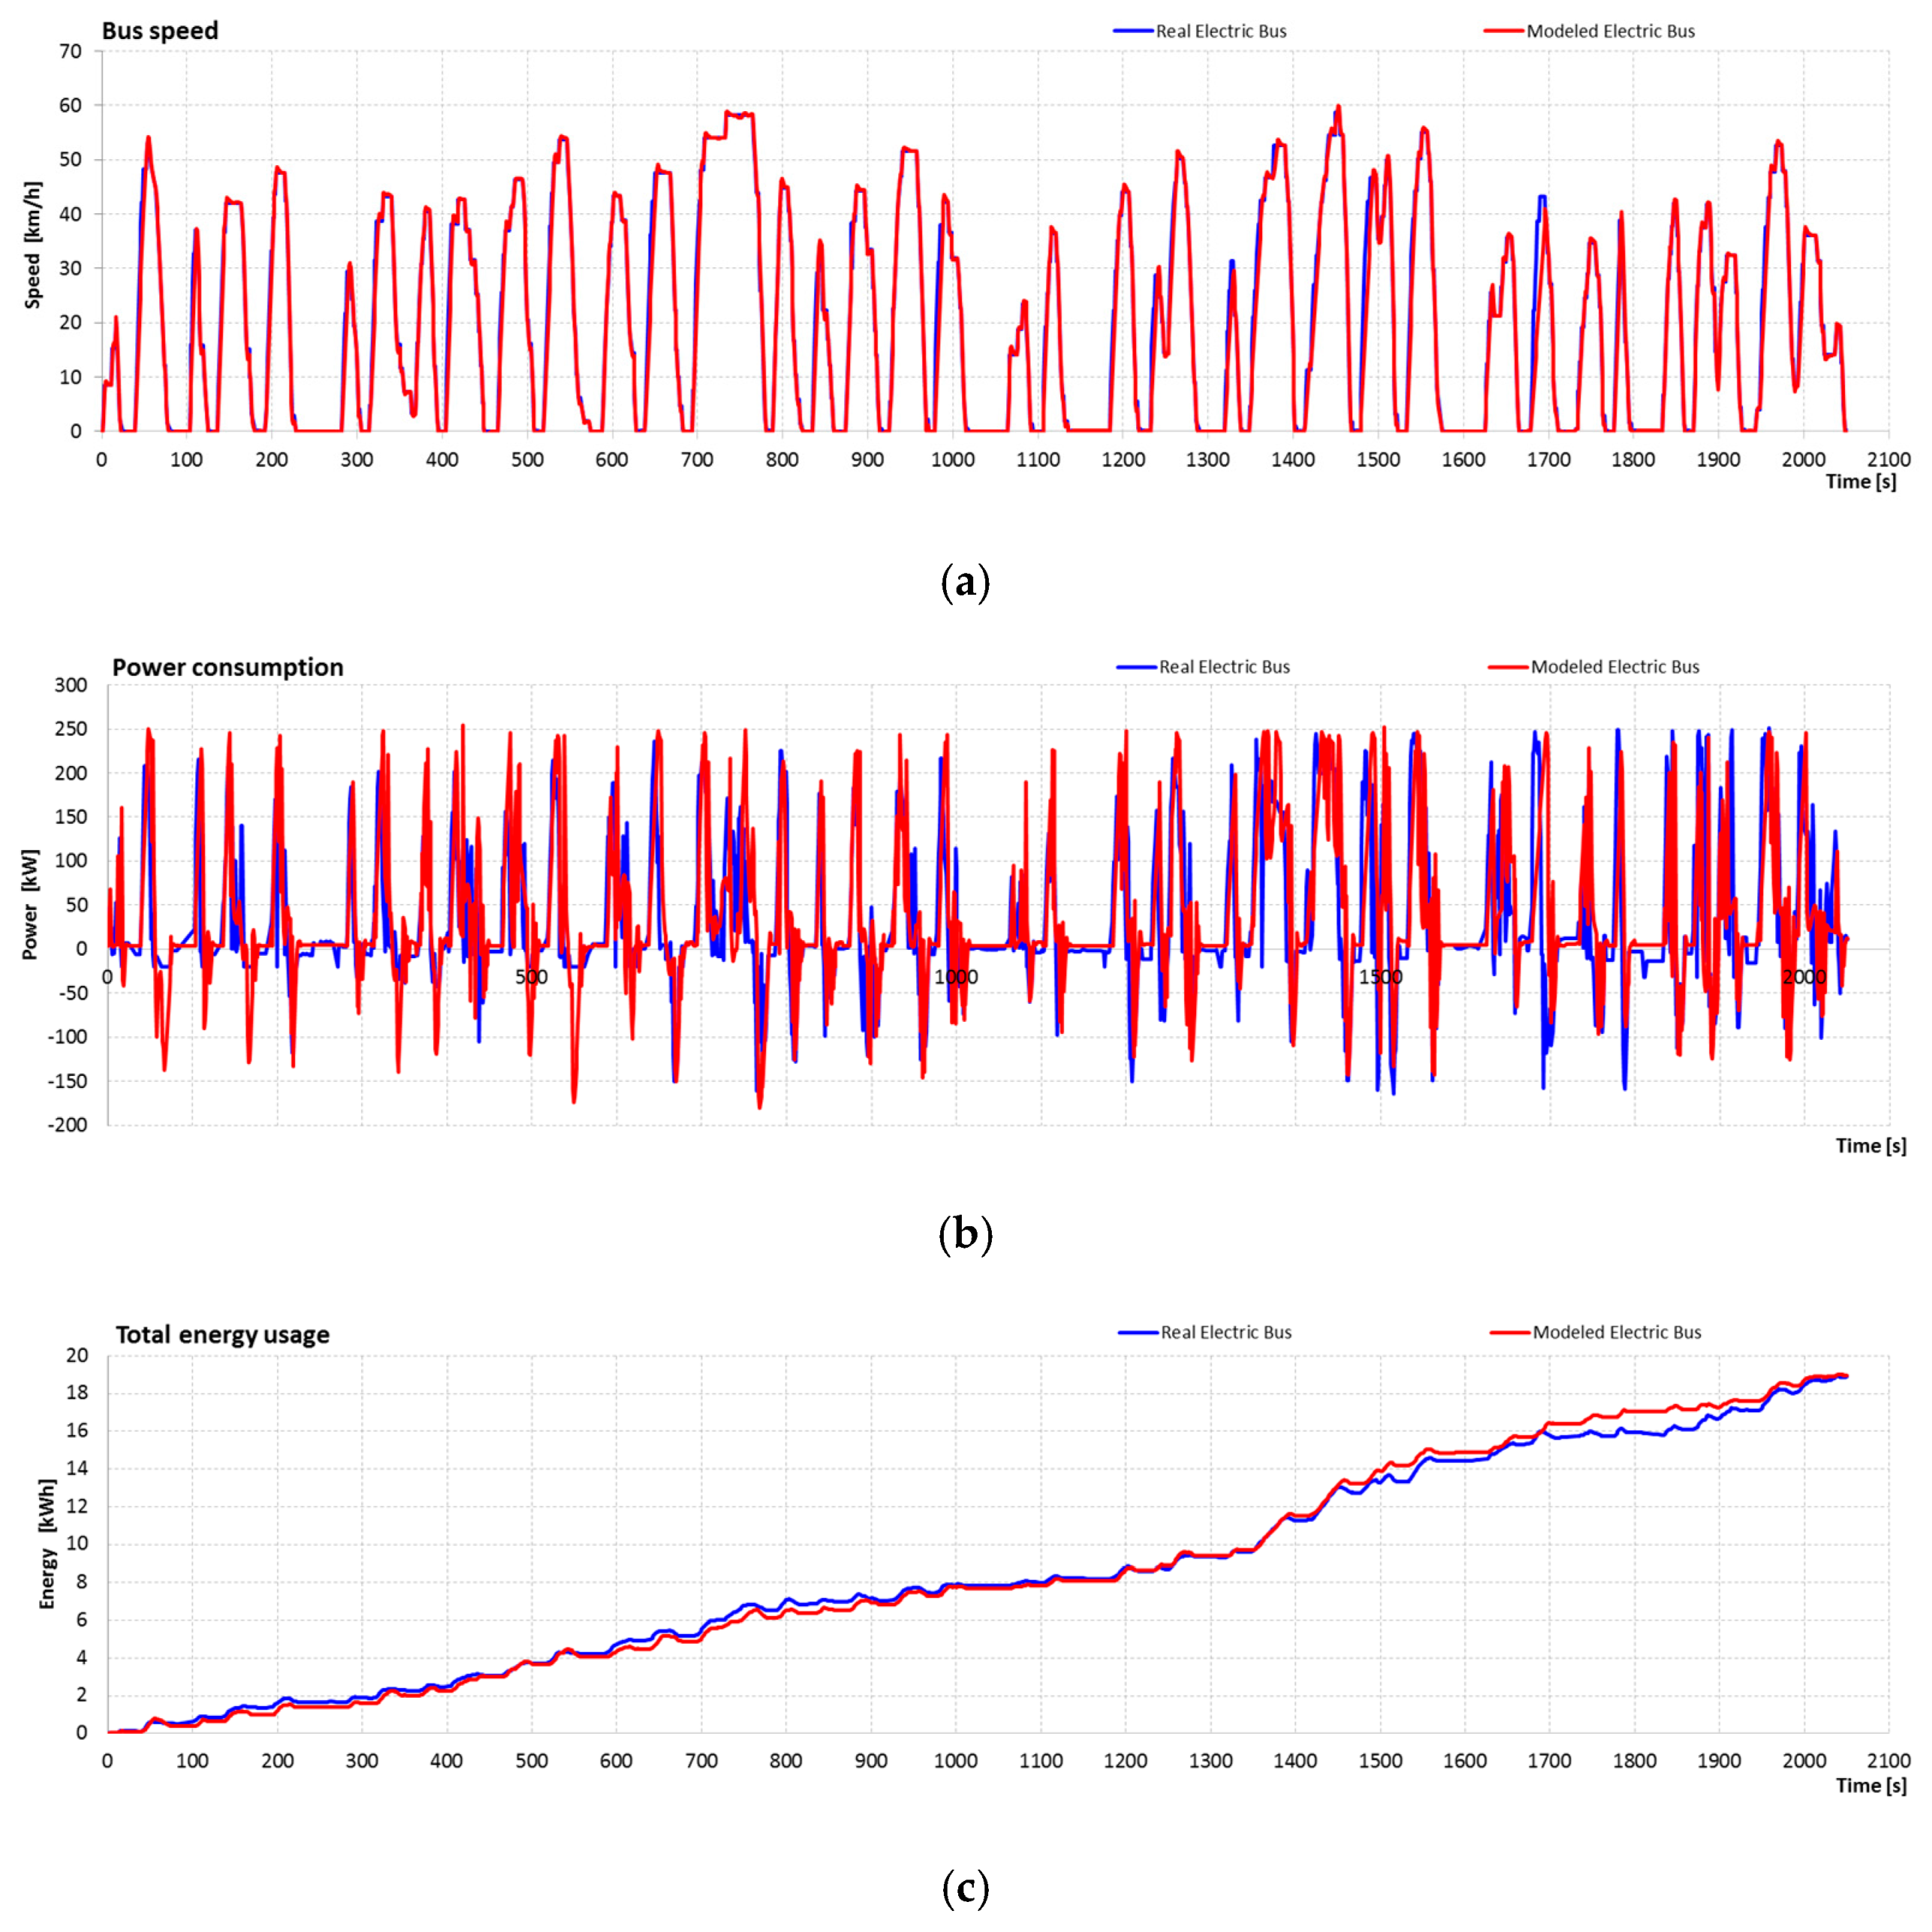
On the basis of measurements recorded on real buses operating in traffic (Figure 4), both conventional diesel and battery-powered, a simulation model of electric bus was developed. For the research being conducted, a very important fact is that the adopted vehicle model is the same for all configurations of the electric drive system. The parameters of the elements of the electric propulsion system of the vehicle (power, mass) and the conditions of vehicle operation (temperature, loading condition, slope of the terrain) can change. In other words, for two identical vehicles operated in completely different environmental conditions, it is possible to obtain completely different test results.
It is therefore justified to make an objective attempt to analyze the use of various types of energy storage in electric buses. The inspiration to undertake this type of research is the fact that a part of the fleet of buses used in public transport in Gdynia are trolleybuses. Trolleybuses are a variation of urban electric buses that are powered from a traction network stretched over the road. The range of operation of trolleybuses depends on this traction network, which is expensive to expand and maintain. The natural consequence of the city’s development is the emergence of new districts that require service through public transport. A cheaper and simpler procedure than building new traction network segments could be to use an electric bus or to add a battery pack and/or supercapacitors to existing trolleybuses. It is possible to extend the functionality of existing solutions by using hybrid electric energy storage in vehicles, which can also be charged during operation. For this reason, the possibility of using batteries and supercapacitors in an electric bus was tested.
The OpenModelica software was used to model the electric drive system of a bus powered from various energy storage configurations. The developed mathematical model of the electric bus (Figure 5) reflects the work of subsystems and modules included in the considered vehicle as a whole, such as:
- The body of the vehicle together with the forces acting on it;
- Electric drive system consisting of a synchronous motor module, an inverter module, and an electric energy storage module;
- Power transmission system with differential;
- Vehicle route referencing module, including support and control of acceleration and braking pedals;
- Module for setting temperature parameters of the external environment;
- Module for determining the state of loading of the vehicle (number of passengers onboard);
- Thermal conditioning system module for the electrical components of the propulsion system and the passenger compartment, together with the ventilation system consisting mainly of the heat pump module, the valve manifold controlling the flow of thermal energy, and heat exchangers;
- Module simulating the load of auxiliary on-board equipment (low-voltage vehicle installation, vehicle lighting system, passenger information system, ticket validator system, power steering system support system, pneumatic braking support system, etc.).
In addition, the presented bus model includes auxiliary modules for energy measurement. The vehicle body module models the mass of the vehicle itself, and the mass of passengers and the driver, as two interconnected masses engaged in a translational movement. The force transmitted by the vehicle’s drive wheels acts on this modeled mass assembly, which is modeled as the perfect wheel rolling without slip and driven by the torque coming from the differential module (Figure 6).
The second source in direct reaction with the mass of the bus are movement resistances, such as aerodynamic resistance, rolling resistance of the bus wheels, and resistance associated with driving on inclined sections of the road. In the module characterizing the bus bodywork, a vehicle main brake model was also included, which can be controlled both by the speed controller located in the motor inverter module as well as by the bus route referencing module that activates the brake when the bus stops. Figure 7 shows model of the module describing thermal properties of the passenger compartment.
In addition to the modules presented above, a model of a traction battery package was developed, which reflects the operation of the energy storage depending on the type of batteries used, along with the accompanying physical and chemical phenomena described by the appropriate characteristics (increase of internal resistance at temperature drop, self-heating during operation). Three components were used to model the battery pack: an adjustable voltage source block symbolizing the electromotive force of the cells, which changes its value along with the battery State of Charge (SOC); a variable resistance block that changes its value in accordance with temperature of the battery; and a heat mass block describing the heat capacity of all cells configured in the battery pack. In addition, the battery pack model allows cooperation with the thermal conditioning system via a heat port. The supercapacitor bank is modeled in a similar way.
An element used to provide a route for the tested configuration of the electric bus drive system is the vehicle route referencing module. This module has been configured to work with standardized [58,59,60] ready-made files describing the test cycles used to estimate the energy consumption of the vehicle. The testing standards were developed by various international agencies (EPA [60], DieselNet [61], EU [62]) and accepted for use by the World Forum for Harmonization of Vehicle Regulations (WP.29) [63]. The content of the files shows the current value of the slope of the road and the elevation profile as a function of the distance from the starting point or the speed at which the vehicle is to move on a given section of the route.
4. Simulations Results
Simulation studies have been divided into three parts. In the first part of the test, standardized procedures used to determine the energy consumption of vehicles were used to test six different propulsion systems: BEV, BEV with HESS, and ICE. In the second part, simulation tests were carried out for the systems presented in the first part. Tests employed two routes based on actual bus route data with a length of about 100 km each. In the third part, the electric drive system powered by BEV (LFP) was analyzed for various passenger load percentages, different ambient temperature conditions, and the use of different temperature conditioning systems of the passenger compartment and drive system components. For calculations related to the number of passengers, the weight of one passenger was assumed to be 68 kg, and the driver’s weight of 150 kg was adopted.
4.1. Research on Energy Consumption Using Test Cycles WP.29
Six propulsion system configurations were tested in accordance with the contents of Table 1 and on the basis of Figure 1. The first two configurations concern drive systems powered by the LFP and LTO battery packages, respectively. In the next three configurations, HESS was used, consisting of supercapacitors and batteries (SUPCAP-BEV (LFP), BEV (LFP)-SUPCAP, SUPCAP). HESS systems, the majority of which employ supercapacitors, were recharged during stopovers at bus stops. In the last system, a purely diesel powered diesel engine was modeled. The tests were based on cycles (SORT 1, SORT 2, SORT 3, UDDS-HD, OCBC, MBC, BCDC) used to estimate the energy consumption of trucks and buses.
The test routes SORT 1, SORT 2, and SORT 3 consist of defined road section lengths and the speed with which these sections are to be travelled, as well as certain minimum acceleration values when starting from standstill. On the other hand, the UDDS-HD, OCBC, MBC, and BCDC test routes have a strictly defined speed profile. The effect of adopting certain speed profiles is the movement of vehicles on the given route profiles with the same speed. In contrast, travel times for the SORT 1, SORT 2, and SORT 3 routes, for which there are no restrictions in the form of certain speed values, may be different.
In the graphs showing the change of temperature values, the temperature of a given type of battery pack in the propulsion system is marked with a continuous line while the supercapacitor temperature is represented by the dotted line, excluding the SUPCAP system, where the temperature of the supercapacitors was marked with a continuous line.
4.1.1. Bus Energy Consumption Tests Using the SORT 1 Test
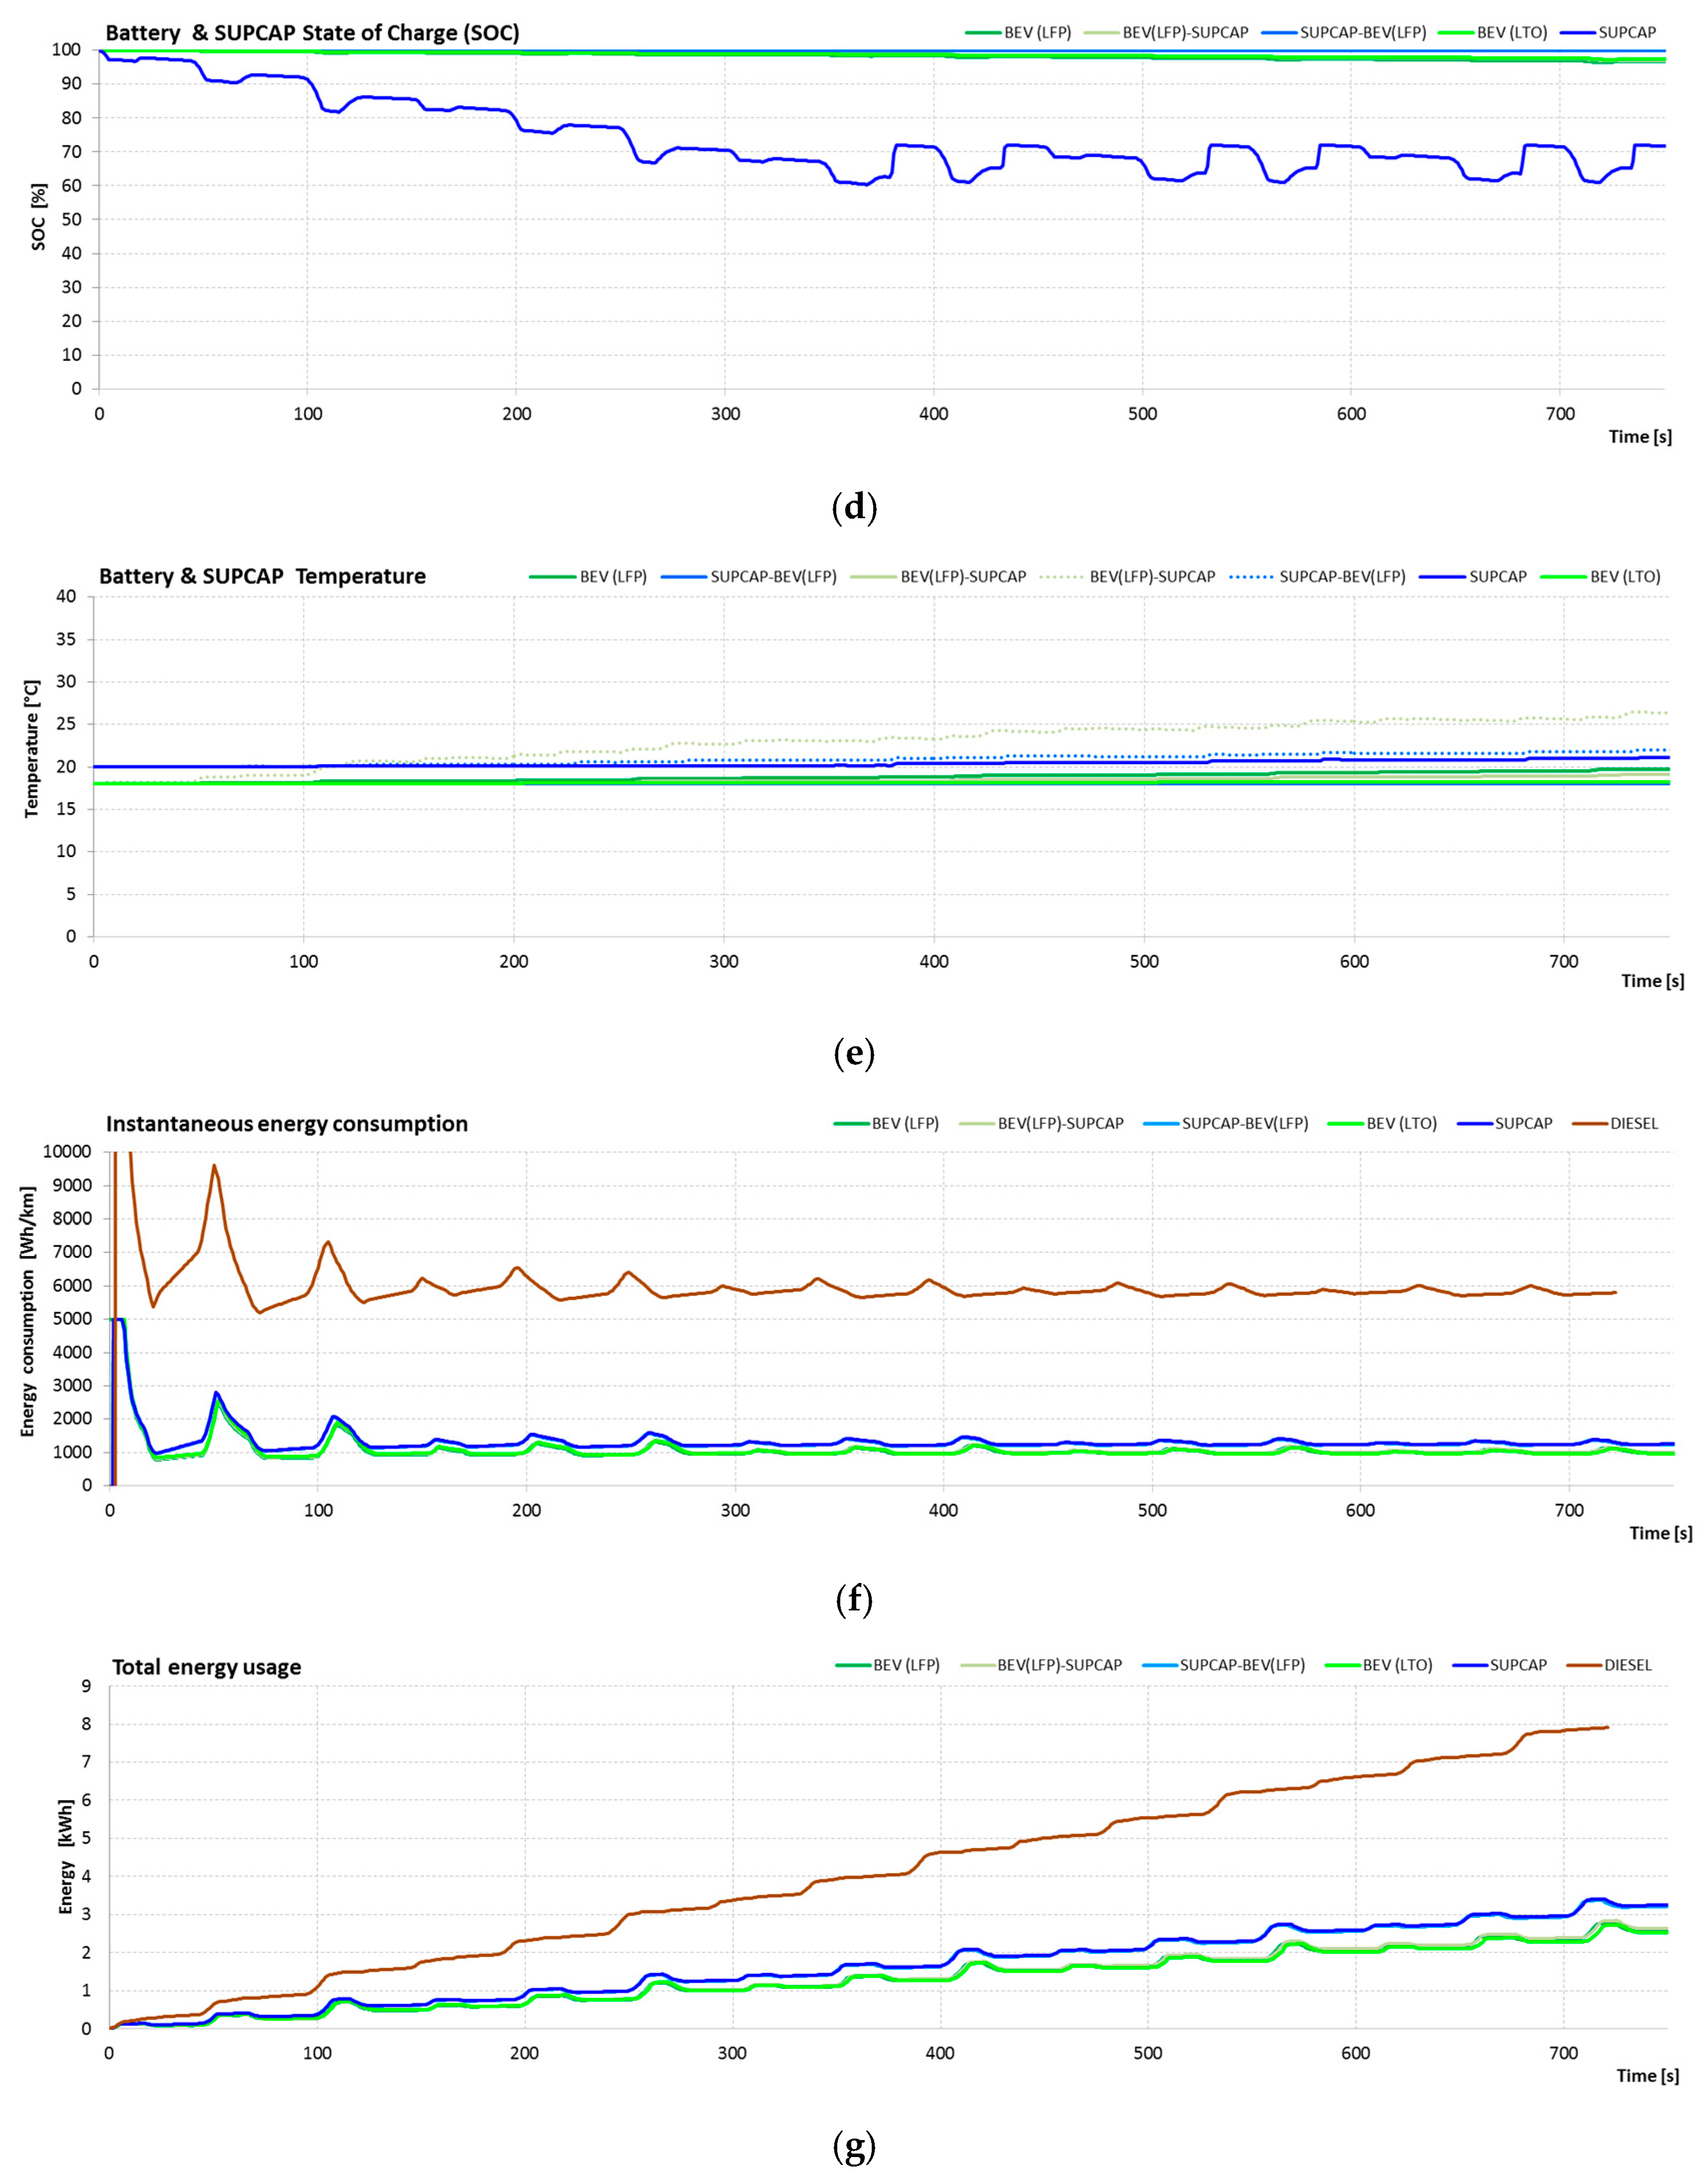
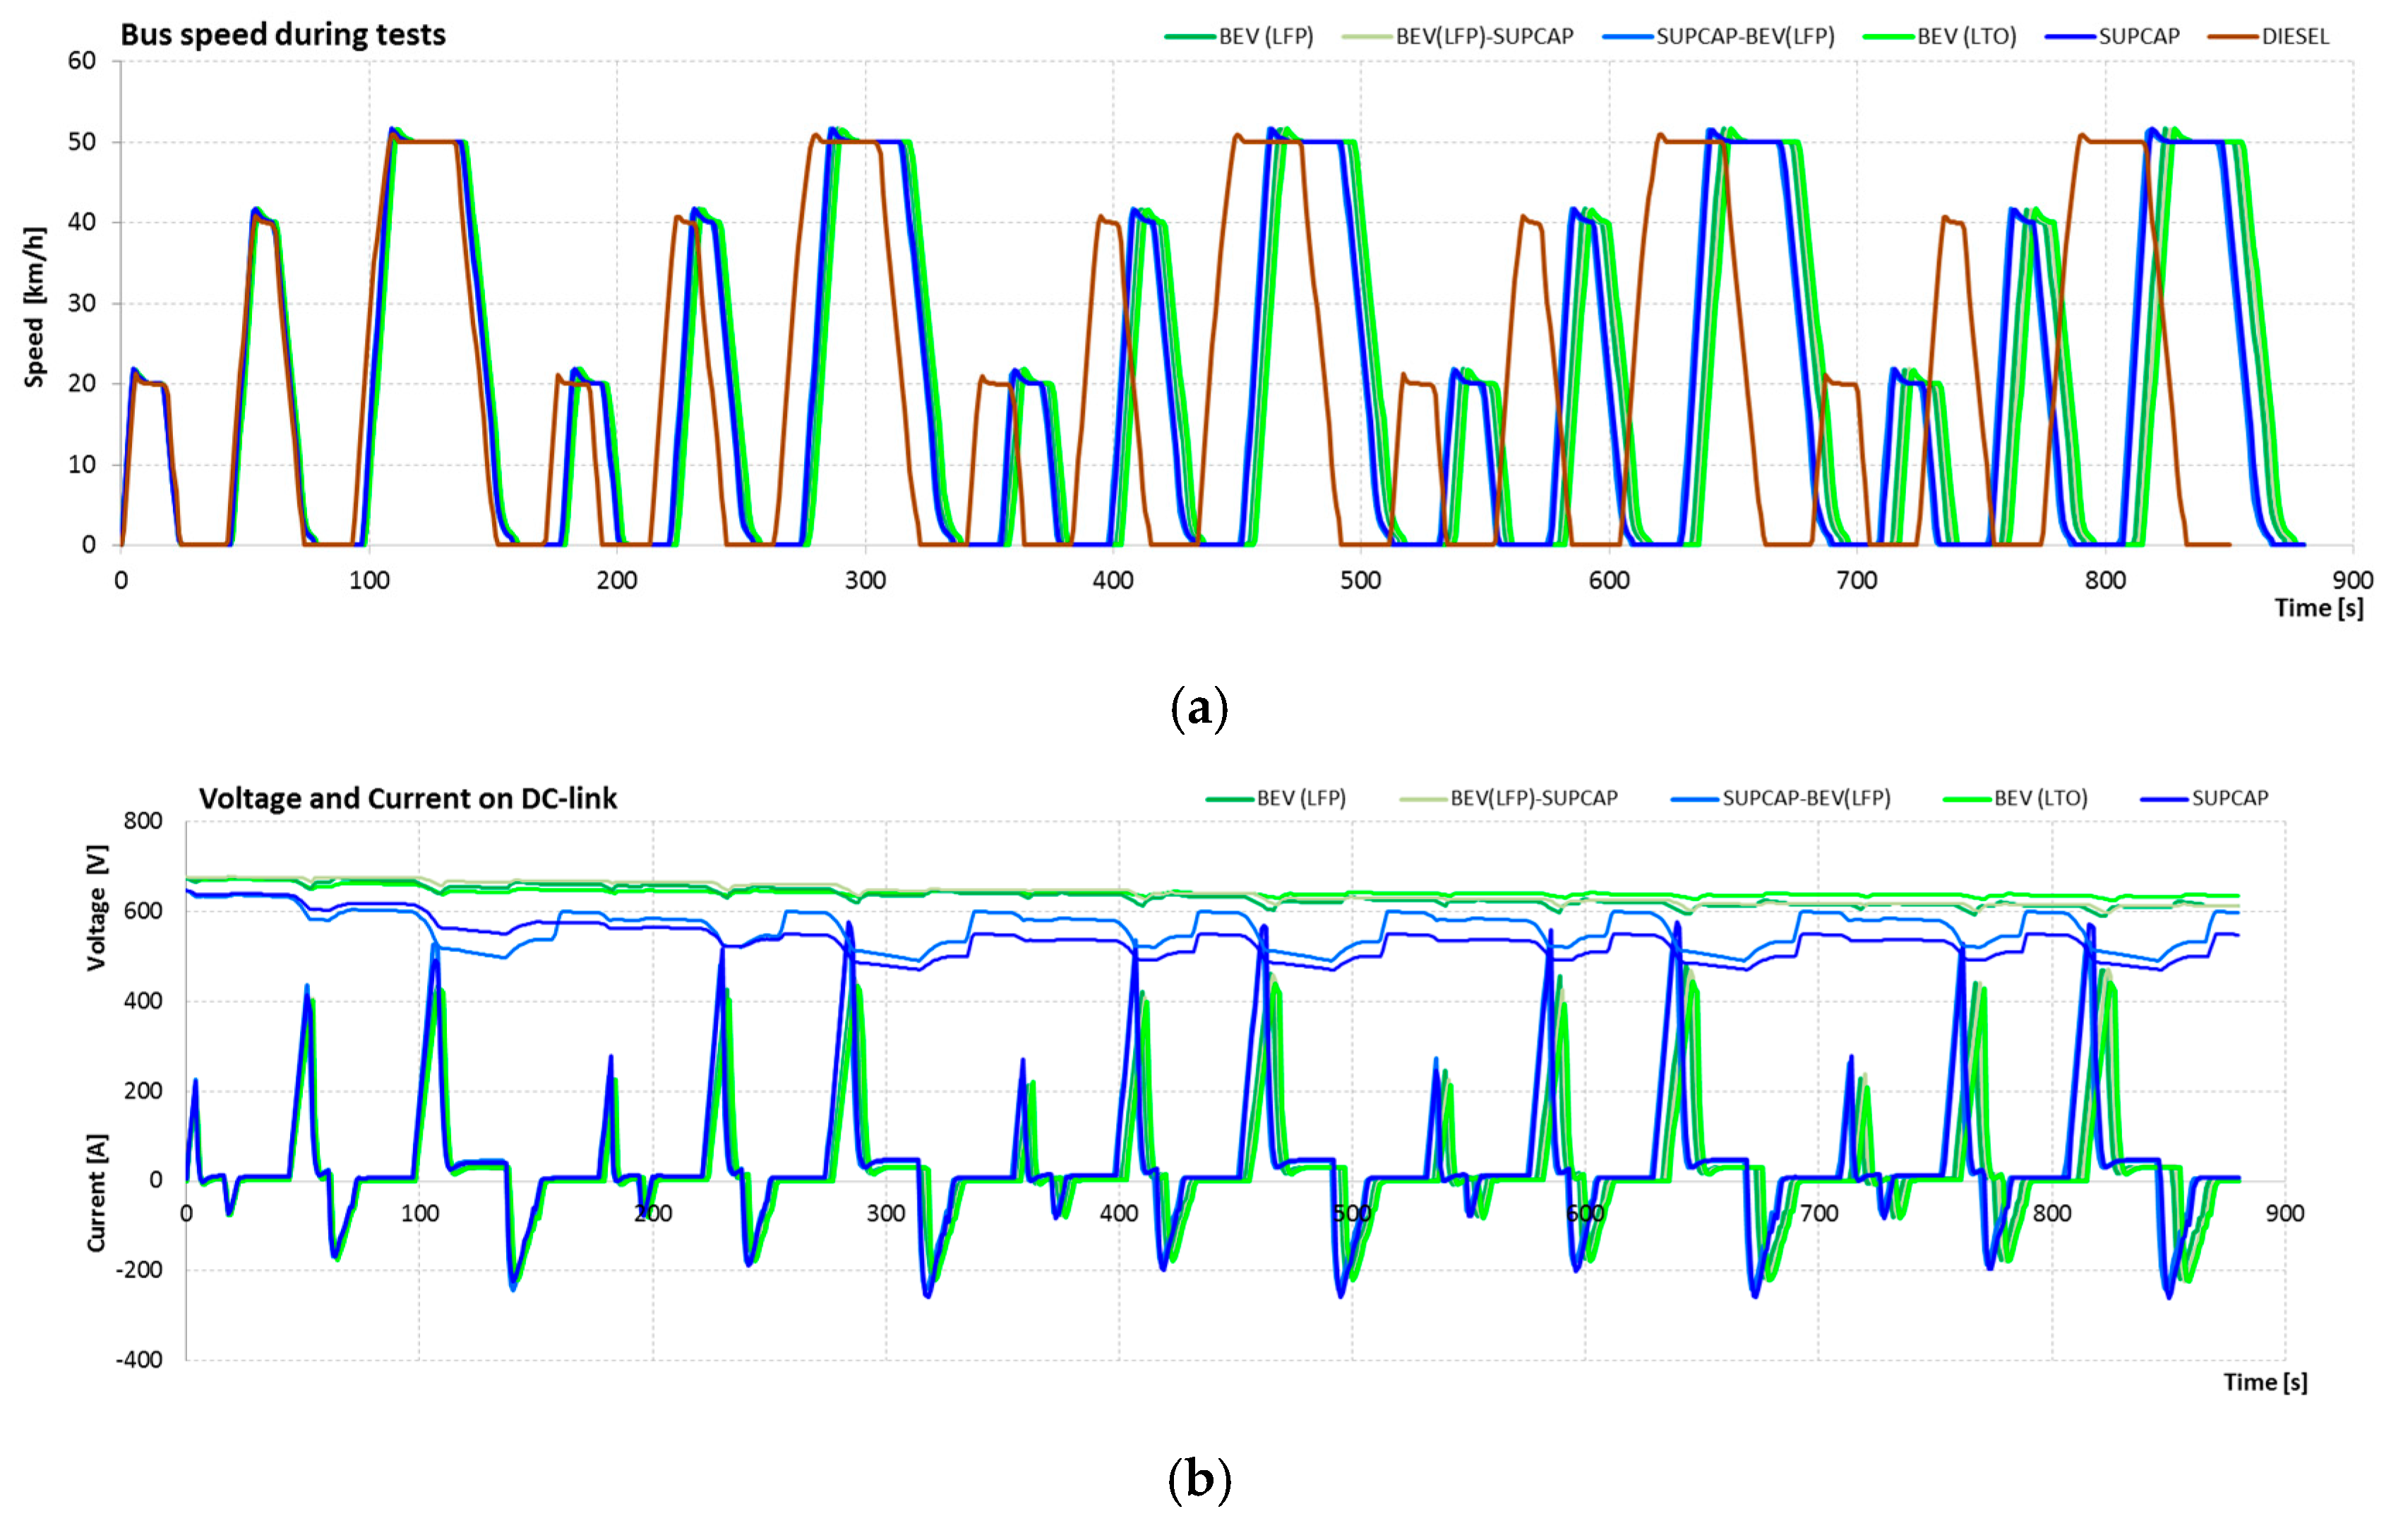
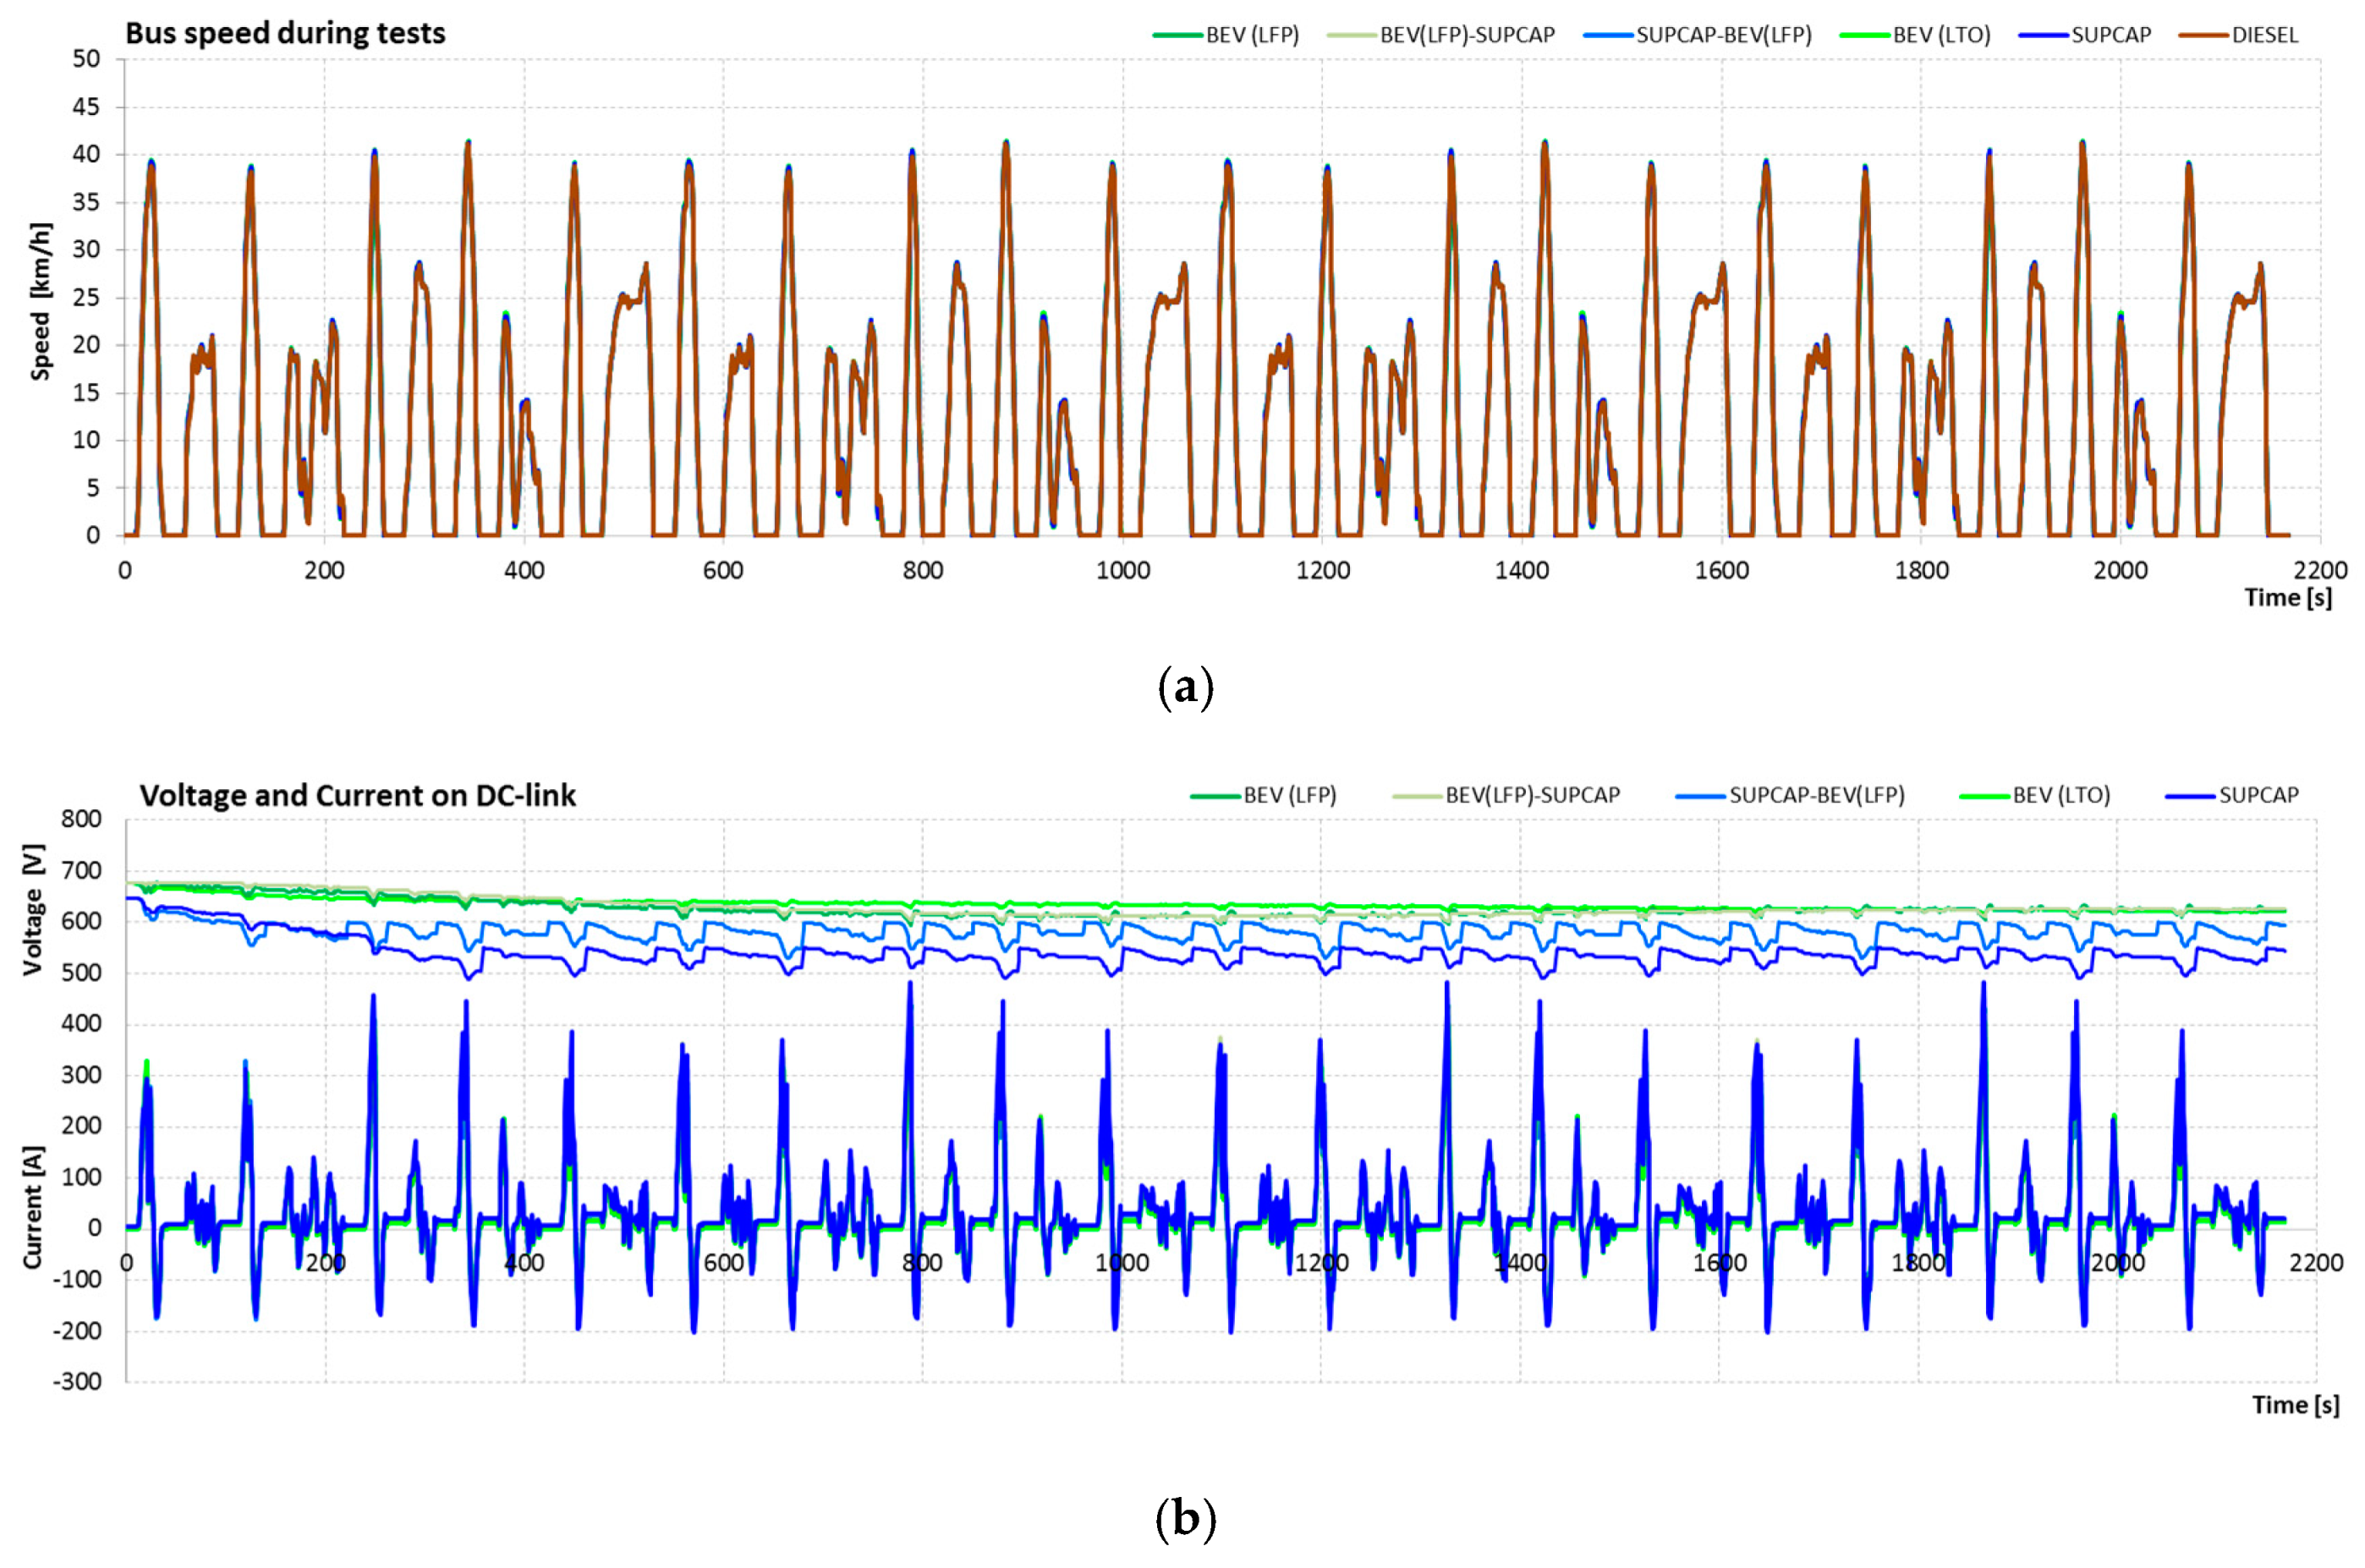
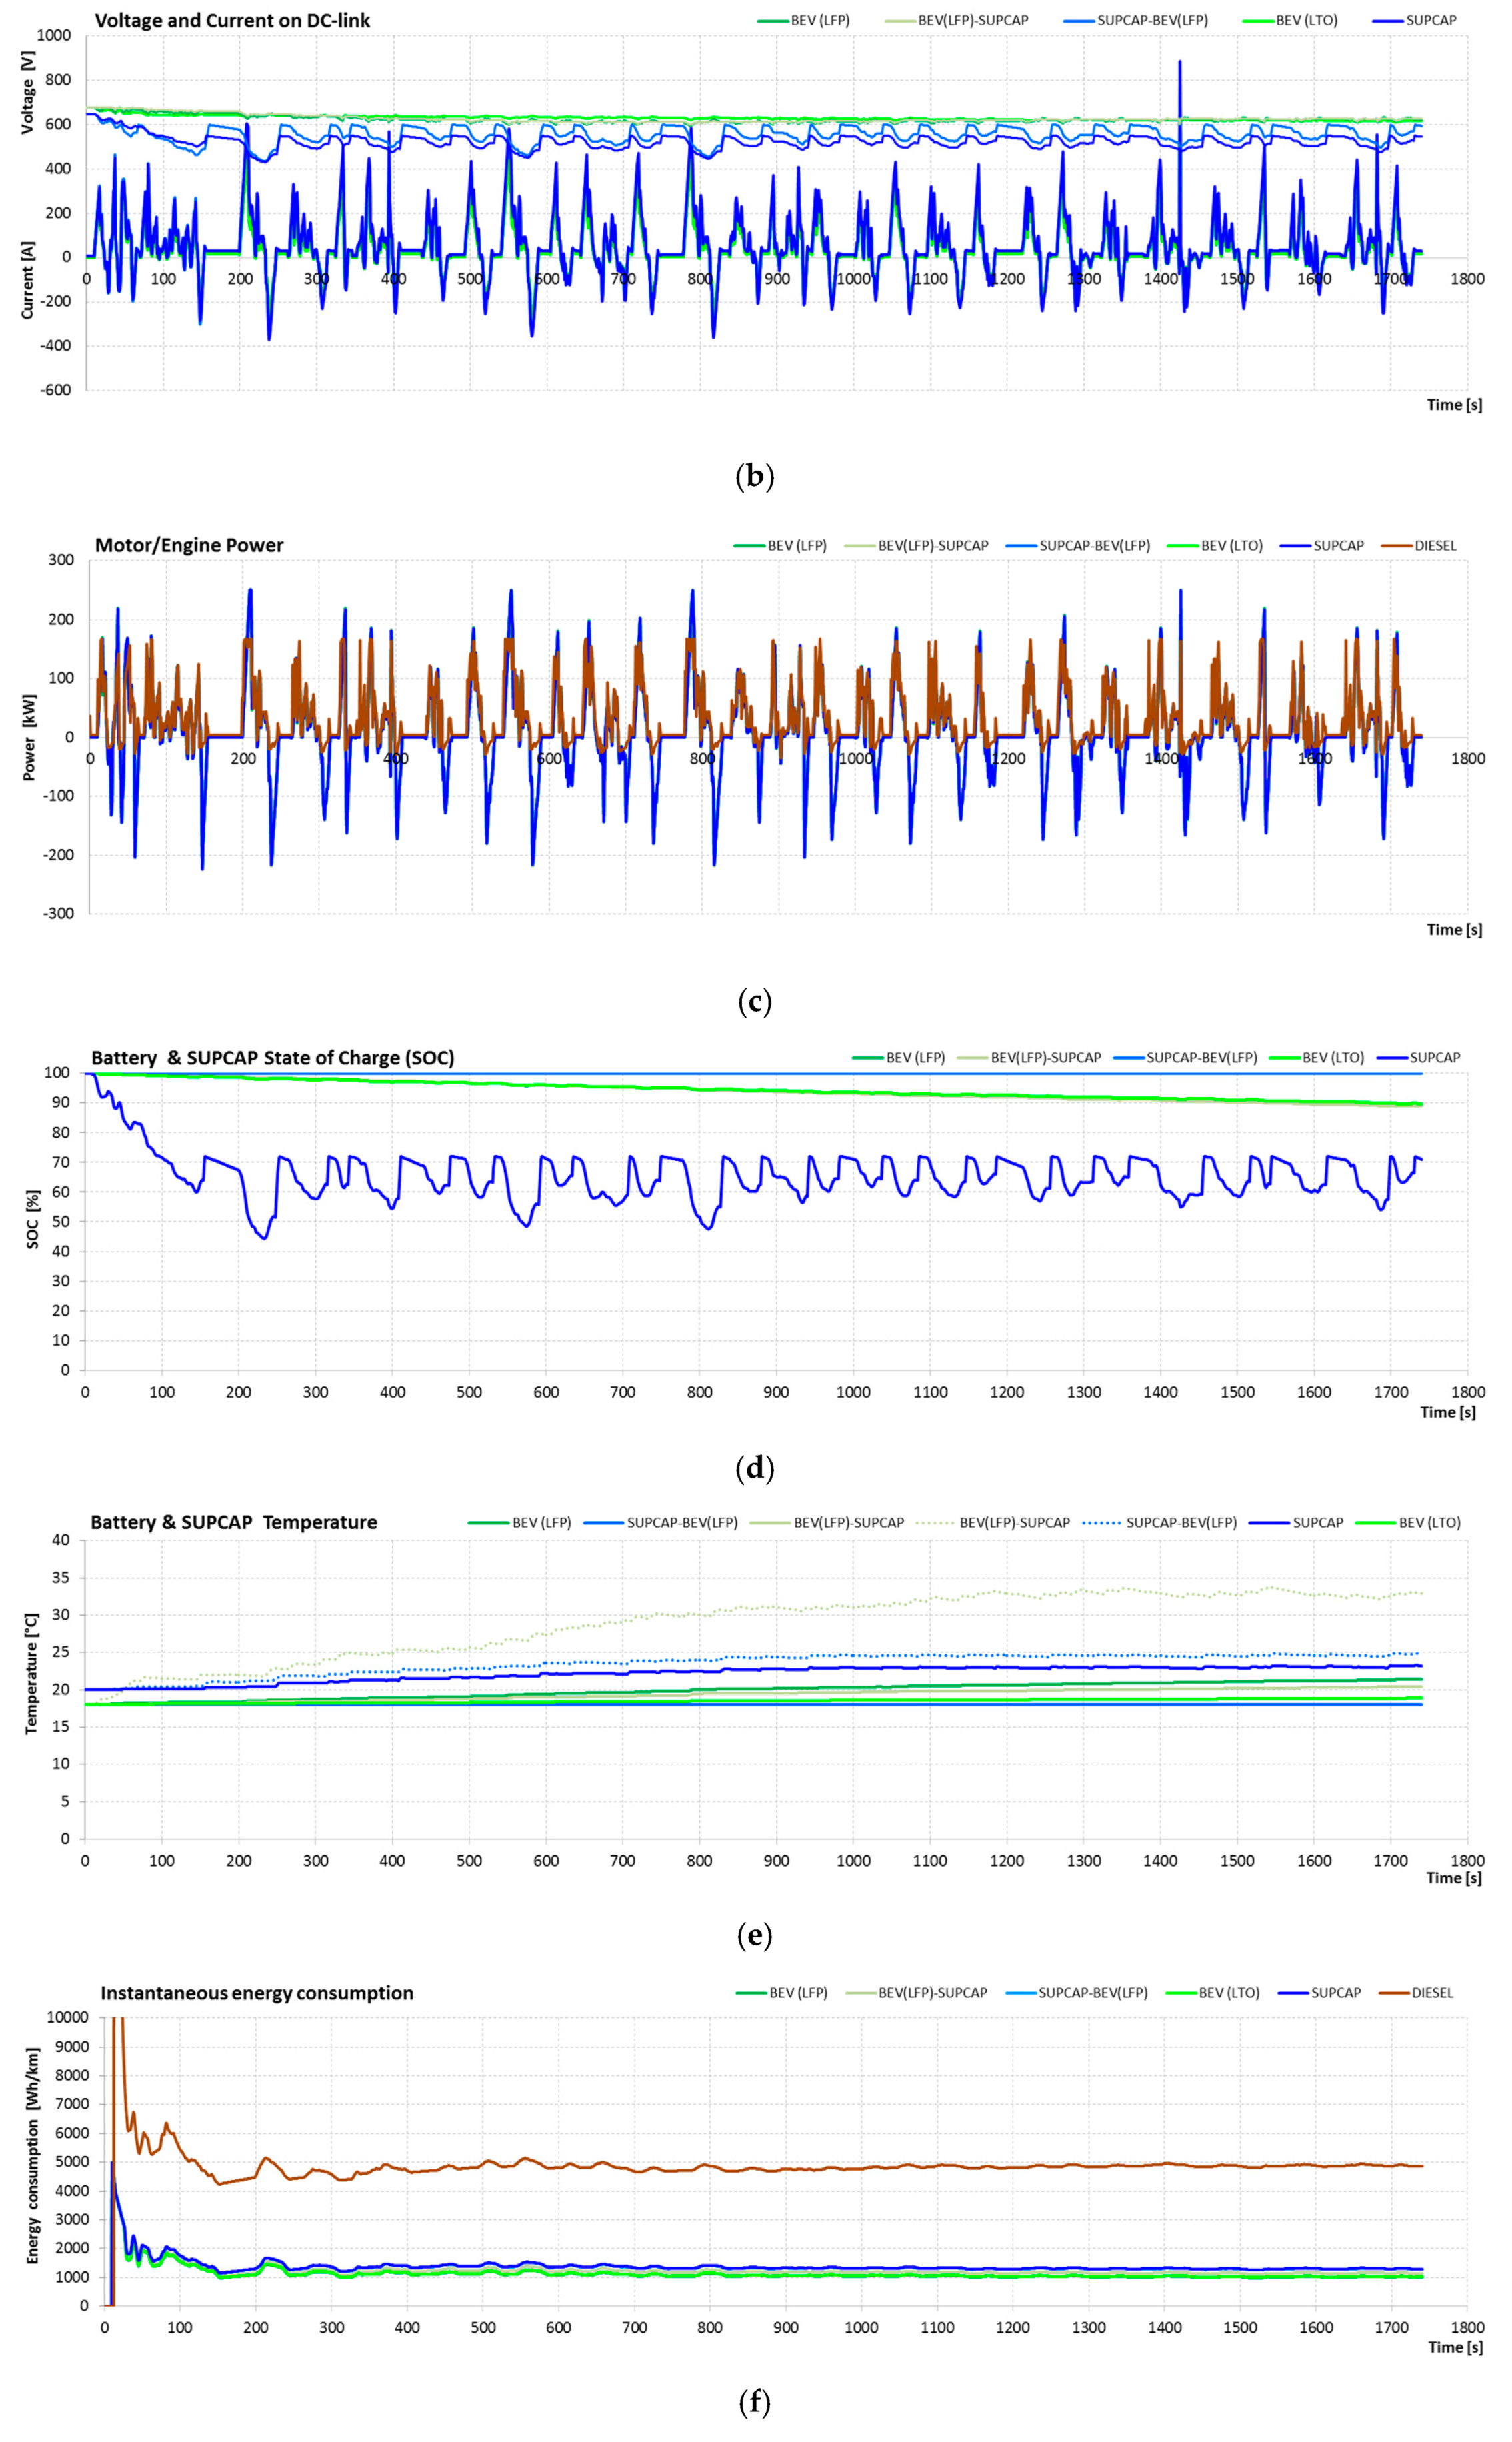
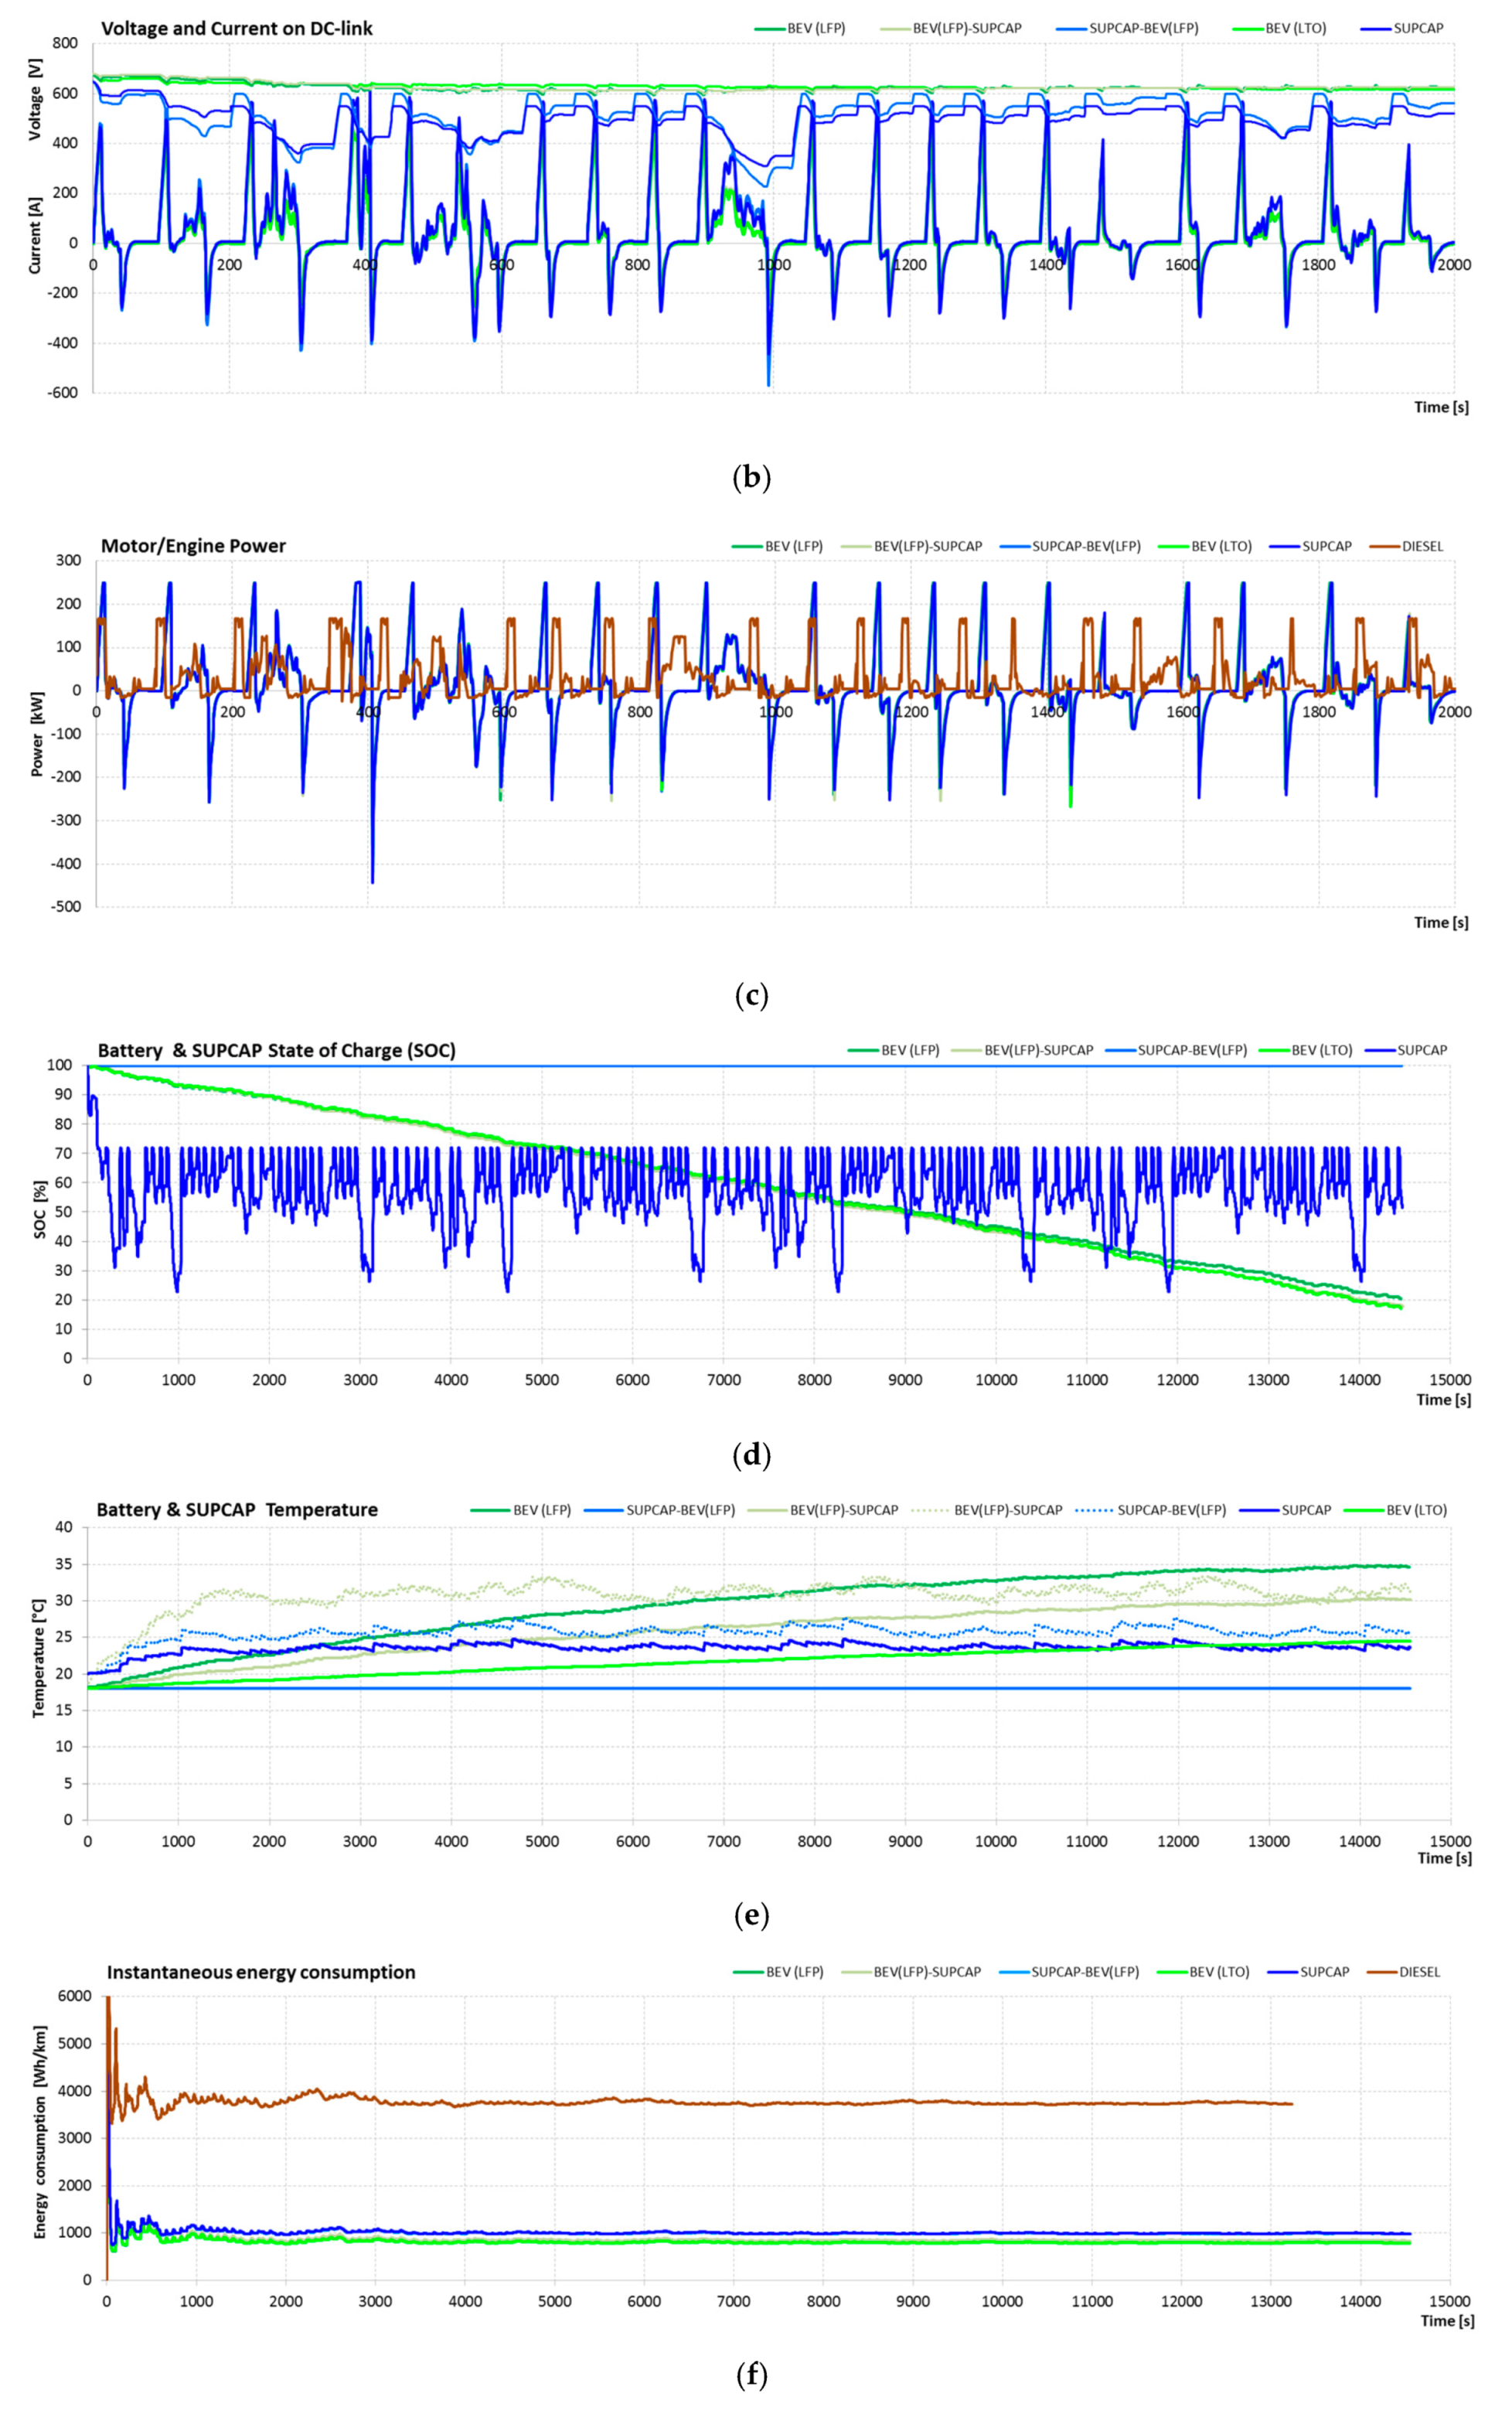
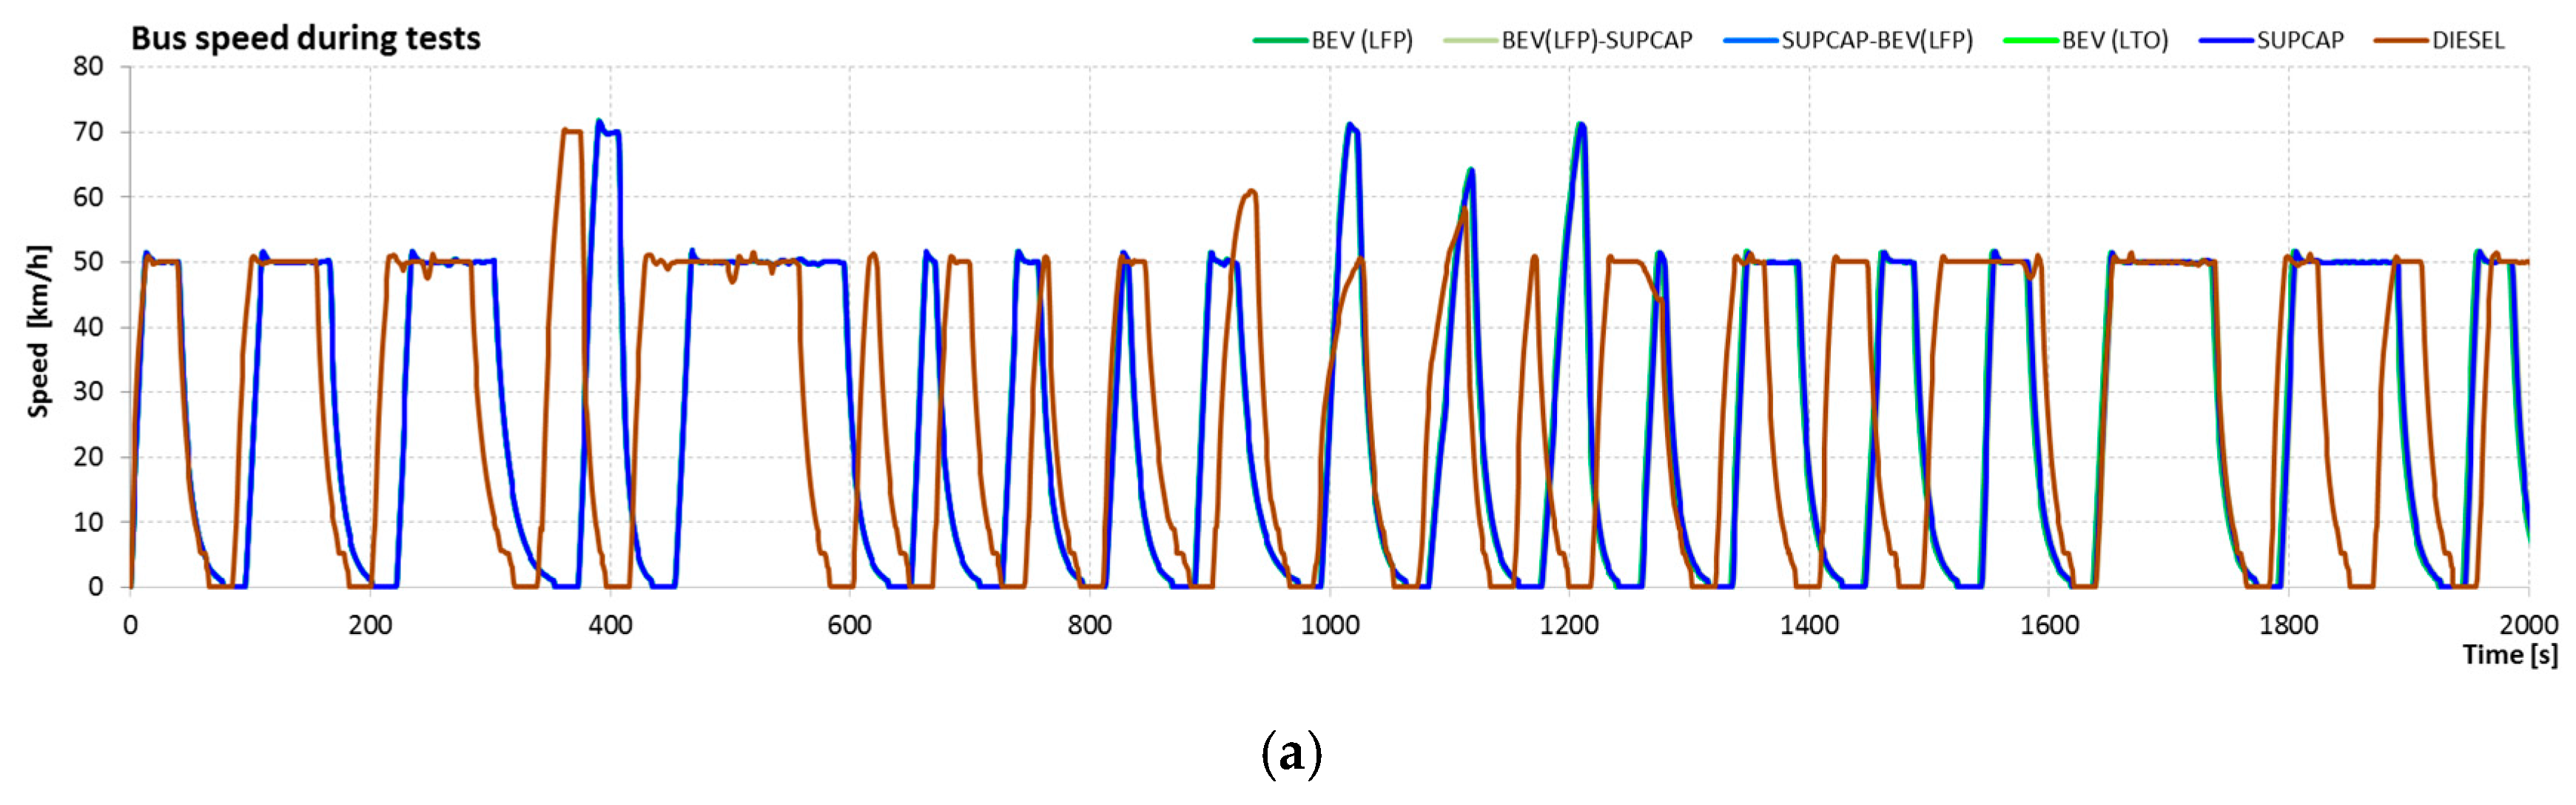
The SORT 1 cycle (Heavy Urban) [64] models the behavior of a heavy vehicle, such as a bus, for the intensity of road traffic in large cities. The average speed of the bus in this cycle is 12.1 km/h and results from the large number of stops during the tests due to the fact that the bus halts at stops and traffic lights. The maximum speed in SORT 1 is 40 km/h. The length of the test route is 0.52 km, and the travel time is about 154.5 s. During the tests, the basic SORT 1 route was repeated four times. Figure 8 shows the set value of the vehicle speed during the SORT 1 test.
Figure 9 shows the parameters obtained by vehicles during the SORT 1 test, such as speed, voltage and current on the DC-link, power, SOC of energy stores, temperature of energy stores, and instantaneous and total energy consumption.
The average distance traveled by the vehicle in this test was 2.6 km. Conducted tests using the SORT 1 test cycle confirmed the assumption that it belongs to one of the most demanding test cycles. Nevertheless, all vehicles have managed the test route and completed the test.
Despite the small difference in the mass of tested vehicles—not exceeding 2% of total mass—there were significant differences in energy consumption resulting from the properties of individual components of the electric drive system. From the presented characteristics, the lowest energy consumption was recorded for a battery system consisting of LTO (967.8 Wh/km), followed by BEV (LFP) (990.5 Wh/km), BEV (LFP)-SUPCAP (1016.2 Wh/km), BEV (LFP) (1239.9 Wh/km), SUPCAP-BEV (LFP) (1000 Wh/km), SUPCAP (1239.9 Wh/km), and DIESEL (5793.2 Wh/km). In relation to the diesel power system, energy consumption was correspondingly lower for the BEV system (LTO) by 83.3%, BEV (LFP) by 82.9%, BEV (LFP)-SUPCAP by 82.5%, SUPCAP -BEV (LFP) by 78.6%, and SUPCAP by 78.6%.
From the presented results, a regenerative braking at the level of 30–40% was obtained for the electric bus traveling at a low average speed. With the exception of the SUPCAP energy store variant, relatively small changes in temperature have been recorded, which resulted from the short time of their operation.
4.1.2. Bus Energy Consumption Tests Using the SORT 2 Test
The SORT 2 cycle (Easy Urban) [64] depicts traffic conditions in cities.
The average speed of the bus in this cycle is 18 km/h, and the maximum speed is 50 km/h. The length of the test route is 0.9 km, and the travel time is around 183.9 s. During the tests, the basic route was looped four times. Figure 10 shows the value of the set vehicle speed during the SORT 2 test.
Figure 11 presents the parameters obtained by vehicles during the SORT 2 test, such as speed, voltage and current on the DC-link, power, SOC of energy stores, temperature of energy stores, and instantaneous and total energy consumption.
The average distance traveled by the vehicle in this test was 4.6 km. From the presented characteristics, the lowest energy consumption was recorded for a battery system based on LTO (841.2 Wh/km), followed by BEV (LFP) (870.6 Wh/km), BEV (LFP)-SUPCAP (893.3 Wh/km), SUPCAP-BEV (LFP) (1030.6 Wh/km), SUPCAP (1041.5 Wh/km), and DIESEL (4703.3 Wh/km). In relation to the diesel power system, energy consumption was correspondingly lower for the BEV system (LTO) by 82.1%, BEV (LFP) by 81.5%, BEV (LFP)-SUPCAP by 81%, SUPCAP-BEV (LFP) by 78.1%, and SUPCAP by 77.9%.
The SORT family of tests has a gentle speed characteristic for both acceleration and braking. This allows the drive system to decelerate the bus speed only by regenerative braking and without the need to engage the vehicle’s main brakes. The periods of regenerative braking are visible in the total energy consumption graph as falling sections of the consumption curve, and also in the power diagram of the engine as periods of negative power. With the exception of systems with supercapacitors, there were no significant increases in the temperature of the energy store.
4.1.3. Bus Energy Consumption Tests Using the SORT 3 Test
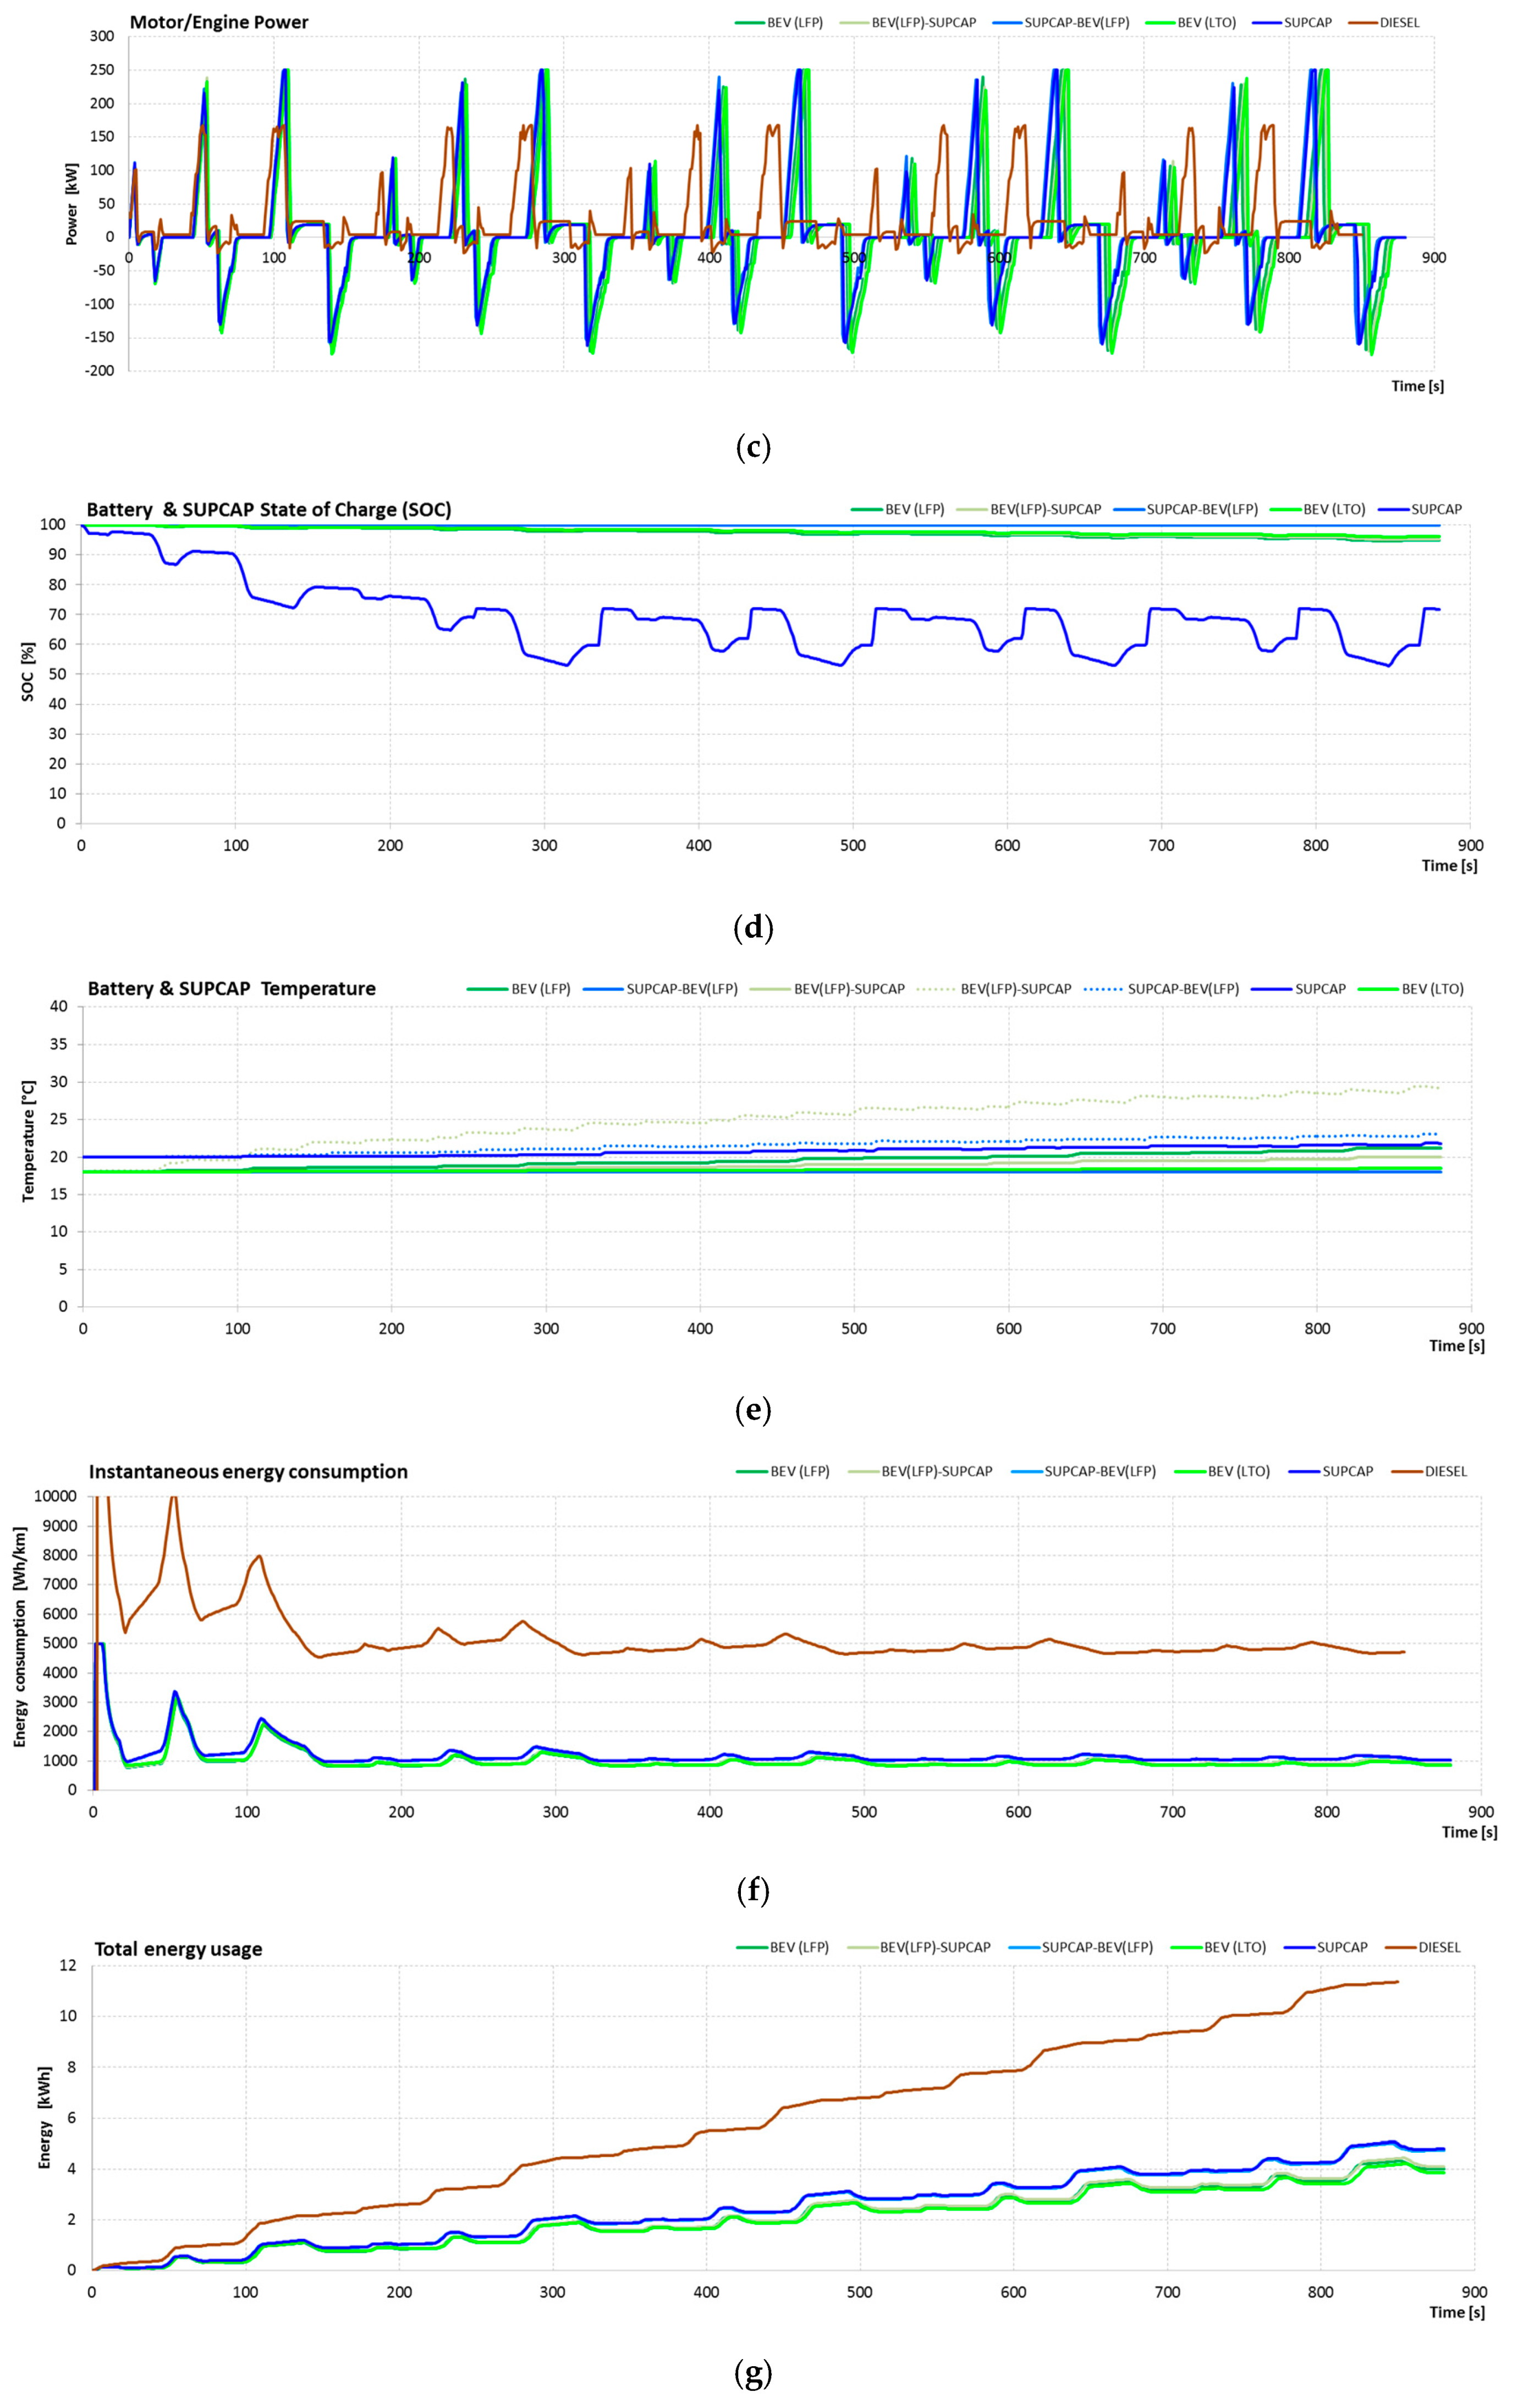
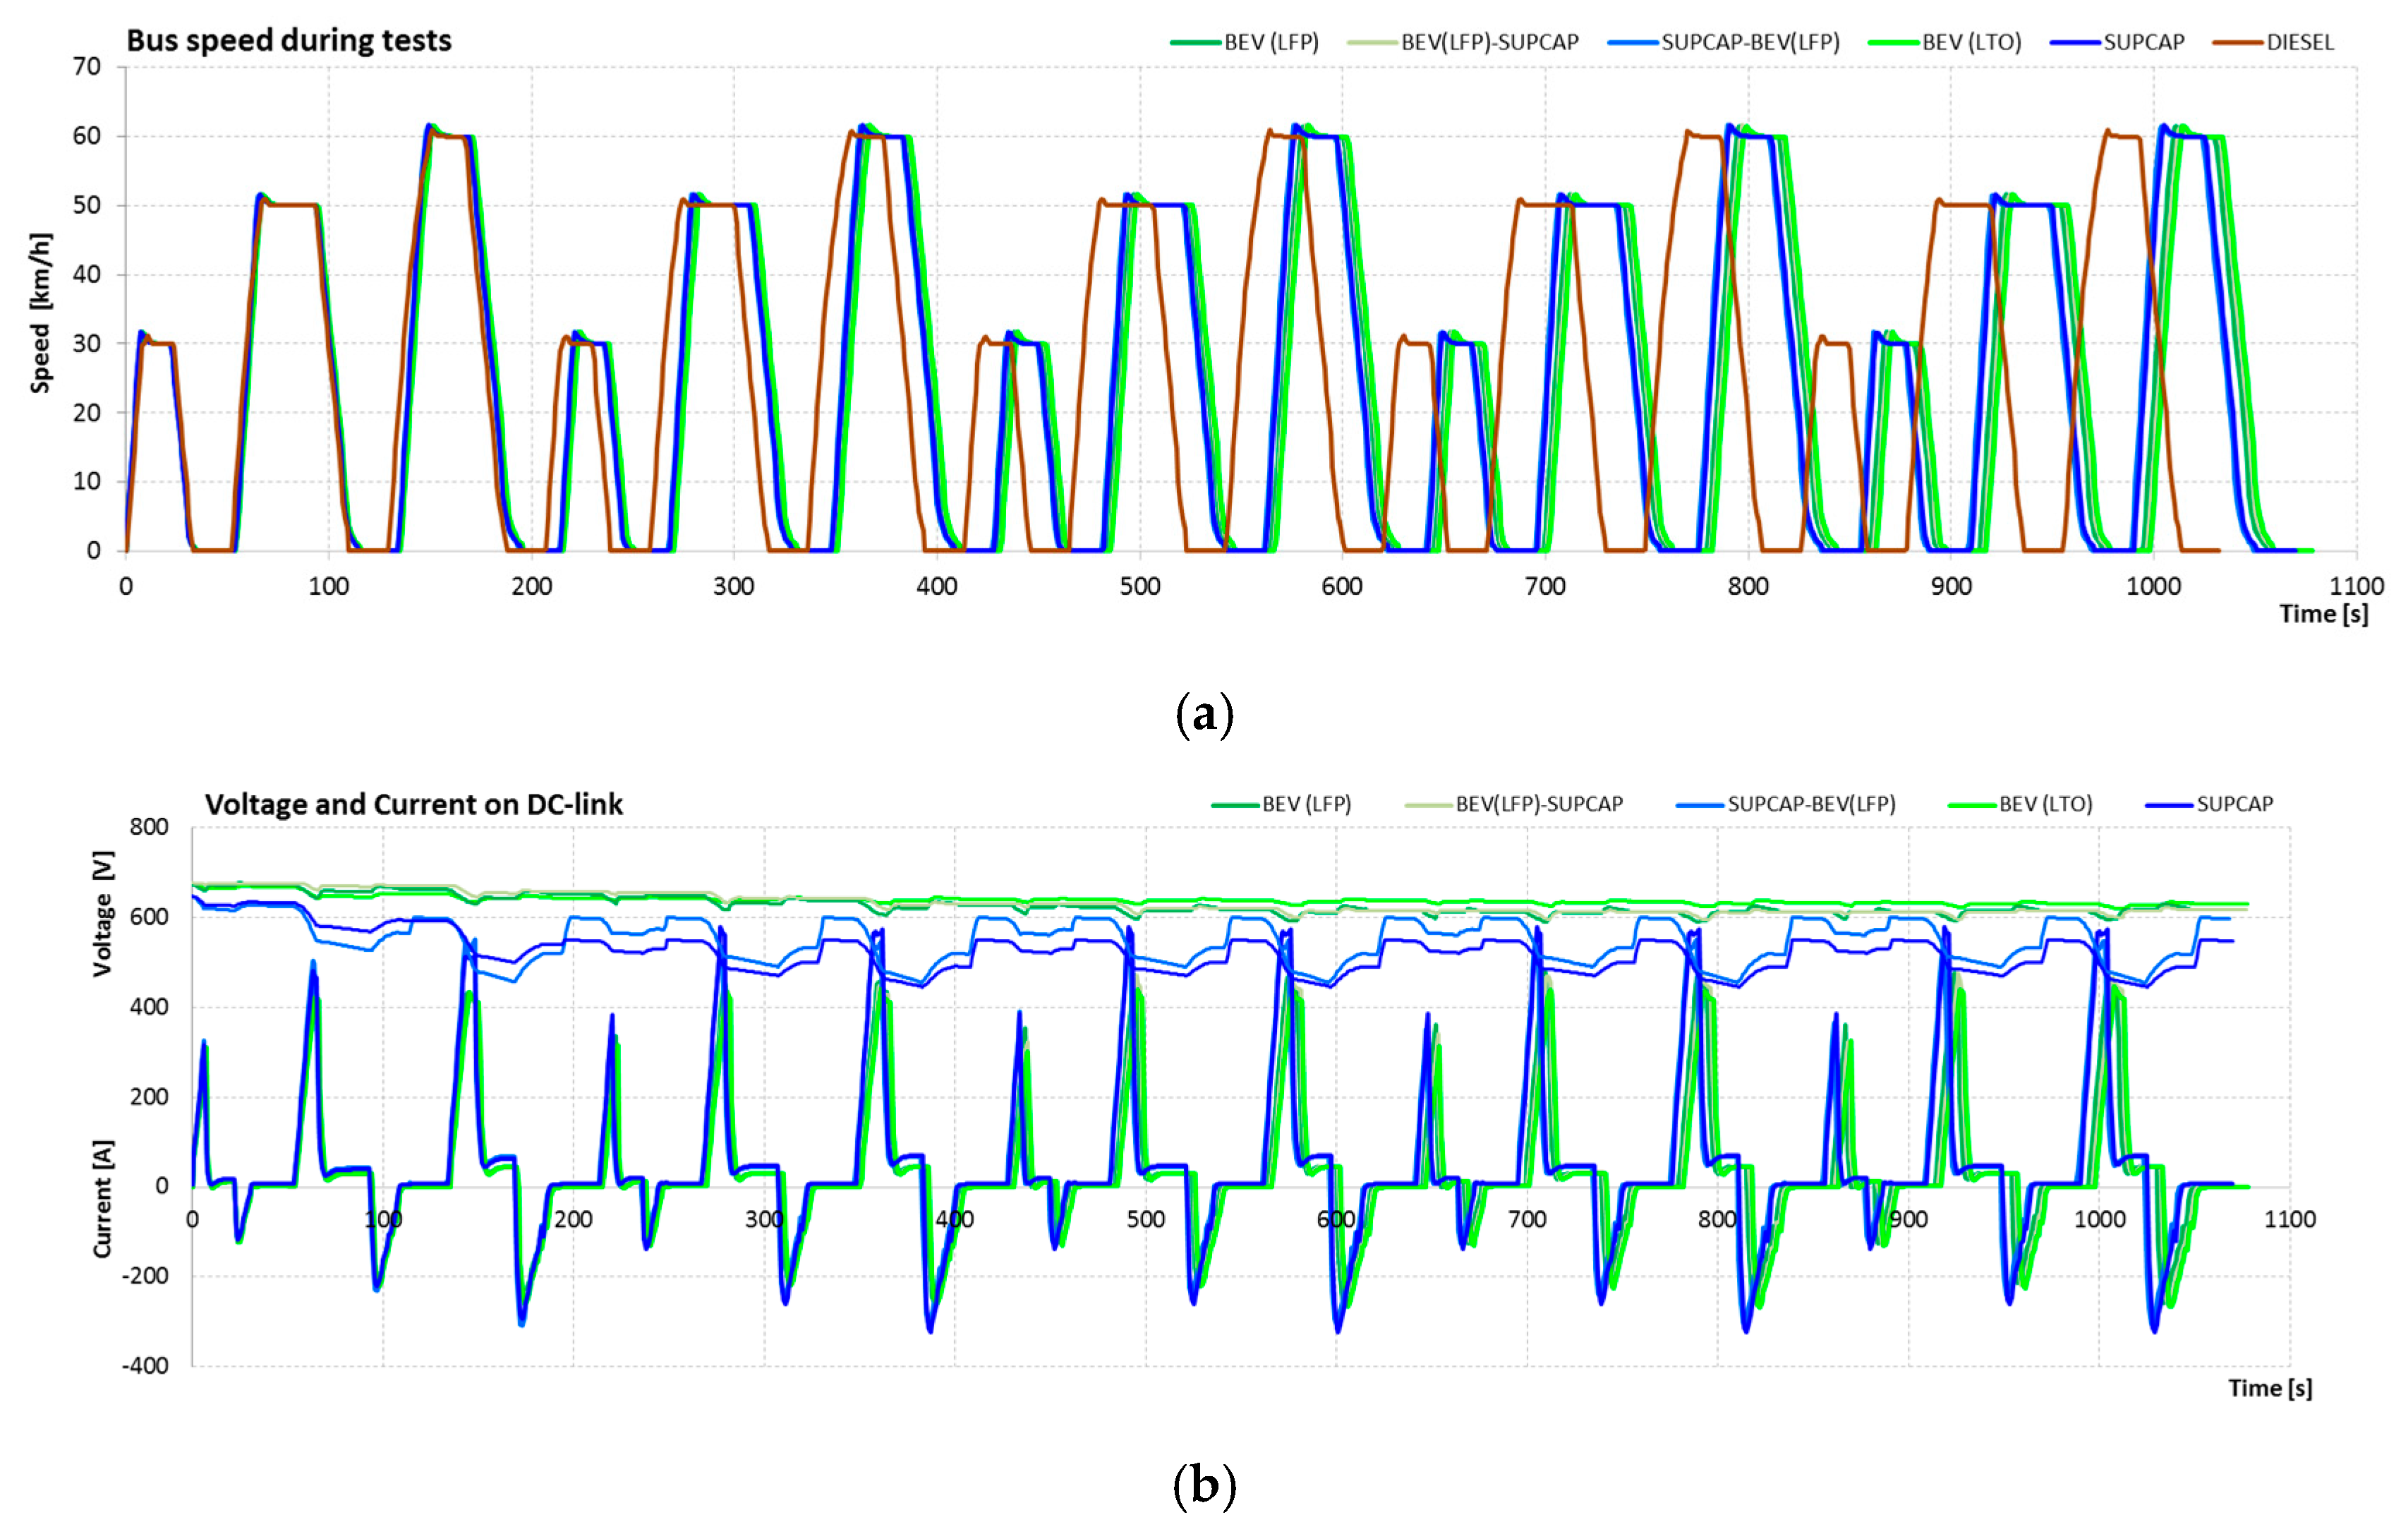
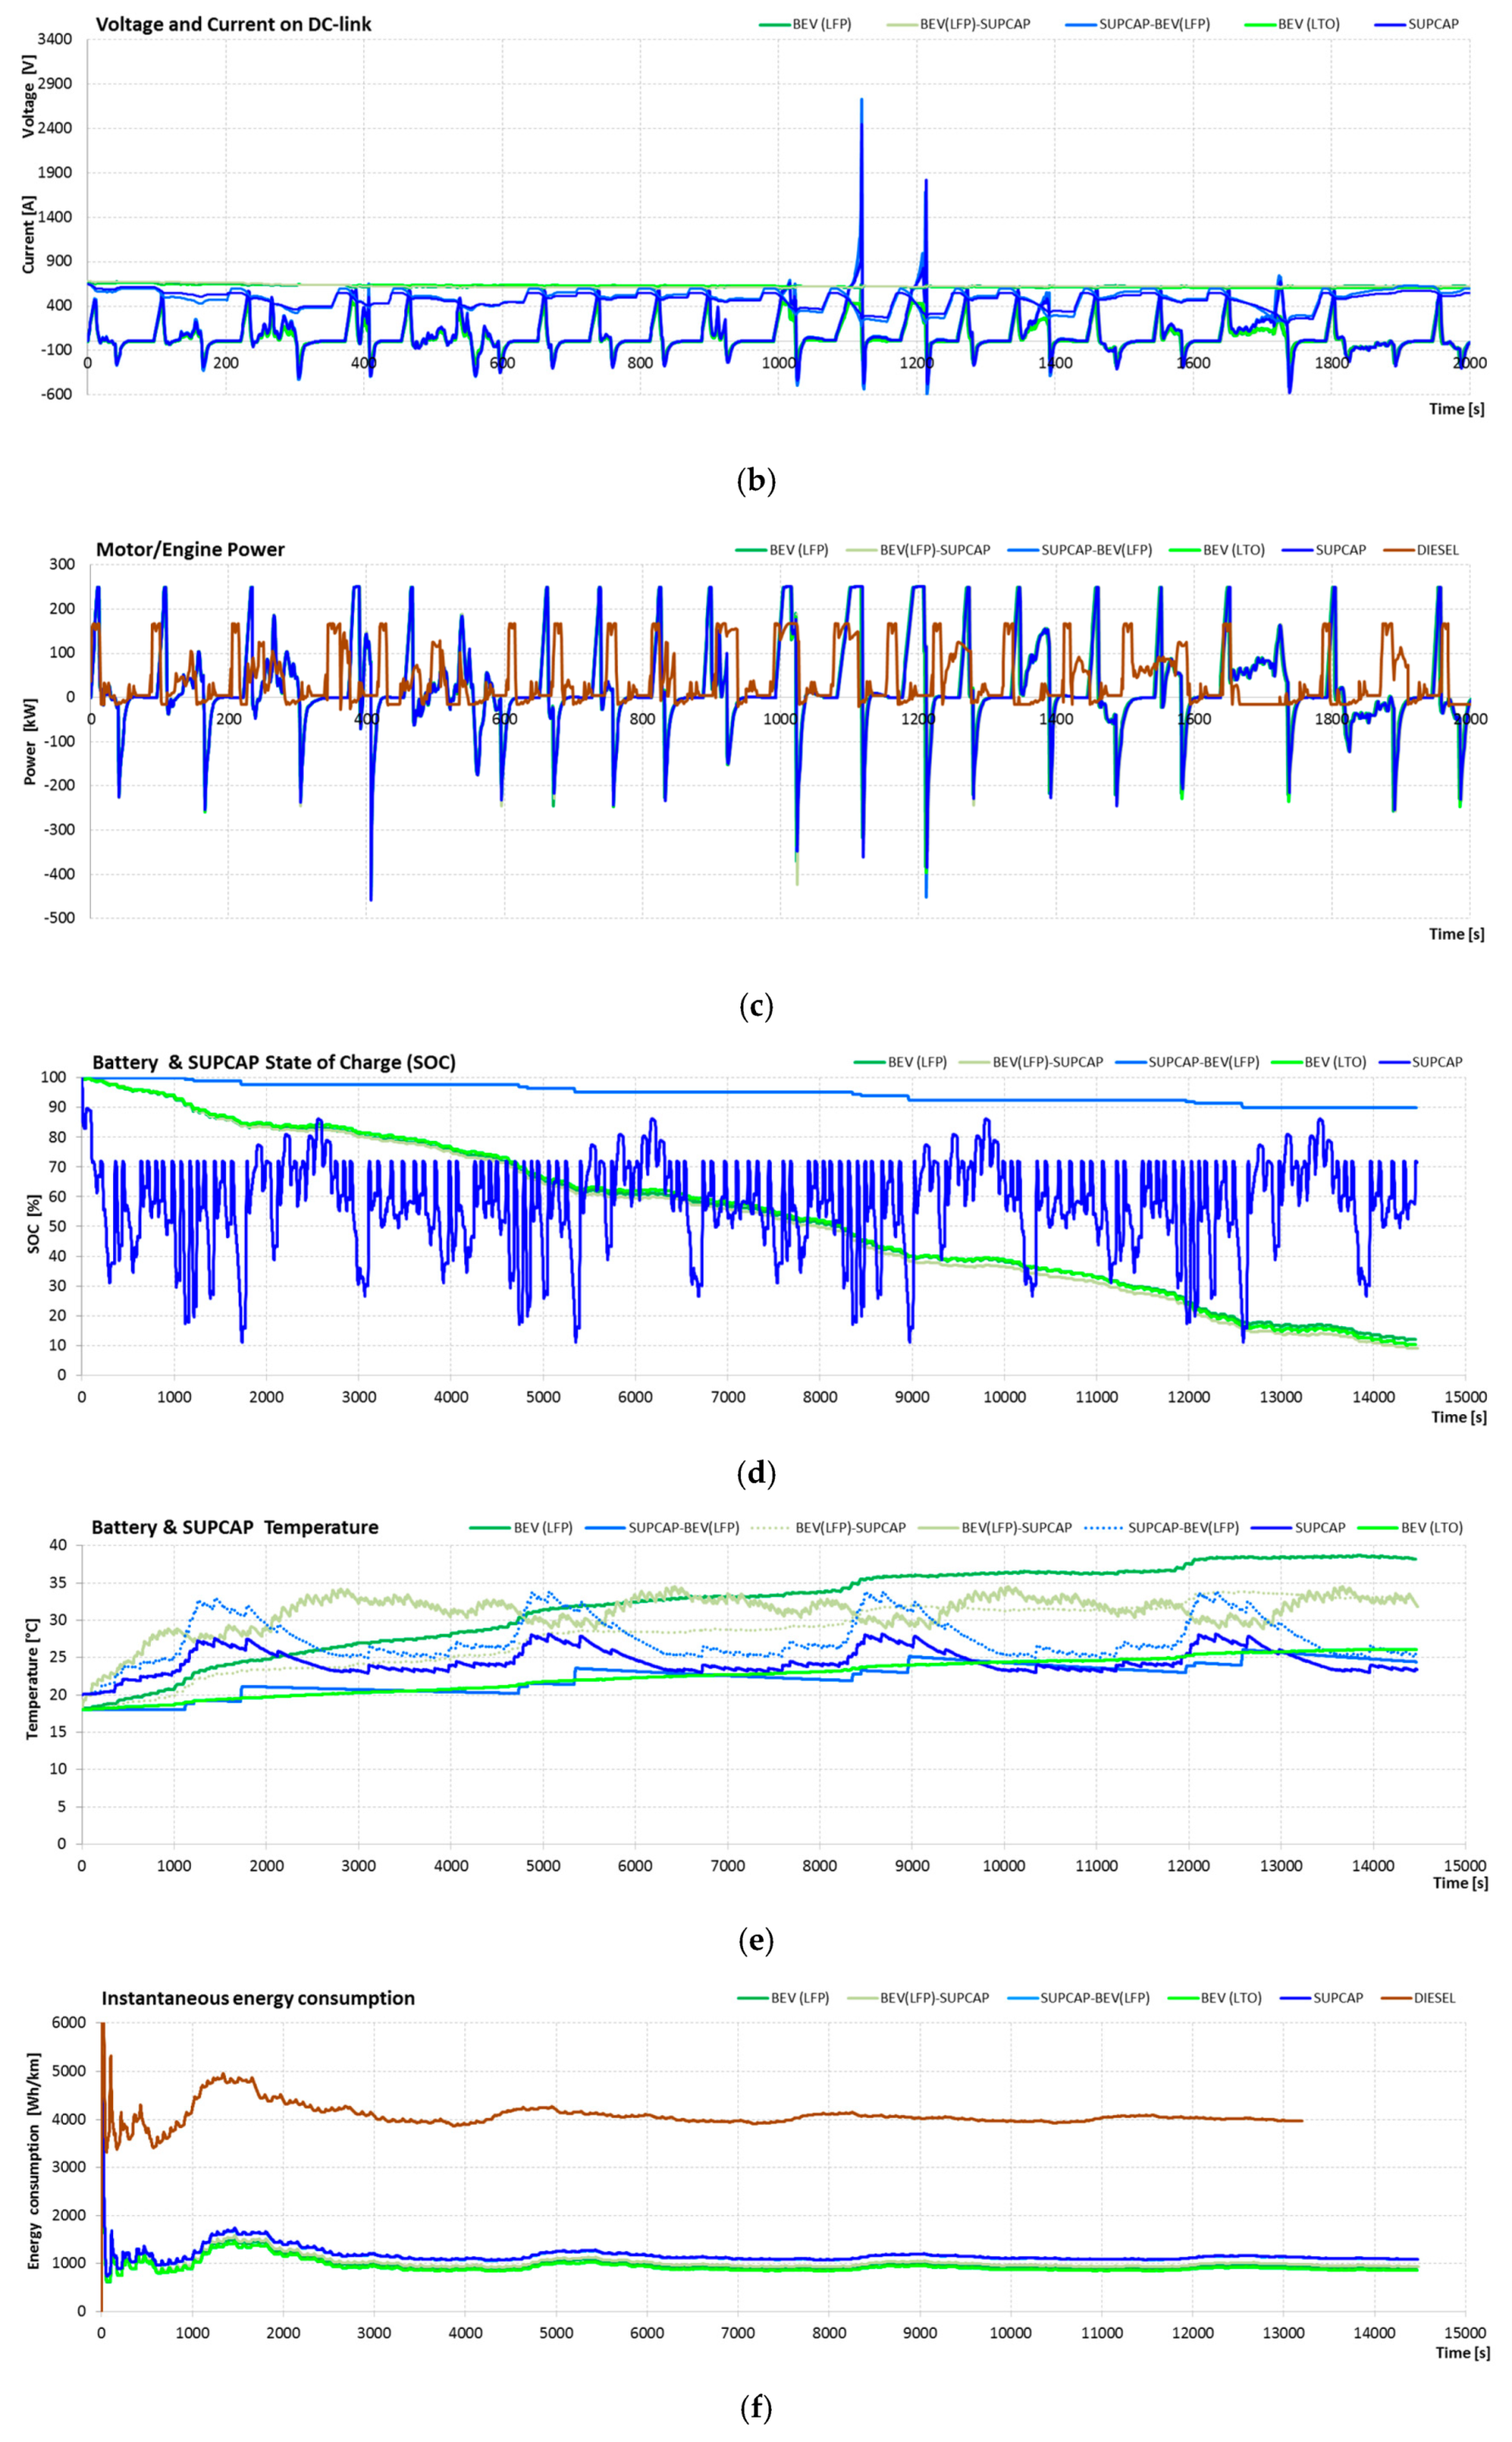
The SORT 3 cycle (Suburban) [64] describes traffic conditions prevailing in extra-urban traffic and on the outskirts of cities. The average speed of the bus in this cycle is 25.3 km/h, and the maximum speed is 60 km/h. The length of the test route is 1.45 km, and the travel time is around 206.2 s. During the tests, the fundamental route was looped four times. Figure 12 shows the value of the set vehicle speed during the implementation of the SORT 3 test.
Figure 13 presents the parameters obtained by vehicles during the SORT 3 test, such as speed, voltage and current on the DC-link, power, SOC of energy stores, temperature of energy stores, and instantaneous and total energy consumption.
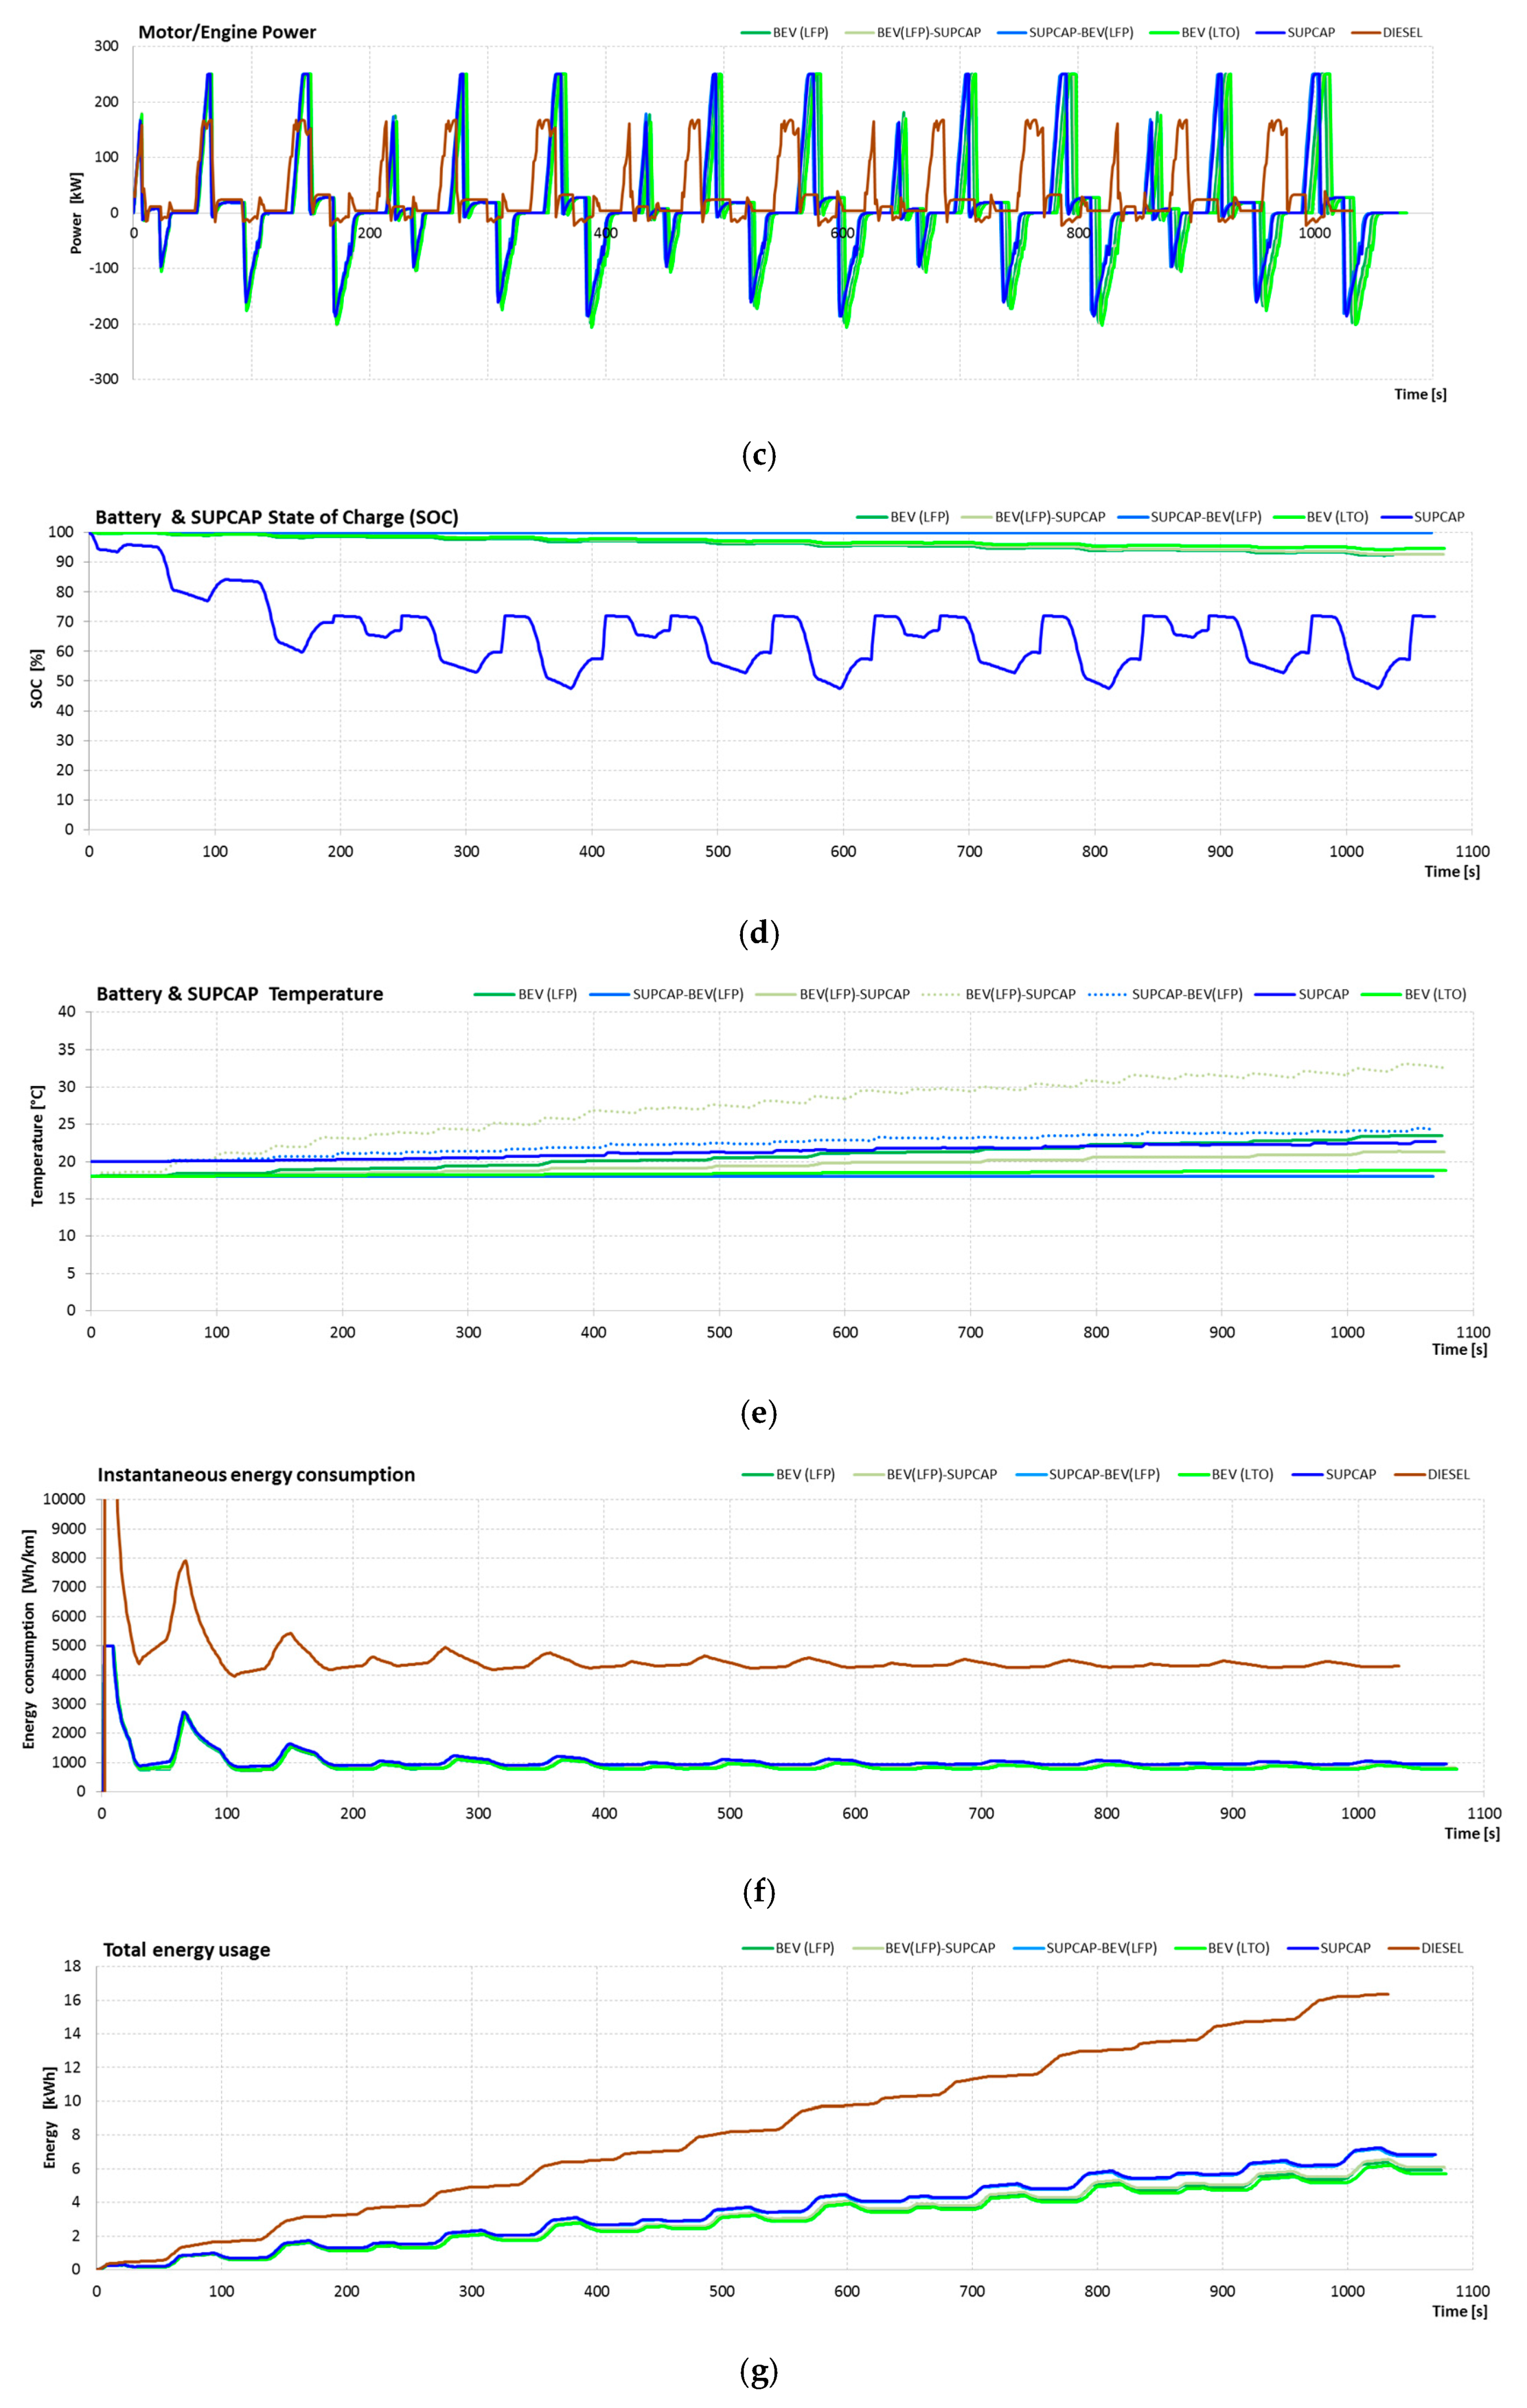
The average distance traveled by the vehicle in this test was 7.25 km. From the presented characteristics, the lowest energy consumption was recorded for a battery system using LTO (787.2 Wh/km), followed by BEV (LFP) (816.8 Wh/km), BEV (LFP) -SUPCAP (839.8 Wh/km), SUPCAP-BEV (LFP) (935.3 Wh/km), SUPCAP (945.9 Wh/km), and DIESEL (4297.2 Wh/km). In relation to the diesel power system, energy consumption was correspondingly lower for the BEV system (LTO) by 81.7%, BEV (LFP) by 81%, BEV (LFP)-SUPCAP by 80.5%, SUPCAP-BEV (LFP) by 78.2%, and SUPCAP by 78%.
Based on the registered data related to the energy consumption for all 3 SORT cycles, three types of drive systems can be distinguished. The first type, with the least energy consumption, is associated with drive systems characterized by the predominant share of battery weight in the energy store (LTO, LFP, LFP-SUPCAP). The second type of drive system, with slightly higher energy consumption, includes systems where supercapacitors dominate the mass share in the energy storage system (SUPCAP and SUPCAP-BATT systems). The third type of drive system, with very high energy consumption, includes a drive system with an internal combustion engine.
In all three SORT tests, there was a beneficial effect on the work of the entire energy storage from adding a small supercapacitor. When comparing the temperature of the battery pack in the variants BEV (LFP) and BEV-SUPCAP, the battery in the variant with the supercapacitor shows a lower temperature increase, which can be explained by smaller current surges at the moment of regenerative braking. The recovered energy can be temporarily stored in a supercapacitor and later reused to accelerate the vehicle.
4.1.4. Studies of Energy Consumption by a Bus Using the UDDS-HD Test
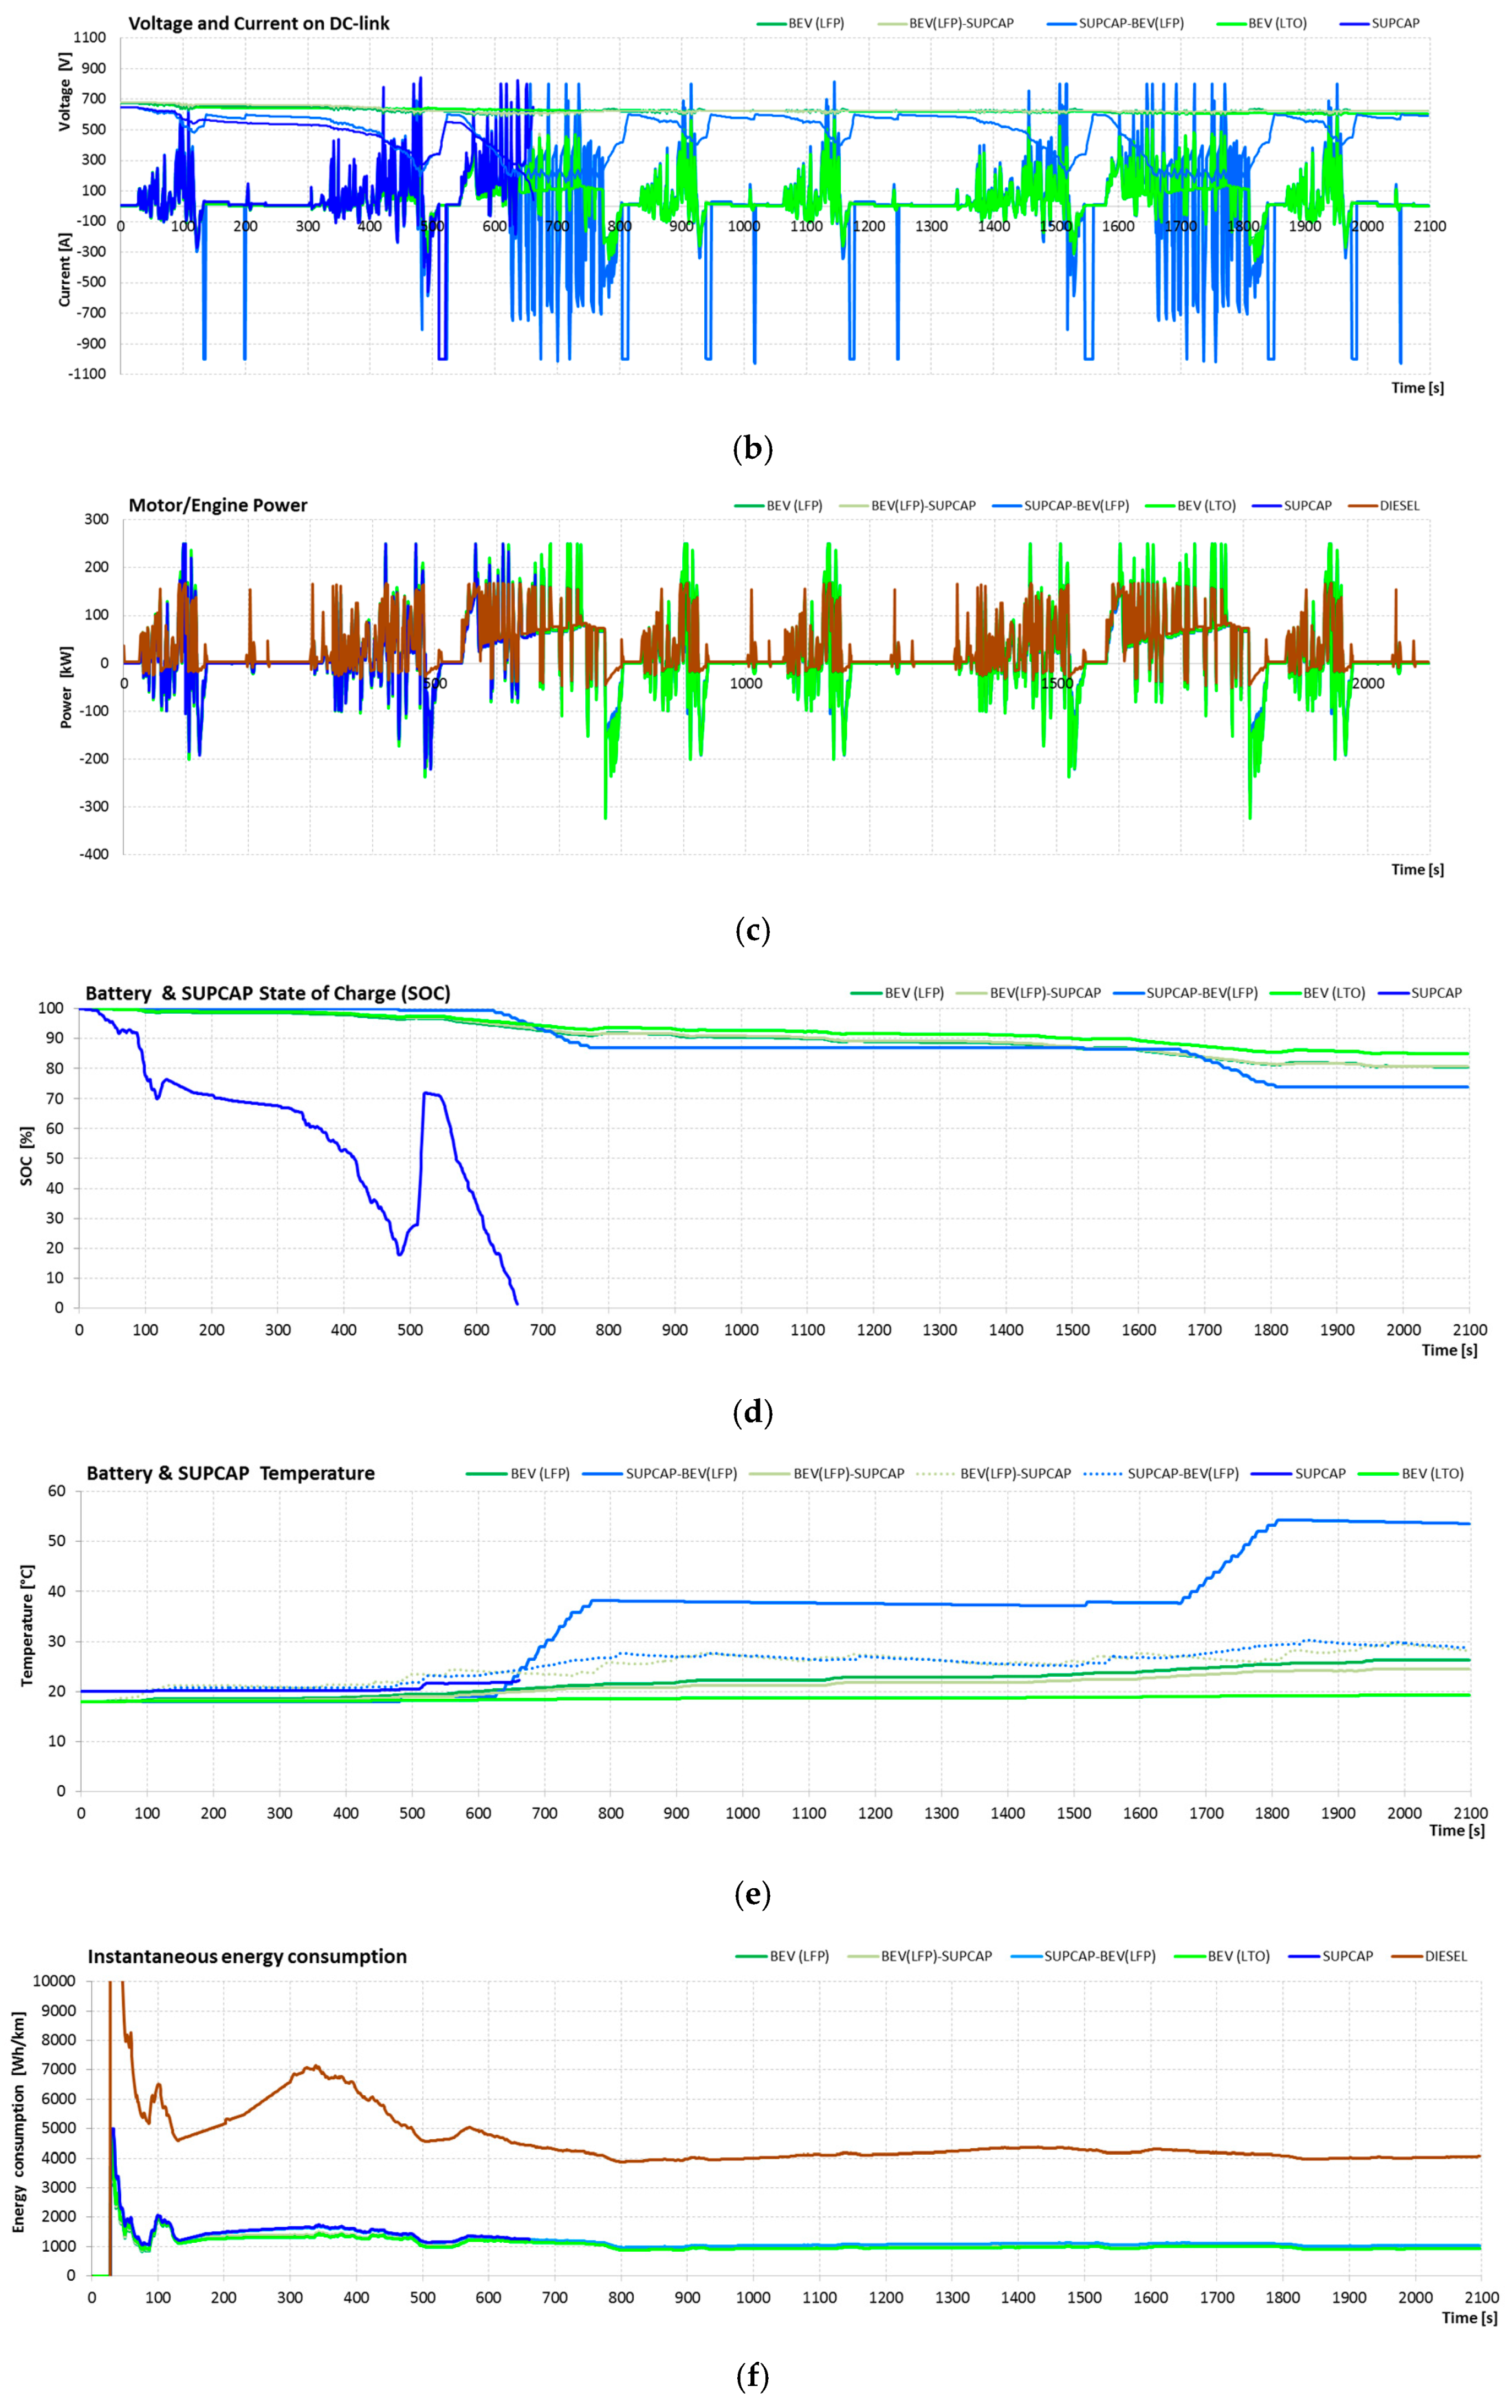
The UDDS-HD cycle [61] reflects the conditions of road traffic in large cities with fast traffic sections. The average speed of the bus in this cycle is 30.4 km/h, and the top speed is 93.3 km/h. The duration of the test is 1060 s, and the test route is 8.9 km long. During the tests, the route was looped twice. Figure 14 shows the set value of the vehicle speed during the UDDS-HD test.
Figure 15 presents the parameters obtained by vehicles during the UDDS-HD test, such as speed, voltage and current on the DC-link, power, SOC of energy stores, temperature of energy stores, and instantaneous and total energy consumption.
The average distance traveled by the vehicle in this test was 17.8 km. From the presented characteristics, the lowest energy consumption was recorded for a battery system consisting of LTO (924.6 Wh/km), followed by BEV (LFP) (949.4 Wh/km), BEV (LFP)-SUPCAP (972.6 Wh/km), SUPCAP-BEV (LFP) (1038.2 Wh/km), SUPCAP (1246.8 Wh/km), and DIESEL (4067.1 Wh/km). In relation to the diesel power system, energy consumption was correspondingly lower for the BEV system (LTO) by 77.3%, BEV (LFP) by 76.7%, BEV (LFP)-SUPCAP by 76.1%, SUPCAP-BEV (LFP) by 74.5%, and SUPCAP by 69.3%.
In this test, the presence of the prolonged high speed section caused a rapid depletion of energy in the supercapacitor bank, which terminated the route prematurely. Energy consumption data concerning the SUPCAP variant takes into account only the short distance travelled in this test.
This example perfectly illustrates that the selection of the electric bus power source for a given route profile, that is the final place of operation, must be thought out beforehand and precisely calculated. Supercapacitors with too small capacities will not provide enough energy for travelling the distance between stops. In turn, too large capacities of the supercapacitors are associated with significant increase in weight of the vehicle and energy losses associated with the transport of excess mass.
Figure 13b shows the moments of recharging supercapacitors during bus stopping (SUPCAP and SUPCAP-BEV variants) as well as periodic replenishment of energy from an additional small battery pack while driving (variant SUPCAP-BEV). Figure 13e also shows rapid temperature increases in the additional battery pack caused by high power consumption when the bus is moving at high speed sections of the test cycle.
During the UDDS-HD test, there are sections with mild acceleration up to the set value of the vehicle speed, with a small number of sections where it would be possible to achieve a significant regenerative braking effect. As a result, the supercapacitors act as an energy buffer to a small extent. The effect of this operating state is a stabilized temperature level of the energy storage, which entails smaller losses for its potential cooling.
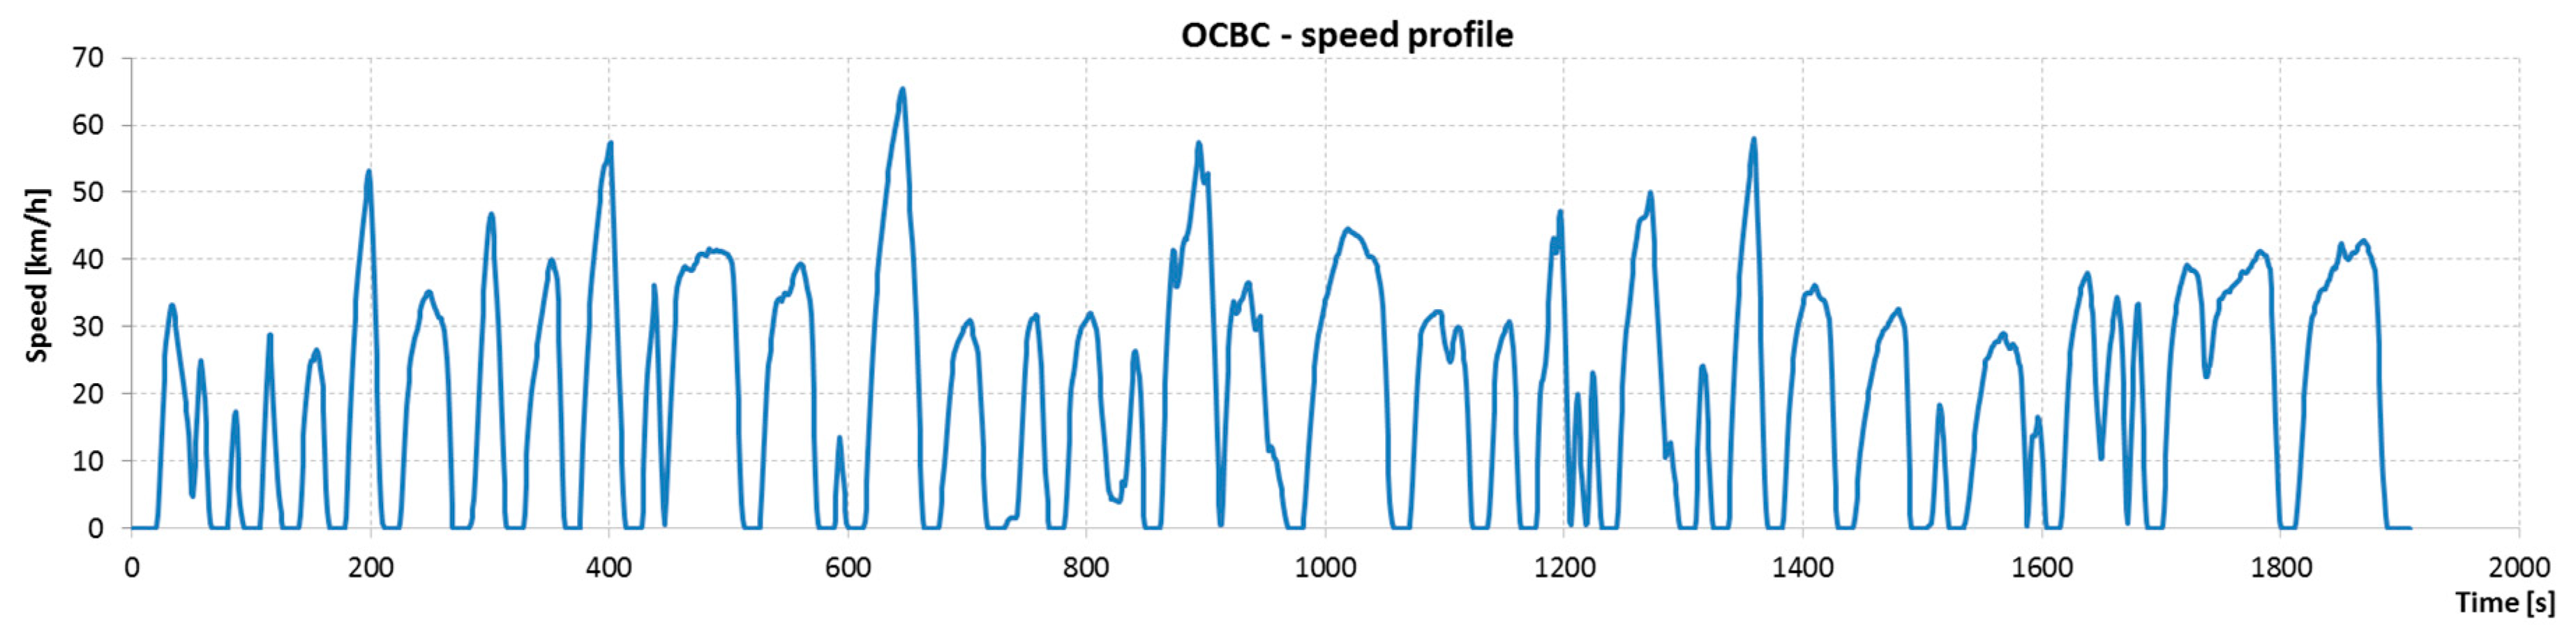
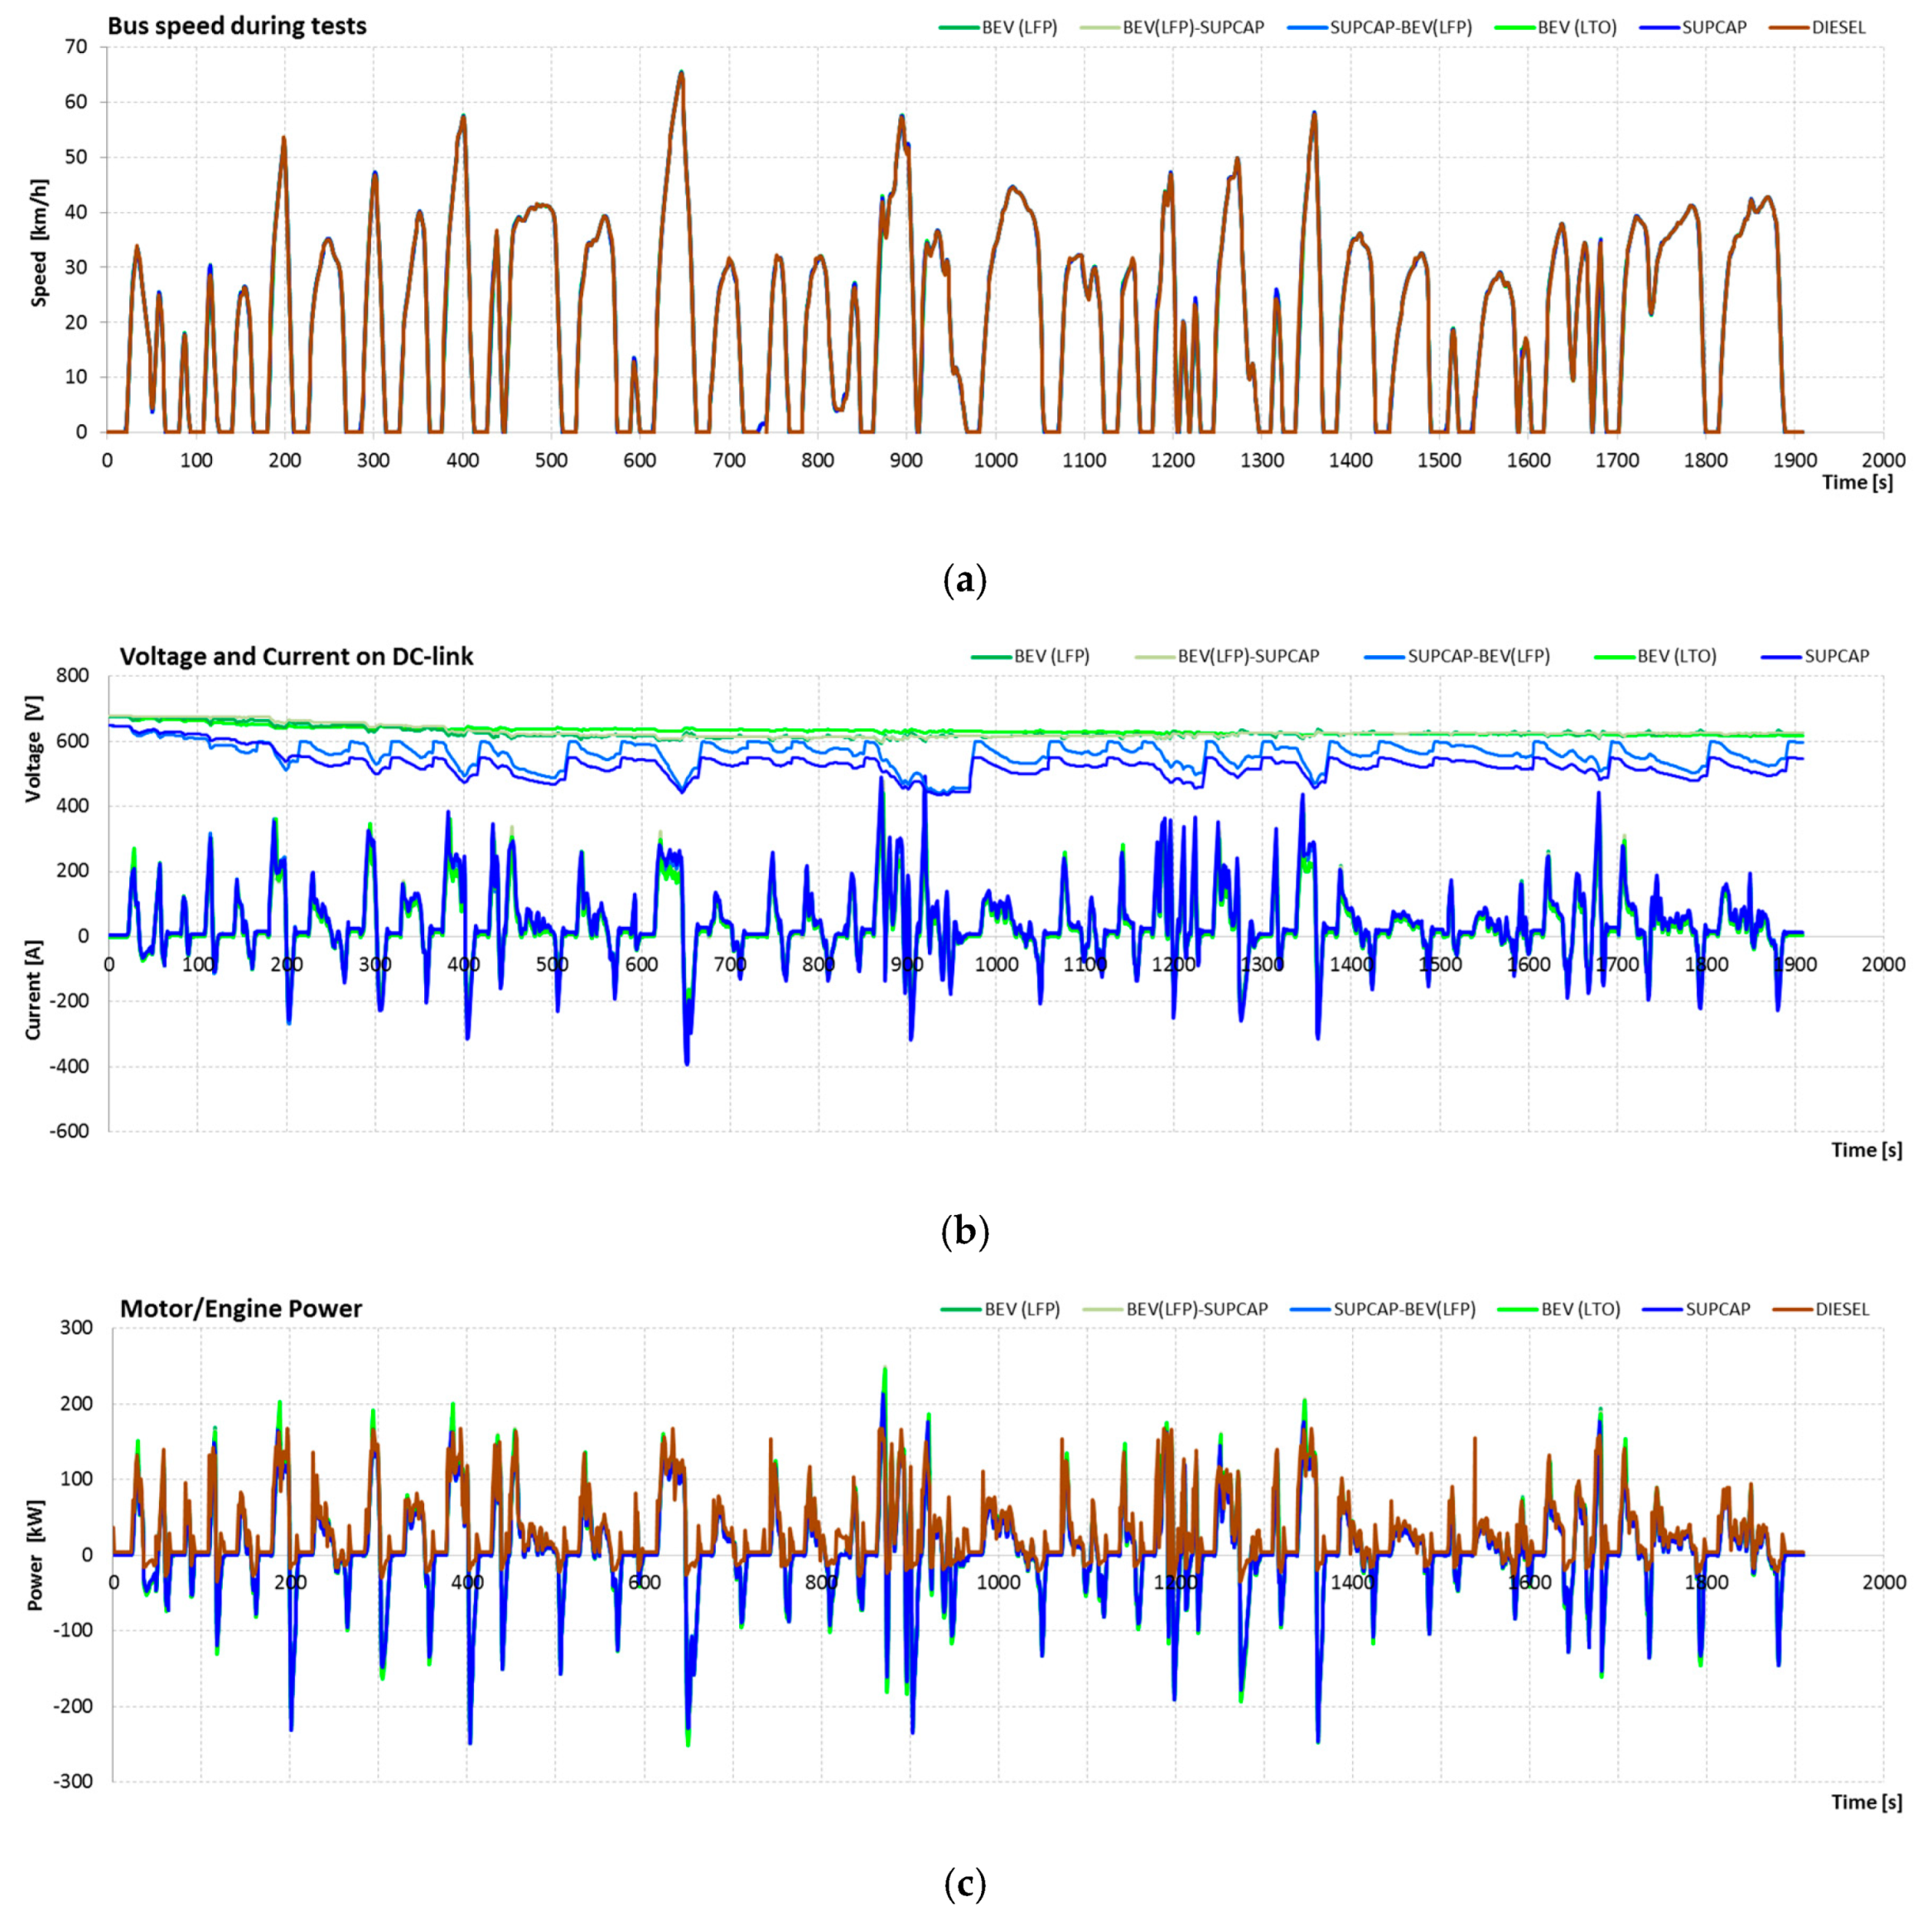
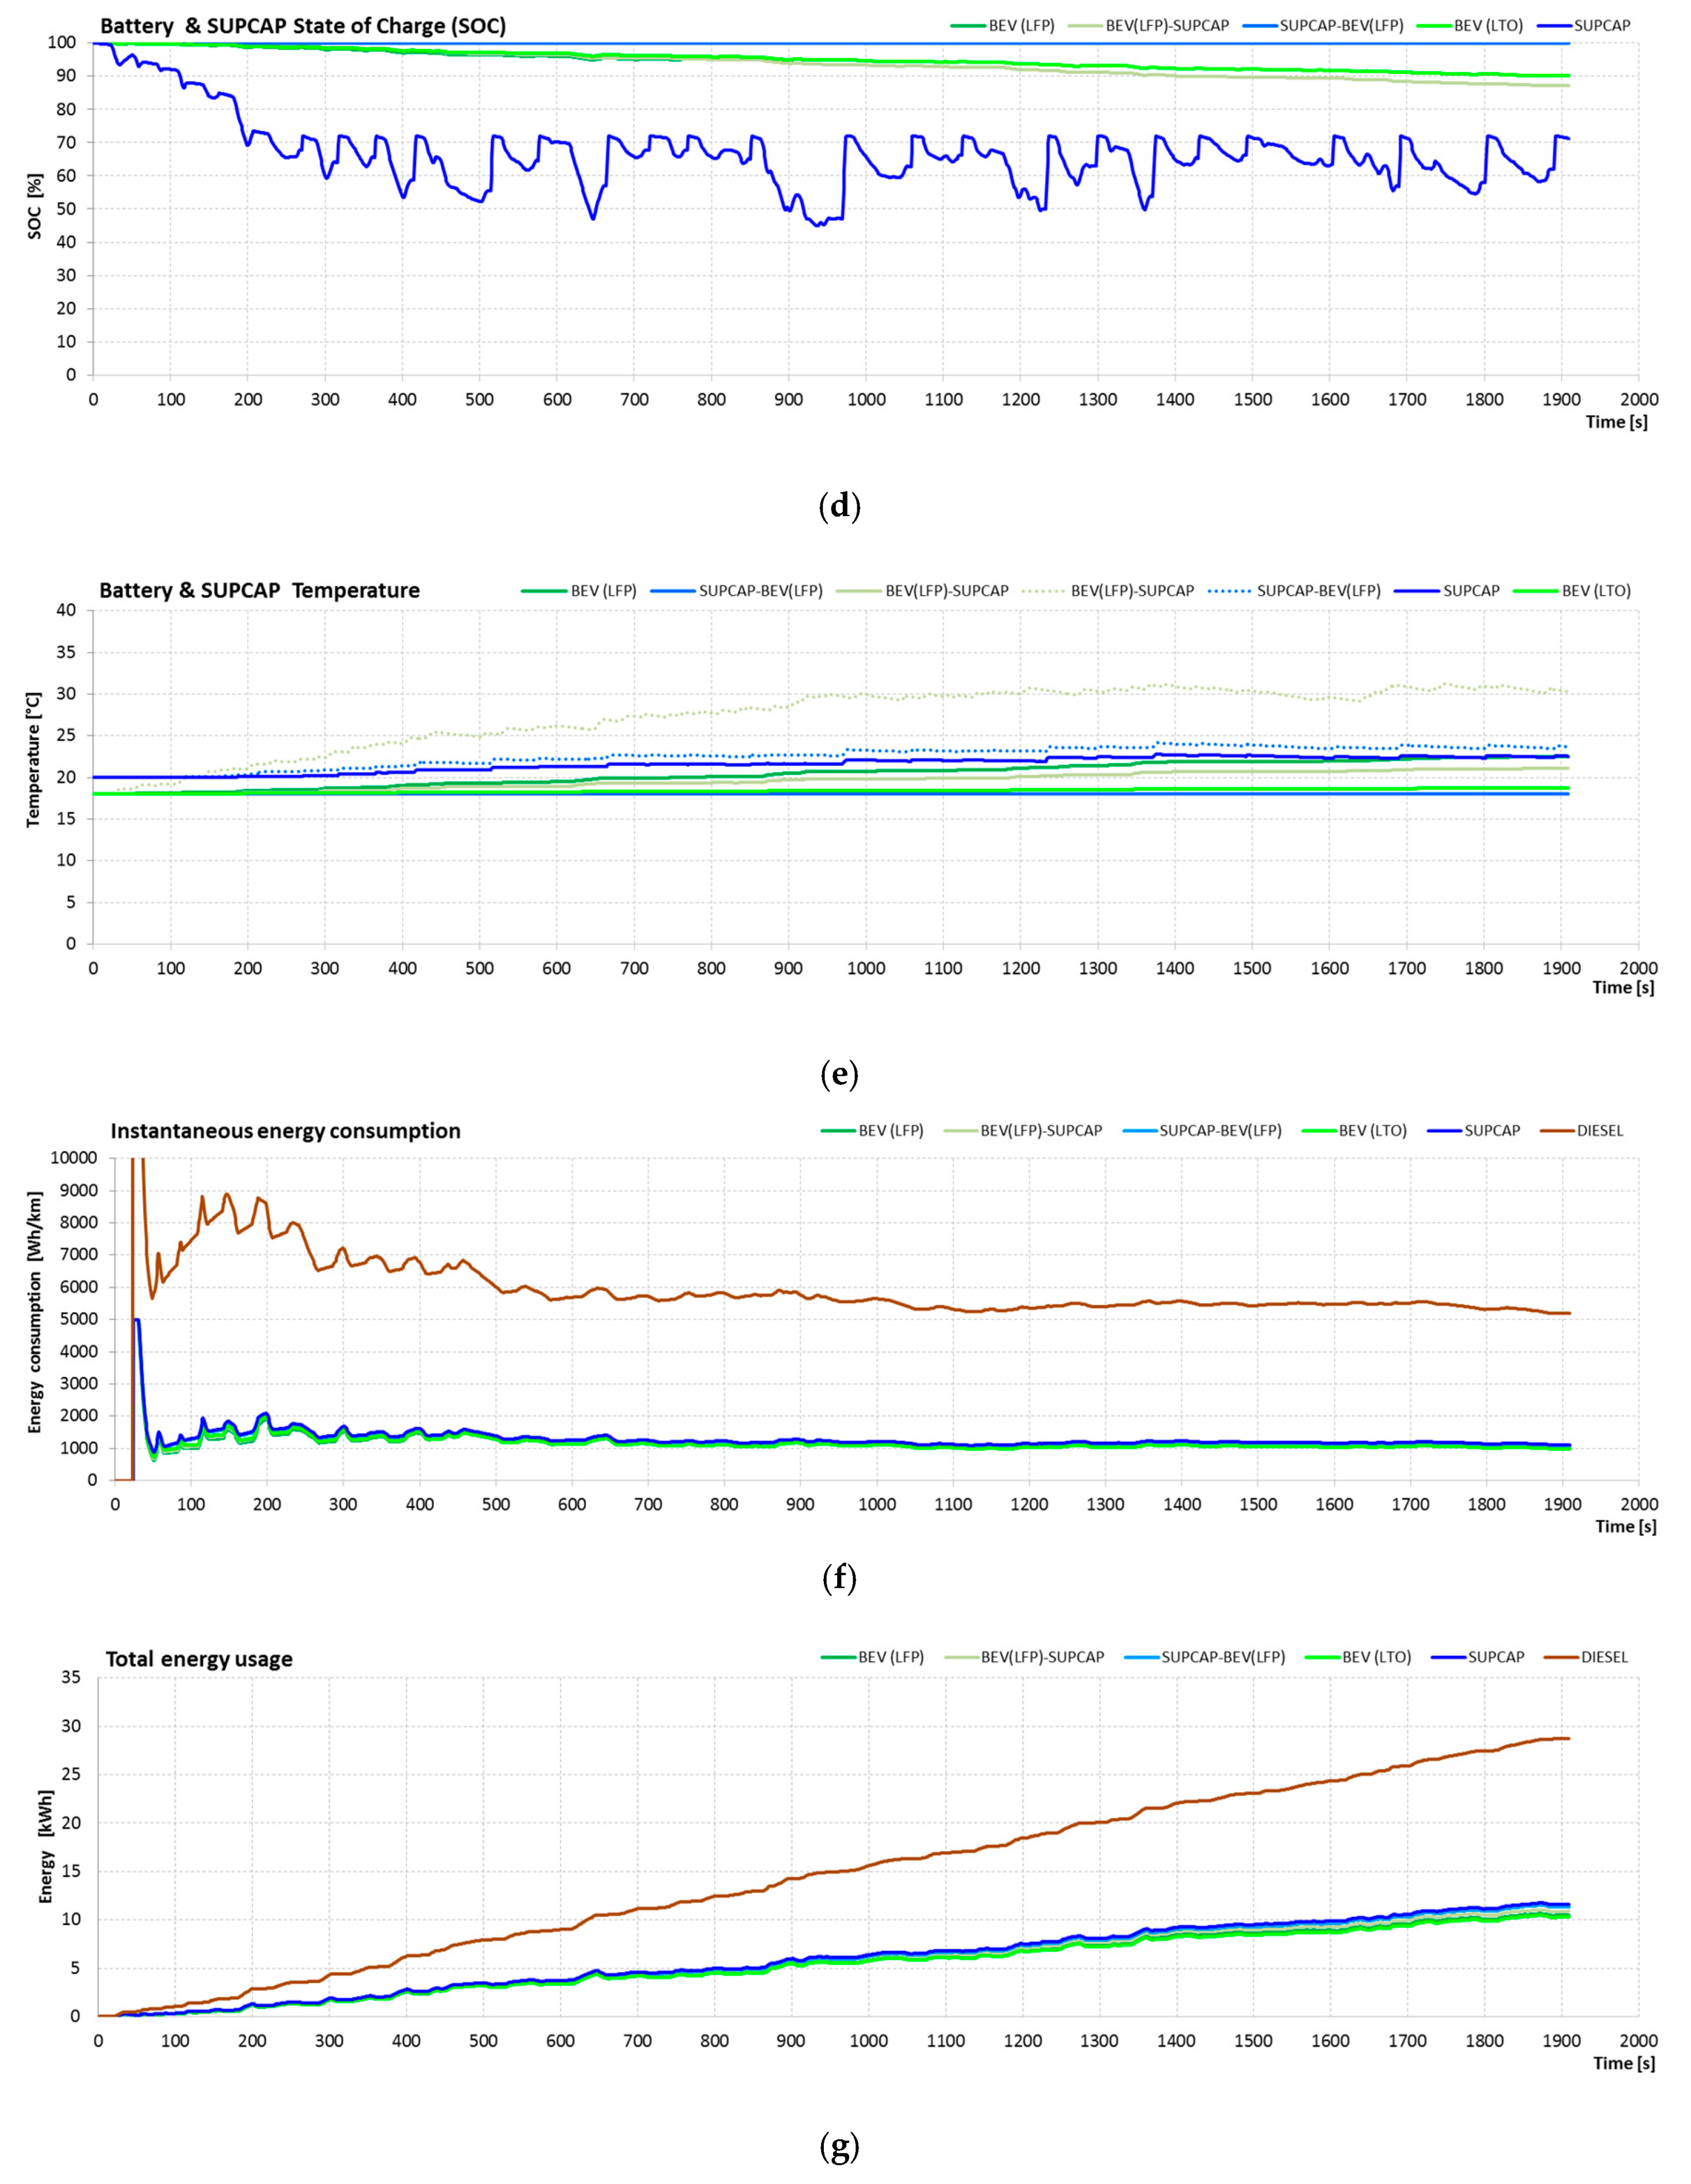
4.1.5. Research on Energy Consumption by a Bus Using the OCBC Test
The OCBC (Orange County Bus Cycle) [61] characterizes the intensity of traffic in city centers. The duration of the cycle is about 1909 s, the average vehicle speed is 19.85 km/h, the maximum speed is 65.3 km/h, and the distance is about 10.49 km. Figure 16 shows the set value of vehicle speed during the OCBC test.
Figure 17 presents the parameters obtained by vehicles during the OCBC test, such as speed, voltage and current on the DC-link, power, SOC of energy stores, temperature of energy stores, and instantaneous and total energy consumption.
From the presented characteristics, the lowest energy consumption was recorded for a battery system consisting of LTO (982.7 Wh/km), followed by BEV (LFP) (997.5 Wh/km), BEV (LFP)-SUPCAP (1037.4 Wh/km), SUPCAP-BEV (LFP) (1083.4 Wh/km), SUPCAP (1106.3 Wh/km), and DIESEL (5205.3 Wh/km). In relation to the diesel power system, energy consumption was correspondingly lower for the BEV system (LTO) by 81.1%, BEV (LFP) by 80.8%, BEV (LFP)-SUPCAP by 80.1%, SUPCAP-BEV (LFP) by 79.2%, and SUPCAP by 78.7%.
During the OCBC test simulating city traffic, there is a large number of stops. For an electric bus equipped with the SUPCAP-BEV system, this route mode makes it possible to effectively use the regenerative braking. In comparison with other types of cycle tests, the SUPCAP-BEV system is characterized by a similar level of energy consumption to the others.
On the basis of the presented research results, there were no significant fluctuations in energy store temperatures except for systems with supercapacitors.
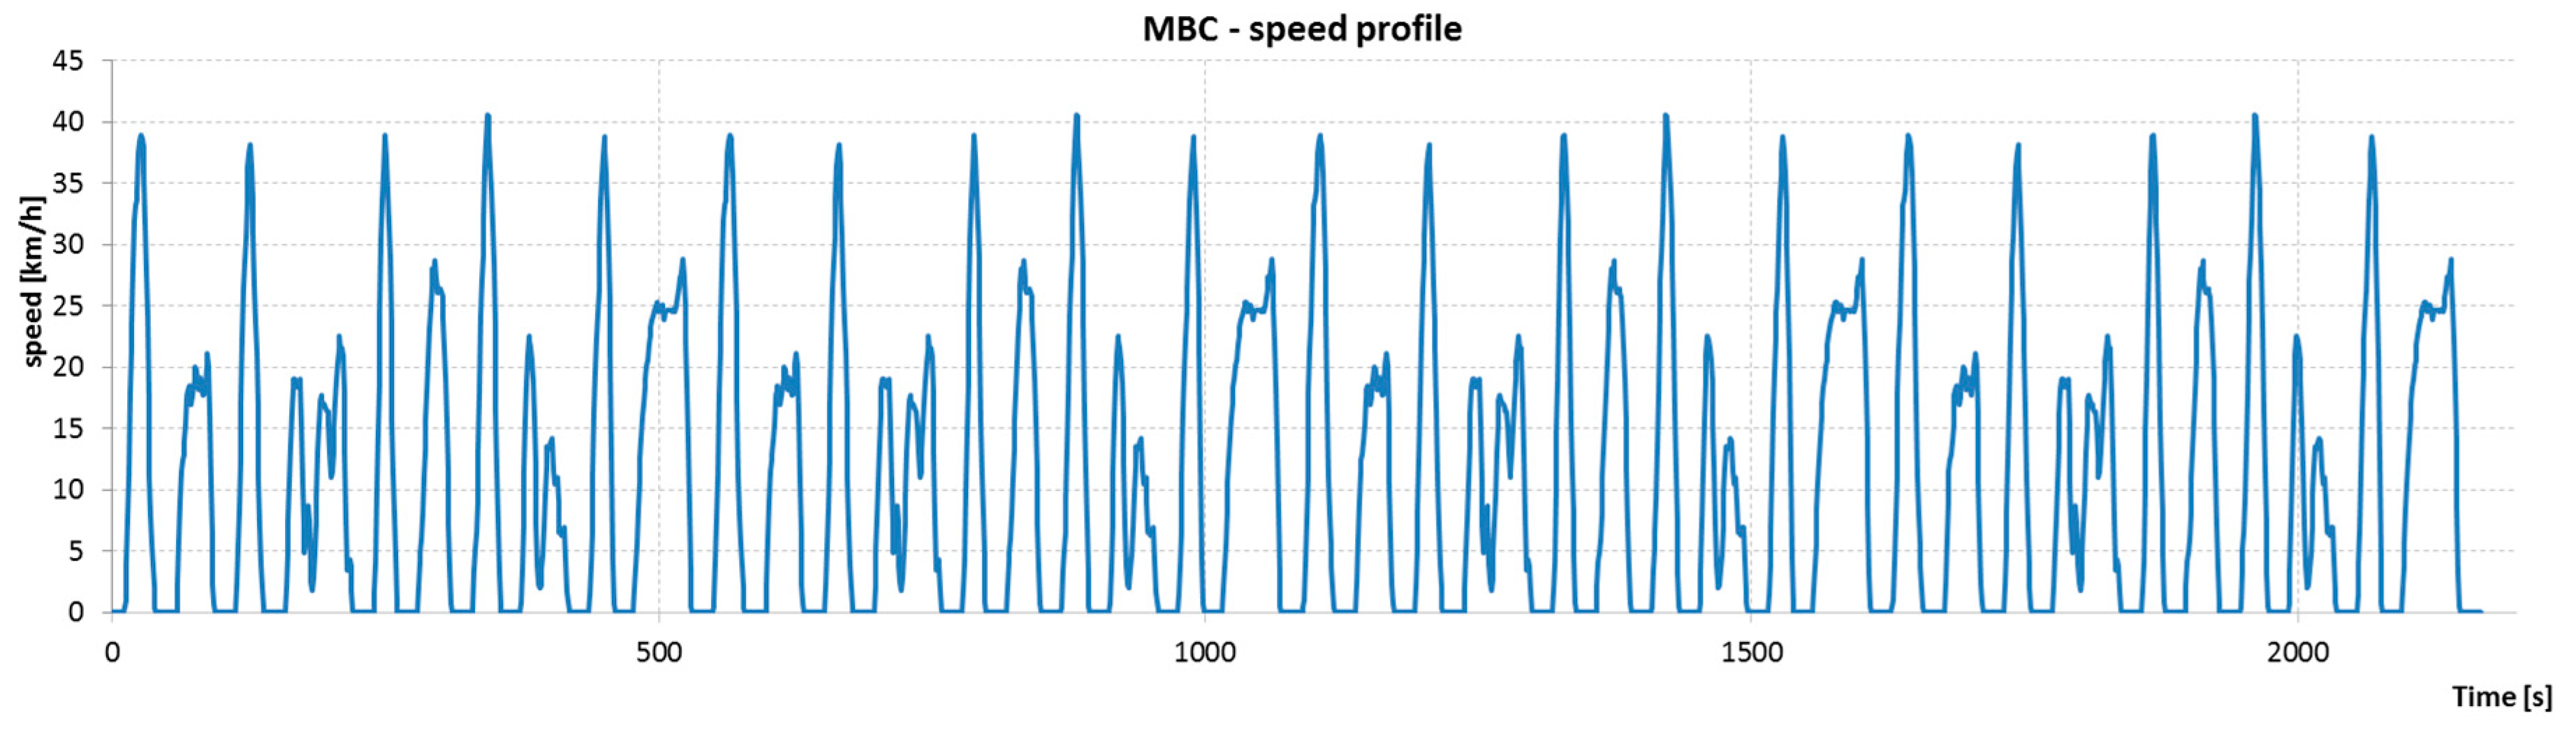
4.1.6. Bus Energy Consumption Tests Using the MBC Test
The MBC (Manhattan Bus Cycle) [61] was developed as a test cycle performed using a chassis dynamometer and is based on data recorded in buses traveling in the center of Manhattan in New York. A characteristic feature of the cycle is a very large number of stops and a low value of the average speed of about 11 km/h. The duration of the cycle is approximately 1089 s, the maximum speed is 40.88 km/h, and the trip distance is 3.31 km. During the tests, the test route was looped twice. Figure 18 shows the set value of the vehicle speed during the MBC test.
Figure 19 presents the parameters obtained by vehicles during the MBC test, such as speed, voltage and current on the DC-link, power, SOC of energy stores, temperature of energy stores, and instantaneous and total energy consumption.
The average distance traveled by the vehicle in this test was 6.62 km. From the presented characteristics, the lowest energy consumption was recorded for a battery system consisting of LTO (1300.1 Wh/km), followed by BEV (LFP) (1315.2 Wh/km), BEV (LFP) -SUPCAP (1373.2 Wh/km), SUPCAP-BEV (LFP) (1495.2 Wh/km), SUPCAP (1531.1 Wh/km), and DIESEL (7127.3 Wh/km). In relation to the diesel power system, energy consumption was correspondingly lower for the BEV system (LTO) by 81.8%, BEV (LFP) by 81.5%, BEV (LFP) -SUPCAP by 80.7%, SUPCAP-BEV (LFP) by 79%, and SUPCAP by 78.5%.
Due to the very large number of starts and stops and short sections between them, the MBC cycle is the most energy-intensive cycle of all the test routes presented. For this test cycle, one can very clearly observe the differences between the electric drive system, which makes use of the possibility of regenerative braking and the conventional diesel system without such a property. In this cycle, the difference in energy consumption between diesel- and electric-based drive systems is much greater than in other test cycles. The energy consumption of all propulsion variants in this test was also significantly higher than in any other test, and the temperature increases were also one of the highest. Many stops in the test caused the SUPCAP-BEV variant’s supercapacitor to be recharged sufficiently often, and energy from the additional battery was not needed.
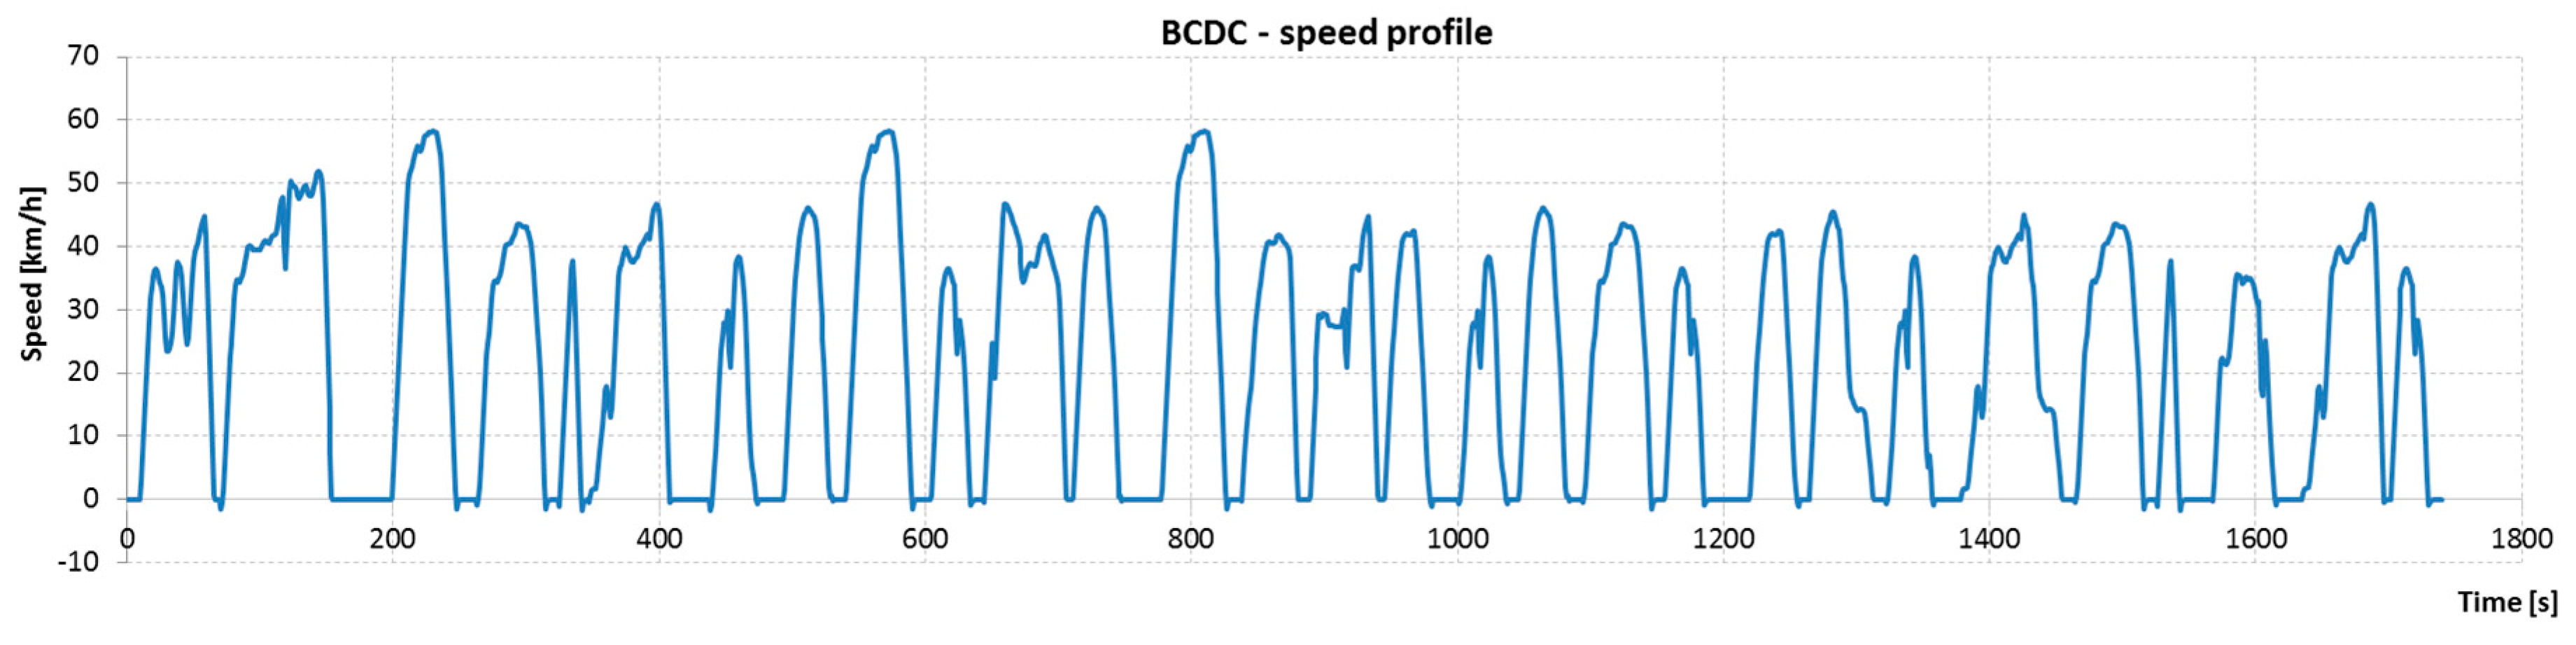
4.1.7. Bus Energy Consumption Tests Using the BCDC Test
The BCDC (Braunschweig City Driving Cycle) (Braunschweig Cycle) [60] characterizes the intensity of traffic in city centers.
The BCDC cycle has been developed mainly to test the energy consumption of public transport vehicles. The duration of the cycle is about 1740 seconds, the average vehicle speed is 22.9 km/h, the maximum speed is 58.2 km/h, and the distance is about 11 km. Figure 20 shows the set value of the vehicle speed during the BCDC test.
Figure 21 shows the parameters obtained by vehicles during the BCDC test, such as speed, voltage and current on the DC-link, power, SOC of energy stores, temperature of energy stores, and instantaneous and total energy consumption.
From the presented characteristics, the lowest energy consumption was recorded for a battery system consisting of LTO (1020.6 Wh/km), followed by BEV (LFP) (1010.2 Wh/km), BEV (LFP) -SUPCAP (1138.1 Wh/km), SUPCAP-BEV (LFP) (1289 Wh/km), SUPCAP (1297.2 Wh/km), and DIESEL (4869.9 Wh/km). In relation to the diesel power system, energy consumption was correspondingly lower for the BEV system (LTO) by 79.0%, BEV (LFP) by 79.3%, BEV (LFP)-SUPCAP by 76.6%, SUPCAP-BEV (LFP) by 73.5%, and SUPCAP by 73.4%.
Similarly to the SORT 3 test, the BCDC test clearly shows the effect of the supercapacitor operation in the BEV-SUPCAP variant, but despite the battery being relieved of the currents caused by regenerative braking and subsequent acceleration, it cannot be concluded that this configuration is energy-efficient. The probable cause is the high internal resistance of the used supercapacitors as evidenced by the fact of their rapid temperature rise, which is marked with a gray continuous line in Figure 21e.
To sum up the conducted research using standardized test cycles on the energy consumption of an electric bus, it can be concluded that the highest energy consumption was noted for MBC (1300 Wh/km), followed by BCDC (1021 Wh/km), OCBC (983 Wh/km), SORT 1 (968 Wh/km), UDDS-HD (925 Wh/km), SORT 2 (841 Wh/km), and SORT 3 (787 Wh/km).
The use of an electric drive system in relation to a system using a diesel engine (with an equivalent energy consumption of 5793 Wh/km) allows to reduce energy consumption in the SORT 1 cycle by 83.3% for the BEV system (LTO), 82.9% for BEV (LFP), 82.5% for BEV (LFP) -SUPCAP, and 78.6% for both SUPCAP-BEV (LFP) and SUPCAP.
The relative reduction of CO2 emissions with respect to a drive with a diesel engine was 55.6% for the BEV system (LTO), 54.6% for BEV (LFP), 53.4% for BEV (LFP)-SUPCAP, and 43.2% for SUPCAP-BEV (LFP) and SUPCAP variants.
The obtained test results showed that energy stores using supercapacitors (SUPCAP, SUPCAP-BEV, BEV-SUPCAP) did not show a lower total energy consumption than purely battery based systems; on the contrary, in each standard road test, their energy consumption performance was slightly worse.
4.2. Research on Energy Consumption in the Gdynia-Flat, Gdynia-Hills Test Cycles
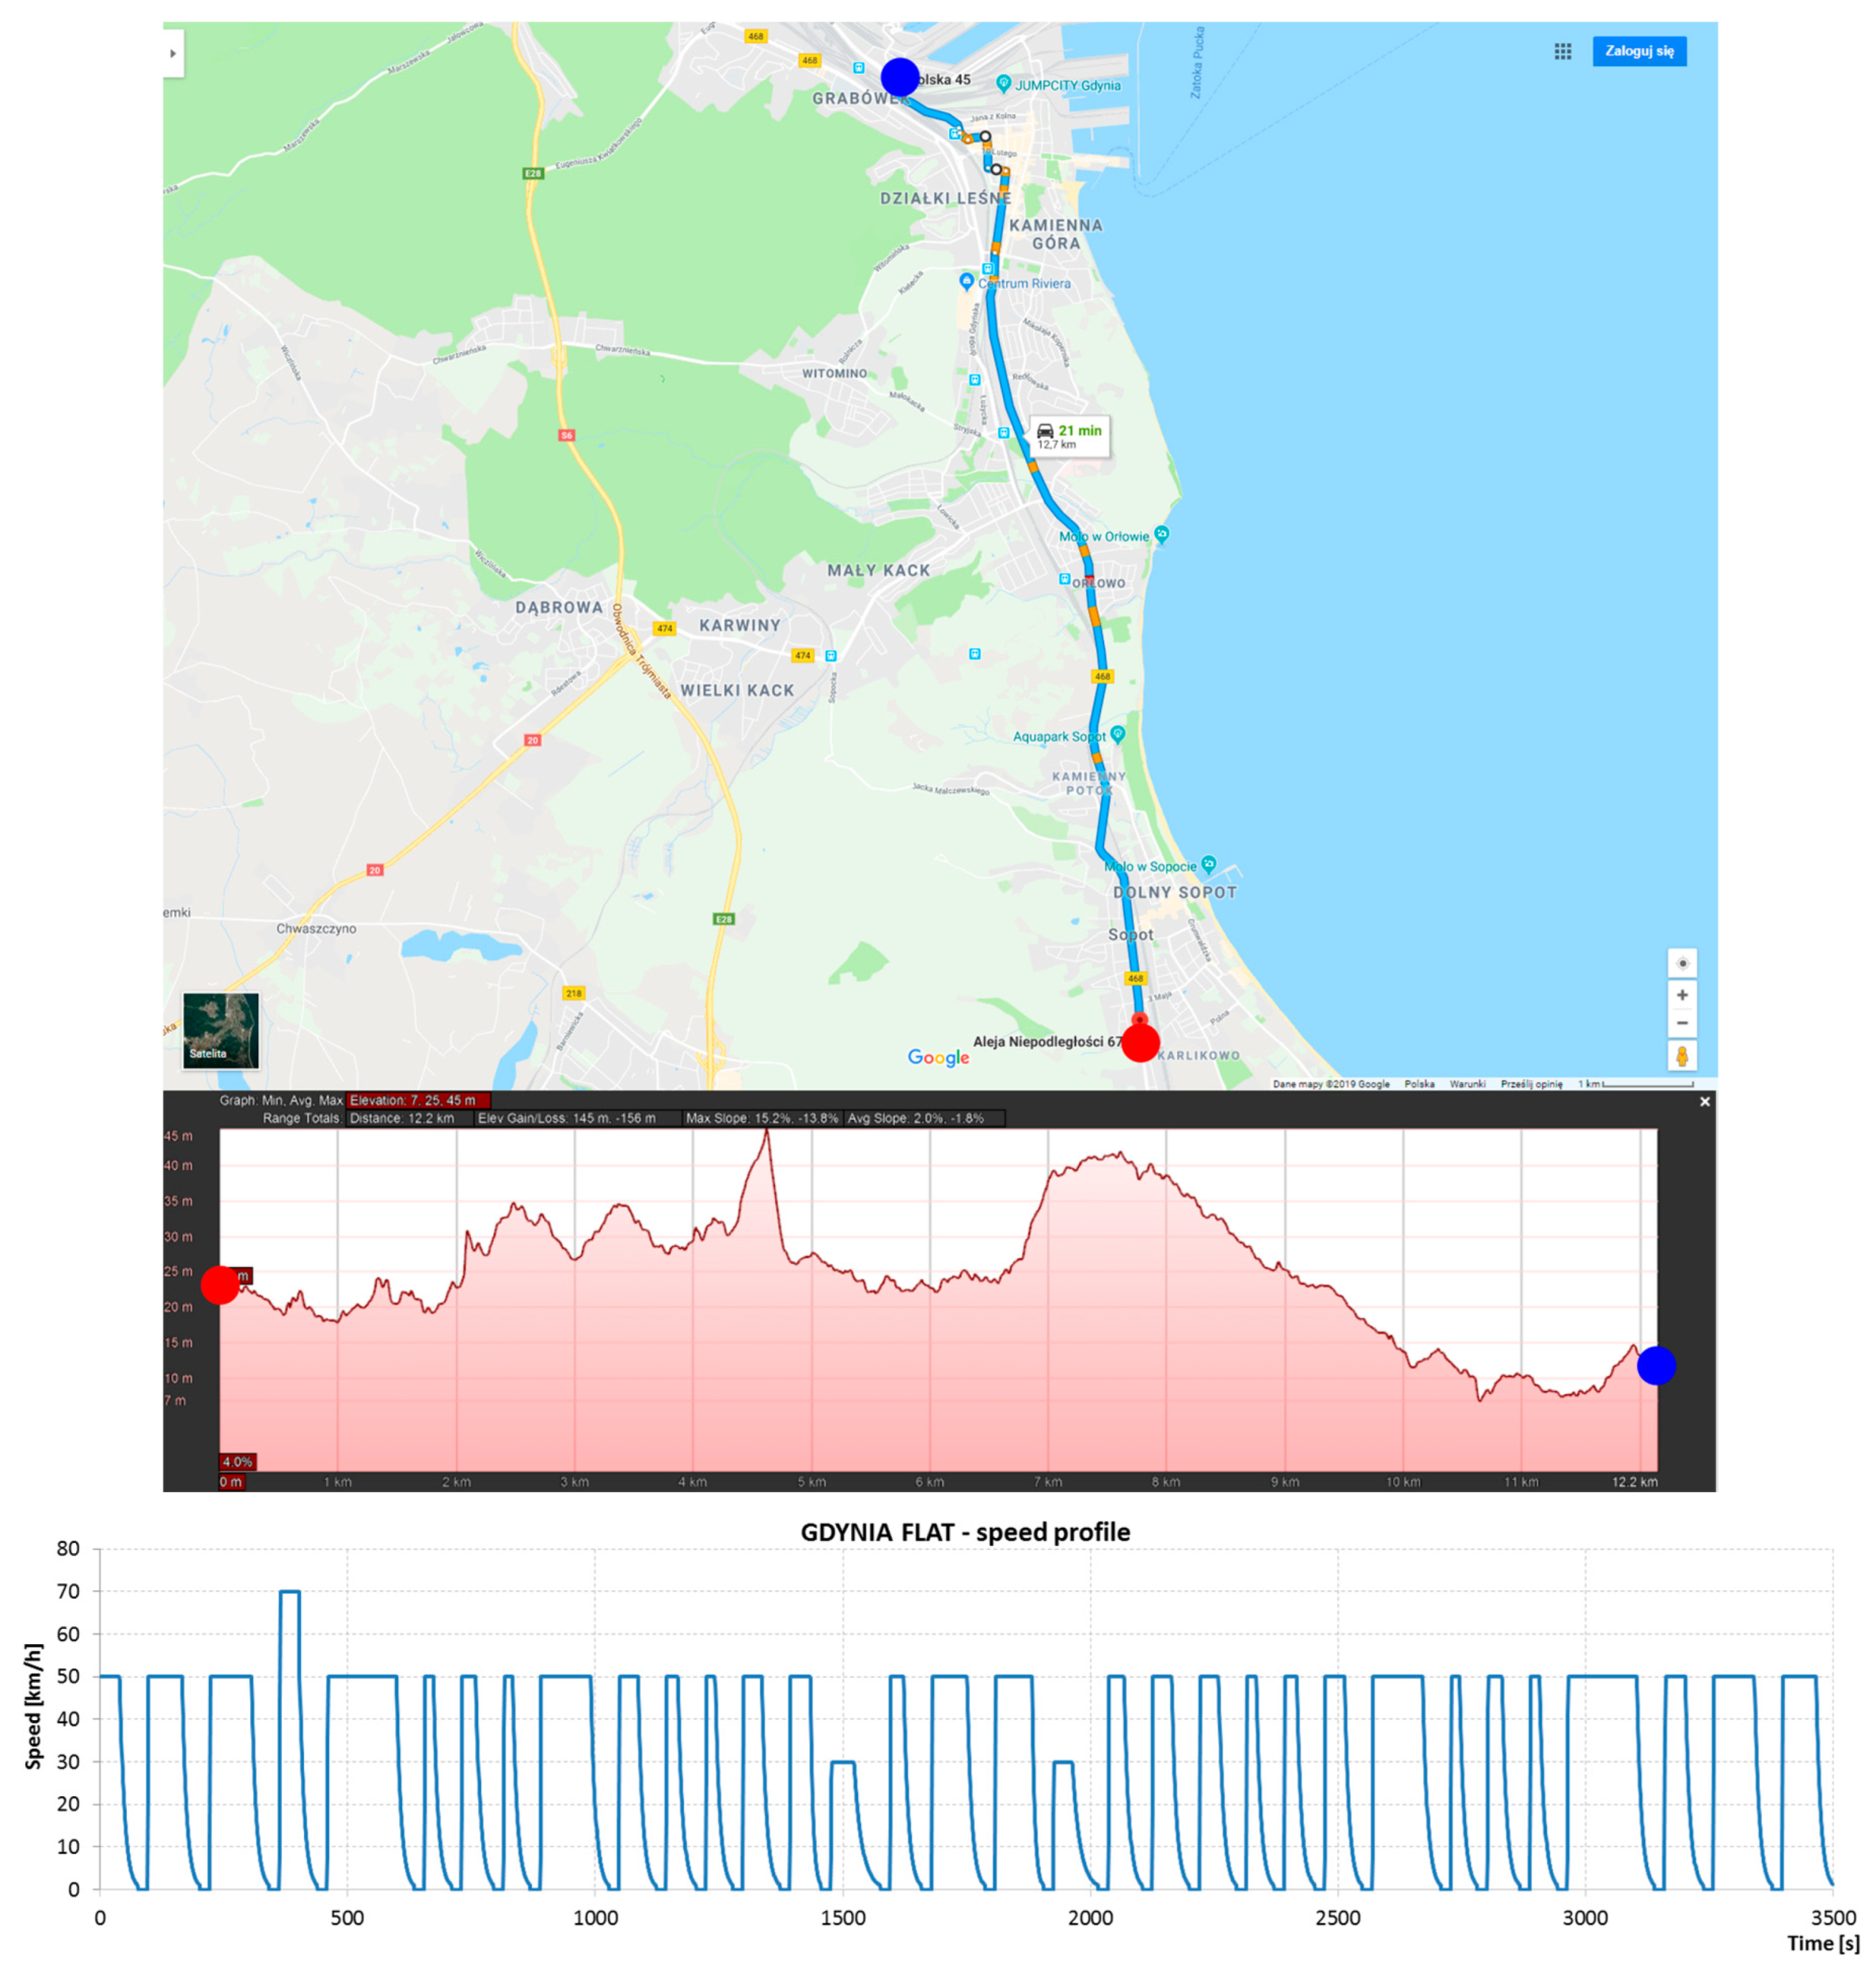
The presented drive systems (BEV (LTO), BEV (LFP), SUPCAP-BEV (LFP), BEV (LFP)-SUPCAP, SUPCAP, DIESEL) were tested on two test routes: Gdynia-Flat and Gdynia-Hills. The Gdynia-Flat route has been developed on the basis of real road conditions and is characterized by variable speeds at small changes in slope. Test route Gdynia-Hills is characterized by changes in both speed and inclination of the terrain. Figure 22 shows the velocity and altitude profile of the actual Gdynia-Flat route. The duration of the route is about 3500 s, average vehicle speed is 27.19 km/h, top speed is 70 km/h, and distance is about 25.4 km.
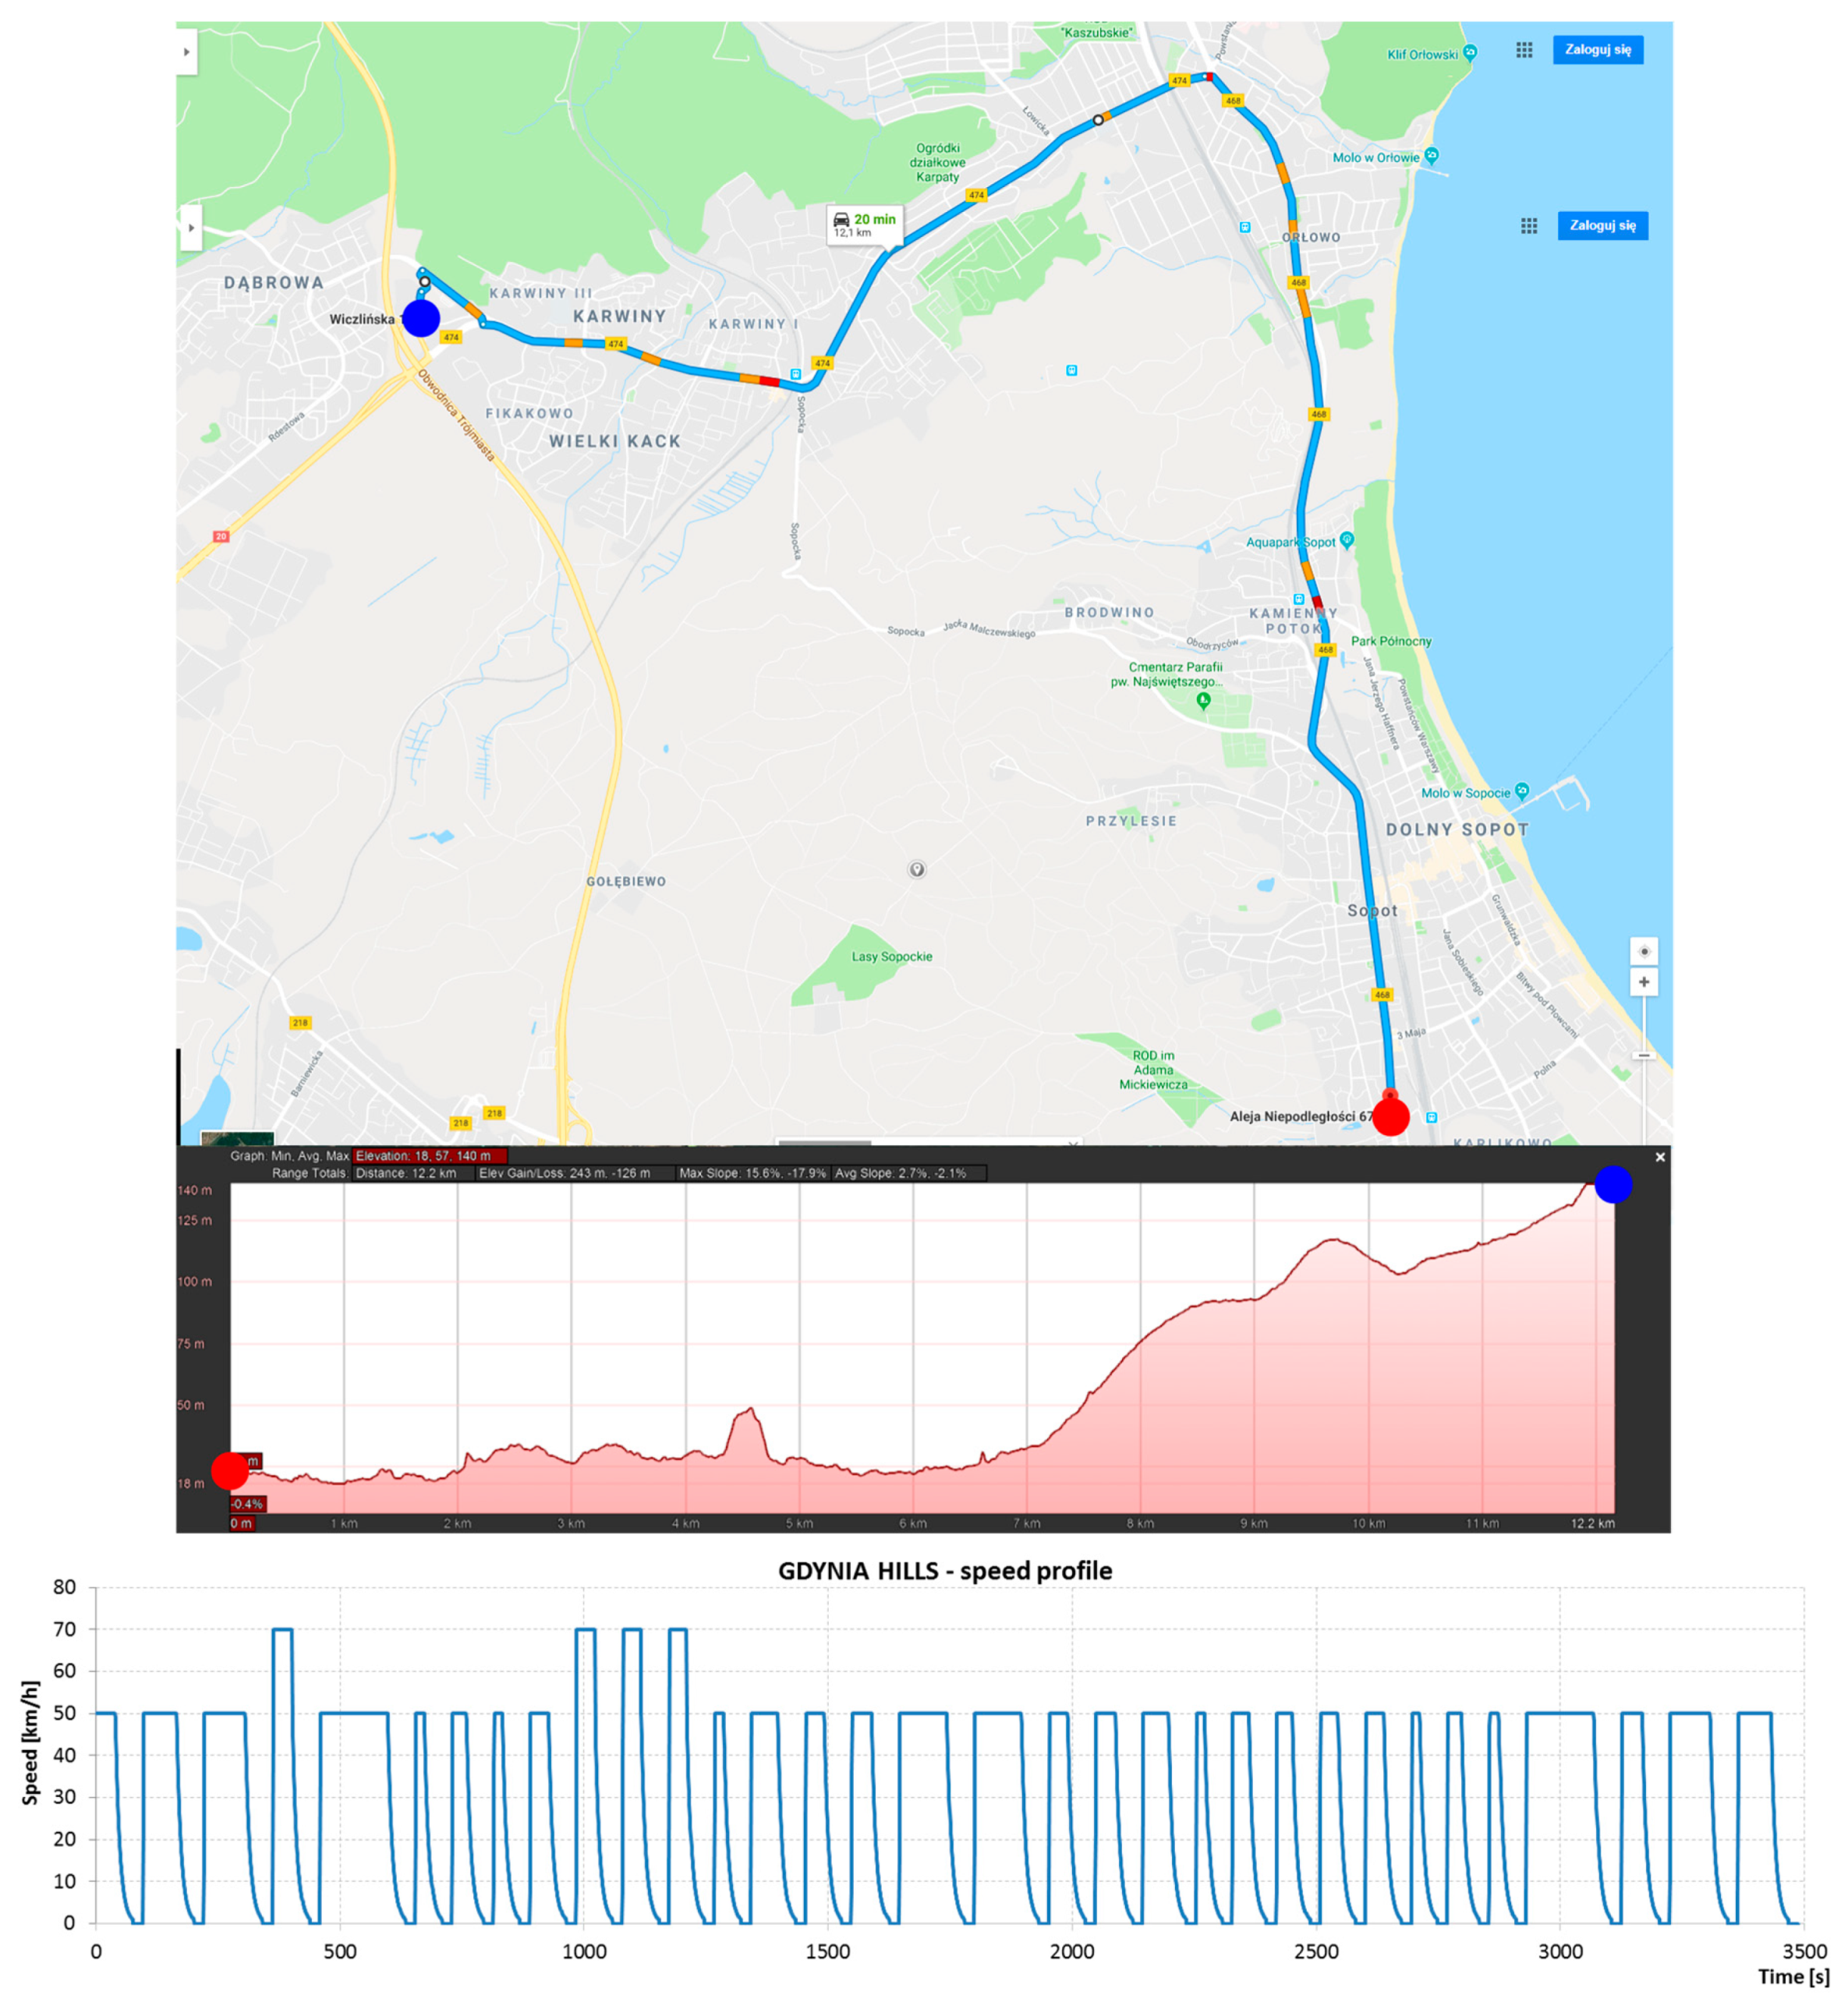
Figure 23 shows the speed and height profile of the actual Gdynia-Hills route. The duration of the route is about 3500 s, the average vehicle speed is 28.12 km/h, the maximum speed is 70 km/h, and the distance is approximately 24.2 km.
4.2.1. The Study on How Route Choice Impacts the Energy Consumption by the Electric Bus—Gdynia-Flat Route
The results of the test of drive systems on four loops of the Gdynia-Flat route with a total length of approximately 100 km are shown in Figure 24.
Based on the registered parameters, the lowest energy consumption was recorded for the battery system consisting of LTO (788.2 Wh/km), followed by BEV (LFP) (816.1 Wh/km), BEV (LFP) -SUPCAP (838.5 Wh/km), SUPCAP-BEV (LFP) (988.2 Wh/km), SUPCAP (988.2 Wh/km), and DIESEL (3730.4 Wh/km). In relation to the diesel power system, energy consumption was correspondingly lower for the BEV system (LTO) by 78.9%, BEV (LFP) by 78.1%, BEV (LFP)-SUPCAP by 77.5%, SUPCAP-BEV (LFP) by 73.5%, and SUPCAP by 73.5%.
The first observation, which can be made on the basis of the obtained test results, is clearly the faster negotiation of the test route by a vehicle powered by a diesel engine. This phenomenon is related to the fact that this propulsion system, as the only one tested, has a gearbox that allows higher accelerations to be obtained even without the need to develop full rated torque by the vehicle’s engine.
The long test time of approximately 4 hours allows the tendency of systems to achieve steady working temperature to be recognized. The increase of the operating temperature of the system based on LTO cells was 6.5 °C, and for the system with LFP cells, it was 16.6 °C. The lower energy loss on the internal resistance of the BEV system (LTO) is the reason for the lower total energy consumption of this system.
4.2.2. The Study on How Route Choice Impacts the Energy Consumption by the Electric Bus—Gdynia-Hills Route
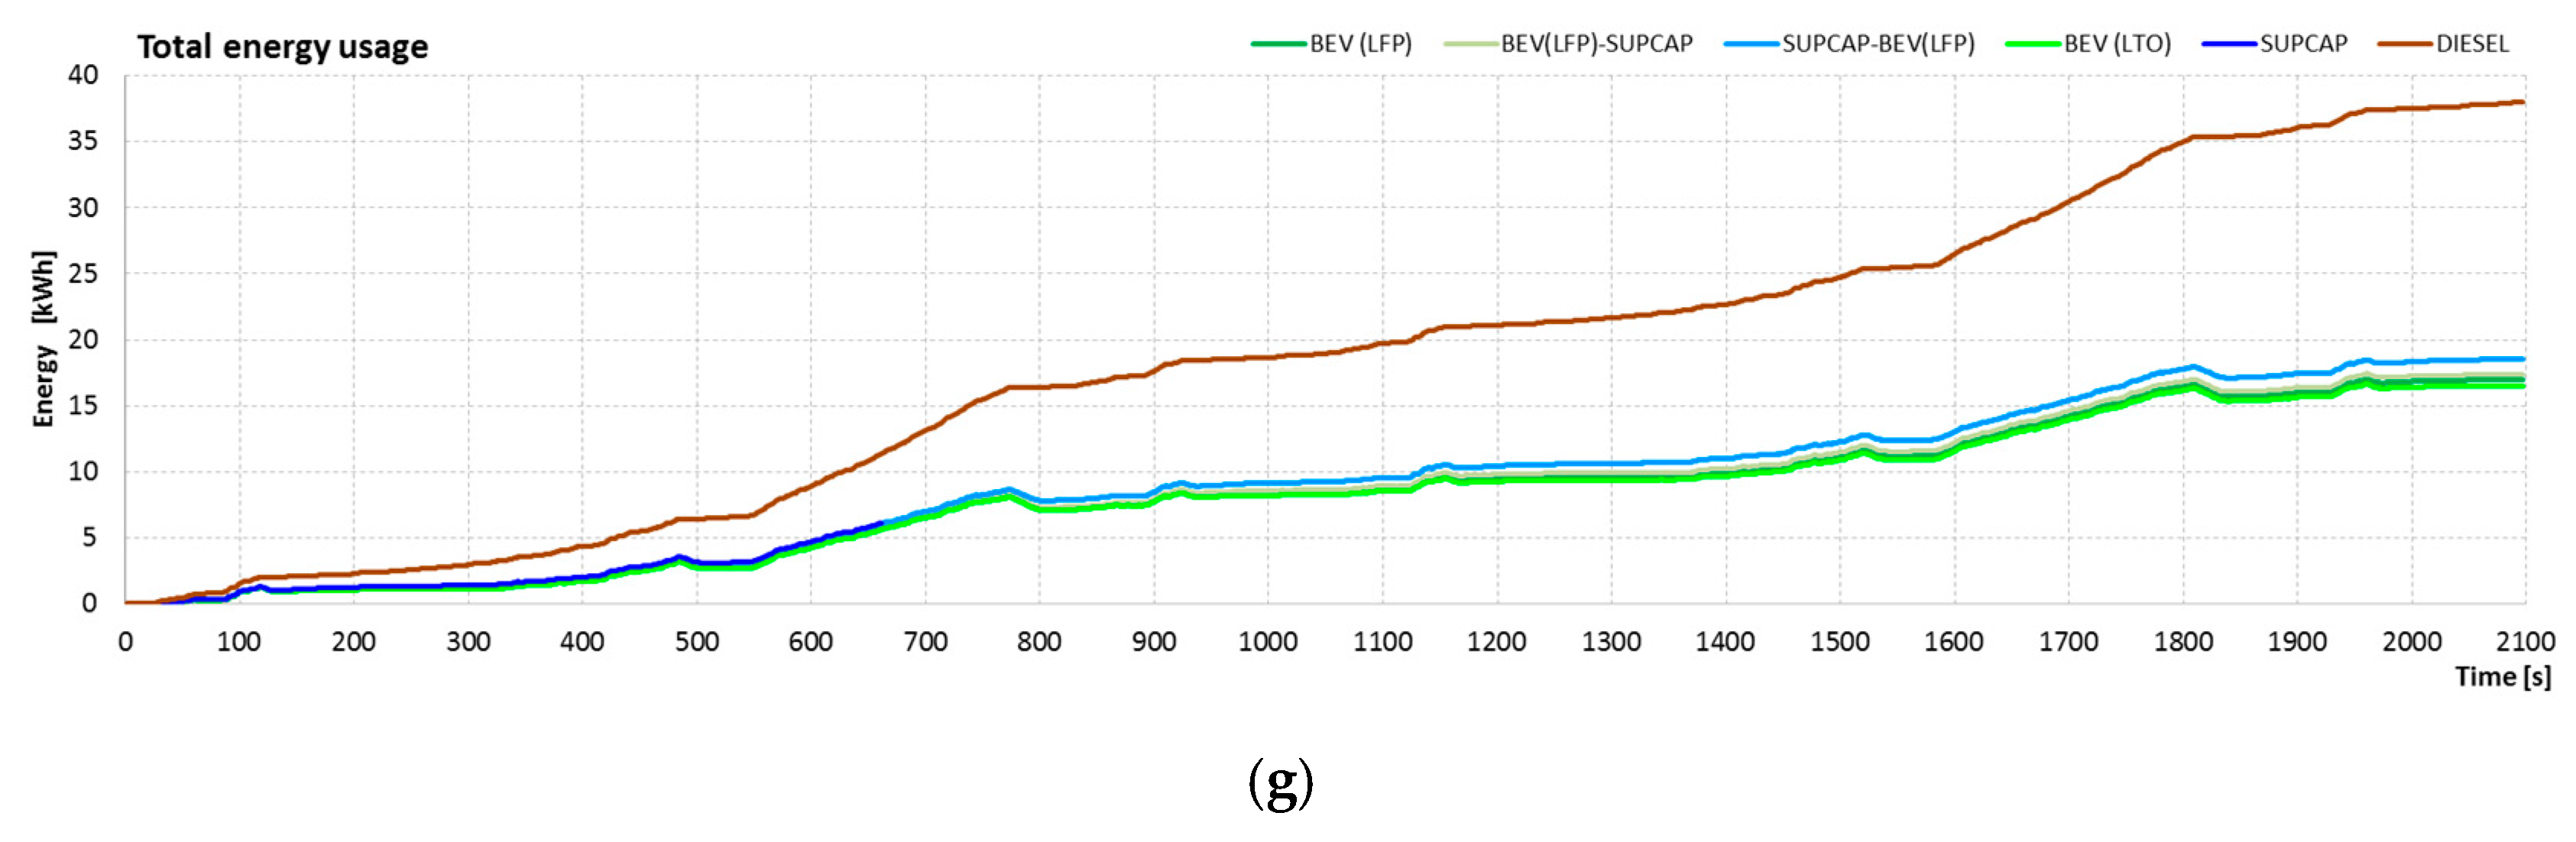
The results of testing drive systems on four consecutive repetitions of Gdynia-Hills route with a total length of approximately 100 km are shown in Figure 25.
Based on the registered parameters, lowest energy consumption was recorded for the battery system consisting of LTO (855.5 Wh/km), followed by BEV (LFP) (913.5 Wh/km), BEV (LFP)-SUPCAP (941.3 Wh/km), SUPCAP-BEV (LFP) (1087.6 Wh/km), SUPCAP (1091.3 Wh/km), and DIESEL (3967.2 Wh/km). In relation to the diesel power system, energy consumption was correspondingly lower for the BEV system (LTO) by 78.4%, BEV (LFP) by 77%, BEV (LFP)-SUPCAP by 76.3%, SUPCAP-BEV (LFP) by 72.6%, and SUPCAP by 72.5%.
Once again a long, a four-hour test allows the comparison of long-term temperature increases during operation. On the Gdynia-Hills route, the increase of working temperature of the system based on LTO cells was 8 °C, and the one with LFP cells 20.2 °C.
Similar to the standardized tests, and on routes based on real ones, systems with supercapacitors showed not lower but higher energy consumption compared to purely battery systems regardless of whether the route was flat or ran through hilly terrain.
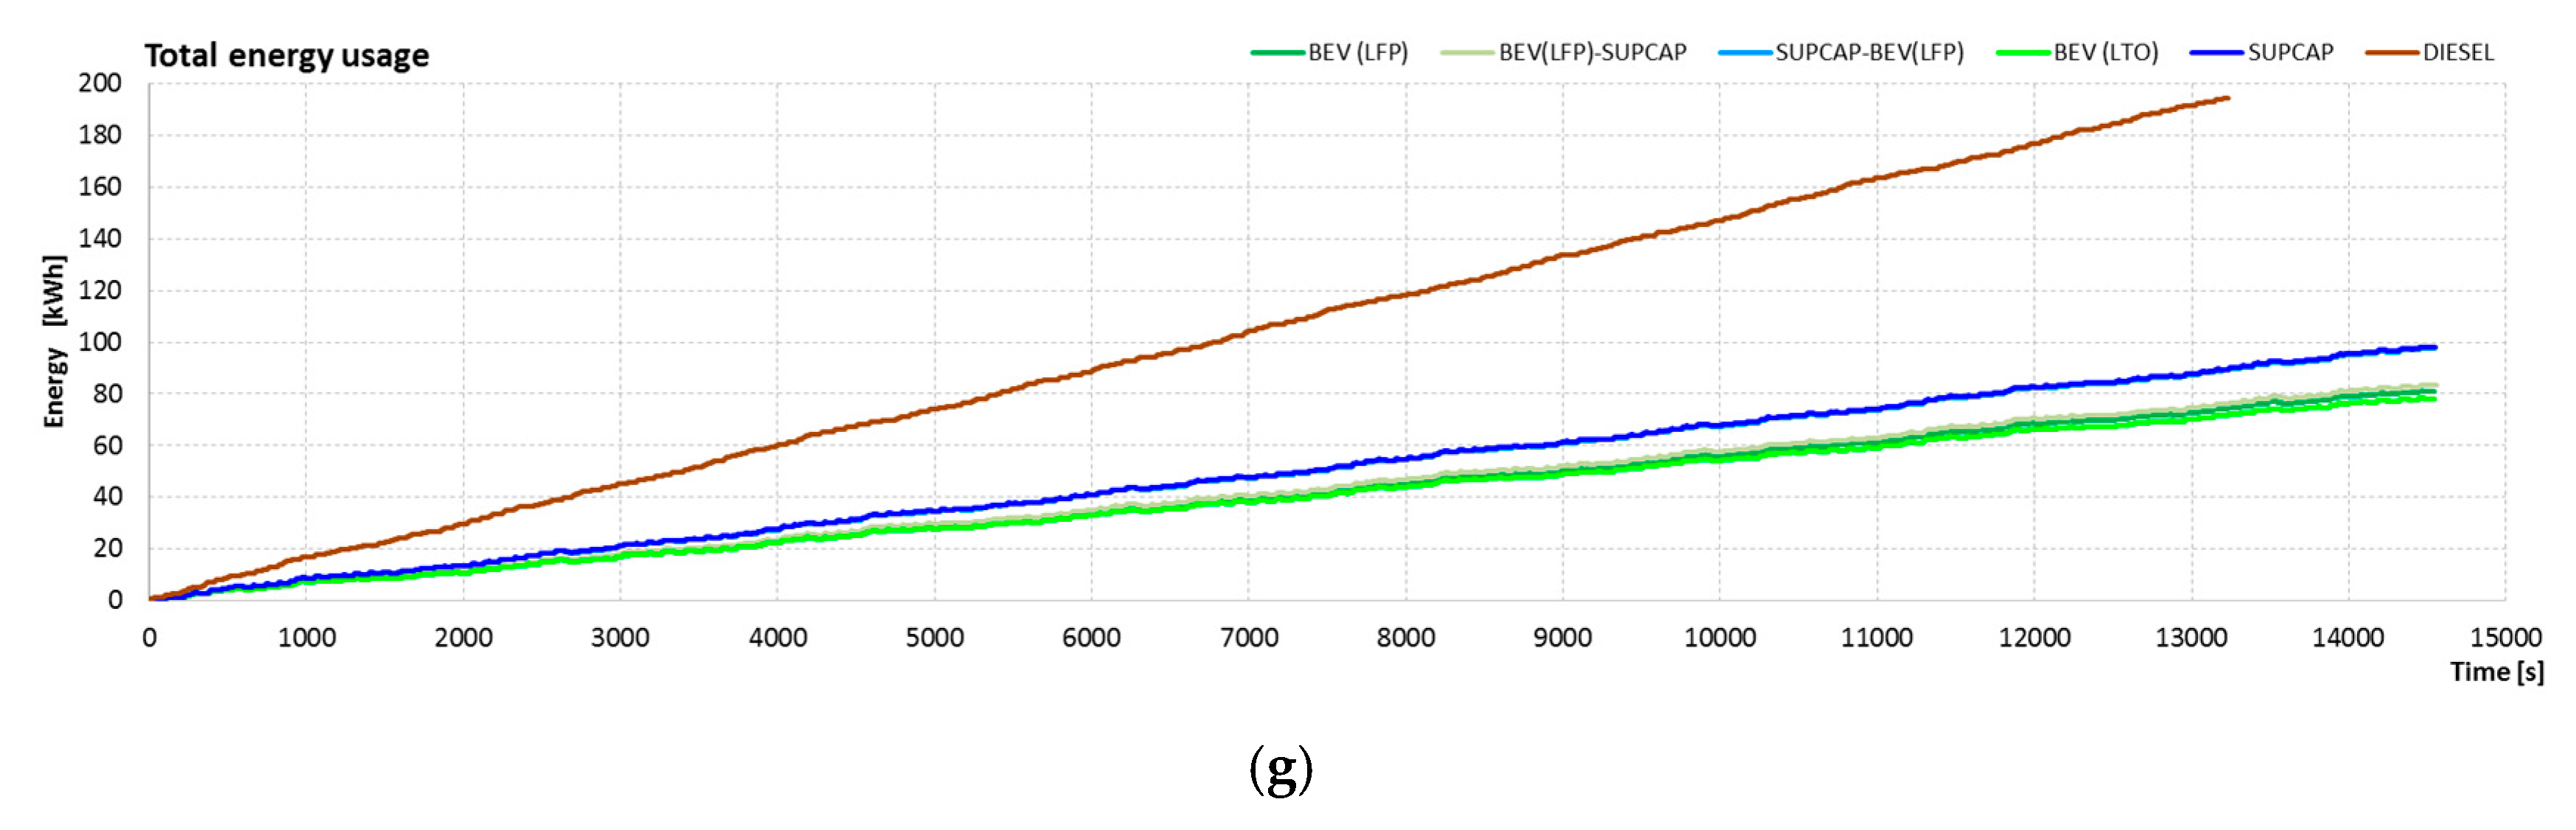
Table 2 presents a summary of the test results described in Section 4.1.1, Section 4.1.2, Section 4.1.3, Section 4.1.4, Section 4.1.5, Section 4.1.6, Section 4.1.7, Section 4.2.1 and Section 4.2.2; it presents the values of energy consumption by each configuration of electric drive system in every test cycle. The averaged values of consumption for each cycle are shown in the bottom row.
The level of energy consumption for the developed Gdynia-Flat (788 Wh/km) and Gdynia-Hills (856 Wh/km) test routes corresponded respectively to the level of energy consumption registered during the SORT 3 (787 Wh/km) and SORT 2 (841 Wh/km) tests. When operating the bus on routes with a significant change in slope, the energy spent on the movement of the vehicle may increase by about 10%.
The highest energy consumption of all road tests conducted was characterized by MBC (1300 Wh/km), BCDC (1021 Wh/km), OCBC (983 Wh/km), SORT 1 (968 Wh/km), UDDS-HD (925 Wh/km), Gdynia-Hills (856 Wh/km), SORT 2 (841 Wh/km), Gdynia-Flat (788 Wh/km), and SORT 3 (787 Wh/km).
4.3. Energy Consumption Tests for Changes in Passenger Load, Thermal Conditioning System, and Ambient Temperatures
Due to the high popularity of LFP cells and low energy consumption in test cycles (Section 4.1), LFP cells were selected for research to analyze the impact of changes in the state of the electric bus passenger load and ambient temperature, as well as different thermal conditioning systems, on energy consumption.
4.3.1. Investigation of Influence of Electric Bus Passenger Number Change on Energy Consumption
The study involved an electric bus powered from the BEV battery pack (LFP), moving along the route Gdynia-Hills (Figure 22) with a length of 24.3 km. Figure 26 shows the results of simulation tests for an electric bus during various loading conditions in the range of 20 to 90 passengers.
The increase in the number of passengers (Table 3) from 20 to 80 caused an increase in the total weight of the bus as well as a lengthening of travel time on a given route, in this particular case, by 52 s.
Based on the obtained results, the lowest energy consumption was obviously for a vehicle with the least amount of passengers on board. Changing the loading percentage between 25% and 100% of the nominal passenger load may result in an increase in energy consumed by the vehicle by about 10–35%.
4.3.2. Study of Influence of Ambient Temperature Changes on the Energy Consumption in an Electric Bus with a Resistive Heating Source and Air Conditioning
The thermal conditioning system of the passenger compartment and electric drive system components were analyzed. The thermal conditioning system consisted of a 3.5 kW air conditioning system (nominal consumed electrical power) and a 20 kW electric heater. The set temperature of the passenger compartment was, in all cases, set to 20 °C. The research was conducted on an electric propulsion system powered with BEV (LFP) on the Gdynia-Flat test route while changing the ambient temperature range from +30 °C to −10 °C. Figure 27 shows the results of simulation reports for an electric bus operated for different ambient temperature values.
Based on the obtained results, it can be inferred that the lowest energy consumption was noted for tests conducted at an ambient temperature of 20 °C. An increase in temperature by 10 °C caused an increase in energy consumption by 5.5%. This phenomenon was related to the necessity of thermal conditioning of the passenger compartment and elements of the electric drive system. The situation was similar when the temperature dropped. At an ambient temperature of 0 °C, an increase in energy consumption by 65.8% was noted, while at an ambient temperature of −10 °C, this increase was 98.8%, almost twice the consumption at 20 °C.
The power consumed by a classic, resistive heating system (Table 4) is of great importance when operating electric buses in public transport. The average operating range was 106.86 km for the electric bus in question with an energy storage consisting of LFP cells and a resistive thermal conditioning system. The minimum value of the achieved range was only 74.58 km, at an ambient temperature of −10 °C, while for an ambient temperature of 20 °C, this value is twice as high and amounts to 148.31 km.
In contrast to the energy consumption of the electric drive system, the energy for heating the passenger compartment cannot be minimized, for example, by changing the speed on the route, because the bus operates through a strictly defined time schedule, while the heating system constantly consumes power even when the vehicle is stationary (e.g., in a traffic jam). The solution to this problem can be either to reduce losses (caused, for example, by the need to ventilate the cabin) or to use a heat pump that will provide the necessary heat flux while using less valuable electricity.
4.3.3. Study of Influence of Ambient Temperature Changes on the Energy Consumption in an Electric Bus with a Heat Pump
The thermal conditioning system of the passenger compartment and electric drive system components were analyzed. The thermal conditioning system consisted of a 3.5 kW heat pump (nominal consumed electrical power). An electric drive system powered from the LFP battery pack was tested on the Gdynia-Flat test route at a change in ambient temperature range of +30 °C to −10 °C. As in the previous case, the set temperature of the passenger compartment was in all cases held at 20 °C. Figure 28 presents the parameters obtained by vehicles during the tests.
Based on the obtained results (Table 5), the lowest energy consumption was noted for tests conducted at an ambient temperature of 20 °C. An increase in temperature by 10 °C caused an increase in energy consumption by 5.5%. Similar to the system with a resistance heater and the air conditioning system, this phenomenon was related to the necessity of thermal conditioning of the passenger compartment and electric drive system components. Completely different results were obtained for the situation of the outside temperature drop. At an ambient temperature of 0 °C, an increase in energy consumption by about 11% was noted, while for an ambient temperature of −10 °C, this increase was 16.5%.
The average operating range for a bus with an electric drive system and an energy storage composed of LFP cells for a thermal conditioning system with a heat pump was 136.07 km.
In the situation of bus operating at low ambient temperatures, energy consumption may increase from between 16.5% to 100% compared to the operation of the vehicle at an ambient temperature of 20 °C, depending on whether the heat source is a heat pump or a simple resistance heater.
4.4. CO2 Emission
The use of electric drive in buses, in addition to the benefits associated with the economics of use and reduction of generated noise, has a main advantage: the absence of emissions of any gases in the place of vehicle operation, including any CO2 belonging to the greenhouse gas group (GHG).
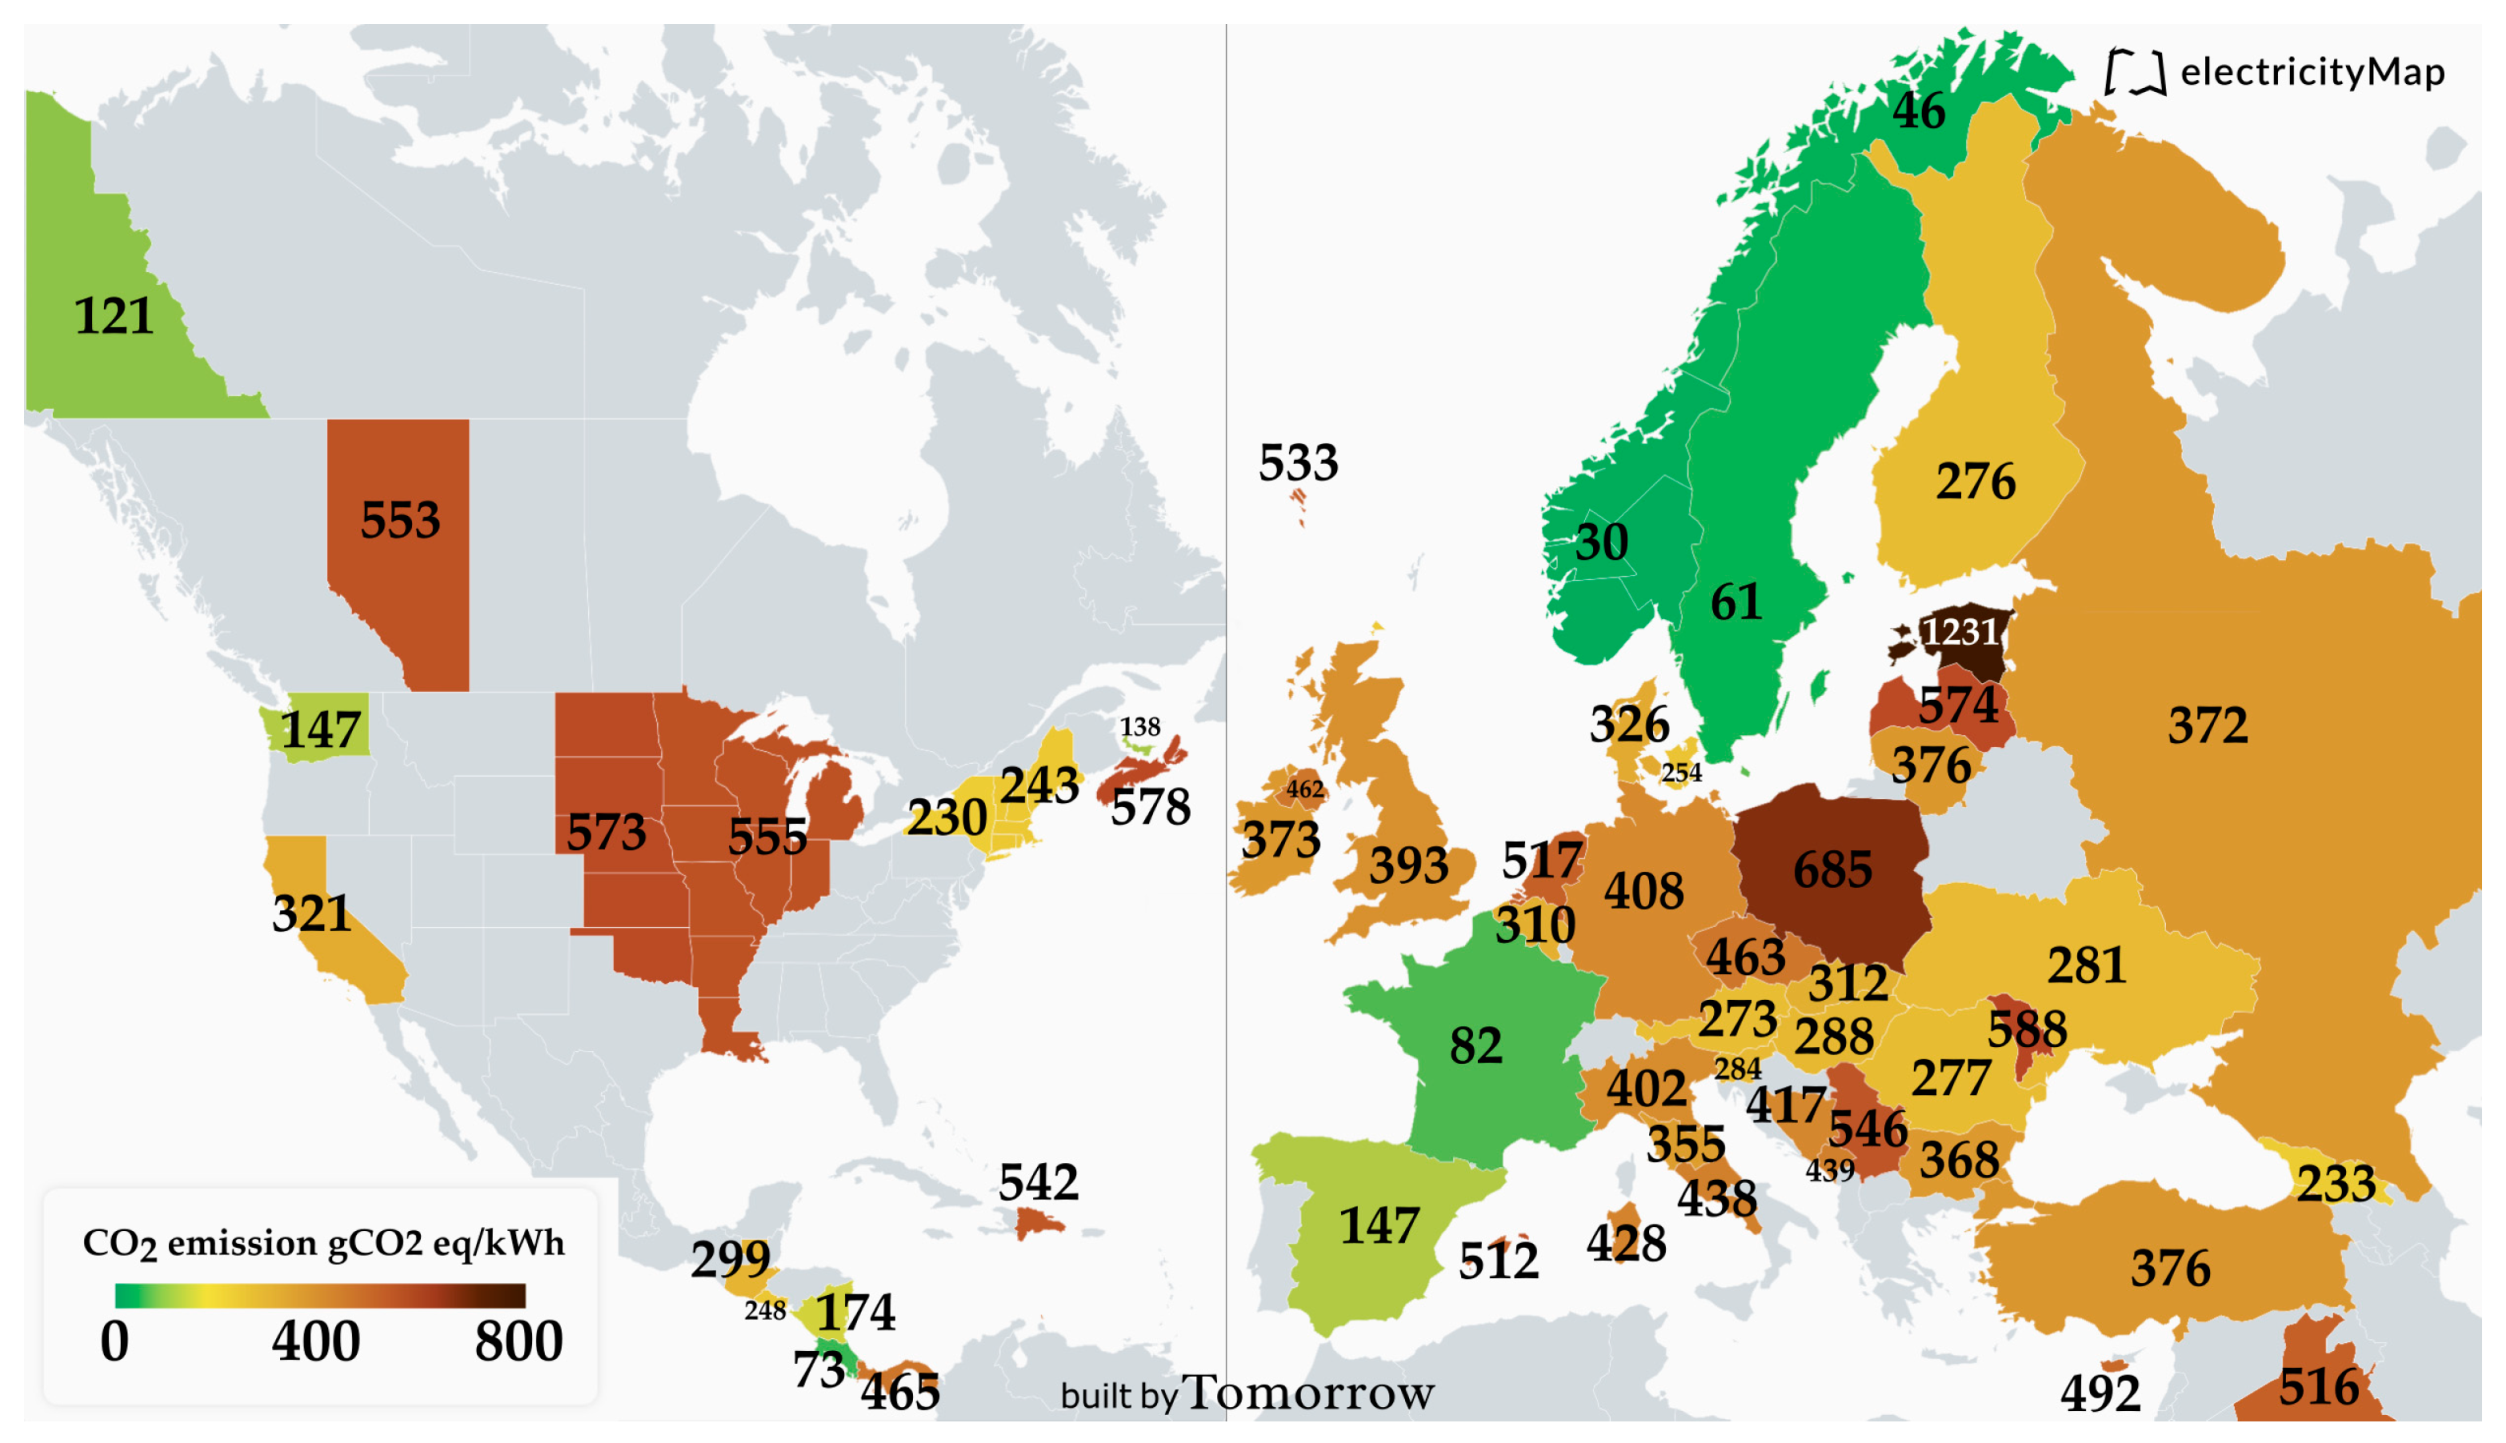
However, the energy that is used to charge the battery pack of electric vehicles can come from conventional sources related to the combustion of fossil fuels. The share of fossil fuels in the production of electricity varies, depending on the sources used by the country and the CO2 emission equivalent, can range from 24 gCO2 eq/kWh in the southern regions of Norway to 1231 gCO2 eq/kWh in Estonia. It should also be clearly stated that the emission of pollutants from a combined heat and power plant (often having a high energy conversion efficiency of 45%) with installed filtration systems has a significantly smaller impact on the natural environment than the emission of pollutants generated by vehicle combustion engines. Figure 29 shows the approximate values of the CO2 mass equivalent per 1 kWh of electric energy in a given country/region.
5. Conclusions
This article presents the results of modeling the electric drive system of a bus powered from a hybrid energy store consisting of accumulators and supercapacitors in five different configurations. The developed models of electric drive systems were used for simulation tests using standardized test procedures as well as routes developed on the basis of real road conditions. The in-depth results of simulation tests for various operational scenarios have been provided, including variable conditions of loading, ambient temperature, and slope of the road.
The obtained test results showed that the smallest average power consumption among all six configurations was characterized by a drive system powered by BEV LTO.
The use of this type of energy storage enabled more than a five-fold (5.17) (4.91 for BEV (LFP); 4.79 for BEV (LFP)-SUPCAP; and 3.92 for SUPCAP-BEV (LFP) and SUPCAP) energy reduction compared to a diesel vehicle, and almost twice (1.94) (1.89 for BEV (LFP); 1.82 for BEV (LFP)-SUPCAP; 1.61 for SUPCAP-BEV (LFP); and 1.93 for SUPCAP) the reduction of CO2 emissions.
The total energy consumption of the vehicle is also influenced by the used thermal conditioning system of the passenger compartment and electric drive system components. The use of a system using a resistive heating system can increase the energy consumption during the prevailing temperatures of −10 °C up to 100% in relation to the ambient temperature at 20 °C, which is associated with a vehicle range decrease by approximately 50%. Bearing in mind the amount of energy consumed, better effects related to temperature conditioning of the passenger compartment and electric drive system components were obtained using a heat pump.
On the basis of the test results obtained, as well as the properties of batteries used in electric bus drive systems (charge/discharge level, operating temperature, charging/discharging current), the type of cells can be chosen, as well as the method of their connection, depending on the planned place of operation defined by the length of the route, differences in slope, and temperature changes.
Funding
This research received no external funding.
Acknowledgments
This research received no external support.
Conflicts of Interest
The author declares no conflict of interest.
References
- Sanchez-Lugo. Global Climate Report-September 2018|State of the Climate|National Centers for Environmental Information (NCEI). Available online: https://www.ncdc.noaa.gov/sotc/global/201809 (accessed on 18 November 2018).
- Ministry of the Environment. COP24. Available online: https://cop24.gov.pl/ (accessed on 1 January 2019).
- Plumer, B. COP24, the New Round of Global Climate Talks, Has Begun. We Answer Three Key Questions. Available online: https://www.nytimes.com/2018/12/04/climate/cop24-climate-conference-katowice.html (accessed on 1 January 2019).
- Worland, J. The Paris Agreement Lives on at the U.N. Climate Change Conference. But Political Disruption Still Remains a Threat. Available online: http://time.com/5480146/climate-change-cop-24-paris-agreement/ (accessed on 1 January 2019).
- The Directorate-General for Climate Action (DG CLIMA). Road Transport: Reducing CO2 Emissions from Vehicles-Climate Action-European Commission. Available online: https://ec.europa.eu/clima/policies/transport/vehicles_en (accessed on 1 January 2019).
- Howell, D. Hybrid and Electric Systems R&D at DOE: Fiscal Year 2011–2012 Status. WEVJ 2012, 5, 370–381. [Google Scholar] [CrossRef]
- Bottiglione, F.; Contursi, T.; Gentile, A.; Mantriota, G. The Fuel Economy of Hybrid Buses: The Role of Ancillaries in Real Urban Driving. Energies 2014, 7, 4202–4220. [Google Scholar] [CrossRef] [Green Version]
- Li, L.; You, S.; Yang, C.; Yan, B.; Song, J.; Chen, Z. Driving-behavior-aware stochastic model predictive control for plug-in hybrid electric buses. Appl. Energy 2016, 162, 868–879. [Google Scholar] [CrossRef]
- Martinez-Laserna, E.; Herrera, V.; Gandiaga, I.; Milo, A.; Sarasketa-Zabala, E.; Gaztañaga, H. Li-Ion Battery Lifetime Model’s Influence on the Economic Assessment of a Hybrid Electric Bus’s Operation. WEVJ 2018, 9, 28. [Google Scholar] [CrossRef]
- Wang, X.; He, H.; Sun, F.; Sun, X.; Tang, H. Comparative Study on Different Energy Management Strategies for Plug-In Hybrid Electric Vehicles. Energies 2013, 6, 5656–5675. [Google Scholar] [CrossRef] [Green Version]
- Kim, M.; Jeung, D.; Min, K. Fuel Economy of Series Hybrid Electric Bus by Matching the Gear Ratio of Different Capacity Traction Motors. WEVJ 2012, 5, 254–260. [Google Scholar] [CrossRef] [Green Version]
- Tian, X.; He, R.; Xu, Y. Design of an Energy Management Strategy for a Parallel Hybrid Electric Bus Based on an IDP-ANFIS Scheme. IEEE Access 2018, 6, 23806–23819. [Google Scholar] [CrossRef]
- Zhao, K.; Liang, Z.; Huang, Y.; Wang, H.; Khajepour, A.; Zhen, Y. Research on a Novel Hydraulic/Electric Synergy Bus. Energies 2018, 11, 34. [Google Scholar] [CrossRef]
- Topal, O.; Nakir, İ. Total Cost of Ownership Based Economic Analysis of Diesel, CNG and Electric Bus Concepts for the Public Transport in Istanbul City. Energies 2018, 11, 2369. [Google Scholar] [CrossRef]
- Madanda, R.; Musasizi, P.I.; Asiimwe, A.T.; Matovu, F.; Africa, J.; Tickodri-Togboa, S.S. Model Based Engineering and Realization of the KAYOOLA Electric City Bus Powertrain. WEVJ 2013, 6, 155–164. [Google Scholar] [CrossRef] [Green Version]
- Wu, X.; Wang, T. Optimization of Battery Capacity Decay for Semi-Active Hybrid Energy Storage System Equipped on Electric City Bus. Energies 2017, 10, 792. [Google Scholar] [CrossRef]
- Min, H.; Lai, C.; Yu, Y.; Zhu, T.; Zhang, C. Comparison Study of Two Semi-Active Hybrid Energy Storage Systems for Hybrid Electric Vehicle Applications and Their Experimental Validation. Energies 2017, 10, 279. [Google Scholar] [CrossRef]
- Nájera, J.; Moreno-Torres, P.; Lafoz, M.; de Castro, R.; Arribas, J.R. Approach to Hybrid Energy Storage Systems Dimensioning for Urban Electric Buses Regarding Efficiency and Battery Aging. Energies 2017, 10, 1708. [Google Scholar] [CrossRef]
- Soltani, M.; Ronsmans, J.; Kakihara, S.; Jaguemont, J.; van den Bossche, P.; van Mierlo, J.; Omar, N. Hybrid Battery/Lithium-Ion Capacitor Energy Storage System for a Pure Electric Bus for an Urban Transportation Application. Appl. Sci. 2018, 8, 1176. [Google Scholar] [CrossRef]
- Fang, S.-C.; Ke, B.-R.; Chung, C.-Y. Minimization of Construction Costs for an All Battery-Swapping Electric-Bus Transportation System: Comparison with an All Plug-In System. Energies 2017, 10, 890. [Google Scholar] [CrossRef]
- Li, W.; Li, Y.; Deng, H.; Bao, L. Planning of Electric Public Transport System under Battery Swap Mode. Sustainability 2018, 10, 2528. [Google Scholar] [CrossRef]
- Liu, H.; Wang, C.; Zhao, X.; Guo, C. An Adaptive-Equivalent Consumption Minimum Strategy for an Extended-Range Electric Bus Based on Target Driving Cycle Generation. Energies 2018, 11, 1805. [Google Scholar] [CrossRef]
- Mallon, K.; Assadian, F.; Fu, B. Analysis of On-Board Photovoltaics for a Battery Electric Bus and Their Impact on Battery Lifespan. Energies 2017, 10, 943. [Google Scholar] [CrossRef]
- Aschilean, I.; Varlam, M.; Culcer, M.; Iliescu, M.; Raceanu, M.; Enache, A.; Raboaca, M.; Rasoi, G.; Filote, C. Hybrid Electric Powertrain with Fuel Cells for a Series Vehicle. Energies 2018, 11, 1294. [Google Scholar] [CrossRef]
- Yulianto, A.; Simic, M.; Taylor, D.; Trivailo, P. Modelling of full electric and hybrid electric fuel cells buses. Procedia Comput. Sci. 2017, 112, 1916–1925. [Google Scholar] [CrossRef]
- Wang, W.; Zhang, Z.; Shi, J.; Lin, C.; Gao, Y. Optimization of a Dual-Motor Coupled Powertrain Energy Management Strategy for a Battery Electric Bus Based on Dynamic Programming Method. IEEE Access 2018, 6, 32899–32909. [Google Scholar] [CrossRef]
- Zhao, M.; Shi, J.; Lin, C.; Zhang, J. Application-Oriented Optimal Shift Schedule Extraction for a Dual-Motor Electric Bus with Automated Manual Transmission. Energies 2018, 11, 325. [Google Scholar] [CrossRef]
- Panday, A.; Bansal, H.O. Optimal fuel control of series-parallel input split hybrid electric vehicle using genetic algorithm based control strategy. In Proceedings of the2015 International Conference on Energy Economics and Environment (ICEEE), Greater Noida, India, 27–28 March 2015. [Google Scholar]
- Zhao, G.-Z.; Huang, X.; Peng, X. Adaptive Model Predictive Control Research on Regenerative Braking for Electric Bus Cruising Downhill. J. Adv. Manuf. Syst. 2016, 15, 133–150. [Google Scholar] [CrossRef]
- Halmeaho, T.; Rahkola, P.; Tammi, K.; Pippuri, J.; Pellikka, A.-P.; Manninen, A.; Ruotsalainen, S. Experimental validation of electric bus powertrain model under city driving cycles. IET Electr. Syst. Transp. 2017, 7, 74–83. [Google Scholar] [CrossRef]
- Kivekäs, K.; Lajunen, A.; Vepsäläinen, J.; Tammi, K. City Bus Powertrain Comparison: Driving Cycle Variation and Passenger Load Sensitivity Analysis. Energies 2018, 11, 1755. [Google Scholar] [CrossRef]
- Vepsäläinen, J.; Kivekäs, K.; Otto, K.; Lajunen, A.; Tammi, K. Development and validation of energy demand uncertainty model for electric city buses. Transp. Res. Part D Transp. Environ. 2018, 63, 347–361. [Google Scholar] [CrossRef]
- Yan, M.; Li, M.; He, H.; Peng, J.; Sun, C. Rule-based energy management for dual-source electric buses extracted by wavelet transform. J. Clean. Prod. 2018, 189, 116–127. [Google Scholar] [CrossRef]
- Yu, L.; Kong, D.; Yan, X. A Driving Behavior Planning and Trajectory Generation Method for Autonomous Electric Bus. Future Internet 2018, 10, 51. [Google Scholar] [CrossRef]
- Shen, P.; Zhao, Z.; Li, J.; Zhan, X. Development of a typical driving cycle for an intra-city hybrid electric bus with a fixed route. Transp. Res. Part D Transp. Environ. 2018, 59, 346–360. [Google Scholar] [CrossRef]
- Leou, R.-C.; Hung, J.-J. Optimal Charging Schedule Planning and Economic Analysis for Electric Bus Charging Stations. Energies 2017, 10, 483. [Google Scholar] [CrossRef]
- Bak, D.-B.; Bak, J.-S.; Kim, S.-Y. Strategies for Implementing Public Service Electric Bus Lines by Charging Type in Daegu Metropolitan City, South Korea. Sustainability 2018, 10, 3386. [Google Scholar] [CrossRef]
- Gao, Y.; Guo, S.; Ren, J.; Zhao, Z.; Ehsan, A.; Zheng, Y. An Electric Bus Power Consumption Model and Optimization of Charging Scheduling Concerning Multi-External Factors. Energies 2018, 11, 2060. [Google Scholar] [CrossRef]
- Lajunen, A. Lifecycle costs and charging requirements of electric buses with different charging methods. J. Clean. Prod. 2018, 172, 56–67. [Google Scholar] [CrossRef]
- Rogge, M.; van der Hurk, E.; Larsen, A.; Sauer, D.U. Electric bus fleet size and mix problem with optimization of charging infrastructure. Appl. Energy 2018, 211, 282–295. [Google Scholar] [CrossRef]
- Bi, Z.; Keoleian, G.A.; Ersal, T. Wireless charger deployment for an electric bus network: A multi-objective life cycle optimization. Appl. Energy 2018, 225, 1090–1101. [Google Scholar] [CrossRef]
- Jang, Y.J.; Suh, E.S.; Kim, J.W. System Architecture and Mathematical Models of Electric Transit Bus System Utilizing Wireless Power Transfer Technology. IEEE Syst. J. 2016, 10, 495–506. [Google Scholar] [CrossRef]
- Kotiev, G.O.; Butarovich, D.O.; Kositsyn, B.B. Energy efficient motion control of the electric bus on route. IOP Conf. Ser. Mater. Sci. Eng. 2018, 315, 12014. [Google Scholar] [CrossRef] [Green Version]
- Cho, C.-W.; Lee, H.-S.; Won, J.-P.; Lee, M.-Y. Measurement and Evaluation of Heating Performance of Heat Pump Systems Using Wasted Heat from Electric Devices for an Electric Bus. Energies 2012, 5, 658–669. [Google Scholar] [CrossRef] [Green Version]
- Zhang, Z.; Li, W.; Shi, J.; Chen, J. A Study on Electric Vehicle Heat Pump Systems in Cold Climates. Energies 2016, 9, 881. [Google Scholar] [CrossRef]
- He, H.; Yan, M.; Sun, C.; Peng, J.; Li, M.; Jia, H. Predictive air-conditioner control for electric buses with passenger amount variation forecast. Appl. Energy 2018, 227, 249–261. [Google Scholar] [CrossRef]
- Xiong, X.; Wang, Y.; Zhong, Y. Modeling and analysis in air conditioning control system based on electric bus. In Proceedings of the 2017 IEEE 17th International Conference on Communication Technology (ICCT), Chengdu, China, 27–30 October 2017. [Google Scholar]
- Yan, M.; He, H.; Jia, H.; Li, M.; Xue, X. Model Predictive Control of the Air-conditioning System for Electric Bus. Energy Procedia 2017, 105, 2415–2421. [Google Scholar] [CrossRef]
- Wu, X.; Lv, S.; Chen, J. Determination of the Optimum Heat Transfer Coefficient and Temperature Rise Analysis for a Lithium-Ion Battery under the Conditions of Harbin City Bus Driving Cycles. Energies 2017, 10, 1723. [Google Scholar] [CrossRef]
- Turoń, K.; Czech, P.; Juzek, M. The concept of a walkable city as an alternative form of urban mobility. Sci. J. Sil. Univ. Technol.-Ser. Transp. 2017, 95, 223–230. [Google Scholar] [CrossRef]
- Kurek, A.; Jużyniec, J.; Kielc, B. Analysis of road safety in the city of Sosnowiec in the period 2006–2016. Sci. J. Sil. Univ. Technol.-Ser. Transp. 2018, 100, 69–79. [Google Scholar] [CrossRef]
- Czech, P.; Turon, K.; Barcik, J. Autonomous Vehicles: Basic Issues. Sci. J. Sil. Univ. Technol. Ser. Transp. 2018, 15–22. [Google Scholar] [CrossRef]
- Skrúcaný, T.; Šarkan, B.; Figlus, T.; Synák, F.; Vrábel, J. Measuring of noise emitted by moving vehicles. MATEC Web Conf. 2017, 107, 72. [Google Scholar] [CrossRef] [Green Version]
- Yamamoto, A.; Fukuda, M.; Utsumi, H. Vehicle Management and Travel Data Analysis of E-Bus Adopted in JR Kesennuma Line. WEVJ 2016, 8, 122–130. [Google Scholar] [CrossRef] [Green Version]
- Łebkowski, A. Temperature, Overcharge and Short-Circuit Studies of Batteries used in Electric Vehicles. Przegląd Elektrotechniczny 2017, 1, 69–75. [Google Scholar] [CrossRef]
- Nørregaard, K.; Johnsen, B.; Hedegaard Gravesen, C. Battery degradation in electric buses. 2016. Available online: https://www.trafikstyrelsen.dk/~/media/Dokumenter/06%20Kollektiv%20trafik/Forsogsordningen/2013/Elbusser/Battery%20degradation%20in%20electric%20buses%20-%20final.pdf (accessed on 27 February 2019).
- Łebkowski, A. Steam and Oxyhydrogen Addition Influence on Energy Usage by Range Extender—Battery Electric Vehicles. Energies 2018, 11, 2403. [Google Scholar] [CrossRef]
- Global Carbon Dioxide Emissions Rose Almost 3% in 2018|CBC News. Available online: https://www.cbc.ca/news/technology/carbon-pollution-increase-1.4934096 (accessed on 25 January 2019).
- The Global Fuel Economy Initiative. International Test Cycles for Emissions and Fuel Economy. Available online: https://www.globalfueleconomy.org/transport/gfei/autotool/approaches/information/test_cycles.asp#pg (accessed on 27 January 2019).
- US EPA. Vehicle and Fuel Emissions Ttesting-Dynamometer Drive Schedules. Available online: https://www.epa.gov/vehicle-and-fuel-emissions-testing/dynamometer-drive-schedules (accessed on 27 January 2019).
- DieselNet. Emission Test Cycles. Available online: https://www.dieselnet.com/standards/cycles/index.php (accessed on 27 January 2019).
- European Commission. COMMISSION RECOMMENDATION of 31.5.2017 on the use of fuel consumption and CO2 emission values type-approved and measured in accordance with the World Harmonised Light Vehicles Test Procedure when making information available for consumers pursuant to Directive 1999/94/EC of the European Parliament and of the Council; European Commission: Brussels, Belgium, 2017. [Google Scholar]
- UNECE. World Forum for Harmonization of Vehicle Regulations. Available online: http://www.unece.org/trans/main/wp29/meeting_docs_wp29.html (accessed on 27 January 2019).
- Gis, W.; Kruczyński, S.; Taubert, S.; Wierzejsk, A. Studies of energy use by electric buses in SORT tests. Combust. Engines 2017, 135–138. [Google Scholar] [CrossRef]
- Live CO2 Emissions of Electricity Consumption. Available online: https://www.electricitymap.org/ (accessed on 1 February 2019).
Figure 1.
Drive system configurations in tested electric buses: (a) layout with a large battery pack, (b) battery system with a small bank of supercapacitors, (c) layout with a supercapacitor bank and a small battery pack, (d) layout with a large bank of supercapacitors. BATT—Battery Pack; EM—Electric Motor; PE—Power Electronics; DC/DC—DC/DC Converter; AUX—Auxiliary and On-board Equipment; HS—Heating System; T—Transmission.

Figure 2.
Performance properties of electrochemical cells: NCA—Lithium Nickel Cobalt Aluminum Oxide, NMC—Lithium Nickel Manganese Cobalt Oxide, LFP—Lithium Iron Phosphate, LTO—Lithium Titanate.
Figure 2.
Performance properties of electrochemical cells: NCA—Lithium Nickel Cobalt Aluminum Oxide, NMC—Lithium Nickel Manganese Cobalt Oxide, LFP—Lithium Iron Phosphate, LTO—Lithium Titanate.

Figure 3.
Forces acting on a moving electric drive bus.

Figure 4.
Comparison of parameters registered during the operation of the actual vehicle and a modeled vehicle with the Lithium Iron Phosphate (LFP) energy store: (a) vehicle speeds, (b) power of energy store, and (c) total energy consumption.
Figure 4.
Comparison of parameters registered during the operation of the actual vehicle and a modeled vehicle with the Lithium Iron Phosphate (LFP) energy store: (a) vehicle speeds, (b) power of energy store, and (c) total energy consumption.

Figure 5.
Implementation of the electric bus in OpenModelica.

Figure 6.
Modeling of forces acting on the electric bus.

Figure 7.
Modeling of the thermal conditioning system of the passenger compartment.

Figure 8.
SORT 1 driving cycle.

Figure 9.
SORT 1 results of simulation tests, where: (a) Bus speed during tests (km/h); (b) Voltage and Current on DC-link (V), (A); (c) Motor/Engine Power (kW); (d) Battery & SUPCAP State of Charge (%); (e) Battery & SUPCAP temperature (°C); (f) Instantaneous energy consumption (Wh/km); (g) Total energy usage (kWh).


Figure 10.
SORT 2 driving cycle.

Figure 11.
SORT 2 results of simulation tests, where: (a) Bus speed during tests (km/h); (b) Voltage and Current on DC-link (V), (A); (c) Motor/Engine Power (kW); (d) Battery & SUPCAP State of Charge (%); (e) Battery & SUPCAP temperature (°C); (f) Instantaneous energy consumption (Wh/km); (g) Total energy usage (kWh).


Figure 12.
SORT 3 driving cycle.

Figure 13.
SORT 3 results of simulation tests, where: (a) Bus speed during tests (km/h); (b) Voltage and Current on DC-link (V), (A); (c) Motor/Engine Power (kW); (d) Battery & SUPCAP State of Charge (%); (e) Battery & SUPCAP temperature (°C); (f) Instantaneous energy consumption (Wh/km); (g) Total energy usage (kWh).


Figure 14.
UDDS-HD driving cycle.

Figure 15.
UDDS-HD results of simulation tests, where: (a) Bus speed during tests (km/h); (b) Voltage and Current on DC-link (V), (A); (c) Motor/Engine Power (kW); (d) Battery & SUPCAP State of Charge (%); (e) Battery & SUPCAP temperature (°C); (f) Instantaneous energy consumption (Wh/km); (g) Total energy usage (kWh).


Figure 16.
OCBC driving cycle.

Figure 17.
OCBC results of simulation tests, where: (a) Bus speed during tests (km/h); (b) Voltage and Current on DC-link (V), (A); (c) Motor/Engine Power (kW); (d) Battery & SUPCAP State of Charge (%); (e) Battery & SUPCAP temperature (°C); (f) Instantaneous energy consumption (Wh/km); (g) Total energy usage (kWh).


Figure 18.
MBC driving cycle.

Figure 19.
MBC results of simulation tests, where: (a) Bus speed during tests (km/h); (b) Voltage and Current on DC-link (V), (A); (c) Motor/Engine Power (kW); (d) Battery & SUPCAP State of Charge (%); (e) Battery & SUPCAP temperature (°C); (f) Instantaneous energy consumption (Wh/km); (g) Total energy usage (kWh).


Figure 20.
BCDC driving cycle.

Figure 21.
BCDC results of simulation tests, where: (a) Bus speed during tests (km/h); (b) Voltage and Current on DC-link (V), (A); (c) Motor/Engine Power (kW); (d) Battery & SUPCAP State of Charge (%); (e) Battery & SUPCAP temperature (°C); (f) Instantaneous energy consumption (Wh/km); (g) Total energy usage (kWh).


Figure 22.
Gdynia-Flat route height and speed profiles. Map data from Google Maps.

Figure 23.
Gdynia-Hills route height and speed profiles. Map data from Google Maps.

Figure 24.
Results of simulation tests of powertrain systems on the Gdynia-Flat route on the section of about 100 km, where: (a) Bus speed during tests (km/h); (b) Voltage and Current on DC-link (V), (A); (c) Motor/Engine Power (kW); (d) Battery & SUPCAP State of Charge (%); (e) Battery & SUPCAP temperature (°C); (f) Instantaneous energy consumption (Wh/km); (g) Total energy usage (kWh).


Figure 25.
Results of simulation tests of powertrain systems on the Gdynia-Hills route on the section of about 100 km, where: (a) Bus speed during tests (km/h); (b) Voltage and Current on DC-link (V), (A); (c) Motor/Engine Power (kW); (d) Battery & SUPCAP State of Charge (%); (e) Battery & SUPCAP temperature (°C); (f) Instantaneous energy consumption (Wh/km); (g) Total energy usage (kWh).


Figure 26.
Results of simulation tests for the Gdynia-Flat route during changes of the number of passengers.
Figure 26.
Results of simulation tests for the Gdynia-Flat route during changes of the number of passengers.

Figure 27.
Simulation results of energy consumption by an electric bus for the Gdynia-Flat route during changes in ambient temperature.
Figure 27.
Simulation results of energy consumption by an electric bus for the Gdynia-Flat route during changes in ambient temperature.

Figure 28.
Results of simulation tests for the Gdynia-Flat route during changes the ambient temperature.
Figure 28.
Results of simulation tests for the Gdynia-Flat route during changes the ambient temperature.

Figure 29.
Electricity emissions intensity grams CO2e per kWh (g/CO2eq/kWh) snapshot from electricity. Map taken at 01.02.2019 12:00 UTC [65].
Figure 29.
Electricity emissions intensity grams CO2e per kWh (g/CO2eq/kWh) snapshot from electricity. Map taken at 01.02.2019 12:00 UTC [65].


Table 1.
Parameters of components used in the drive systems shown in Figure 1.
Table 1.
Parameters of components used in the drive systems shown in Figure 1.
| Parameter | Unit | BEV (LFP) | BEV (LTO) | BEV (LFP) SUPCAP | SUPCAP BEV (LFP) | SUPCAP | Diesel |
|---|---|---|---|---|---|---|---|
| Body mass | (kg) | 9800 | 9800 | 9800 | 9800 | 9800 | 9800 |
| Motor mass | (kg) | 300 | 300 | 300 | 300 | 300 | 1200 |
| Inverter mass | (kg) | 40 | 40 | 40 | 40 | 40 | - |
| Motor power | (kW) | 250 | 250 | 250 | 250 | 250 | 270 |
| Battery mass | (kg) | 1241 | 1625 | 1241 | 336 | - | - |
| Battery energy | (kWh) | 120 | 120 | 120 | 38 | - | - |
| SUPCAP mass | (kg) | - | - | 275 (5 pcs.) | 1100 (20 pcs.) | 1 650 (30 pcs.) | - |
| SUPCAP energy | (kWh) | - | - | 0.7 | 2.9 | 4.3 | - |
| Power electronics mass | (kg) | 30 | 30 | 30 | 30 | 30 | - |
| Electrical switching equip | (kg) | 50 | 50 | 50 | 50 | 50 | - |
| SUPCAP Inverter | (kg) | - | - | 45 | 45 | 45 | - |
| Gearbox | (kg) | - | - | - | - | - | 400 |
| Fuel tank | (kg) | - | - | - | - | - | 350 |
| Powertrain total mass | (kg) | 1661 | 2045 | 1981 | 1901 | 2115 | 850 |
| Vehicle total mass | (kg) | 11,461 | 11,845 | 11,781 | 11,701 | 11,915 | 11,750 |
| Passengers mass | (kg) | 5590 | 5590 | 5590 | 5590 | 5590 | 5590 |
| Fully loaded vehicle mass | (kg) | 17,251 | 17,635 | 17,571 | 17,491 | 17,705 | 17,540 |
| GVWR | (kg) | 18,000 | 18,000 | 18,000 | 18,000 | 18,000 | 18,000 |
The abbreviations used in the table describe energy storage consisting of: BEV (LFP)—LFP cell packets; BEV (LTO)—LTO cell packets; BEV (LFP)/SUPCAP—large packets of LFP cells and a small amount of supercapacitors; SUPCAP/BEV (LFP)—a large packet of supercapacitors and a small number of LFP cells; SUPCAP—supercapacitors package; Diesel—drive system with a diesel engine.
Table 2.
Average energy consumption for a given test cycle and configuration of electric drive system.
Table 2.
Average energy consumption for a given test cycle and configuration of electric drive system.
| Test Cycle | Unit | BEV (LTO) | BEV (LFP) | BEV (LFP) SUPCAP | SUPCAP BEV (LFP) | SUPCAP | DIESEL |
|---|---|---|---|---|---|---|---|
| SORT 1 | Wh/km | 967.8 | 990.5 | 1016.2 | 1239.9 | 1239.9 | 5793.2 |
| SORT 2 | Wh/km | 841.2 | 870.6 | 893.3 | 1030.6 | 1041.5 | 4703.3 |
| SORT 3 | Wh/km | 787.2 | 816.8 | 839.8 | 935.3 | 945.9 | 4297.2 |
| UDDS-HD | Wh/km | 924.6 | 949.4 | 972.6 | 1038.2 | 1246.8 | 4067.1 |
| OCBC | Wh/km | 982.7 | 997.5 | 1037.4 | 1083.4 | 1106.3 | 5205.3 |
| MBC | Wh/km | 1300.1 | 1315.2 | 1373.2 | 1495.2 | 1531.1 | 7127.3 |
| BCDC | Wh/km | 1020.6 | 1010.2 | 1138.1 | 1289.0 | 1297.2 | 4869.9 |
| Gdynia-Flat | Wh/km | 788.2 | 816.1 | 838.5 | 988.2 | 988.2 | 3730.4 |
| Gdynia-Hills | Wh/km | 855.5 | 913.5 | 941.3 | 1087.6 | 1091.3 | 3967.2 |
| Average | Wh/km | 940.9 | 964.4 | 1005.6 | 1131.9 | 1165.4 | 4862.3 |
Table 3.
Energy consumption of the electric drive system depending on the changes in the bus loading status.
Table 3.
Energy consumption of the electric drive system depending on the changes in the bus loading status.
| Passenger # | Total Energy (kWh) | Energy Consumption (Wh/km) | Range (km) | SOC at End (%) | Start Temperature (°C) | End Temperature (°C) |
|---|---|---|---|---|---|---|
| 20 | 15.18 | 624.54 | 192.11 | 84.64 | 18 | 24.23 |
| 40 | 16.57 | 681.80 | 175.98 | 83.47 | 18 | 24.86 |
| 60 | 18.05 | 742.91 | 161.53 | 82.22 | 18 | 25.48 |
| 80 | 19.66 | 808.99 | 148.31 | 80.87 | 18 | 26.13 |
| 90 | 20.49 | 842.85 | 142.35 | 80.18 | 18 | 26.46 |
Table 4.
Energy consumption by an electric bus with a resistive thermal conditioning system depending on changes in ambient temperature.
Table 4.
Energy consumption by an electric bus with a resistive thermal conditioning system depending on changes in ambient temperature.
| Ambient Temperature (°C) | Total Energy (kWh) | Energy Consumption (Wh/km) | Range (km) | SOC at End (%) | Start Temperature (°C) | End Temperature (°C) |
|---|---|---|---|---|---|---|
| 30 | 20.74 | 853.21 | 140.63 | 80.05 | 30 | 37.27 |
| 20 | 19.66 | 808.99 | 148.31 | 80.88 | 20 | 28.07 |
| 0 | 32.60 | 1341.41 | 89.45 | 70.16 | 0 | 13.25 |
| −5 | 35.85 | 1475.22 | 81.33 | 67.34 | −5 | 11,68 |
| −10 | 39.10 | 1608.67 | 74.58 | 64.50 | −10 | 10.61 |
Table 5.
Energy consumption of an electric bus with a heat pump depending on changes in ambient temperature.
Table 5.
Energy consumption of an electric bus with a heat pump depending on changes in ambient temperature.
| Ambient Temperature (°C) | Total Energy (kWh) | Energy Consumption (Wh/km) | Range (km) | SOC at End (%) | Start Temperature (°C) | End Temperature (°C) |
|---|---|---|---|---|---|---|
| 30 | 20.74 | 853.21 | 140.63 | 80.05 | 30 | 37.27 |
| 20 | 19.66 | 808.99 | 148.31 | 80.88 | 20 | 28.07 |
| 0 | 21.82 | 897.68 | 133.66 | 78.90 | 0 | 12.34 |
| −5 | 22.36 | 919.98 | 130.42 | 78.27 | −5 | 10.69 |
| −10 | 22.90 | 942.21 | 127.34 | 77.62 | −10 | 9.47 |
Table 6.
Potential possible CO2 emission amounts generated by a bus with each drive system configuration.
Table 6.
Potential possible CO2 emission amounts generated by a bus with each drive system configuration.
| Test Cycle | Unit | BEV (LTO) | BEV (LFP) | BEV (LFP) SUPCAP | SUPCAP BEV (LFP) | SUPCAP | DIESEL |
|---|---|---|---|---|---|---|---|
| SORT 1 | kg/CO2eq/kWh | 1.8 | 1.8 | 1.8 | 2.3 | 2.3 | 4.0 |
| SORT 2 | kg/CO2eq/kWh | 2.7 | 2.8 | 2.9 | 3.3 | 3.4 | 5.7 |
| SORT 3 | kg/CO2eq/kWh | 4.0 | 4.1 | 4.3 | 4.7 | 4.8 | 8.2 |
| UDDS-HD | kg/CO2eq/kWh | 11.6 | 11.9 | 12.2 | 13.0 | 4.3 | 19.1 |
| OCBC | kg/CO2eq/kWh | 7.2 | 7.3 | 7.6 | 8.0 | 8.1 | 14.4 |
| MBC | kg/CO2eq/kWh | 6.0 | 6.1 | 6.4 | 6.9 | 7.1 | 12.5 |
| BCDC | kg/CO2eq/kWh | 7.7 | 7.6 | 8.6 | 9.7 | 9.8 | 13.9 |
| Gdynia-Flat | kg/CO2eq/kWh | 54.7 | 56.7 | 58.2 | 68.6 | 68.6 | 97.6 |
| Gdynia-Hills | kg/CO2eq/kWh | 59.6 | 63.6 | 65.6 | 75.8 | 76.0 | 104.1 |
© 2019 by the author. Licensee MDPI, Basel, Switzerland. This article is an open access article distributed under the terms and conditions of the Creative Commons Attribution (CC BY) license (http://creativecommons.org/licenses/by/4.0/).
Share and Cite
MDPI and ACS Style
Łebkowski, A. Studies of Energy Consumption by a City Bus Powered by a Hybrid Energy Storage System in Variable Road Conditions. Energies 2019, 12, 951. https://0-doi-org.brum.beds.ac.uk/10.3390/en12050951
AMA Style
Łebkowski A. Studies of Energy Consumption by a City Bus Powered by a Hybrid Energy Storage System in Variable Road Conditions. Energies. 2019; 12(5):951. https://0-doi-org.brum.beds.ac.uk/10.3390/en12050951
Chicago/Turabian StyleŁebkowski, Andrzej. 2019. "Studies of Energy Consumption by a City Bus Powered by a Hybrid Energy Storage System in Variable Road Conditions" Energies 12, no. 5: 951. https://0-doi-org.brum.beds.ac.uk/10.3390/en12050951
Note that from the first issue of 2016, this journal uses article numbers instead of page numbers. See further details here.